By Joe Bastardi, Weatherbell Analytics
When the PDO turned cold, most of the meteorological and climate community understood that the pattern was turning very similar the last time of the PDO reversal, the 1950s, and it was a matter of time before the global temperatures, which have leveled off, would start falling in the same herby jerky fashion they had risen when the PDO turned warm at the end of the 1970s. I am not going to rehash the sordid details of how the AGW crowd simply ignores the major drivers of a cyclical nature. We all know that. Nor am I going to question them as to why they believe a trace gas like CO2 (needed for life on the planet) with a specific gravity of 1.5 as compared to the atmospheres 1.0, was going to mix with air in a way to affect the earth’s temperatures. Instead I am going to drive home points I have been making since 2007 and are now dramatically validating.
The La Ninas of 2008-09 and now this one had rapid mid level temperature drops that followed their onset and this years was nothing short of the most dramatic mid tropospheric drop since the start of the millennium. It is much more plausible to believe that rapid cooling in the mid levels would have an effect at leading to extremes, rather than what the warmingistas claim, which of course is anything that happens. In any case, one very interesting level that cooled to record cold levels was 400 mb, the very levels that the so called trapping hot spots were going to show up because of CO2…again a neat trick since somehow CO2 was going to defy the laws of Gravity, since, as mentioned above, its specific gravity is higher than the atmosphere (of course even if it was, it a) has not been proven to cause warming and b) man’s contribution is so tiny as to render it a non item anyway in climate considerations.
However first came the flip in the PDO, seen nicely here on the Multivariate Enso Index chart, which clearly illustrates the colder Pacific when the earth was colder, the start of the warming period coinciding with the satellite era, and now.

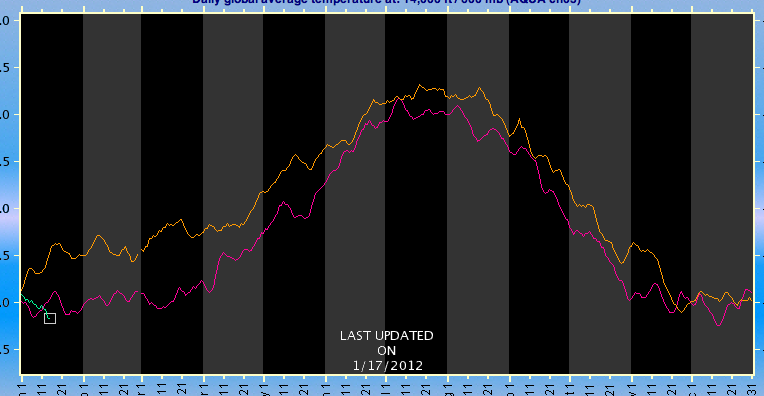
Now from the AMSU site, the amazing one year drop in temperature, the orange tan line being after the El Nino of 2009/10, the purplish line this past year and one can see the green this year, we are near record cold levels again.

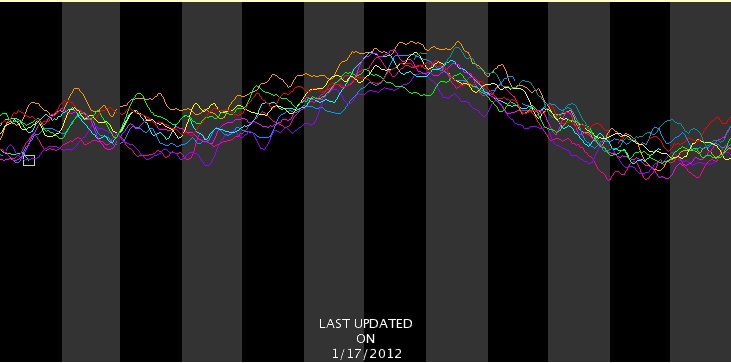
600 mb (14,000 feet) (enlarged)
And oh my my, the trapping hot spot itself.. 400mb or 25,000 feet… coldest in the entore decade

But the 2 meter temperatures, being in the boundary layer, do not respond as fast as the ocean, or a transparent atmosphere above
Nevertheless three downturns in a jagged fashion started predictably after the last El Nino now falling again in fits and spurts through December.
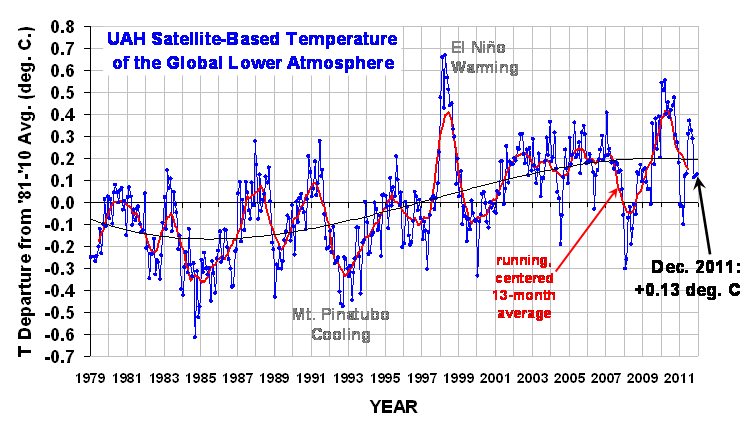
From Dr Roy Spencer’s site:

(enlarged)
In May, I forecasted the global temperatures to fall to -0.15C in one of the months – Jan, Feb or Mar this year, and perhaps as low as levels we saw in the 2008 La Nina. A rapid free fall has begun. Dr. Ryan Maue at his site (http://policlimate.com/weather/) maintains a plethora of useful forecast information including GFS global temp projections over the next 16 days.
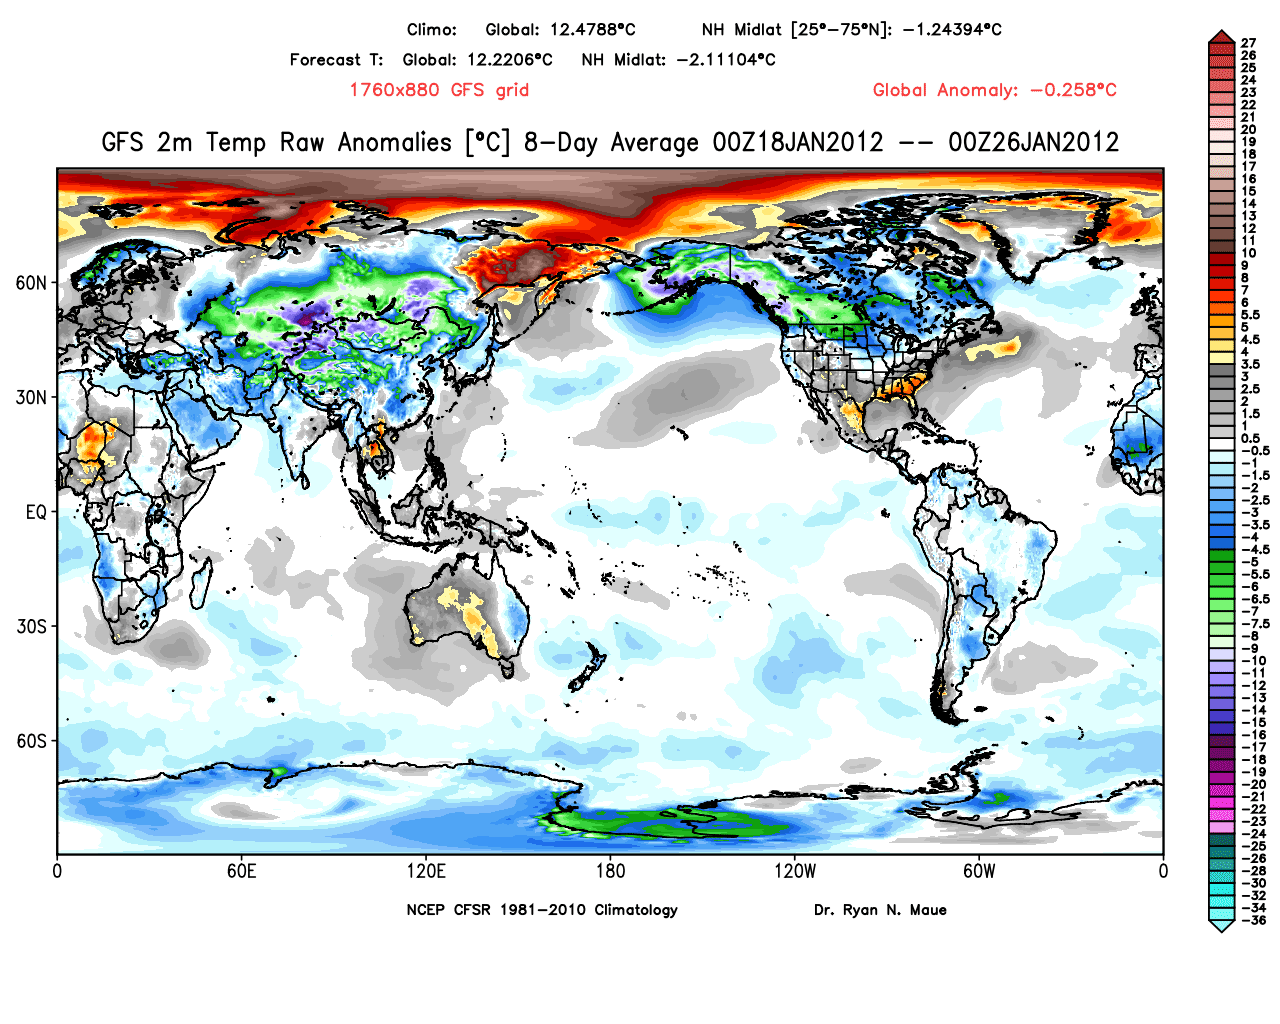
They have been routinely reading greater than 0.2 C below normal and I suspect the Jan reading will plummet quite a bit from December with February even lower. An example of this can be seen with these two charts off Ryan’s site,

-0.258 C globally for 2 meters. (enlarged)

Day 8.5-16 a whopping -0.352 C (enlarged)
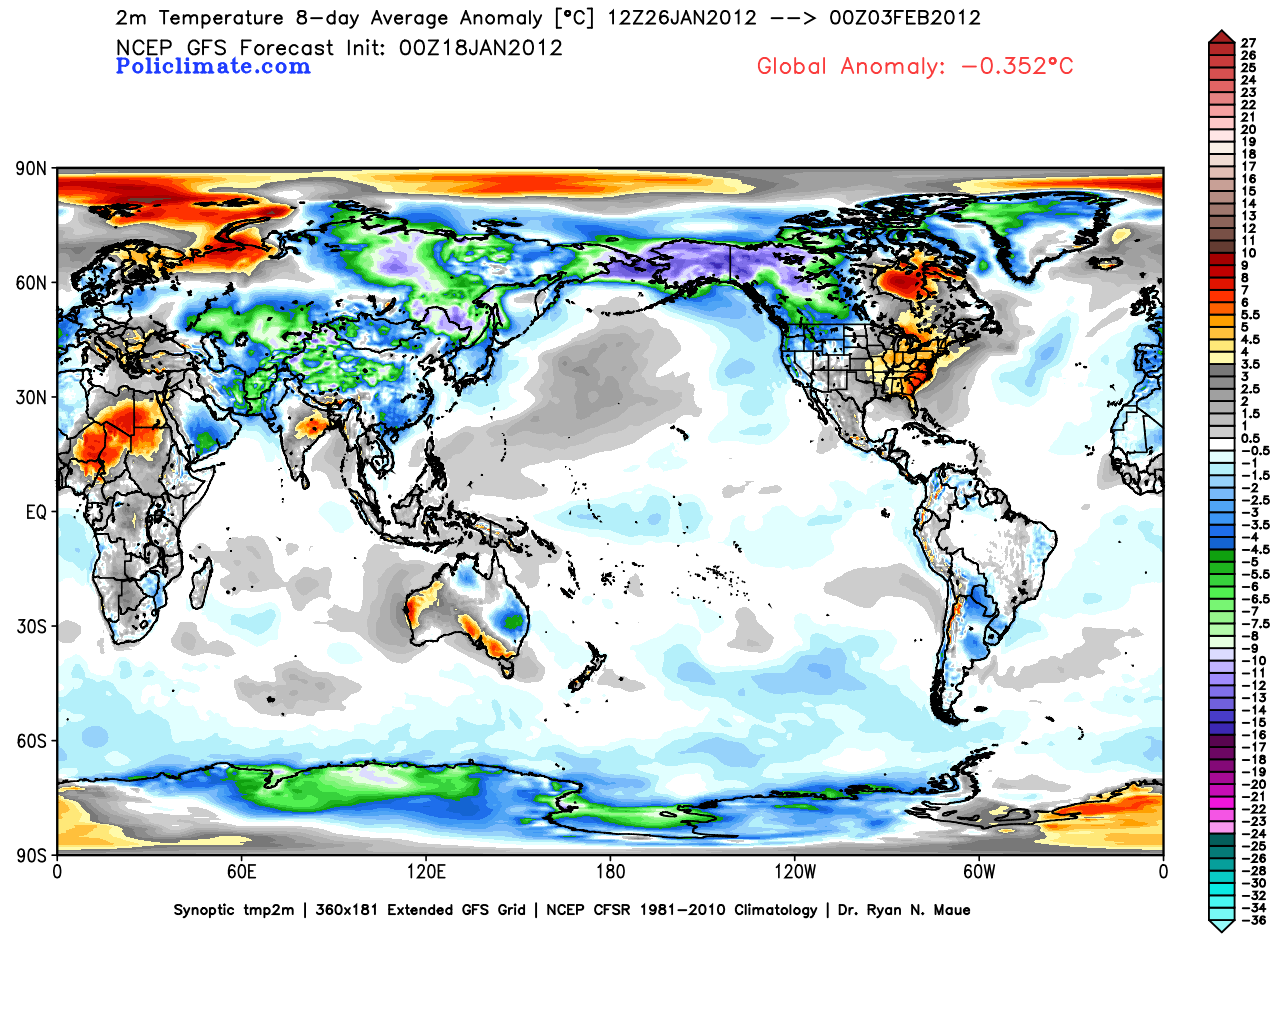
The reason the arctic looks warm is that it has been stormy, and when it’s windy the air is well mixed and so the temperatures are not as low as if it’s calm, but it’s still frigid. Notice in the second map, that the arctic cools because the arctic oscillation is starting to go negative, leading to higher pressures and lighter winds. But the most astounding aspect of this is the northern hemisphere mid latitude temperatures, at -2.1 C.
Currently, with gas so high because we are being handcuffed by an administration that won’t drill (if gas was a 1.50 lower, it would be worth a half trillion dollars to the economy) and an EPA that is causing untold economic damage (I would conservatively etiolate a half trillion dollars, from jobs lost to burdensome regulations) along with a 100 billion dollar subsidy to fight global warming world wide, it is costing each ACTUAL TAX PAYER close to 7000 dollars (1.1 trillion divided by 150 million tax payers).
One has to wonder, how even the most dogmatic of them don’t look at the actual facts, how they can continue to carry on their denial while the results of such things handcuff the American economy and cause untold misery for many as our wealth is not only redistributed, but dwindles. One can only conclude this is being done on purpose, and with purpose.
See PDF with enlarged images.
UPDATE: Bob Tisdale disagrees with portions of this analysis and has an essay here.
NASA still losing it
http://earthobservatory.nasa.gov/IOTD/view.php?id=76975
Ralph says (January 19, 2012 at 3:34 pm)
Absolutely. Mountaineers would suffocate.
90% is above 900m. 50% is above 5500m. 10% is above 17000m.
The shuttle Challenger disintegrated on re-entry at 20000m (20km or 13 miles) due to heat from air friction entering a hole in it’s heat-resistant foam. At this height it’s 0.06 bar.
…Or not. There is no sufficient argument from first principles which excludes all of these phenomena from being perfectly natural variations. The inability of models to deliver adequate hindcasts suggests that they lack the perfection necessary to compel us to run around screaming that the sky is falling and cripple our economies shoveling money down “The Bore Hole” of CAGW.
Joe, you’ve always had a knack for the obvious, the facts! Love your work.
Best,
J.
“heat escaping” should read “infrared radiation” in my previous post.
“Joe Bastardi says:
January 19, 2012 at 9:28 am
You folks that are coming at me about co2 sg, apparently dont understand that simply put, it does not mix well with air. There was just an article about that here on WUWT.”
Great article, but sorry, I have to disagree with you here but agree with all others who have pointed this out.
It is a common misconception that buoyancy applies to gases as it does to liquids, however that is not the case. If we take a helium filled balloon in a room, it would rise to the top, however a CO2 filled balloon would go to the bottom. However if we poke a hole in each balloon, the individual molecules spread out very evenly. And in the atmosphere outside, the distribution of all gas molecules with the exception of water vapor, is very consistent. If all heavier molecules would sink to the bottom, then we would never have very heavy chlorofluorocarbons in the stratosphere. Helium atoms do escape from our atmosphere. However it is not due to buoyancy. You could have a CO2 molecule and a helium atom in the same place high in the atmosphere at the same temperature. Being the same temperature means the translational kinetic energy is the same. Kinetic energy is calculated by the formula E = 1/2mv2. Since the helium atom is much lighter than the CO2 molecule, its velocity at the same temperature is much higher so it can reach escape velocity and thereby leave Earth. By contrast, Jupiter has a larger gravitational field and a lower temperature than Earth, so it can hold on to its hydrogen and helium.
As far as the article on WUWT that you are referring to, if it is the one I am thinking of, then it showed that the CO2 varied between 360 and 390 ppm at different places on Earth due to where CO2 is produced and where it is used up and how long it takes to reach equilibrium throughout the atmosphere. But this lumpiness was NOT due to altitude.
Werner Brozek (retired physics teacher)
Thanks for your article Joe, your assessment of the importance of the PDO is astute and accurate. I see that as soon as the PDO is mentioned Tisdale chimes in attempting to discredit the PDO or authors associated with it (at the base of your post). Tisdale was recently quoted saying ” the PDO is an after effect of ENSO” but when pushed has failed to provide solid evidence. In fact during 2011 we see the typical warm water in the Pacific northwest associated with a cool PDO driving the double dip La Nina. This is an important observation.
Keep up the good work, the thrust of your statements ring true.
Ammonite says:
January 19, 2012 at 3:52 pm
GregO says: January 19, 2012 at 6:30 am
Ammonite,
Thanks for the reference – I just got in and I’ll give it a read later
JP says: “Joe Bastardi does have a tendency of getting overly excited at times. But Bob Tisdale’s critiques aside, Bastardi’s points should be listened too. A shift in the PDO represents a long term (30-40 years) shift in global temperatures and weather patterns.”
JP, people give too much credit to the PDO. You may think this is nit picking, but the negative PDO simply means that ENSO has shifted and/or that North Pacific Sea Level Pressure has shifted. The PDO only represents the spatial pattern of North Pacific SST (east vs west & central). You can raise and lower the North Pacific sea surface temperature, but if spatial pattern in the North Pacific remains the same, the PDO remains constant.
Joe, if you are saying that there is a large variation of CO2 concentration as a function of altitude, that is simply wrong empirically. It’s several ppm or so at most. If you are saying that well-mixed gases of different molecular weights will spontaneously separate themselves in a 1g gravitational field, that is also wrong. Pure gases such as argon or carbon dioxde that are denser than air can be made to puddle in low spots for a short while, but if the low spot is open to the atmosphere, it never lasts. Diffusion and convection mix everything.
Geoff Sharp says: “Tisdale was recently quoted saying ” the PDO is an after effect of ENSO” but when pushed has failed to provide solid evidence.”
THAT IS NOTHING LESS THAN A LIE.
The fact that you, Geoff, cannot grasp why the PDO is an aftereffect of ENSO reflects on your misunderstanding of the PDO and ENSO.
You continued, “In fact during 2011 we see the typical warm water in the Pacific northwest associated with a cool PDO driving the double dip La Nina. This is an important observation.”
It’s a useless observation because the warming of the Kuroshio-Oyashion Extension is not limited to double-dip La Nina events. It is a response to La Nina events in general.
Smokey says:
January 19, 2012 at 3:08 pm
////////////////////
Further to your point, leaving aside the moral issues as to whether it is right to spend lots of money on defence, the fact is that it provides employment and real jobs for many many people and it is a signifcant source of foreign revenue earnings. All of which benefit the economy.
Spending on climate mitigation is the opposite. No real jobs, the exportation of industries abroad and a source of foreign expenditure all of which depress the economy.
Ammonite wrote:
“Both the instrumental and thermometer records show a rise of ~0.16C/decade since satellite records began. The troposphere is warming, the stratosphere cooling, night-time temperatures are rising faster than day-time temperatures – all signatures of warming due to rising GHG concentration. Satellite measurement of heat escaping in the CO2 absorption bands show decline consistent with theory. In short, AGW is directly supported by measurement.”
As always the devil is in the details… The lower stratosphere has not really cooled since circa 1995. The 15 year trend is essentially flat. I suppose you could argue that a particular point of view has been vindicated by the fact that the longer term 30 year trend is for cooling. In the same sense that you could argue that the long term trend for the troposphere remains one of warming…
http://www.ssmi.com/msu/msu_data_description.html#msu_amsu_time_series
I am thinking this will come soon
Stop breathing and farting.
Richard Verney – from a jobs point of view renewables create many more jobs per unit of energy than fossil fuel. This is merely the flip side of the off-repeated “renewables are too expensive”
Whether they help, harm or have no effect on climate – renewable energy programs create more jobs per unit of produced energy than ANY energy source.
Ferdinand:
The real response of the carbon cycle to temperature over the past 800,000 years is about 8 ppmv/°C
That might be true long term, but you are looking at data that is very highly smoothed (just by the nature of how it was taken). The rate I get short term is as high as 8.3 ppmv/°C/year (!) . This was done by looking at CO2 only during the el nino of 1998. dCO2/dt rate responds extremely fast to temperature, but temperature peaks and valleys don’t last long, so you don’t see much in an integrated total. The response to equilibrium may be as you describe, but without a doubt, the change in flow rate from a small temperature change is truly staggering. At least it was to me… The atmosphere responded instantly. Another corollary from that analysis is that temperature changes alone could, in fact, account for all of the changes in total CO2 concentration, if the temperature record were to be trusted. I’m not saying it DID, just that the rates indicate it COULD. Easily. With a lot of headroom.
The rate of transfer that is calculated by seasonal effects (that results in a back of the envelope time constant of 7 years), is the MINIMUM velocity that shows up in total. i.e, the fact that we can calculate such a rate indicates that the net of inflows and outflows cannot change at less than this rate. However, this, in itself, is no reason to assume that the rates in each direction are not MUCH higher. We only know the length of the difference in the size of the vectors. Based on the reaction to temperature, I suspect the two vector lengths we are subtracting are much larger than the difference would indicate. The flows in and out are enormous. The sensitivity of CO2 to temperature is enormous. Sensitivity the other way around remains to be seen, but is clearly much lower than the Cause would have you believe.
Actually Thoughtful:
Whether they help, harm or have no effect on climate – renewable energy programs create more jobs per unit of produced energy than ANY energy source.
Good observation. And precisely why it should be avoided. Breaking windows also creates jobs, and so does building a superhighway using concrete delivered in hand-carried teaspoons. But these jobs destroy wealth because they produce a product in a way that is less productive than the next best alternative. (less productive than any alternative, really). Everyone will have jobs until no one has any wealth left and the system collapses. And the cost of the product skyrockets. It’s a form of welfare created for the purpose of taking money from poor people and giving it to rich people, but it sure sounds like a good idea – to the rich people. Sounds like a recipe for a presidential campaign, about 4 years ago – a recipe for disaster.
“There is nothing more worthless than doing well, that which should not be done at all”
While there is evidence the PDO and ENSO are connected there is insufficient evidence to say that the PDO index is an after effect of ENSO.
Basil Copeland eloquently displays this in detail in a guest post here in 2009.
http://wattsupwiththat.com/2009/05/12/pdo-enso-aleutian-low-or-some-of-each/
Basil does some fine analysis and backs up his observation with a paper from Miller (2004)
http://horizon.ucsd.edu/miller/download/jgofs/JO_60-1-11.pdf
The general outcome is, the PDO index has other areas of influence outside of ENSO and is responsible for climate shift regimes. I am in full agreement with Basils statements and direction.
An excerpt from this discussion from Tisdale:
Note how that “residual” opposes the PDO. This means, when the PDO is positive, the North Pacific SST anomalies are less than the global temperature anomalies, which, in turn, means that the North Pacific is subtracting from the global dataset, or cooling, not heating. And if the PDO is negative, the SST anomalies for that region are above global temperature anomalies, so the North Pacific is adding to the global temperature anomaly during those periods.
Why then do global temperatures tend to rise when the PDO is positive, if it’s not caused by the SST anomalies of the North Pacific? The SST anomalies of the Tropical Pacific are in synch with the PDO. Refer to Figure 9 in that post.
http://i41.tinypic.com/n14010.jpg
And what dictates SST anomalies in the Tropical Pacific? ENSO, not the PDO.
Recall that in the other paper I linked (the paper that first calculated the PDO), Zhang et al noted that the PDO lagged ENSO by a season (3 to 4 months). It’s tough for the PDO to control ENSO if ENSO preceeds it.
There are several problems with the response, Tisdale is incorrectly associating northern Pacific SST’s with global temperatures, more or less saying the SST’s in this area are in reverse to the temperature trends…so the PDO cannot have an influence on climate. But we know that for the PDO to be in its cool phase the north Pacific (in particular the north west Pacific) is generally experiencing warm SST’s. This shift to a warm north west Pacific is crucial to the cooling of the globe as we experience deeper and more frequent La Nina events. The cool PDO also includes a wind factor brought about by the inclusion of SLP. What Tisdale is missing is that the warm north western Pacific and the prevailing winds that come with a cool PDO can further induce La Nina action. The PDO is capable of driving ENSO.
This was observed in the back to back La Nina last year where we also saw the PDO index lead the ENSO index (which is not that unusual).
While science agrees that the north Pacific SST’s have a reasonable component of NON ENSO variability there is no way we can say the PDO is an after effect of ENSO.
Michael D Smith – your logic is mostly valid (FDRs CCC being one counter-example) – however, you have the wrong energy source. It is fossil fuels, coal in particular, that create negative wealth by robbing the ecosystem of its ability to give humans our cushy existence on this planet.
As a species, we know this. Some ignorant or bad actors are trying to paint white as black and black as white – the result being renewable energy is criticized.
All you have to do is price in the damage CO2 and its equivalents do to the cost of energy and renewables become the least costly immediately.
The fact that one creates jobs in the process is gravy.
Or turn it around – renewables create jobs (and save money) – the fact that it makes the earth a high-quality provider for future generations is gravy.
Either way, renewables are objectively a good thing.
Actually Thoughtful,
Wow. Econ is certainly not your area of expertise! I suggest a few weeks reading Bastiat.
Smokey – thanks for the laugh. Think about what I have posted. You will figure it out.
Joe Bastardi says:January 19, 2012 at 9:28 am………………
While people get side tracked by CO2 mixing, I think your main point is going unchallenged. PDO.
Some quick background on CO2 mixing here :
A graphic from NASA AIRS satellite showing in fact a 17 PPM variability in mid-tropospheric CO2.
http://wattsupwiththat.files.wordpress.com/2009/03/nasa_airs_co2_july03.jpg
http://wattsupwiththat.com/2009/03/24/study-hemispheric-co2-timing-suggests-that-annual-increases-may-be-coming-from-a-global-or-equatorial-source/
More reading here:
http://wattsupwiththat.com/2008/07/29/co2-well-mixed-or-mixed-signals/
http://wattsupwiththat.com/2008/07/31/a-encouraging-response-on-satellite-co2-measurement-from-the-airs-team/
http://wattsupwiththat.com/2008/07/29/putting-on-airs/
I am amazed at the endless argument over CO2 while purposefully ignoring the 800 pound GHG Gorilla in the room, Water Vapor. The King Kong of Climate Modulating.
A quote from NASA:
“The small fraction of the approximately 5% of water molecules above 500hpa altitude produce about 50% of the greenhouse effect of the atmosphere. Water vapor is the most effective greenhouse gas in our atmosphere and it’s effect increases with altitudes where the air is significantly colder than the ground.”
The crazy part , the ironic part, the counter intuitive part is that this GHG, Water Vapor, cools the planet.
Kudos to Anthony and Company for maintaining such a great reference archive.
P.S. Mods, could you show the image from AIRS as a graphic in this post?
Ammonite says:
January 19, 2012 at 3:52 pm
OK I read the Knutti and Hegerl (K & H) paper. I am unmoved.
The paper was published in 2008 and here in 2012 RSS reads -.01. K & H is littered with unsupported assumptions ex: “The Earth’s climate is changing rapidly as a result of anthropogenic carbon emissions, and damaging impacts are expected to increase with warming.”
First sentence.
An obvious first unstated assumption is that there is a natural normal earth temperature. What is that? How was it arrived at? How is it given truth that Mankind is somehow in control of fouling the natural earth temperature? How do we know it’s Mankind’s addition of CO2 that heats the earth past its normal unperturbed temperature? What if it is entirely unknown why climate cools and warms?
That CO2 has some role in climate is an entirely reasonable conjecture. But nothing more than a reasonable conjecture. This linked paper takes it as given truth that there is a natural temperature of the earth, and mankind is fouling it with his CO2 pollution.
Next comes the unsupported assumption that said heating, admittedly quite weak heating at that, is all bad. Says who? How is mild weather a catastrophe or even a problem at all? Night-time temperatures a bit warmer is a problem?
Anyhow, the paper is dated rubbish. Try this: http://www.appinsys.com/GlobalWarming/SixtyYearCycle.htm
I believe the point of this post is to pose the question: Where’s the heat? What are the 2012 measurements and what is the state of empirical evidence for planetary warming? Look at the data for January 2012 with clear, open minded clarity: -.01. Where’s the heat? No heat. Where’s the problem? No problem.
Mr. Bastardi, “Currently, with gas so high because we are being handcuffed by an administration that won’t drill…”
Oil production has increased in the USA since the Obama administration took office. More oil is being drilled. Or were you being literal and believe it is up to Presidential administrations to do the actual drilling?
Actually Thoughtful
All you have to do is price in the damage CO2 and its equivalents do to the cost of energy and renewables become the least costly immediately.
CO2 causes damage? At the levels we’re talking about, when the CO2 level now is close to plant starvation level compared to when plants evolved? I guess I missed that memo. Do you have evidence of this? Did you ask a plant? What sort of damage are we talking about?
It would have to do a truly amazing amount of damage to offset the cost of renewables, yet I can’t think of a single example of damage. Do you have ONE?