By Joe Bastardi, Weatherbell Analytics
When the PDO turned cold, most of the meteorological and climate community understood that the pattern was turning very similar the last time of the PDO reversal, the 1950s, and it was a matter of time before the global temperatures, which have leveled off, would start falling in the same herby jerky fashion they had risen when the PDO turned warm at the end of the 1970s. I am not going to rehash the sordid details of how the AGW crowd simply ignores the major drivers of a cyclical nature. We all know that. Nor am I going to question them as to why they believe a trace gas like CO2 (needed for life on the planet) with a specific gravity of 1.5 as compared to the atmospheres 1.0, was going to mix with air in a way to affect the earth’s temperatures. Instead I am going to drive home points I have been making since 2007 and are now dramatically validating.
The La Ninas of 2008-09 and now this one had rapid mid level temperature drops that followed their onset and this years was nothing short of the most dramatic mid tropospheric drop since the start of the millennium. It is much more plausible to believe that rapid cooling in the mid levels would have an effect at leading to extremes, rather than what the warmingistas claim, which of course is anything that happens. In any case, one very interesting level that cooled to record cold levels was 400 mb, the very levels that the so called trapping hot spots were going to show up because of CO2…again a neat trick since somehow CO2 was going to defy the laws of Gravity, since, as mentioned above, its specific gravity is higher than the atmosphere (of course even if it was, it a) has not been proven to cause warming and b) man’s contribution is so tiny as to render it a non item anyway in climate considerations.
However first came the flip in the PDO, seen nicely here on the Multivariate Enso Index chart, which clearly illustrates the colder Pacific when the earth was colder, the start of the warming period coinciding with the satellite era, and now.

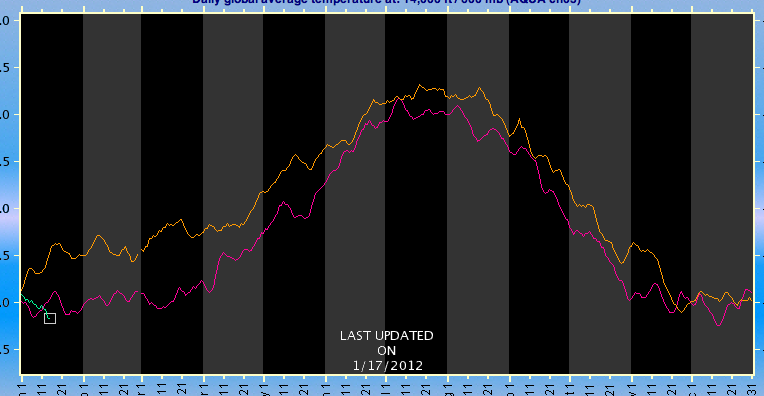
Now from the AMSU site, the amazing one year drop in temperature, the orange tan line being after the El Nino of 2009/10, the purplish line this past year and one can see the green this year, we are near record cold levels again.

600 mb (14,000 feet) (enlarged)
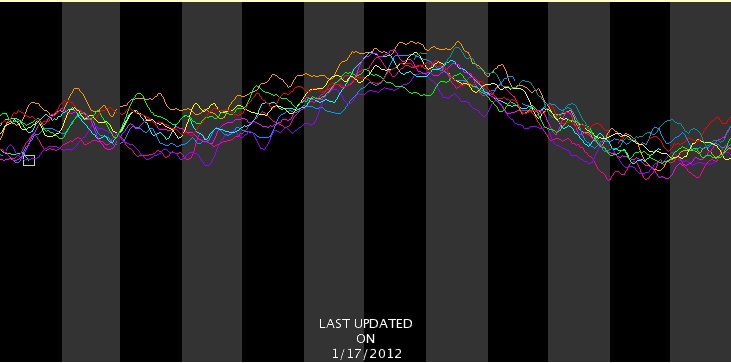
And oh my my, the trapping hot spot itself.. 400mb or 25,000 feet… coldest in the entore decade

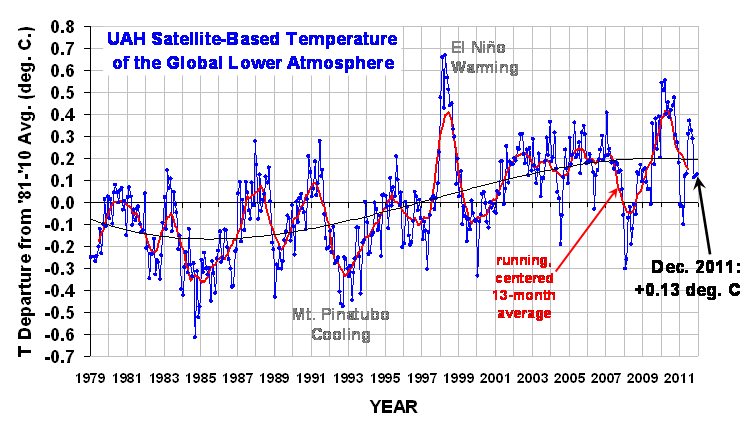
But the 2 meter temperatures, being in the boundary layer, do not respond as fast as the ocean, or a transparent atmosphere above
Nevertheless three downturns in a jagged fashion started predictably after the last El Nino now falling again in fits and spurts through December.
From Dr Roy Spencer’s site:

(enlarged)
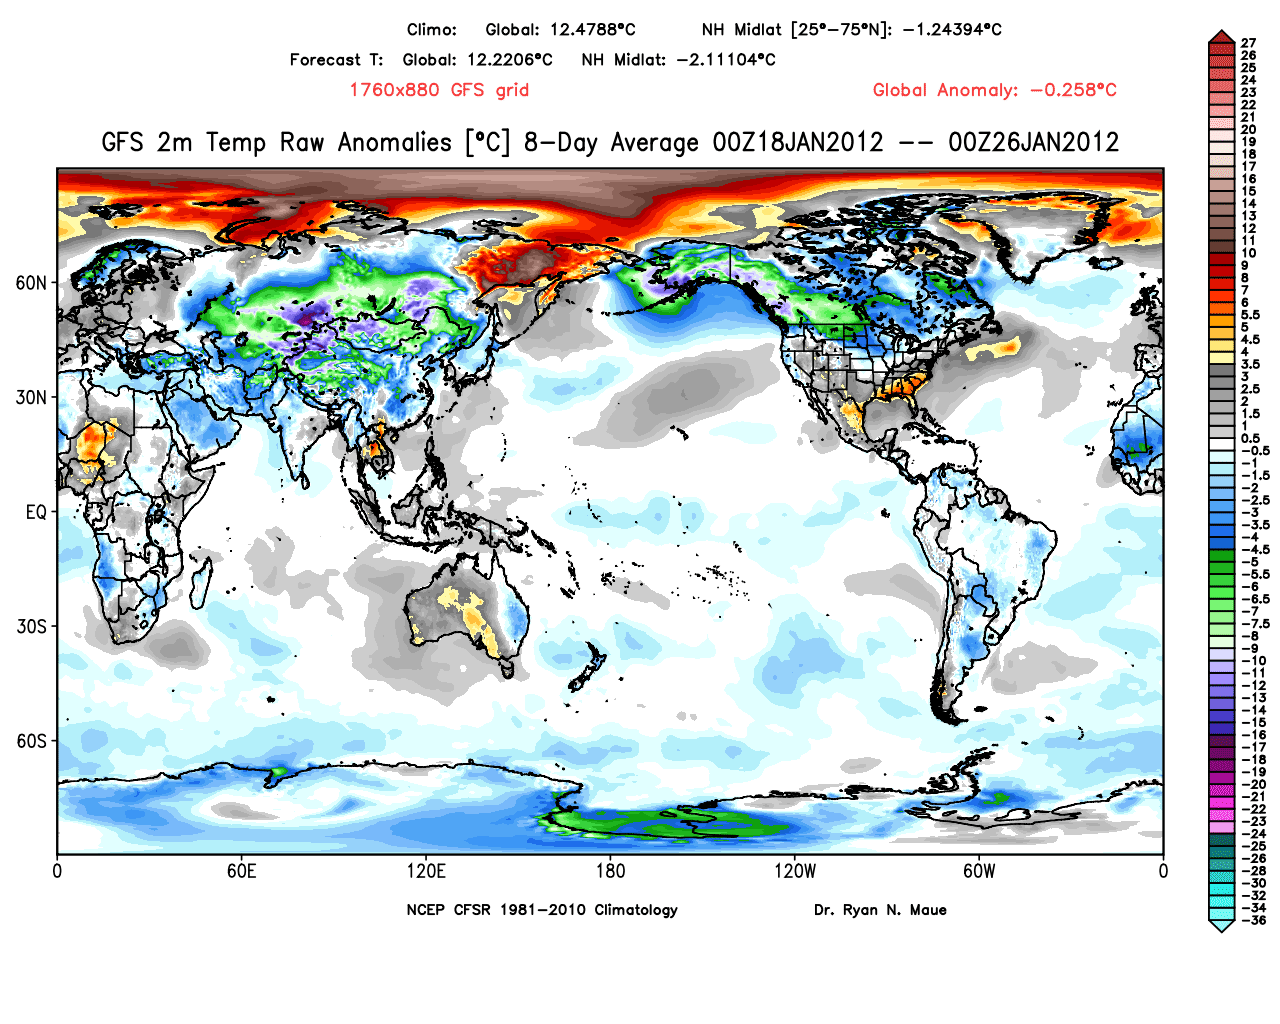
In May, I forecasted the global temperatures to fall to -0.15C in one of the months – Jan, Feb or Mar this year, and perhaps as low as levels we saw in the 2008 La Nina. A rapid free fall has begun. Dr. Ryan Maue at his site (http://policlimate.com/weather/) maintains a plethora of useful forecast information including GFS global temp projections over the next 16 days.
They have been routinely reading greater than 0.2 C below normal and I suspect the Jan reading will plummet quite a bit from December with February even lower. An example of this can be seen with these two charts off Ryan’s site,

-0.258 C globally for 2 meters. (enlarged)

Day 8.5-16 a whopping -0.352 C (enlarged)
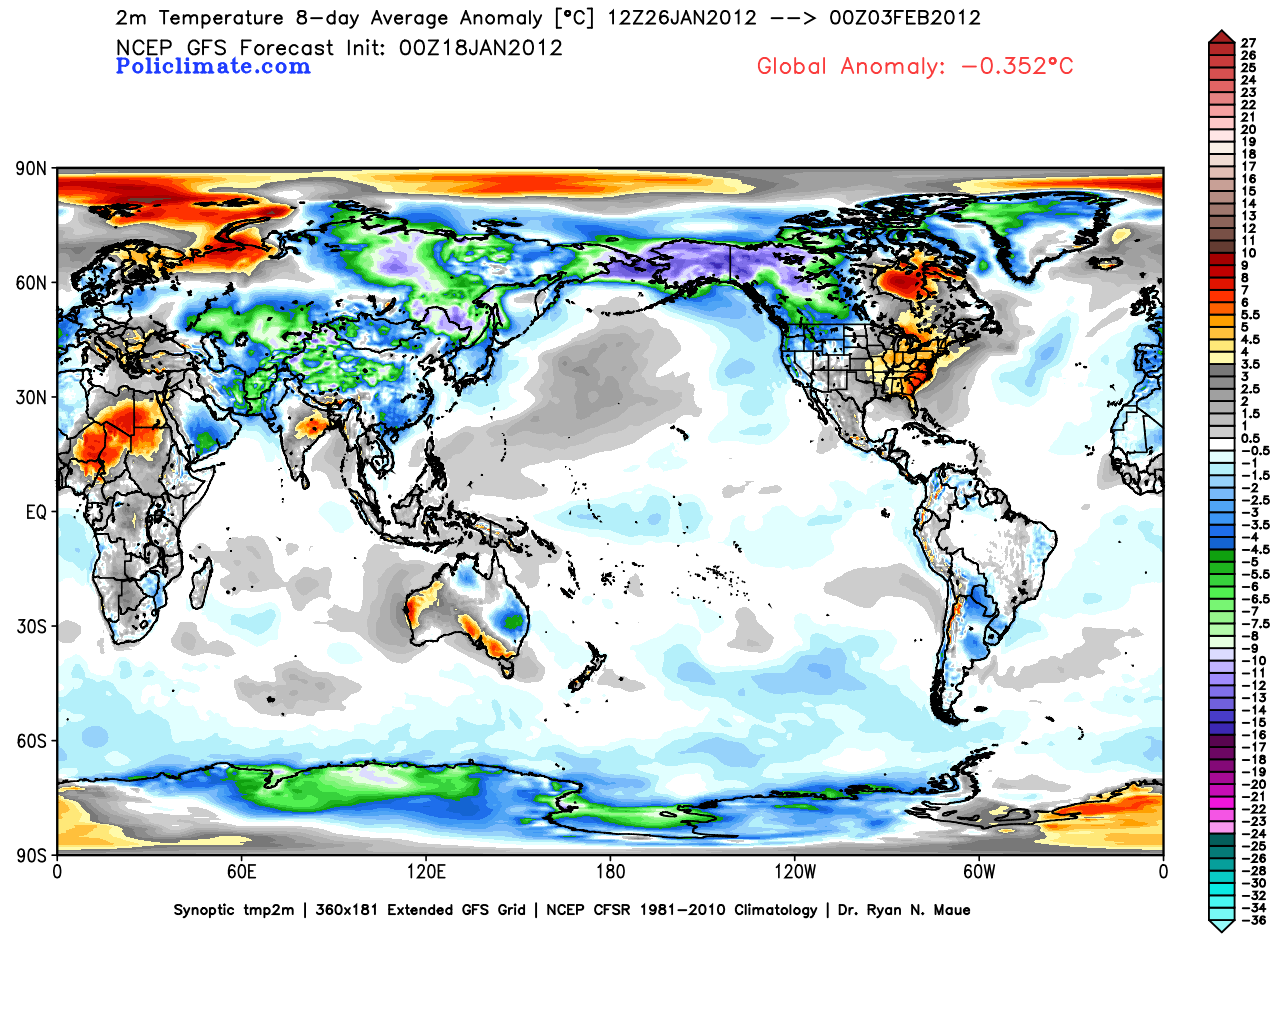
The reason the arctic looks warm is that it has been stormy, and when it’s windy the air is well mixed and so the temperatures are not as low as if it’s calm, but it’s still frigid. Notice in the second map, that the arctic cools because the arctic oscillation is starting to go negative, leading to higher pressures and lighter winds. But the most astounding aspect of this is the northern hemisphere mid latitude temperatures, at -2.1 C.
Currently, with gas so high because we are being handcuffed by an administration that won’t drill (if gas was a 1.50 lower, it would be worth a half trillion dollars to the economy) and an EPA that is causing untold economic damage (I would conservatively etiolate a half trillion dollars, from jobs lost to burdensome regulations) along with a 100 billion dollar subsidy to fight global warming world wide, it is costing each ACTUAL TAX PAYER close to 7000 dollars (1.1 trillion divided by 150 million tax payers).
One has to wonder, how even the most dogmatic of them don’t look at the actual facts, how they can continue to carry on their denial while the results of such things handcuff the American economy and cause untold misery for many as our wealth is not only redistributed, but dwindles. One can only conclude this is being done on purpose, and with purpose.
See PDF with enlarged images.
UPDATE: Bob Tisdale disagrees with portions of this analysis and has an essay here.
) along with a 100 billion dollar subsidy to fight global warming world wide, it is costing each ACTUAL TAX PAYER close to 7000 dollars (1.1 trillion divided by 150 million tax payers).
——-
So Joe reckons he is an economist now.
Let’s do a reality check. The USA spends around 1.5 trillion dollars per year on it’s security apparatus. Does this cause the US economy to collapse? No it does not. This proves that government expenditure of a magnitude much much higher than that expended on climate change does not harm the economy so Joe’s argument fails.
Personally I would be inclined to fact check everything Joe says.
steven mosher says:
January 19, 2012 at 7:24 am
Why do you continue to use a “radiation only” account of the effects of CO2 on Earth? Even Arrhenius knew that such an approach ignored a plethora of “feedbacks” and “forcings.”
Even Trenberth and his following have opted for a view that contradicts the “radiation only” account. They hold that heat is being stored in the deep oceans. Once you recognize that radiation must be viewed in the contexts of natural processes then you have abandoned the “radiation only” account.
Observations trump theory. Every time. The end.
CodeTech says:
January 19, 2012 at 11:52 am
In fact, the more CO2 there is, the more plant life eats it. Plants do this thing, maybe you’ve heard of it… they GROW… and multiply.
=============================================
It certainly looks that way…..
…and a Japanese satellite agrees with you
http://chiefio.files.wordpress.com/2011/10/nhk-world-jaxa-co2-chart.jpg
Latitude says:
January 19, 2012 at 12:36 pm
From:
http://www.suite101.com/news/japanese-study-of-carbon-dioxide-measurements—the-real-story-a395051
Any figures from this study that show known areas of high CO2 emissions (such as North America, Europe and Asia) to be on the lower end of the scale illustrate that the gound-based networks are better developed in those regions, therefore the rate of uncertainty is low – not that the CO2 emissions measured are low. Likewise, areas that are near the upper end of the scale are in less developed countries, therefore their rate of uncertainty is high – it does not suggest that CO2 emissions in these regions are higher than other regions.
Thus that graph is about the certainty of the CO2 measurements of the satellites vs. the ground based measurements, nothing to do with where the places of highest or lowest emissions are…
paddylol – what is the source for the 7-12 years? There are, as I recall, two rates – a short term rate (which might be what you refer to) and a long term rate (measured in centuries).
Could we stop it already with the “Libruls hate oil” nonsense? The Obama Administration has accelerated the permitting process for drilling, The Brits (evil socialists) and the Norwegian (red-fanged commies) all drill to their hearts’ content.
Keystone XL, you say? Ask the Republican Governors in its path what they think. It is NOT unreasonable to review that proposal properly.
The argument is stronger when it stays non-partisan.
paddylol says:
January 19, 2012 at 12:56 pm
It appears that you imply that CO2 emissions will be retained in the atmosphere indefinitely, that is for centuries. I seem to recall several peer reviewed research papers that conclude that retention of atmospheric CO2 is a few years, approximately 7 to 12 years, before it is absorbed and stored by oceans, forests and plants, and soils. This research was based upon empirical data and experiments rather than modeling.
The 7-12 years (even faster) is the residence time, the average time that any CO2 molecule (human or natural) resides in the atmosphere before being exchanged by a CO2 molecule from another reservoir. That is about 150/800 or slightly over 5 years, as about 150 GtCof the 800 GtC as CO2 is exchanged back and forth between the atmosphere and other reservoirs. That has nothing to do with the excess decay time: we are about 210 GtC (100 ppmv) above “steady state”, as dictated by the current temperature. From this 210 GtC extra some 4 GtC/year is removed into oceans and biosphere. That gives an e-fold time (if we should stop all emissions today) of 52,5 years or a half life time of about 40 years.
Compare the residence time with the turnover of a factory, while the decay time is the gain or loss of the same factory. The turnover of a factory doesn’t tell you anything about what its gain or loss at the end of the year is…
Ferdinand Engelbeen says (January 19, 2012 at 12:28 pm)
“For a doubling of CO2, the average growth of all crops is about 50%, not 100%. ” and
“If we should stop all CO2 emissions today, yes the CO2 levels would sink, but slower than most here expect (but much faster than what the IPCC expects…). A half lifetime of about 40 years to get rid of the extra 100+ ppmv…”
Interesting! Some questions:
(1)Does this mean, in your opinion, that current climate science has underestimated the takeup of CO2 by biosystems?
(2) If so, would this extend the estimated time needed for CO2 to double?
(3) Does your figure of 50% relate to the CO2-munching ability of a given amount of crops, or does it also reflect that more crops would grow in hitherto less-favoured areas?
I think this is an area neglected by the AGW picture.
Ferdinand Engelbeen says:
January 19, 2012 at 1:24 pm
==================
Thanks Ferdinand!
CO2 ppm vs Altitude dervived from the CRC handbook (http://mitochondrally.org/myblog/163-ppm-of-co2-with-altitude-and-mass). I’m not sure on where the CRC handbook get’s it figures.
I’ve done a quick number crunch of ppm(altitude) x pressure (altitude) based on that table, and 99% of the mass of CO2 is below 900m, 95% below 490mm, 90% below 400m, 50% below 170m, 30% below 100m.
pressure(Z) = =100*((44331.514-Z)/11880.516)^5.25587712179759
Z= altitude in metres
Pressure in Pascals
(Equation derived from equation 9 in http://psas.pdx.edu/RocketScience/PressureAltitude_Derived.pdf, orginal from CRC handbook 1996 edition)
By the way Joe, if you haven’t run across it yet, it looks like neither of us get to eat steak this year. Lets see how the next one turns when the current La Nina ends though 😉
http://rankexploits.com/musings/2012/checking-in-on-bastartis-wager/
cui bono says:
January 19, 2012 at 1:46 pm
Current carbon cycle models make a difference in time constant between different reservoirs: a fast response from the ocean surface, but that has a limited capacity (10% of the increase in the atmosphere). Relative fast for the deep oceans and the biosphere and much slower for other reservoirs (chalk deposits in the oceans, silicate rock weathering,…).
Most carbon cycle models use the Bern model sink rates with different speeds and for each reservoir some limit over time. While the latter is true for the ocean surface (due to the Revelle factor), I see no reason for limits – in the foreseeable future – for the deep oceans and/or vegetation, thus the relative fast decay time of about 40 years for CO2 into the deep oceans and vegetation has no limit over time. Only if we burn all oil and gas and a lot of coal, up to 3000-5000 GtC over time, that will substantially increase the deep ocean CO2 content and that will return into the atmosphere, increasing the baseline CO2 content with 6-10% compared to pre-industrial levels for a very long period. But that still is far away today. Thus:
(1) I suppose that they underestimated the sink capacity of both the oceans and vegetation.
(2) Depends of the increase rate of the emissions: at the current, slightly exponential, increase of yearly emissions, the increase in the atmosphere is in a near perfect ratio to the emissions. If the emissions slow down for any reason, the ratio would decrease and with steady emissions, we will reach a new steady state level in the atmosphere where emissions and sinks are equal.
(3) The 50% is for crops in the best circumstances of availability of water, minerals and fertilizers and the optimal temperature. In real life, that depends of the type of crop and the other constraints: temperature, water, nutritients, fertilizers,… An extra advantage of more CO2 is that less alveoles are needed (and formed), that gives less water loss in dry/hot circumstances, thus less water is needed, thus more plant types can grow in such a climate.
Joe could be right about the impact of CO2’s weight. It may be a bigger factor than some think. While it is well mixed in the troposphere it falls off quickly above that level. That means the GHE is bolstered for relatively low concentrations of CO2 by the mixing. However, it also means additional CO2 will mostly stay in the already well mixed troposphere. Hence, the height of the effective radiating layer does NOT increase as much as it would for a lighter gas. The effect of increases in CO2 could very well be minuscule.
I think another factor cooling the Earth could very well be due to the Arctic. There’s no doubt it has been quite warm there. However, the heat has an easier time radiating out since there’s little water vapor and the height of the troposphere is much lower. The lower ice levels also lead to more energy radiating from the oceans. It could very well be we are seeing the Arctic acting as a negative feedback instead of the claimed positive feedback.
LazyTeenager says:
“Let’s do a reality check. The USA spends around 1.5 trillion dollars per year on it’s security apparatus. Does this cause the US economy to collapse? No it does not. This proves that government expenditure of a magnitude much much higher than that expended on climate change does not harm the economy so Joe’s argument fails.”
By your argument we can spend more and more on pointless efforts, and it won’t harm the economy. Lazy, put down the economics Cliff’s Notes and step back. You’re liable to hurt yourself.
Before everybody gets carried carried away, howsabout plotting Jan 2012 UAH daily temps versus their 2008 counterparts? I estimate that Jan 2012 (to the 17th) UAH daily average is still 0.2 C warmer than Jan 4..31 2008 (1st 3 days were missing). January 2008 was the “cold standard” for recent years. If the next 2 weeks’ temperatures keep on crashing like carbon futures, we’ll have a shot at beating Jan 2008. Don’t get worked up about a week of cold temps. A month will show up on the global monthly records. If we get a full season or 2, as opposed to the January 2008 “one-month-wonder”, of cooler temperatures, then it’s worth noting.
>>> steven mosher says: January 19, 2012 at 7:24 am
Nice explanation of GreenhouseTheory, Stephen, but:
a. Where is the increased temperature in the upper atmosphere, or the increased level of radiation? Is there a graph that demonstrates this, because I thought that nobody had found this forecast increase in temperature.
b. Wasn’t it you who wrote a WUWT article on Venus’ atmosphere, saying that atmospheric density was the only required factor? Do you want to revisit that post, bearing in mind the evidence we have seen since then?
.
Steve is only discussing the very big picture. Think of the climate processes on earth as a black box (as opposed to a black body). The big picture question is how does the earth exchange energy with the rest of the universe? In this case, we don’t care where energy is stored inside the box, or how it moves from one part of the box to another. How does it get in and out of the box? There are only three (3) mechanisms for energy transport: conduction, convection, and radiation. In the absense of a physical medium outside the limits of earth’s atmosphere (whever you decide to draw that line), the first two cannot occur. That leaves radiation as the only method for energy to enter and leave the climate system. So the only important question is how does CO2 affect the process of absorbing and re-radiating energy for the earth, whether directly or through it’s effects on other GHG’s?
Ferdinand Engelbeen says (January 19, 2012 at 2:42 pm)
Many thanks Ferdinand.
pidge says:
January 19, 2012 at 2:03 pm
Still the table isn’t right:
– ppmv hardly changes with altitude: it is a ratio of CO2 vs. total air. That doesn’t change if the atmospheric pressure changes.
– if the real amount of CO2 at altitude is what is needed, then you can use the pressure changes: at the surface with 1 bar pressure and 387 ppmv (dry air), the (partial) CO2 pressure is about 384 microatm (wet air). At 0.5 bar (at about 6.000 meter) the CO2 ratio still is 387 ppmv, but the pCO2 halves to 192 microatm. So does the amount of CO2 per m3: halve the amount of air and thus also halve the amount of CO2 at 6,000 meter altitude per m3.
I don’t see any resemblance with the table of Richard J. Belshaw
>>> pidge says: January 19, 2012 at 2:03 pm
>>> 99% of the mass of CO2 is below 900m, 95% below 490mm,
>>> 90% below 400m, 50% below 170m, 30% below 100m.
Eh? You mean 99% of CO2 is below 3000′ (900m) in the atmosphere? Or do you mean below 900mb?
Either way, that does not sound right. Could you check.
Could you do a comparison with the other gasses, as I suspect they all fall off at different rates. The 50% pressure level in the atmosphere, is at 18,000 ft.
Thanks.
.
WOW, been watching this for years now……..amazing stuff……let’s all live in sod houses and ride by bicycles. Oh, just in the USA
Joe Bastardi weote in part:
“Nor am I going to question them as to why they believe a trace gas like CO2 (needed for life on the planet) with a specific gravity of 1.5 as compared to the atmospheres 1.0, was going to mix with air in a way to affect the earth’s temperatures”.
I see this making it easy for one to think that Joe Bastardi believes CO2 does not mix into the middle or upper troposphere or higher.
Thunderstorms in extreme cases lift hailstones in at least the middle troposphere until they weigh a pound or more. It is somewhat common for thunderstorms to have updrafts that raindrops and middle/upper tropospheric snowflakes cannot fall through. Very common milder updrafts would have no problem lifting mere CO2 molecules.
The troposphere and the stratosphere are both within the homosphere, where except for varying content of water vapor and ozone and locally generated gases the atmosphere is essentially homogenous. Since ratios of concentrations of nitrogen, oxygen, and argon to each other are nearly enough constant to an altitude a few times higher than the tropopause is, CO2 would have no problem being spread throughout the troposphere.
In fact, a noted measure of atmospheric CO2 concentration is by the Mauna Loa observatory.
That is around the 600 millibar level, above roughly 40% of the mass of our atmosphere.
GregO says: January 19, 2012 at 6:30 am
Where’s the Global Warming? Where’s the “hotspot”? Why don’t the thermometers and satellites show the effects of man-made CO2? What am I missing? Shouldn’t the immanent catastrophe that is global warming from man-made CO2 be somehow measurable by something, somewhere?
Hi GregO. Big picture. Both the instrumental and thermometer records show a rise of ~0.16C/decade since satellite records began. The troposphere is warming, the stratosphere cooling, night-time temperatures are rising faster than day-time temperatures – all signatures of warming due to rising GHG concentration. Satellite measurement of heat escaping in the CO2 absorption bands show decline consistent with theory. In short, AGW is directly supported by measurement.
What is often “missing” for people is confusion between short term fluctuation and long term trend or regional effects and global behaviour. Consider the implications of the following link: http://www.skepticalscience.com/foster-and-rahmstorf-measure-global-warming-signal.html. As for “imminent catastrophe” that depends on the chosen definitions of “imminent” and “catastrophe”. I suggest Mark Lynas “Six Degrees” for understanding the potential effects of rising temperature and Knutti and Hegerl 2008 for a summary of studies on climate sensitivity http://www.iac.ethz.ch/people/knuttir/papers/knutti08natgeo.pdf.