With a rapid onset – the strongest La Niña since 1955-56

Here’s the view of La Niña today:

click to enlarge

The Multivariate ENSO Index (MEI)

by Klaus Wolter, NOAA Earth Systems Research Laboratory

El Niño/Southern Oscillation (ENSO) is the most important coupled ocean-atmosphere phenomenon to cause global climate variability on interannual time scales. Here we attempt to monitor ENSO by basing the Multivariate ENSO Index (MEI) on the six main observed variables over the tropical Pacific. These six variables are: sea-level pressure (P), zonal (U) and meridional (V) components of the surface wind, sea surface temperature (S), surface air temperature (A), and total cloudiness fraction of the sky (C). These observations have been collected and published in COADS for many years.

The MEI is computed separately for each of twelve sliding bi-monthly seasons (Dec/Jan, Jan/Feb,…, Nov/Dec). After spatially filtering the individual fields into clusters (Wolter, 1987), the MEI is calculated as the first unrotated Principal Component (PC) of all six observed fields combined. This is accomplished by normalizing the total variance of each field first, and then performing the extraction of the first PC on the co-variance matrix of the combined fields (Wolter and Timlin, 1993). In order to keep the MEI comparable, all seasonal values are standardized with respect to each season and to the 1950-93 reference period. The MEI is extended during the first week of the following month based on near-real time marine ship and buoy observations (courtesy of Diane Stokes at NCEP) summarized into COADS-compatible 2-degree monthly statistics at NOAA-ESRL PSD. Caution should be exercised when interpreting the MEI on a month-to-month basis, since the input data for updates are not as reliable as COADS, and the MEI has been developed mainly for research purposes. Negative values of the MEI represent the cold ENSO phase, a.k.a.La Niña, while positive MEI values represent the warm ENSO phase (El Niño).

You can find the numerical values of the MEI timeseries under this link, and historic ranks under this related link. You are welcome to use any of the figures or data from the MEI websites, but proper acknowledgment would be appreciated. Please refer to the (Wolter and Timlin, 1993, 1998) papers (NOW available online as pdf files!), and/or this webpage.

If you have trouble getting the data, please contact me under (Klaus.Wolter@noaa.gov)

How does the 1998-2000 La Niña event compare against the seven previous biggest La Niña events since 1949? Only strong events (with a peak value of at least -1.2 sigma) are included in this figure. Note that some events last through the full three years shown here (for instance, 54-56), while others revert to “normal” or El Niño conditions by the second or third year (especially in 64-66). The 1998-2000 La Niña does not resemble any previous event in this comparison figure. It started late (about three months later than the previous latest case), and it featured a superimposed annual cycle (peaking around May and troughing around November) that does not match the other events displayed in this figure. However, the weak La Niña period after the 1982-83 El Niño had similar characteristics. Click on the “Discussion” button below to find the comparison of 2010 MEI conditions against several strong La Niña events.

How does the 2002-04 El Niño event compare against the seven previous biggest El Niño events since 1949? Aside from 2002-04, only strong events (with a peak value of at least +1.4 sigma) are included in this figure. The 2002-03 El Niño event peaked below that threshold, with just over +1.2 sigma in early 2003. Overall, I would rank it just barely in the top 10 El Niño events of the last half century. In its evolution, it bears some resemblance to the 1965-67 event (highest temporal correlation), but shared with 1991-93 its reluctance to drop below the zero line once it had run its course. The El Niño event of 2006-07 reached a similar peak as the 2002-03 event, but lacked ‘staying power’, and collapsed in early 2007. The most recent event (2009-10) will replace 2002-03 in this comparison figure by the middle of 2011. Click on the “Discussion” button below to find the comparison of 2010 MEI conditions against several strong La Niña events.

The six loading fields show the correlations between the local anomalies and the MEI time series. Land areas as well as the Atlantic are excluded and flagged in green, while typically noisy regions with no coherent structures and/or lack of data are shown in grey. Each field is denoted by a single capitalized letter and the explained variance for the same field in the Australian corner.

The sea level pressure (P) loadings show the familiar signature of the Southern Oscillation: low pressure anomalies in the west and high pressure anomalies in the east correspond to negative MEI values, or La Niña-like conditions. Consistent with P, U has positive loadings mostly west of the dateline, corresponding to easterly anomalies along the Equator. The meridional wind field (V) features its scattered negative loadings north of the Equator across the eastern Pacific basin, denoting the northward shift of the ITCZ so common during La Niña conditions, juxtaposed with large positive loadings northeast of Australia.

Both sea (S) and air (A) surface temperature fields exhibit the typical ENSO signature of a wedge of positive loadings stretching from the Central and South American coast to the dateline, or cold anomalies during a La Niña event. Negative loadings north and east of Australia contribute significantly to the overall temperature pattern. At the same time, total cloudiness (C) tends to be decreased from the central to the western equatorial Pacific, and decreased close to equatorial South America as well as over Indonesia.

The MEI now stands for 26.1% of the explained variance of all six fields in the tropical Pacific from 30N to 30S, having regained more than 8% since May/June. For comparison, this value is 1.5% lower than the one registered in 1997, attesting to an overall weakening of ENSO variability in the last decade, but not as much as last month or even last August-September, since the large size of the current event is starting to register in this metric. The loading patterns shown here resemble the seasonal composite anomaly fields of Year 0 in Rasmusson and Carpenter (1982).

Consistent with the continued strengthening of La Niña conditions, all of the key anomalies in the MEI component fields that exceed or equal one standard deviation, or one sigma (compare to loadings figure), flag typical La Niña features, while no comparable El Niño-like features reach the opposite one sigma threshold. Significant negative anomalies (coinciding with high positive loadings) denote strong easterly anomalies (U) along the Equator and west of the dateline (up to -2.5 standard deviations), anomalous northerly anomalies (V) north of Indonesia, while both sea surface (S) and air temperature (A) anomalies continue to show -1 to -1.5 standard deviations in the central and eastern tropical Pacific basin. Significant positive anomalies (coinciding with high negative loadings) denote strong positive sea level pressure (P) anomalies (up to +2.5 standard deviations) over the southeastern (sub-)tropical Pacific, very strong westerly (U; up to 3.2 standard deviations) and strong southerly wind anomalies (V; up to 2.2 sigma) over the northeastern tropical Pacific, warm sea surface (S) and air temperature (A) anomalies, the latter up to +2.9 sigma, and increased cloudiness (C) north of Java. Again, all of these cardinal anomalies flag La Niña conditions.

Go to the discussion below for more information on the current situation.

If you prefer to look at anomaly maps without the clustering filter, check out the climate products map room.

Discussion and comparison of recent conditions with historic La Niña events

In the context of recent plunge of the MEI into strong La Niña conditions, this section features a comparison figure with strong La Niña events that all reached at least minus one standard deviations by June-July, and a peak of at least -1.4 sigma over the course of an event. The most recent bigger La Niña events of 1998-2001 and 2007-09 did not qualify, since they either did not reach the required peak anomaly (the first one) or became strong too late in the calendar year (both).

The most recent (August-September) MEI value shows a continued drop from earlier this year, reaching -1.99, or 0.18 sigma below last month’s value, and 3.39 standard deviations below February-March, a record-fast six-month drop for any time of year, while slowing down a bit at the shorter time scales. The most recent MEI rank (lowest) is clearly below the 10%-tile threshold for strong La Niña MEI rankings for this season. One has to go back to July-August 1955 to find lower MEI values for any time of year.

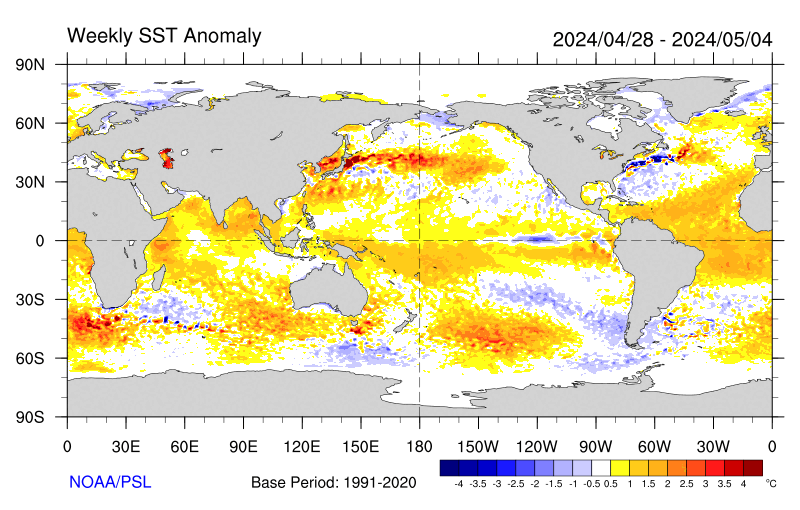
Negative SST anomalies are covering much of the eastern (sub-)tropical Pacific in the latest weekly SST map. Many of these anomalies are in excess of -1C.

For an alternate interpretation of the current situation, I highly recommend reading the latest NOAA ENSO Advisory which represents the official and most recent Climate Prediction Center opinion on this subject. In its latest update (7 October 2010), La Niña conditions are expected to last at least into the Northern Hemisphere spring of 2011.

There are several other ENSO indices that are kept up-to-date on the web. Several of these are tracked at the NCEP website that is usually updated around the same time as the MEI, in time for this go-around. Niño regions 3 and 3.4 showed persistent anomalies above +0.5C from June 2009 through April 2010, with a peak of +1.6C for Niño 3 and +1.8C for Niño 3.4 in December 2009, only to drop to about -0.5C or lower in both regions by early June 2010, reaching just shy of -1.0C for the month of July, and below -1.5C for September Niño 3.4 anomalies and below -1.2C for Niño 3. For extended Tahiti-Darwin SOI data back to 1876, and timely monthly updates, check the Australian Bureau of Meteorology website. This index has often been out of sync with other ENSO indices in the last few years, including a jump to +10 (+1 sigma) in April 2010 that was ahead of any other ENSO index in announcing La Niña conditions. After a drop to +2 in June, July rebounded to +20.5, August continued at an impressive +18.8, only to be followed by an even more impressive +25.0. The last time that this index showed higher values in September was back in 1917, which was also the only time on record that this happened for this month. An even longer Tahiti-Darwin SOI (back to 1866) is maintained at the Climate Research Unit of the University of East Anglia website, however with less frequent updates (currently through March 2010). Extended SST-based ENSO data can be found at the University of Washington-JISAO website, currently updated through May 2010 (which ended up just slightly below the long-term mean value).

Stay tuned for the next update (by November 5th) to see where the MEI will be heading next. After peaking seven months ago at +1.5, it has dropped just about as fast as it can, and continues to correlate highest with 1970, of the ‘analog’ cases shown here. Given the continued drop in the MEI into exceptionally strong territory, La Niña conditions are guaranteed well into 2011.


REFERENCES

  • Rasmusson, E.G., and T.H. Carpenter, 1982: Variations in tropical sea surface temperature and surface wind fields associated with the Southern Oscillation/El Niño. Mon. Wea. Rev., 110, 354-384. Available from the AMS.
  • Wolter, K., 1987: The Southern Oscillation in surface circulation and climate over the tropical Atlantic, Eastern Pacific, and Indian Oceans as captured by cluster analysis. J. Climate Appl. Meteor., 26, 540-558. Available from the AMS.
  • Wolter, K., and M.S. Timlin, 1993: Monitoring ENSO in COADS with a seasonally adjusted principal component index. Proc. of the 17th Climate Diagnostics Workshop, Norman, OK, NOAA/NMC/CAC, NSSL, Oklahoma Clim. Survey, CIMMS and the School of Meteor., Univ. of Oklahoma, 52-57. Download PDF.
  • Wolter, K., and M. S. Timlin, 1998: Measuring the strength of ENSO events – how does 1997/98 rank? Weather, 53, 315-324. Download PDF.
     

    The views expressed are those of the author and do not necessarily represent those of NOAA.

0 0 votes
Article Rating
85 Comments
Oldest
Newest Most Voted
Inline Feedbacks
View all comments
Basby76
October 11, 2010 2:00 pm

It’s already happening here, when it’s drought and no rain, it’s Global Warming/Climate change. At the moment though Eastern Australia is getting plenty of rain. South East Queensland now has enough water in their dams to last until 2018 even if another drop of rain doesn’t fall!
Go back to 2007 and Australia’s biggest Alarmist said this:
Over the past 50 years southern Australia has lost about 20 per cent of its rainfall, and one cause is almost certainly global warming….Desalination plants can provide insurance against drought. In Adelaide, Sydney and Brisbane, water supplies are so low they need desalinated water urgently, possibly in as little as 18 months.
So what are they saying is the cause of this rain?? Global Warming? Climate Change? no of course not, it’s just La Niña

DirkH
October 11, 2010 2:01 pm

Just in time for Cancun.

Michael Proctor
October 11, 2010 2:04 pm

That ocean is looking warm around on the aussie eastern coast, might need to do some more Cyclone preparation up here in Cairns.
Could someone confirm if La Nina events affect how much warmth are in the coastal waters of Fiji/PNG/Austrailia coast? As in with all the colder waters in massed out there in the center does it “push” the warmer waters to the continents? or am I just being daft? 😉
Also just want to take the opportunity to thank WUWT for being a great source of world Climate/Weather/Science/Politics, appreciate everyones efforts here especially Anthony.

Mailman
October 11, 2010 2:06 pm

Please, please, please can you include conclusions in your threads…please?
I know I should read the whole thing BUT I am only a mere mortal after all! 🙂
Regards
Mailman

October 11, 2010 2:07 pm

Have you ever wondered why La Nina suddenly changes direction towards Peruvian cost?
http://weather.unisys.com/surface/sst_anom.gif
Well I think I may have an answer:
http://www.vukcevic.talktalk.net/LFC20.htm

janama
October 11, 2010 2:08 pm

a more direct indicator is that they’ve had to cancel the shoot for the new Mad Max movie as Max and his blue heeler standing in a desert covered in wild flowers isn’t exactly the look they are after 🙂

Enneagram
October 11, 2010 2:18 pm

vukcevic says:
October 11, 2010 at 2:07 pm
This too worthwhile looking at:
http://www.atmos.washington.edu/~ovens/loops/wxloop.cgi?wv_east_enhanced+48+-update+3600

PJB
October 11, 2010 2:21 pm

I remember the winters of 74-77……snow and more snow. (Montreal)

Mike Davis
October 11, 2010 2:24 pm

The child is suffering from Hypothermia and the so called experts still claim it is running a fever.
I do find it intriguing that these experts claim a symptom of the condition is the cause of the condition.

Enneagram
October 11, 2010 2:27 pm

Vukcevic
It would seem that equator magnetic line it is today much more N-S inclined, as for the atmos.washington.edu animation. Is it that possible?

October 11, 2010 2:31 pm

And for those interested, I’ve just posted the Monthly (Reynolds OI.v2) Sea Surface Temperature update for September:
http://bobtisdale.blogspot.com/2010/10/september-2010-sst-anomaly-update.html
Weekly Global SST anomalies dropped like a rock (dropping 0.13 deg C) over the past two weeks:
http://i53.tinypic.com/1ig7sl.jpg

Enneagram
October 11, 2010 2:39 pm

Mike Davis says:
October 11, 2010 at 2:24 pm
#
I do find it intriguing that these experts claim a symptom of the condition is the cause of the condition.

Think the answer is the one Vukcevic give us:
http://www.vukcevic.talktalk.net/LFC20.htm
Fields are moving things. Those “experts” just label things, as our MD when they don’t know what is the cause of an illness: Either it’s a “virus” or a kind of “allergy”, what if you ask for a photo of that virus?

October 11, 2010 2:44 pm

Enneagram says: October 11, 2010 at 2:27 pm
…………..
Yes it is. NOAA produces detailed geomagnetic maps every 5 years, my selection is from 2005, NOAA’s map for 2010 is not yet available.
http://www.ngdc.noaa.gov/geomag/data/mag_maps/pdf/Z_map_mf_2005.pdf

Amino Acids in Meteorites
October 11, 2010 2:45 pm

Could be an ice cold winter coming.

October 11, 2010 2:50 pm

The weekly NINO3.4 SST anomalies based on the Reynolds OI.v2 SST data had been in record territories for September, but have recently fallen back in line with the earlier record setter for this dataset (1988):
http://i53.tinypic.com/sls9k8.jpg

Douglas DC
October 11, 2010 2:54 pm

“By the pricking of my thumbs,
Something wicked this way comes. ”
fr.Shakespeare’s Mac Beth
This is the 1950’s all over again…
Got Coal?

John Cooper
October 11, 2010 3:10 pm

From the NOAA:

La Niña often features drier than normal conditions in the Southwest in late summer through the subsequent winter. Drier than normal conditions also typically occur in the Central Plains in the fall and in the Southeast in the winter. In contrast, the Pacific Northwest is more likely to be wetter than normal in the late fall and early winter with the presence of a well-established La Niña. Additionally, on average La Niña winters are warmer than normal in the Southeast and colder than normal in the Northwest.

I’ll go with the Old Farmer’s Almanac myself…

David Davidovics
October 11, 2010 3:10 pm

I wonder if it will snow in Cancun. Anyone know if Al Gore will be attending? (LMAO).

rbateman
October 11, 2010 3:22 pm

vukcevic says:
October 11, 2010 at 2:07 pm
Then a weak sun instigating a weaker? magnetic field around Earth is going to play into this deepening La Nina.
Which way will it go? In the 1955-56 La Nina, we had a very strong Solar Cycle:
http://www.robertb.darkhorizons.org/TempGr/uSC18_19.GIF
Today we have:
http://www.robertb.darkhorizons.org/TempGr/uSC24vs13_14.GIF
an anttention-defecit disorder Solar Cycle.

jeef
October 11, 2010 3:40 pm

Interesting stuff. Much more fun than watching the Arctic sea ice grow and shrink.

October 11, 2010 3:54 pm

All we need is the AMO to transition cold and have a La Nina like this to hit again and then we can go back to talking about the upcoming glacial period. That will be a nice break to actually talk about the science again.
I wonder if really strong events like this are triggers for other changes coming in the climate. The warm signal in the paleo records would indicate that the current warm period will not last too much longer. I wish there were accurate records so we could better anticipate the climate indicators.
John Kehr
The Inconvenient Skeptic

October 11, 2010 3:56 pm

We should have a pool on how far a negative deviation we get. I call a -3 standard deviation. That would be fun to watch.

crosspatch
October 11, 2010 4:03 pm

Ok, I will go out on a limb here. We will have one hard month of March in the Northeastern US. That is as far out as I am willing to go. Early winter will lull people into a false sense of “no big deal” and March will howl like a banshee.

SSam
October 11, 2010 4:07 pm

ROFLOL….
Re: janama [2:08]
“… Mad Max movie as Max and his blue heeler standing in a desert covered in wild flowers…”
Now that’s funny… I had to see what it would look like.
http://i54.tinypic.com/2pt6yz6.png

Graeme
October 11, 2010 4:35 pm

Eyeballing the “Multivariate ENSO Index” graph – it kinda jumps out at you… you know… that 50s and 60s cooling, and 80s and 90s warming.
So how does 340 to 380 ppm CO2 cool the ENSO for 2 decades, and then warm it for 2 decades? – that’s what I would like to know!
Looks flat in the 10s, with cooling ahead for another 20 years based on past cycles.

Graeme
October 11, 2010 4:39 pm

Mike Davis says:
October 11, 2010 at 2:24 pm
The child is suffering from Hypothermia and the so called experts still claim it is running a fever.
I do find it intriguing that these experts claim a symptom of the condition is the cause of the condition.

There will be no signs of recovery until the need for taxes has abated.

Theo Goodwin
October 11, 2010 4:42 pm

John Kehr says:
October 11, 2010 at 3:54 pm
“All we need is the AMO to transition cold and have a La Nina like this to hit again and then we can go back to talking about the upcoming glacial period. That will be a nice break to actually talk about the science again.”
Yes, that would be one happy time. We might get to talk about some people producing some actual science.
SSam says:
October 11, 2010 at 4:07 pm
ROFLOL….
Re: janama [2:08]
“… Mad Max movie as Max and his blue heeler standing in a desert covered in wild flowers…” Now that’s funny…”
The movie might work if Mann co-starred.

Editor
October 11, 2010 4:43 pm

Question for Bob Tisdale;
> Weekly Global SST anomalies dropped like a rock (dropping
> 0.13 deg C) over the past two weeks:
> http://i53.tinypic.com/1ig7sl.jpg
Do you have a link for the data used to generate the plot, please? I.e. something similar to the weekly ENSO data at http://www.cpc.noaa.gov/data/indices/wksst.for If there is also daily and/or monthly, I’d be interested in that as well. Thanks.

Graeme
October 11, 2010 4:47 pm

Hmmm… Strong anomalies = “Global Climatic Disruption” according to John Holdren.
I strongly suspect that Mr Holdren knows perfectly well that the world is cooling, and has invented a descriptor that allows him to continue the facade of attributing changes in the weather to human emissions of CO2.
Thus allowing for the control of CO2 emissions which are a tightly coupled proxy for human energy use – hence allowing for indirect control of the primary resource necessary for modern human life.

MikeTheDenier
October 11, 2010 4:50 pm

I’ll be curious to see what Joe Bastardi’s winter forecast will be. I read recently he will come out with around Oct 20.

Colonial
October 11, 2010 4:57 pm

I tried the link to COADS given in the first paragraph of the article:
http://www.esrl.noaa.gov/psd/coads/
The page I reached said (among other things), “Oops! Sorry, we cannot find the page or resource you requested.” Is this data only accessible to people at certain sites, or certain kinds of sites?

Dave N
October 11, 2010 5:20 pm

Colonial:
I think it might be ICOADS now:
http://icoads.noaa.gov/

Fernando (in Brazil)
October 11, 2010 5:52 pm

Vukcevic.
rbateman diz:
11 de outubro de 2010 às 03:22
Vukcevic diz:
11 de outubro de 2010 às 02:07
vukcevic says:
October 11, 2010 at 2:07 pm
Have you ever wondered why La Nina suddenly changes direction towards Peruvian cost?
http://weather.unisys.com/surface/sst_anom.gif
Well I think I may have an answer:
http://www.vukcevic.talktalk.net/LFC20.htm

No doubt.
We are under the influence of the solar maximum of 1958
Very funny

pochas
October 11, 2010 6:02 pm

Principle Components Analysis
Double, double, toil and trouble
Fire burn and Cauldron Bubble
Round about the cauldron go
In the poison’d entrails throw
Wind and wave, shipwreck’d at sea
Shall shew the shade this potion be
Put more components in the broth
Thunder, lightning, wind blown froth
And bitter wind from out the north
And temps adjusted back and forth
And ever chant this baleful verse
Its worse than we thought
And it will get worse.

October 11, 2010 6:18 pm

Walter Dnes: The weekly Reynolds OI.v2 SST data is available through the NOAA NOMADS system:
http://nomad3.ncep.noaa.gov/cgi-bin/pdisp_sst.sh?lite=
You’ll have to enter the coordinates on the next page after you select the weekly data, but it is the same data you linked above. It also spits the data out without the associated dating, so you have to prepare that on your own. The Monthly data is available also through NOMADS.
The daily data since 1990 is available at the KNMI Climate Explorer “Daily Climate Indices” webpage:
http://climexp.knmi.nl/selectdailyindex.cgi?someone@somewhere
To date, that’s just over 7600 lines of data. (I just checked)

October 11, 2010 6:20 pm

Last July I wrote on article on the upcoming “massive” northern hemisphere winter. I also predicted a very large sustained La Nina based on the associated record high AAO (SAM) value in Antarctica. Past history has shown a unique link between these two indicies. Coupled with an increasingly negative PDO and NAO the writing is on the wall.
There is a pattern that brings these climate modulators into unison, the PDO in harmony with solar velocity as outlined by Scafetta and the atmospheric teleconnections a product of low EUV from low solar output. When it comes to climate the PDO being the main contributor but when heavily backed by solar influence the result is greater.
Article here: http://www.landscheidt.info/?q=node/189

Editor
October 11, 2010 6:28 pm

And I thought no one wrote poetry anymore.

October 11, 2010 6:34 pm

Thick-Headed Larry’s stoopid question of the day:
What the dickens is Sea Level Pressure? Is it the atmospheric pressure at sea level, or is it something else? As you can see, meteorology and oceanography are not my strong suits.

Ian W
October 11, 2010 6:39 pm

What I find interesting is that the SST anomaly plot http://weather.unisys.com/surface/sst_anom.gif is still showing the track of hurricane Igor in the Atlantic over Bermuda.
There must be a real lack of ocean heat in the upper layers of the mid-Atlantic for that cold surface water not to have dispersed in the month since Igor tracked through.

Ben D.
October 11, 2010 6:49 pm

Dr. Mann likes sticks
those sticks can seem oh, mighty
alas, they are fake!
I am terrible at any kind of poetry, but lets be honest, truth often makes better stories then fiction sometimes…

DocMartyn
October 11, 2010 6:59 pm

Is the consensus that we are in for a cold winter?

Paul Vaughan
October 11, 2010 6:59 pm

Particularly interesting:
“[…] SOI data back to 1876 […] This index has often been out of sync with other ENSO indices in the last few years, including a jump to +10 (+1 sigma) in April 2010 that was ahead of any other ENSO index in announcing La Niña conditions […] followed by an even more impressive +25.0. The last time that this index showed higher values in September was back in 1917, which was also the only time on record that this happened for this month.”
Regarding MEI:
Klaus, I would be interested in seeing a comparison of the loadings for (at least) the first three unrotated & varimax-rotated components (along with cumulative explained variance). The varimax-rotation stats would be of particular interest.
Best Regards,
Paul.

Graeme
October 11, 2010 7:02 pm

Larry Fields says:
October 11, 2010 at 6:34 pm

http://en.wikipedia.org/wiki/Atmospheric_pressure
Apparently its atmospheric pressure at sea level. No politics in this wiki entry – might have some value.

Owen
October 11, 2010 7:08 pm

The el ninos and la ninas seem to affect both surface-based temperature measurements and satellite-based tropospheric measurements. But the ENSO events have had a greater impact (both positive and negative) on the tropospheric measurements. Your plot of the multivariate ENSO index shows a moderate el nino peaking in ca. Jan 2010 and a whopper of an emerging la nina. The moderate el nino has produced among the warmest tropospheric temps on record (even now in the emerging la nina stage). It will be interesting to see how low the tropospheric temps go as the full la nina develops. What if they don’t set all time lows? What can be said then?

Bill Illis
October 11, 2010 7:33 pm

There is still at least 2 months to go before this La Nina peaks and it should last well into spring. Nino 3.4 should peak in December at any number from -2.0C to -2.5C (which would be the record strongest event).
Some of the drivers are starting to moderate now but others are getting a little stronger. There is no cloud cover at all over the equatorial Pacific, westerly trade wind anomalies have strengthened even more, the Pacific equatorial upper ocean temperature anomalies have cooled even more (the last remaining warm pools at depth have been pushed out/cooled off), the SOI has stalled and Atmospheric Angular Momentum has moved to neutral – indicating we are moving toward the peak soon.
Along with global sea surface temperatures, the AMO has also nosedived in the last several weeks.
So, Temps are on their way down until at least April next year.
Afterward, there are two possibilities – an El Nino will develop late in 2011 which is what the equatorial upper ocean temperature anomaly pattern suggests, or so much cool water will have built up by then that we will have the infamous 2 year La Nina event (which is also starting to look more likely now and that would make 2011 a very cold year).
http://img143.imageshack.us/img143/8480/weeklyensotempsoct6.png

Erik Anderson
October 11, 2010 7:37 pm

Anthony: If the MEI graph is going to be updated periodically, maybe you could keep a current copy on your “ENSO/Sea Level/Sea Surface Temperature Page” ?
REPLY: yes.

Nylo
October 11, 2010 7:56 pm

I remember that the strong El Niño that we just left reached 1,8. Yet in the first graph it looks like an average El Niño and visually doesn’t seem to go much higher than 1,5. WUWT?

Laurence Kirk
October 11, 2010 7:59 pm

Some interesting observations of the direct effects of this strong La Nina:
I have just returned from a stay in Bali, where my hosts, who run a coffee plantation in the central highlands, were complaining miserably that it is now a week or so from the end of the dry season, but the dry season hasn’t even started yet. It has simply rained, day in day out, for the whole of the ‘dry’. In the surrounding villages the local farmers’ coffee crops are stacked rotting under plastic tarpaulins, when they should have been spread out on the ground to dry and then sold weeks ago. Most the time that I was there, the afternoon brought in thunder storms and heavy rain. (This is a far cry from the El Nino year that I spent in the highlands of Java in the early 90s, when there was no wet season at all, and half the forests of Java, Sumatera and Kalimantan were on fire).
These cycles are extreme and very real on the ground in equatorial the tropics, particularly if you are a subsitence farmer or plantation owner.
Meanwhile back here in Australia, all the oil and gas explorers and the non-piped oil producers in the (onshore) South Australian Cooper Basin have been flooded out since last southern summer by the incredibly heavy 2009 wet season that occured in southwest Queensland. They had all hoped to be back in on the ground by now, once the roads and creeks had dried out over winter, but there has been too much unseasonal winter rain in South Australia itself, so the rigs are all still stacked and the dirt roads inaccessible. They are now hoping to be back in on the ground for the new year, but with another big La Nina wet season coming up in Queensland I very much doubt if they will. This could hold things up for another 12 months, at huge cost to all involved.
In years like this, the dry creek systems, such as Coopers Creek and the Diamantina River, that run southwest from SW Queensland into South Australia and then on into the usually arid Lake Eyre, turn into rivers and flow for months on end. This cuts all the dirt roads and then inundates the flat, low-lying arid plains of the Cooper basin, before finally filling Lake Eyre (currently 70% full), to the delight of the the local wildlife and the tourist industry.

Laurence Kirk
October 11, 2010 8:30 pm

For those of you who like weather maps, the 4 day rainfall outlook down here:
http://www.bom.gov.au/products/IDG00074.shtml
(Note the early-season tropical low forming off the NW coast)

mr.artday
October 11, 2010 8:50 pm

It looks to me like the PDO doughnut has lost it’s warm water hole. WUWT.

vigilantfish
October 11, 2010 9:03 pm

pochas says:
October 11, 2010 at 6:02 pm
Principle Components Analysis
————–
Really enjoyed your poem, especially the the “And temps adjusted back and forth” part. Wicked analogy!

Eric Flesch
October 11, 2010 9:19 pm

El Ninos and La Ninas are just rhythmic upwellings of masses of water of different temperature. You can see the same thing in a bucket of water, but in the Pacific it is bigger and takes longer. That’s all of it. Can all the people writing their Ph.D. dissertations on it stop now?

rbateman
October 11, 2010 9:28 pm

Geoff Sharp says:
October 11, 2010 at 6:20 pm
This Solar Cycle isn’t going anywhere anytime soon, having just recently had the stuffings knocked out of it
What should be strong latitudinal bands in the EUV are now circular splotches, or a blank stare.
Like this: http://stereo-ssc.nascom.nasa.gov/beacon/latest_256/behind_euvi
and this: http://stereo-ssc.nascom.nasa.gov/beacon/latest_256/ahead_euvi

Alex the skeptic
October 11, 2010 11:15 pm

David Davidovics says:
October 11, 2010 at 3:10 pm
I wonder if it will snow in Cancun. Anyone know if Al Gore will be attending? (LMAO).
David, I read it somewhere these last few days that following the Copenhagen disastrous outcome/debacle, this time governments will not be represented by prime ministers or presidents, but will be a low key thing, attended by environment ministers. If Al Gore attends, he would feel like a pompous king who calls a party for the richest of the land, but instead the rich he finds the poor turning up for the party. And it will also snow in Cancun.

October 11, 2010 11:37 pm

Here between the mountains and sea, mid-coast NSW, it’s by far the wettest spring my moso bamboo has experienced. It’s a cool October, like the post-El Nino October of ’99, but this season has a mid-fifties feel to it.
Even last year’s El Nino was a departure from the thirty year trend preceding ’07. We’ve had less of an inland influence in our wind patterns since ’07, thunder in late winter is no longer a rarity. Plenty of hot days, but nothing like the heatwave of ’04.
It will be very interesting to see if we get a return to the fifties pattern of regular afternoon “southerly busters” in summer, and severe winters dominated by moister southerlies. (’07 and ’08 were just like that, and very different to the drier westerly-dominated winters of the late century.)
As someone out in the open a lot, I can say that I’m noticing a different pattern since ’07, even through last year’s El Nino.
Won’t pronounce. Will observe.

October 11, 2010 11:38 pm

Robert E. Phelan says:
October 11, 2010 at 6:28 pm
And I thought no one wrote poetry anymore.>>
If a terrible winter this one should be,
Then anyone could easily see,
That climate measured in degrees,
Cannot be tracked by those trees.
Be theyLarch or Bristlecone
’tis not long before its known
Jones and Mann and even Briffa
Can’t explain why they diffa
Though Hansen may save their butts
By coming up with new adjusts
But the rest of us will be left to shiver
While being told we’re warm as ever
Then more of us will divine
That tricks to hide “the decline”
Are not so much sciencific method
As they are magic discredited
Tax and spend the politicians say
Is not the way they want to play
But each one knows the real facts
Fear alone sells new tax
But comes a time in every fight
When soldiers look left and right
And find their comrades have run away
Perhaps to fight another day
And there the few stand alone
Slogg they do through ice and snow
Insisting that the cloak they wear
Is air conditioned under wear
If a terrible winter this should be
They’ll not be saved by any trees
Unless it is that they decide
more evidence they must hide.
But burning all the charts and books
will only get them dirty looks
because when cold breaks the records
Only fools say its not climate its just weather.

October 12, 2010 12:27 am

rbateman says: October 11, 2010 at 3:22 pm
……….
In long term (many decades) the Earth’s and sun’s magnetic fields appear to be moving in the opposite directions.
As for the Pacific oscillations, is it the sunspot cycle, SCL, Earth’s magnetic field or combinations, probably none of the above. Lots of guesswork from experts and amateurs alike.

Rabe
October 12, 2010 1:05 am

re Eric Flesch:
Yes, a huge very slowly but non the less chaotic moving mass of water on a fast spinning lump of rock with a nearby mixer rotating around it.
[did I forget some of the major forces?]

Cirrius Man
October 12, 2010 2:04 am

So much water down under and what to do with it all ?
The tragedy is that just when the farmers saw the dams full after a decade of drought, the government down here took away their water allocations from the rivers so it could all flow out to sea.
Nice one Julia !
ps – The next time you note a rise in global sea level you’ll know why !
How I’m glad I never put that rainwater tank in 🙂

Jason
October 12, 2010 2:22 am

This is potentially it, the end game.
We are entering a cycle where the main contributors are lining up to deliver colder temperatures while the ice caps are potentially going to start expanding to cancel out the shrinkage of the past 30 years.
This could prove to many people that AGW is a false hypothesis, and that any effect we are having could actually be keeping us away from the next ice age.
The fight is on this winter, are we all up for it?

Espen
October 12, 2010 2:50 am

Meanwhile, lower tropospheric satellite temperatures are up at record levels again over the past few days. WUWT? When will they finally start dropping?

October 12, 2010 3:52 am

Laurence Kirk says:
October 11, 2010 at 8:30 pm
The moon is Maximum South declination today, (12th) I would expect interesting weather for the next three or four even with out a map.

rbateman
October 12, 2010 4:06 am

vukcevic says:
October 12, 2010 at 12:27 am
That doesn’t mean that it’s all guesswork. We do know that the current Solar Cycle has fewer, smaller and shorter-lived spots and that the EUV output and solar wind are down. The Sun now has the consistency of a drunk driver somewhere between riding the center line/fog line (SC13/14) and passing out/crashing (Dalton/Maunder). For the Earth, we know the geo-magnetic indexes are likewise down and the jet streams have shifted and gone loopy.
The guesswork is how this drives ENSO and the other Sea indexes. Ya got me on that one.
The literary record implies that weak Solar Cycles meet up with colder climates, and that should be an aid, not a hindrance.
My best guess is, that somewhere along the line, this thing makes a break for a new equilibrium and takes the ENSO for a ride.
So, take a shot at it.

ShrNfr
October 12, 2010 4:47 am

Next time you run into a AGW fruitcake ask him/her what a bar is. I would lay serious odds that they will not tell you that the pressure at sea level of the US Standard atmosphere is 1.013 bars.

Theo Goodwin
October 12, 2010 4:57 am

Eric Flesch says:
October 11, 2010 at 9:19 pm
“El Ninos and La Ninas are just rhythmic upwellings of masses of water of different temperature. You can see the same thing in a bucket of water, but in the Pacific it is bigger and takes longer. That’s all of it. Can all the people writing their Ph.D. dissertations on it stop now?”
And the point of this post is? Apparently, you are antiscience and prohunch. Science needs a set of hypotheses that describe the natural regularities which come together as a La Nina. Without them, there is no explanation or prediction of events in a La Nina or La Nina events themselves; that is, there is no science of La Nina.

Bill Illis
October 12, 2010 6:03 am

Why is there so much rainfall in Indonesia, Australia (and Pakistan earlier).
This is what a La Nina does. It moves the warmer water, the tropical convection clouds and the rainfall to Indonesia, Australia and the north Indian Ocean. This leaves the equatorial Pacific with little cloud and little rainfall.
In an El Nino, most of the warmer water moves to the International Dateline and Nino regions and the tropical convection and rainfall occurs there. Indonesia, Australia and the north Indian Ocean then have drought.
This page has the shortest, best, most-accurate explanation I have seen.
http://www.srh.noaa.gov/jetstream/tropics/enso_patterns.htm
This map (the one at the bottom) shows the last 3 months of OLR which is a very good proxy for cloud cover and rainfall. Dry and clear (brown) in the Pacific and at the International Date line – wet and cloudy (blue) from Indonesia to the north Indian Ocean and Pakistan.
http://cawcr.gov.au/staff/mwheeler/maproom/OLR/map.last3month.gif
Here is the peak of the 1997-98 El Nino. Constant cloud cover and rain in Nino 3.4 – extreme drought in Indonesia and Australia.
http://cawcr.gov.au/staff/mwheeler/maproom/OLR/ARCHIVE/map.3mths/19980101.gif
There is local variation and some locational changes from this pattern but regionally, it is quite predictable.
Australia is likely to get a few hurricanes in the northeast and in the western north-south track like in 1998-99 season.
http://www.australiasevereweather.com/tropical_cyclones/oper_1998_1999_australian_region_tropical_cyclones.htm

October 12, 2010 6:34 am

If sea temperatures are a major component of global temperature, how are they going to keep on saying that this year/month is the warmest on record?
Something has to give, surely.

October 12, 2010 6:56 am

I want to cite two recent Journal articles so that readers can tune into the issues. Otherwise what I say below may be dismissed as irrelevant nonsense:
http://www.nature.com/nature/journal/v432/n7015/full/432290b.html
Atmospheric science: Early peak in Antarctic oscillation index
Julie M. Jones & Martin Widmann
Abstract
The principal extratropical atmospheric circulation mode in the Southern Hemisphere, the Antarctic oscillation (or Southern Hemisphere annular mode), represents fluctuations in the strength of the circumpolar vortex and has shown a trend towards a positive index in austral summer in recent decades, which has been linked to stratospheric ozone depletion and to increased atmospheric greenhouse-gas concentrations. Here we reconstruct the austral summer (December–January) Antarctic oscillation index from sea-level pressure measurements over the twentieth century and find that large positive values, and positive trends of a similar magnitude to those of past decades, also occurred around 1960, and that strong negative trends occurred afterwards. This positive Antarctic oscillation index and large positive trend during a period before ozone-depleting chemicals were released into the atmosphere and before marked anthropogenic warming, together with the later negative trend, indicate that natural forcing factors or internal mechanisms in the climate system must also strongly influence the state of the Antarctic oscillation.
http://findarticles.com/p/articles/mi_7598/is_20100115/ai_n48702654
Relationships between the Antarctic Oscillation, the Madden-Julian Oscillation, and ENSO, and Consequences for Rainfall Analysis
Journal of Climate, Jan 15, 2010 by Pohl, B, Fauchereau, N, Reason, C J C, Rouault, M
ABSTRACT
The Antarctic Oscillation (AAO) is the leading mode of atmospheric variability in the Southern Hemisphere mid- and high latitudes (south of 20°S). In this paper, the authors examine its statistical relationships with the major tropical climate signals at the intraseasonal and interannual time scales and their consequences on its potential influence on rainfall variability at regional scales. At the intraseasonal time scale, although the AAO shows its most energetic fluctuations in the 30-60-day range, it is not unambiguously related to the global-scale Madden-Julian oscillation (MJO) activity, with in particular no coherent phase relationship with the MJO index. Moreover, in the high southern latitudes, the MJO-associated anomaly fields do not appear to project coherently on the well-known AAO patterns and are never of an annular nature. At the interannual time scale, a strong teleconnection with ENSO is found during the peak of the austral summer season, corroborating previous studies. El Nino (La Nina) tends to correspond to a negative (positive) AAO phase. The results are statistically significant only when the seasonal mean fields averaged for the November through February season are considered.
Put these three points together:
1. The current La Nina is due to an enhancement of the pressure differential between 30-50° of latitude and 10N-10S. It is the strongest for many decades. Since 2007, La Nina has prevailed for most of the time. Before that, El Nino was dominant. La Nina involves stronger than usual trade winds and a cooler tropical ocean. That’s due to enhanced evaporation and upwelling of cold water.
2. The Antarctic Oscillation Index is currently positive indicating a loss of atmospheric pressure at the pole. It can be observed that a loss of atmospheric pressure at the pole is associated with rising atmospheric pressure in the mid latitudes.
3. It can be observed that when the Dst index (that measures the strength of the ring current above the equator) goes negative (which it does with increased geomagnetic activity) the Antarctic Oscillation index and the Arctic Oscillation index both rise indicating a loss of atmospheric pressure at the poles and increasing atmospheric pressure in mid latitudes.
And that is all you really need to know to understand the warming and cooling cycles in the tropics that we call ENSO.
Why is this statistically significant only for the November to February period? Because that is when Antarctic pressure is at its seasonal minimum and the trades are at peak seasonal strength. So, any increase in Antarctic pressure (plenty of scope for that given the seasonal minimum) robs the high pressure cells of the mid latitudes and weakens the trades. At this time of the year (November to February) the trades have to be strong to take the heat out of the tropical ocean as it rises to its seasonal maximum temperature in March-April.
In the Arctic air pressure is relatively invariable across the year. But it changes with ring current activity generally moving with the Antarctic.
In a regime of gradually declining geomagnetic activity (gradually weakening solar cycles) the ring current is gradually de-energised allowing the poles to recover atmospheric pressure (The AAO falls). The El Nino warming cycle is dominant for the duration of the decline. This is so whether we are talking 11 year cycles, 100 year cycles or 200 year cycles. Of course, there are short term swings all the time but they are like ratchets or one step after another in climbing or descending the stairs.
No need for mysterious ocean cycles. No need for cosmic rays. No need for changing levels of irradiance. The climate cycle in the tropics is driven by the solar wind energising the ring current. The ring current influences the distribution of the atmosphere. The distribution of the atmosphere determines the strength of the trade winds.
A caution: In this case tests of statistical significance will be misleading. Here are some influences that appear to impinge on the relationship.
1. Once energised the ring current takes time to lose energy. So, not every pulse of geomagnetic activity will yield the same atmospheric response.
2. Pressure at the southern pole varies strongly between summer and winter and with it the scope for change. Like all females Mother Earth has a period of peak susceptibility. Catch her at your time of choosing and she may be unresponsive.
3. Some influence unknown to me causes a tug of war between the poles. Sometimes polar pressure moves in the same direction and sometimes in opposite directions.
4. The earth has two very different hemispheres and the warming cycle heats the northern more than the southern. When the southern trades advance fast the northern trades can suffer. The Arctic Oscillation is a strong player so far as the northern hemisphere is concerned. When pressure rises at mid latitudes the warm winter westerlies affect higher latitudes, winter temperatures increase and the Arctic ice should melt. This has long been known. the index has been calculated from 1950.
5. The atmosphere needs to be ionised in order to react to the solar wind but it appears that the strongest pressure (and ENSO) response is when the atmosphere is most compact. Perhaps the ring current is more influential when the ionised and the non ionised portions are more intimate.
The global temperature response also depends upon cloud cover which determines irradiation at the surface. In the cloudier mid and high latitudes there appears to be warming as the tropics cool and this could well be related to the flux in ozone that depends upon the strength of the polar vortex. An increase in geomagnetic activity robs the vortex of air (rising AAO and AO) diminishing the flow of nitrogen oxides from the mesosphere resulting in extra ozone, and this could mean reduced cloud cover in the ice cloud zone of the upper troposphere/lower stratosphere. So, it could ultimately be the mid and high latitudes that determine whether the globe warms or cools rather than the tropics. In this scenario falling geomagnetic activity brings atmosphere back to the pole, enhances the vortex, reduces ozone levels, cools the stratosphere and the upper troposphere and increases cloud cover. So, the earth cools as the solar cycle falls away……..and this is more like we observe. One notes that the southern hemisphere, where most of the ocean is, has been cooling for as while.
Either way, it’s the solar wind that matters. And that has long been known or guessed. And the Earth is not a closed system.
Best compliments to Tallbloke and to Kim who is missed and thanks to Anthony for the opportunity.
Thanks to William for his contributions.

Mr. Alex
October 12, 2010 7:26 am

A small drought has just ended in KwaZulu Natal, South Africa. I love the rain and cold weather that La Nina brings.

Peter Pan
October 12, 2010 7:36 am

rbateman says:
October 11, 2010 at 3:22 pm
Which way will it go? In the 1955-56 La Nina, we had a very strong Solar Cycle:
http://www.robertb.darkhorizons.org/TempGr/uSC18_19.GIF
Today we have:
http://www.robertb.darkhorizons.org/TempGr/uSC24vs13_14.GIF
an anttention-defecit disorder Solar Cycle.
======================================================
But both time the solar 10.7 cm radio flux were in the same lower level as today.
http://www.spaceweather.gc.ca/common_apps/auto_generated_products/solradmon_eng.png

gary gulrud
October 12, 2010 9:19 am

Superb discussion(herein). No time for extended look at links but this satiates.
As I live north of the 45th, not at all enthused about the record setting potential.

Gary Pearse
October 12, 2010 9:51 am

Hmm… I also note that sea level has also dropped 10mm since the breakout of the Climategate scandal last November – thats equivalent to 3 years of sealevel rise being reversed. I can’t see it swinging back up just yet with all this cooling going on.
http://sealevel.colorado.edu/current/sl_noib_global.jpg

Douglas DC
October 12, 2010 10:01 am

North of the 45th here too. Not excited by this either. Getting wood this weekend..

Steve W
October 12, 2010 10:27 am

Seeing at there are a lot of climate change sceptics positing here, I wondered which of the following statements people disagree with:
1. CO2 is a greenhouse gas. (measurement in isolation, atmospheric CO2 record tracked by temperature record)
2. CO2 is at it’s highest level in the atmosphere for 400,000 years
3. Concentration increases of CO2 in the atmosphere track well to known human production of CO2 (industrial, slash & burn agriculture, etc.)
Thanks.

gary gulrud
October 12, 2010 10:39 am

Another enlightening discussion from Erl. Much obliged. Milestone, I gather.

gary gulrud
October 12, 2010 10:43 am

“lower tropospheric satellite temperatures are up at record levels again over the past few days. WUWT?”
Bet it has something to do with overall cloudiness. Albedo up 2% over 1998? H2O aloft is the reason for both and for lower levels of visible and UV integrating into SO. Our next few years will begin the evident decline in temps DA has been forecasting.

October 12, 2010 11:05 am

Steve W,
First, the alarmist crowd are the climate change skeptics. Here, we have always known that the climate has constantly changed, just like it’s changing today. But Michael Mann’s acolytes still believe in his flat temperature record over the past thousand years [the hokey stick shaft], until the beginning of the industrial revolution. They have been proved wrong repeatedly, but being true believers they refuse to accept the reality of historical climate change.
Your points #1 & #3 are in error, as follows:
#1 is backward; rises in CO2 follow rises in temperature on all time scales. Effect can not precede cause, therefore the coincidental rise in CO2 now is an effect of prior warming cycles. CO2 has an effect on current temperatures, but that effect is insignificant. Further, as always the model predictions are falsified by real world observations.
Point #3 is in error. If temperatures ‘tracked well’ with increased CO2, then the temperature would be on the same curve as CO2.
Once you accept the fact that warming causes increased atmospheric CO2, and not vice-versa, you will see that the entire CO2=catastrophic AGW hypothesis is falsified.
You’ve come to the right place to learn the truth. Good for you.

hyper.real
October 12, 2010 1:50 pm

@vukcevic says:
October 11, 2010 at 2:07 pm
Well I think I may have an answer:
http://www.vukcevic.talktalk.net/LFC20.htm
“Dotted white lines mark regions where rising tides of hot air indirectly create the bright, dense zones in the [plasma] bands.”
Have you considered the possibility that you have cause and effect reversed? The even longitudinal spacing of the bright zones, together with the apparent lack of association with underlying topology would tend to disconfirm rising hot air as the cause.

October 13, 2010 12:58 am

hyper.real says: October 12, 2010 at 1:50 pm
…………..
Not, I have not, it is direct quote from NASA. I can reassure you they know about these matters far more than I do, and I suspect they know more than an average reader of this blog.
http://www.nasa.gov/centers/goddard/news/topstory/2006/space_weather_link.html
Quote ”Dotted white lines mark regions where rising tides of hot air indirectly create the bright, dense zones in the bands.” is in bold italics next to the illustration.
The link to NASA’s was and is available in my illustrated article.

October 13, 2010 1:35 am

Owen says: “It will be interesting to see how low the tropospheric temps go as the full la nina develops. What if they don’t set all time lows? What can be said then?”
The TLT anomalies of the mid-to-high latitudes of the Northern Hemisphere took an upward step after the 1997/98 El Nino. The rest of the globe did not.
http://bobtisdale.blogspot.com/2009/06/rss-msu-tlt-time-latitude-plots.html

October 13, 2010 1:38 am

Gary Gulrud
Hi Gary, Yes, its the long sought link and indeed a breakthrough. Still working away at the ramifications of it and I will have a comprehensive paper in due course. And thank you for your continuing interest.

Paul Vaughan
October 13, 2010 3:45 am

“Researchers now want to understand whether the effect changes with seasons or large events, like hurricanes. “
http://www.nasa.gov/centers/goddard/news/topstory/2006/space_weather_link.html
Good find vukcevic.

Erl, thanks for the stimulating notes.
Bill Illis, thanks (as always) for illuminating notes.

George E. Smith
October 13, 2010 7:07 pm

“”” Steve W says:
October 12, 2010 at 10:27 am
Seeing at there are a lot of climate change sceptics positing here, I wondered which of the following statements people disagree with:
1. CO2 is a greenhouse gas. (measurement in isolation, atmospheric CO2 record tracked by temperature record)
2. CO2 is at it’s highest level in the atmosphere for 400,000 years
3. Concentration increases of CO2 in the atmosphere track well to known human production of CO2 (industrial, slash & burn agriculture, etc.)
Thanks. “””
Well Steve one thing I am not is a climate change skeptic; but I’ll address your question anyway.
As to number one CO2 most certainly is a greenhouse gas, as that term is used in climatism; but I would idsagree with the second part of #1 in brackets. If you have been monitoring CO2 and Temperature for the last 400,000 years then you know full well that in fact it is the CO2 record that tracks the Temperature record; and not as you have stated it; so you have the cause and effect reversed; so nyet on #1.
Well a nyet on #2 as well,; CO2 is about as low as it has ever been in the last 600 million years and by a factor of at least 20 times smaller than its highest levels all of which was survived by life on earth, whcih actually flourished under high CO2.
#3 I might give you a true on; but then human population also tracks with the CO2 increase so is the CO2 the cause of the Human population increase ?
Correlation does not prove causation.
I’m familiar with a correlation between Experimental Observation, and Theoretical Derivation in which the agreement is to better than one part in 10^8; how does that grab you for correlative tracking. And I also know that the theory in that instance is quite wrong; absolutely fraudulent in fact; and yet it tracks with experiment to a part in 10^8.
So be carful what you buy into, based on statistical lying with number manipulation.

Steve W
October 14, 2010 2:56 pm

On point 1, there seesms to be agreement here that CO2 follows temerature and not the other way round. I’d like to understand your mechanism for that. There’s a mechanism for temperature following CO2 (Its greenhouse gas effects can be measured in a laboratory bell jar) after all, but more likely an anti-mechanism for CO2 to follow temperature (increased plant life from higher temerature absorbs CO2)
So what is your mechanism for CO2 following temperature?
On point 2, I’m well aware that CO2 consentrations are very low for the longer term (600m years) history of the planet, Temperatures were also very different Higher then. I focussed on the last 400k years because that is a preiod that’s somewhat easier to measure via direct trapped air measurements in ice, vs chemical compositions of rocks.
Point 2 question again is: do peole here accept that CO2 levels are at a higher level than at any time in the last 400k years?
Point 3, Is do people accept the correlation between the amount of CO2 released to the atmosphere by human activites and the increased concentration of CO2 in the atmosphere as measured in point 2?
Note that at no point do I say or think that the climate was static before the industrial age, nor do I say or think that humans won’t cope just fine with an average temperature increase of 2 to 5deg C over the next 100 years.
I do however think that it’s idiotic to draw a line through 10 years of data and project it out 100 years (where was the temperature measured anyway?)
I also think it’s idiotic to say that a single La Nina event and associated cold winters indicates that climate change isn’t happening.
The subject is obviously very complicated has a lot of latancy (No plot should have only 10 years on the x axis, especially when data is availbaly for much longer periods), and have many drivers (solar cycle for example). There are also strong mechanisms that could counteract warming as they have in the past (Younger Dryas) hence I the description should be climate change rather than global warming.
So I’m still interested in responses, especially if ther is good data backing your points of view.
Thanks