In comments on WUWT, people often think freely and throw out all sorts of ideas. Like in any collection of people, some are bad, some are average, a few are good, and even fewer are noteworthy. However, one that was noteworthy recently was from a WUWT regular known as “hotrod” in the “NASA Deep Solar Minimum” thread.
The thing that has been nagging at me is, that the trace of a rogue wave in this link, looks a lot like the 1998 temperature spike. On thinking about it, if a [rogue] wave is possible in the ocean, is it not conceivable that the same sort of behavior could exist in an average temperature plot for a body like the earth, as it oscillates around an average temperature? This like the PDO and AMO are just different types of periodic motion.
He was referring to what has now become known as the Draupner Wave, named for the oil platform that recorded it on January 1st, 1995.
In the case of the Draupner Wave, it has an amplitude about 3x that of the average background wave amplitude. It was created when the amplitudes of some waves of dissimilar amplitude and period combined in sync to form a new wave peak for an instant. That instant passed and the sea went back to normal background amplitude.
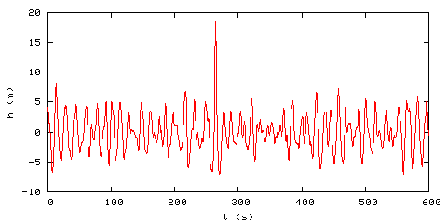
In the case of the 1998 Super El Niño, there is a similar sort of event where the temperature peak is about 3x that of the background peaks. This plot of the RSS Global Temperature Anomaly below (done by Barry Wise) shows the 1998 super event in red:

Barry writes:
The 1997/98 El Niño temperature spike seems to have had a long lasting effect that is dissipating. This graph shows what the trend was before the event and how the trend was affected by it. The dashed red line is the trend with all of the data and the purple is the trend based on the data before the area highlighted in red. Notice that there appears to be a decaying oscillation. If correct we’re in the third peak which is less than the previous two, and is much closer to the purple trend line.
[Note: I should point out that Barry’s method creates a different result than if the 97/98 El Nino data is removed, and before and after trend lines are plotted (h/t to Tom P) the resultant effect of the 1998 Super El Niño is less apparent. See comments for more discussion.]
Certainly there appears some similarity between the Draupner Wave and the 1998 Super El Niño worldwide temperature spike. And certainly we have a number of periodic systems and forcings going on here on Earth that are sinusoidal by their nature. They span short (high frequency) and long (low frequency) periods. Here are a few that I’ve thought of, short and long, but by no means is it a complete list.
Diurnal solar insolation and temperature variation, daily and monthly lunar tide cycles, seasonal variation of solar insolation by hemisphere, seasonal variation of temperatures by hemisphere, seasonal biomass variations, seasonal sea ice variations, seasonal albedo variations, 11 and 22 year solar cycles, Earth’s length of day variations, El Nino Southern Oscillation, North Atlantic Oscillation, Pacific Decadal Oscillation, Atlantic Multidecadal Oscillation, and at very long periods, Milankovitch cycles.
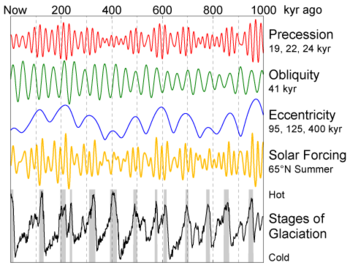
There are many many cycles on earth that are known, some yet to be discovered. Almost all of them have a root cause in periodic circular motions such as planetary rotation and orbital motion in our solar system and the variances of orbital eccentricity, obliquity, and precession. For example, the graph below shows how these different waves eventually synchronize to cause cycles of ice ages on earth.
To illustrate how sinusoidal cycles can conspire to produce peaks and valleys in amplitude, this interactive Java sinusoidal generator allows you to combine three different waves of varying phase, amplitude, and wavelength and see the resultant wave that forms from them:

During my limited experimentation above I couldn’t get the generator to produce a Draupner type wave, but as you can see in the screencap above, I was able to illustrate how a new peak can be generated (in blue) that is larger than any of the source wave peaks.
Here is an example of how “wave focusing” can occur to produce a Draupner type peak:

Lest you think this essay is about childs play with sinusoids, I’ll point out that there have been some serious works done on the mathematics behind the creation of “rogue waves”. For example there’s this brief discussion from the link commenter “hotrod” originally provided:
BBC Two, on November 14, 2002, aired a program on this phenomenon and its recent mathematical analysis. Freak waves, also “rogue waves,” “monster waves,” are extraordinarily tall and steep waves that appear sporadically and wreck havoc with shipping. One is suspected to have washed away the German cargo München which went down with all hands in the midst of a routine voyage in 1978. More recently, the cruise ship Caledonian Star was struck by a 30m wave on March 2, 2001. The standard analysis of ocean waves predicts a Gaussian-like distribution of heights; extreme heights, although possible, should be very rare – a 30m wave is expected once in ten thousand years, according to the BBC. But these waves occur much more frequently than predicted. The program focused on new methods of analysis, and on the work of the mathematician A. R. Osborne (Fisica Generale, Torino). Osborne has applied the inverse scattering transform, which he describes as “nonlinear Fourier analysis,” to the time series analysis of wave data. He conducted simulations using the nonlinear Schrödinger equation and found near agreement with the standard analysis, except that “every once in a while a large rogue wave rises up out of the random background noise.” His paper, available online, gives an example of such a simulation:

From CIM Bulletin #14 at http://at.yorku.ca/i/a/a/h/51.htm
Here’s a paper (PDF) on the Draupner wave titled: THE SHAPE OF THE DRAUPNER WAVE OF 1STJANUARY 1995 from Paul Taylor, Department of Engineering Science, University of Oxford. Taylor did a mathematiucal analysis of the Draupner wave, created a model to approximate the formation of it, and concluded that: “The New Year wave is ~ 1 in 2×10^5 waves” which when you think about it, makes it fairly common especially when you view it in context to images like the one below:

So it seems that such amplified rogue waves are fairly common in the nature of our oceans. That’s quite a journey from them one time being considered “mystical” by science.
Another scientific paper (PDF) of interest is: Physical Mechanisms of the Rogue Wave Phenomenon by Christian Kharif and Efim Pelinovsky of IRPHE in France and the Institute of Applied Physics in Russia, respectively. They conclude (emphasis mine):
All the physical scenarios of possible extreme wave generation (focusing, wave-current interaction, modulational instability), in fact, were known but only now (during the last 5 years) they are “dressed” by mathematical models of various levels (linear, weakly nonlinear, fully nonlinear models). Results of numerical simulations show the behaviour of each mechanism taking into account the random character of the wind waves in the ocean. Computations provide also the probability of rogue wave occurrence for simplified conditions. The many results are very sensitive to the model parameters (shape of wave spectrum, various corrections of the weakly nonlinear evolution models, accuracy of numerical schemes for long49 time computations).
Given that rogue waves were once thought to be the fantasy of imaginative sailors and fishermen, and given that science has now only addressed the problem once one was measured in 1995, it illustrates how something once thought to be impossible is now possible once it is measured, better understood, and studies published about it.
By the same logic, things like the Pacific Decadal Oscillation weren’t discovered until fairly recently. The PDO was named by Steven R. Hare, of the University of Washington, who noticed it while studying salmon production patterns (See BAMS article, PDF). Almost simultaneously the PDO climate pattern was also found by Yuan Zhang. This happened in 1997. It is one more natural cycle added to the many that were already known such as the El Niño-Southern Oscillation (ENSO) and the North Atlantic Oscillation (NAO)
Perhaps it is not an unreasonable to consider that on occasion, some of these cycles conspire to produce extreme ocean events like the 1998 Super El Niño.

And, given the difficulty in predicting exactly when natural cycles might coincide to produce such an event, perhaps this is why they are so hard to predict. For example, there was Dr. James Hansen’s 2006 prediction about a “super El Niño” that would rival the 1983 and 1997-1998 El Niño events.
In March 2006, Hansen wrote a paper claiming the following:
We suggest that an El Niño is likely to originate in 2006 and that there is a good chance it will be a “super El Niño”, rivaling the 1983 and 1997-1998 El Niños, which were successively labeled the “El Niño of the century” as they were of unprecedented strength in the previous 100 years.
We all know now that prediction was a bust. While there was in fact a 2006-2007 El Niño event. In the words of climatologist Mike McPhadden the event:
“started late, ended early and was below average strength”
Hansen’s prediction of a “super” event “rivaling the 1983 and 1997-1998 El Niños” never came true. Undeterred, Hansen is still predicting the onset of an El Niño event that will drive global temperatures to a new record high in 2009 or 2010. (h/t to Roger Pielke Jr on Prometheus)
Perhaps the applications of the studies of rogue ocean waves might be useful in figuring out if the 1998 event was in fact a synchronicity of natural cycles, linear, non-linear, and chaotic for a brief time, and if so, applied towards forecasting future super El Niño and La Niña events. I think it is worth considering. – Anthony
In all things there is a law of cycles.– Publius Cornelius Tacitus (55-117) Roman historian.
Discover more from Watts Up With That?
Subscribe to get the latest posts sent to your email.
and the same could be said for rogue waves, except the color would be different.
Isn’t that what synchronized chaos was all about?
http://wattsupwiththat.com/?s=synchronized+chaos
Climate has a lot more differential equations driving it than waves in the sea.
Look at the figures in:
http://www.uwm.edu/~kravtsov/downloads/GRL-Tsonis.pdf
to see how el Ninos can arise.
Watch out for oceans bearing cosmetic powders!
Rouge . . . rogue . . . whatever . . . blasted spellcheck! 😉
REPLY: Thanks, I fixed that. Funny how technology can aid us in getting things wrong. – Anthony
The Schrodinger wave equation predicts the existence of these occasional very strong waves, and describes them well. – M of B
REPLY: Yes it does, and it is referenced in the peer review paper as well as the Wiki article I cited – Anthony
Wow I am humbled that you thought my random observation was worthy of a full article!
As you commented, sometimes you just trip over something that seems remarkably similar to something else locked away in the memory closet. As Sir Winston Churchill commented:
Thank you for providing a forum where like minded, highly curious people can share their thoughts with others who have the means and skills to investigate them properly. Many times these random thoughts are dead ends in and of themselves, but even when you are wrong, you learn something interesting when you discover why.
The breadth of knowledge, skills and experience, found on this forum never cease to amaze me. One of the strengths of the internet is it allows people to step out of their stove pipe specialties and allows folks to talk to and listen to people they would never ever meet in real life.
Larry
REPLY: I often think that the ratio of good ideas to bad ones is usually about 1 to 100. Even the best scientists make mistakes. All ideas are simply educated guesses until proven otherwise. Unfortunately, for adversarial positions and common trolls, citing the bad ones is often the tool of choice. Let’s hope this one turns out well. We could both be wrong, all I ask is further investigation to find out. – Anthony
Lighthouse keeper O’Driscoll reported a wave splashing into the 177 ft (54 metres) high light at the top of the lighthouse.
The Fastnet Lighthouse, Light on a lonely rock The Economist, Dec 18th, 2008
And in fact what is to prevent it from being “rogue data”, thrown in to confuse things. I would be more believing it were real if it weren’t for the danged truth that most fudge seems to be one sided. This one spike biases the entire thinking ‘hot’.
As an engineer, when data like this shows up, the first response is to ignore. It would take another similar occurrence to get attention. Something to keep in mind: Measuring is a not an exact science.
Didn’t we just recently learn the ice extent sensors went bad and no one noticed for months?
To explain the 1998 temperature spike, you need more than the 1997-98 El Nino.
Although it was big one, it wasn’t especially out of the ordinary as there was other big El Ninos such as in 1982-83 and other years which didn’t produce nearly the impact.
http://img258.imageshack.us/img258/2453/nino1974.png
If you add in the super spike that the AMO had as well in 1998, you can get closer to the impact.
http://img258.imageshack.us/img258/2434/amo1974.png
There are other super temperature spikes in the record – 1878, 1915, 1941, 1973 among others. These seem to occur (more often anyway) when both the ENSO and the AMO spike at the same time.
In terms of the rogue wave idea, there is something called atmospheric angular momentum which could be the driver. During El Ninos, the earth’s rotation literally speeds up (a few tenths of a millisecond) which happens when the winds slow down and potentially causes warmer Pacific ocean waters to backup into the El Nino region. There is a strong correlation actually but there are times when it seems to be off quite a bit.
http://img15.imageshack.us/img15/8463/aamnino34.png
OT and I’m sure one of the bad ideas mentioned above – but since I was a teenage I’ve been heavily into Archeology. Yesterday while day dreaming I suddenly wondered if the Aztecs idea that the world had a 52 year cycle at which time the world may end had anything to do with planetary cycles they had witnessed over the centuries:
http://en.wikipedia.org/wiki/New_Fire_ceremony
Your timing is uncanny. I had a friend who was skim boarding in Baja 5 years ago and was hit by a rogue wave that fractured his arm and 3 vertebrae. And just yesterday I used that example to explain not just the 1998 spike but the 80’s and 90’s un-coupling of temperatures with solar output. NOAA’s Rodney Viereck in 2001 wrote about the solar connection to ocean heat content http://www.oar.noaa.gov/spotlite/archive/images/sunclimate_3b.gif
but it has been argued that the temperatures have since decoupled from the solar trend and that is the proof for AGW.
Wunsch has stated that there is no way to predict when heat will be released from the oceans. I see the release of ocean heat as a wild card that confounds most linear correlations and simplistic attributions. I think the AGW team has simply confused “ocean weather”caused by rogue waves, etc. missing the bigger picture of variable “ocean climate”.
For that matter I think they confused “solar weather” with “solar climate”. The AGW folks like to say the past 25 years of satellite solar data eliminates any climate correlation with the sun. As susnspot activity continues to be depressed they may see the past 25 years was just a brief glimpse of “solar weather”, there is a bigger picture they have ignored.
In his book “The Selfish Gene” Richard Dawkins mentions the idea of a “meme”. A meme is a piece of information that is passed from one person to another. So conversation, however it takes place, online, in the pub, in business meetings is mixing memes similar to the way that genes are mixed in mating.
Most meme mixes end up as of average interest, some are stupid and some are brilliant. Well done Hotrod for putting 2 & 2 together so well and to Anthony for acting on it. I, like every other contributor, hope one day to add two thoughts (memes) together that will make a difference to the way that we perceive the world.
Bill Illis: A clarification, please. Atmospheric angular momentum lags ENSO by a month or two, doesn’t it?
I would *completely* buy the notion that there are several different cycles of things going on at more or less their own pace (though they can influence each other somewhat) and at times they all add up or can cancel each other.
It is also somewhat silly for people such as the IPCC to take a decadal trend and project it a century into the future but that is what happens when you get railroad engineers managing a climate policy.
Those waveforms remind me very much of the Decca Navigator System. “Standing waves” would be generated by distant phase locked transmitters operating in the very low frequency band of around 14.2kilohertz. The system fell out of use with the arrival of GPS.
“[…] random character of the wind waves in the ocean.”
There’s another assumption to challenge.
“Computations provide also the probability of rogue wave occurrence for simplified conditions.”
Emphasis on “simplified”. Look at the current financial crisis for evidence of bad distribution-tail assumptions.
The many results are very sensitive […]”
With websites like ‘Watts Up?’, could we be approaching an era when children grow up fully aware of Lorenz’s contribution?
– – – – – – –
Re: anna v (10:06:46)
It is research funding, computers, & a collection of human minds, among other things, that are being driven by the abstractions known as differential equations. The danger I see, after 12 years of formal study in 5 disciplines, is in overlooking the limitations of abstract constructs (or worse: denying that such limitations exist despite lucid awareness).
– – – – – – – – – – –
This “rogue wave” article was a brilliant idea. The concept is tangible – widely accessible.
Now the truth is exposed for all to understand:
a) Spatiotemporal heterogeneity exists.
b) Earth is a multi-scale integrator.
c) Radical reorganization occurs without radically-altered inputs.
The simplicity only gets lost in translation (to the mathematical language).
Modelers have my best wishes – and sympathy.
– – – – – – – –
http://ivs.nict.go.jp/mirror/publications/ar2003/acoso/img1.gif
From: http://www.uah.edu/News/sciencenow/
Most powerful cosmic explosion brightens student’s 1st day on job
Adam Goldstein’s first day on the job tending the Gamma-ray Burst Monitor (GBM) instrument on NASA’s Fermi Gamma-ray Space Telescope was a doozy.
A graduate physics student at The University of Alabama in Huntsville, Goldstein was still learning the ropes the evening of Sept. 16, 2008, nearing the end of his 12-hour on-call shift when the GBM called his cell phone to signal that a burst had been detected.
That in itself wasn’t remarkable: GBM detects about one burst a day and it keeps Goldstein’s cell phone number handy, along with those of the other GBM team members.
This burst, however, lasted 23 minutes � almost 700 times as long as the two-second average for high-energy gamma-ray bursts. And that was just for starters.
“I was in class the next morning when Alexander (van der Horst, a NASA post-doctoral fellow) called me up and told me the LAT (Fermi’s Large Area Telescope) had found photons from that same burst,” Goldstein recalls. “At the time, when you get a burst you oooh and aaah but it’s not until you can sit down and do the spectral analysis that you know what you’ve found. And if another instrument looked at it, then you’ve got the chance to do some real science.”
The first significant gamma-ray burst detected by the LAT (Fermi was lifted into orbit in June), this burst bursts with superlatives. When the analysis of spectral data collected by a telescope on the ground was finished in November, the burst’s “red shift” put its point of origin about 12 billion light years from Earth. (Seen from Earth it came from just below the star Chi Carina in the southern sky.)
When that distance is factored with the burst’s brightness at the Fermi sensors, it becomes the most powerful gamma-ray event ever detected � four times as powerful at the source as the second strongest burst ever detected, said Dr. Valerie Connaughton, a scientist in UAHuntsville’s Center for Space Plasma and Aeronomic Research (CSPAR) and a member of the GBM team.
“This is the most spectacular burst ever seen at high energy,” she said. “If the event that caused this blew out in every direction instead of being a focused beam, it would be equivalent to 4.9 times the mass of the sun being converted to gamma rays in a matter of minutes.”
This theory-bruising burst is the subject of research published today in “Science Express,” the on-line scientific journal of the American Association for the Advancement of Science. A collaborative effort by more than 250 scientists around the world, it is the first gamma-ray burst findings to be reported from the Fermi telescope.
The day after the burst, when Goldstein learned that his first burst was noteworthy, he called his parents in Pineville, Missouri, to share the news that his dreams were coming to fruition.
“The next day I talked to them when I found out what a big deal it was,” said Goldstein, who is completing a catalogue of gamma-ray burst data from an earlier orbiting detector as part of his thesis research. “I have always wanted to work with NASA, so for me this is an ideal place to be.”
Goldstein’s enthusiasm has spread to his family. One of the “honors” accorded a scientist when a burst is seen on his or her shift is the responsibility of writing a circular describing the burst’s coordinates and characteristics for the Gamma-ray burst Coordinates Network (GCN). Since posting his description of the Sept. 16 burst, Goldstein said, his father Scott has taken to routinely checking the GCN to see if his son has posted anything new.
The Sept. 16 burst is a theory bender because theories developed to explain gamma-ray bursts � believed to be the most powerful explosions since the Big Bang � don’t “allow” some of the behaviors seen by the Fermi instruments.
This includes the 23-minute duration. Roaring through space for 12 billion years tends to s-t-r-e-t-c-h waves of electromagnetic energy. Accounting for that stretching means the burst was a solid four minutes in duration when it was created.
“It is difficult to imagine keeping a central gamma-ray �engine’ active for that period of time,” said Dr. Michael Briggs, a CSPAR scientist and GBM team member.
Another problem is in the energy itself. Most gamma-ray bursts start hot with high-energy gamma rays, then fade to progressively weaker rays. The Sept. 16 burst started “cool,” with the high-energy gamma rays showing up almost five seconds later. That wasn’t expected.
And the burst had both high and low energy photons at the same time for about 200 seconds (also not expected), said Briggs. “It means everything that created both sets of rays happened in the same space at the same time, which is very difficult to explain.”
After not quite three and a half minutes the cooler gamma rays became too weak to detect, but the high-energy rays continued for at least 20 more minutes. (It was still going when the burst moved out of the LAT’s field of view.) If the cataclysmic cosmic event that caused the burst was fading away, why would the weaker gamma rays disappear while the strong ones stick around?
Gamma rays are at the highest end of the energy spectrum, with as much as one million times as much energy per photon as X-rays. Gamma-ray bursts are believed to come from dying stars that explode or collapse, potentially releasing as much energy in a few seconds (or minutes) as our sun will generate in billions of years.
Goldstein was the first (and is still the only) UAHuntsville graduate student to join the GBM team but several post-doctoral students have joined since the success of his first night, swelling the team to about ten. While the GBM instrument notifies team members and other scientists around the world when it detects a burst, someone has to be on-duty tending the instrument at all times. This responsibility is rotated in 12-hour shifts between the team in UAHuntsville’s Cramer Hall and scientists at the Max Planck Institute in Germany.
And: http://www.princeton.edu/pr/news/98/c/1019-clips.htm
Astronomy
Copyright 1998 Kalmbach Publishing Company
November, 1998
HEADLINE: Souped-up supernova: hypernovae may spark gamma-ray bursts.
Gamma-ray bursts have left astronomers scratching their heads ever since they were discovered by U.S. military satellites in the late 1960s. Part of the mystery was solved last year when astronomers found that these bursts emanate from galaxies billions of light-years away. But what exactly triggers these explosions, which can release 1,000 times more radiation than supernovae? A gamma-ray burst and a supernova recently flared from the same patch of sky, strongly suggesting that at least some gamma-ray bursts are triggered by stellar explosions. “This could be the missing link between supernovae and gamma-ray bursts” says astrophysicist Stan Woosley of the University of California, Santa Cruz.
On April 25, two satellites, BeppoSAX and the Compton Gamma Ray Observatory, detected the gamma-ray burst in the southern constellation Telescopium. On May 2, Dutch astronomers spotted Supernova 1998bw flaring in a spiral arm of a galaxy 120 million light-years away, in the same area as the April 25 burst. “The probability of a chance coincidence between the gamma-ray burst and Supernova 1998bw is well below one in ten thousand,” says Princeton University astronomer Bohdan Paczynski.
Supernova 1998bw is perhaps the most peculiar supernova ever seen. Astronomers were startled by radio observations showing material racing outward at nearly the speed of light, suggesting an explosion much more powerful than most supernovae.
Perhaps this event was a “hypernova”– a term Paczynski coined in 1997 to describe stellar explosions 100 times more powerful than supernovae. While nobody knows exactly how a hypernova would work, Woosley has published a theoretical model in which a massive, rapidly rotating star collapses at the end of its life to form a black hole. The black hole voraciously accretes matter from a surrounding disk, powering twin, high-speed jets that slam into surrounding interstellar gas and generate a gamma-ray burst. …
We’ve all scratched our heads at those stick and seashell “maps” the Polynesians used to navigate between islands, wondering at how the experienced navigators could locate themselves using just the patterns of the waves seen from a canoe. The Kiberg aerial photo above puts some context around those maps. I’ve seen the same patterns from the air around some coasts, and you could tell there was an island or several just from patterns even when visibility was haze limited.
OT some curious hedging in the latest Catlin update, with ‘bad weather’ on the horizon.
http://www.catlinarcticsurvey.com/live_from_the_ice.aspx
“Today the team continued to navigate towards the runway identified on satellite imagery by the Operations team. Having covered 7.75km, they anticipate reaching their destination and beginning a thorough detailed search of the area at around midday.
All team members are in very high spirits and are looking forward to the excitement of the forthcoming resupply. However, a front of strong winds and bad weather on the horizon, heading their direction and may yet interfere with the resupply schedules. Due to the nature of the terrain, the environment and the logistical elements of the operation, contingency planning is essential in the Polar regions, so all team members are on standby for last minute changes as plans D, E, F and G may be implemented. “
Dan S (10:51:12)
“[…] 52 year cycle […]”
Dan, you may be interested to know that I find a 52 year signature, along with its harmonics, in geophysical time series. The features are noticeable even during precursory exploration – and they are easily related (no causation being advocated here) to what some may consider “provocative” theories.
To be clear: I am not making claims about causation – only reporting observation (like the so-called ‘mythical’ rogue waves).
OT
Scientific American. Ice bridge in Antarctica collapses. Yep. Global Warming.
http://www.sciam.com/article.cfm?id=ice-bridge-holding-antarc
Bill Illis (10:50:37) :
“In terms of the rogue wave idea, there is something called atmospheric angular momentum which could be the driver. During El Ninos, the earth’s rotation literally speeds up (a few tenths of a millisecond) which happens when the winds slow down and potentially causes warmer Pacific ocean waters to backup into the El Nino region. There is a strong correlation actually but there are times when it seems to be off quite a bit.
This seems very logical to me and up to now the only explanation.
LOD changes could provoke this too.
The 1983 El Nino was masked by the El Chichon eruption. Looking at the NINO34 index it was on par with the 1997 El Nino.
http://home.casema.nl/errenwijlens/co2/ninoforecast.gif
The similarity of 1972-1983 with 1997-2008 is striking, only that the 2008 El Nino did not aterialize, in fact it was a big negative spike. I don’t see this super el nino developing soon. The final verdict however can only be made after 2023.
Hansen needs his super el nino to occur very soon now…
While I haven’t researched it a thought about cycles occurred to me last night. In a follow on post to the one you referenced, I linked to a plot a made of trends for Hadley of various lengths. The point of which is that there is a distinct sinusoidal pattern with a 60 year wave length of trends that becomes very evident when you get around lengths of 20 -30 years. I started to wonder about longer length patterns, but there isn’t any global temperature data going back that far. But roughly, if the MWP was 1000 AD and LIA 1500 and assuming we’re in the MWP2 (another 500 years) there should be a similar peak and trough at 0 AD and 500 AD respectively. That would mean we’re at the peak of at least a 1000 year wave and a 60 year wave. What other patterns might have synced to produce the warming since 1900?
From my oceanography courses, wave oscillations that are convergent would create larger ones. I don’t see why something similar wouldn’t be applicable when talking about all the systems at play that affect our climate.
I had one of those “V8” moments when I read that comment as it struck as one of those “truisms”.
I don’t suppose the initiating event for this has anything to do with high Antarctic ice levels…nah, it has to be AGW (according to unScientific American)…
Ice bridge holding Antarctic ice shelf cracks up
http://www.sciam.com/article.cfm?id=ice-bridge-holding-antarc