In comments on WUWT, people often think freely and throw out all sorts of ideas. Like in any collection of people, some are bad, some are average, a few are good, and even fewer are noteworthy. However, one that was noteworthy recently was from a WUWT regular known as “hotrod” in the “NASA Deep Solar Minimum” thread.
The thing that has been nagging at me is, that the trace of a rogue wave in this link, looks a lot like the 1998 temperature spike. On thinking about it, if a [rogue] wave is possible in the ocean, is it not conceivable that the same sort of behavior could exist in an average temperature plot for a body like the earth, as it oscillates around an average temperature? This like the PDO and AMO are just different types of periodic motion.
He was referring to what has now become known as the Draupner Wave, named for the oil platform that recorded it on January 1st, 1995.
In the case of the Draupner Wave, it has an amplitude about 3x that of the average background wave amplitude. It was created when the amplitudes of some waves of dissimilar amplitude and period combined in sync to form a new wave peak for an instant. That instant passed and the sea went back to normal background amplitude.
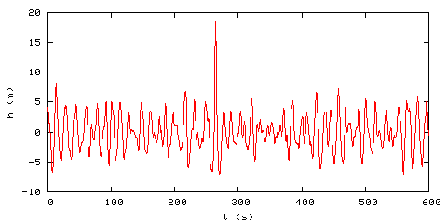
In the case of the 1998 Super El Niño, there is a similar sort of event where the temperature peak is about 3x that of the background peaks. This plot of the RSS Global Temperature Anomaly below (done by Barry Wise) shows the 1998 super event in red:

Barry writes:
The 1997/98 El Niño temperature spike seems to have had a long lasting effect that is dissipating. This graph shows what the trend was before the event and how the trend was affected by it. The dashed red line is the trend with all of the data and the purple is the trend based on the data before the area highlighted in red. Notice that there appears to be a decaying oscillation. If correct we’re in the third peak which is less than the previous two, and is much closer to the purple trend line.
[Note: I should point out that Barry’s method creates a different result than if the 97/98 El Nino data is removed, and before and after trend lines are plotted (h/t to Tom P) the resultant effect of the 1998 Super El Niño is less apparent. See comments for more discussion.]
Certainly there appears some similarity between the Draupner Wave and the 1998 Super El Niño worldwide temperature spike. And certainly we have a number of periodic systems and forcings going on here on Earth that are sinusoidal by their nature. They span short (high frequency) and long (low frequency) periods. Here are a few that I’ve thought of, short and long, but by no means is it a complete list.
Diurnal solar insolation and temperature variation, daily and monthly lunar tide cycles, seasonal variation of solar insolation by hemisphere, seasonal variation of temperatures by hemisphere, seasonal biomass variations, seasonal sea ice variations, seasonal albedo variations, 11 and 22 year solar cycles, Earth’s length of day variations, El Nino Southern Oscillation, North Atlantic Oscillation, Pacific Decadal Oscillation, Atlantic Multidecadal Oscillation, and at very long periods, Milankovitch cycles.
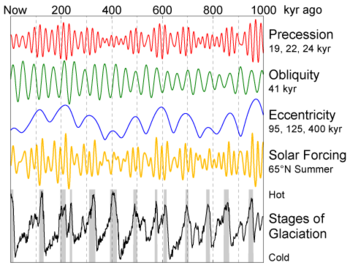
There are many many cycles on earth that are known, some yet to be discovered. Almost all of them have a root cause in periodic circular motions such as planetary rotation and orbital motion in our solar system and the variances of orbital eccentricity, obliquity, and precession. For example, the graph below shows how these different waves eventually synchronize to cause cycles of ice ages on earth.
To illustrate how sinusoidal cycles can conspire to produce peaks and valleys in amplitude, this interactive Java sinusoidal generator allows you to combine three different waves of varying phase, amplitude, and wavelength and see the resultant wave that forms from them:

During my limited experimentation above I couldn’t get the generator to produce a Draupner type wave, but as you can see in the screencap above, I was able to illustrate how a new peak can be generated (in blue) that is larger than any of the source wave peaks.
Here is an example of how “wave focusing” can occur to produce a Draupner type peak:

Lest you think this essay is about childs play with sinusoids, I’ll point out that there have been some serious works done on the mathematics behind the creation of “rogue waves”. For example there’s this brief discussion from the link commenter “hotrod” originally provided:
BBC Two, on November 14, 2002, aired a program on this phenomenon and its recent mathematical analysis. Freak waves, also “rogue waves,” “monster waves,” are extraordinarily tall and steep waves that appear sporadically and wreck havoc with shipping. One is suspected to have washed away the German cargo München which went down with all hands in the midst of a routine voyage in 1978. More recently, the cruise ship Caledonian Star was struck by a 30m wave on March 2, 2001. The standard analysis of ocean waves predicts a Gaussian-like distribution of heights; extreme heights, although possible, should be very rare – a 30m wave is expected once in ten thousand years, according to the BBC. But these waves occur much more frequently than predicted. The program focused on new methods of analysis, and on the work of the mathematician A. R. Osborne (Fisica Generale, Torino). Osborne has applied the inverse scattering transform, which he describes as “nonlinear Fourier analysis,” to the time series analysis of wave data. He conducted simulations using the nonlinear Schrödinger equation and found near agreement with the standard analysis, except that “every once in a while a large rogue wave rises up out of the random background noise.” His paper, available online, gives an example of such a simulation:

From CIM Bulletin #14 at http://at.yorku.ca/i/a/a/h/51.htm
Here’s a paper (PDF) on the Draupner wave titled: THE SHAPE OF THE DRAUPNER WAVE OF 1STJANUARY 1995 from Paul Taylor, Department of Engineering Science, University of Oxford. Taylor did a mathematiucal analysis of the Draupner wave, created a model to approximate the formation of it, and concluded that: “The New Year wave is ~ 1 in 2×10^5 waves” which when you think about it, makes it fairly common especially when you view it in context to images like the one below:

So it seems that such amplified rogue waves are fairly common in the nature of our oceans. That’s quite a journey from them one time being considered “mystical” by science.
Another scientific paper (PDF) of interest is: Physical Mechanisms of the Rogue Wave Phenomenon by Christian Kharif and Efim Pelinovsky of IRPHE in France and the Institute of Applied Physics in Russia, respectively. They conclude (emphasis mine):
All the physical scenarios of possible extreme wave generation (focusing, wave-current interaction, modulational instability), in fact, were known but only now (during the last 5 years) they are “dressed” by mathematical models of various levels (linear, weakly nonlinear, fully nonlinear models). Results of numerical simulations show the behaviour of each mechanism taking into account the random character of the wind waves in the ocean. Computations provide also the probability of rogue wave occurrence for simplified conditions. The many results are very sensitive to the model parameters (shape of wave spectrum, various corrections of the weakly nonlinear evolution models, accuracy of numerical schemes for long49 time computations).
Given that rogue waves were once thought to be the fantasy of imaginative sailors and fishermen, and given that science has now only addressed the problem once one was measured in 1995, it illustrates how something once thought to be impossible is now possible once it is measured, better understood, and studies published about it.
By the same logic, things like the Pacific Decadal Oscillation weren’t discovered until fairly recently. The PDO was named by Steven R. Hare, of the University of Washington, who noticed it while studying salmon production patterns (See BAMS article, PDF). Almost simultaneously the PDO climate pattern was also found by Yuan Zhang. This happened in 1997. It is one more natural cycle added to the many that were already known such as the El Niño-Southern Oscillation (ENSO) and the North Atlantic Oscillation (NAO)
Perhaps it is not an unreasonable to consider that on occasion, some of these cycles conspire to produce extreme ocean events like the 1998 Super El Niño.

And, given the difficulty in predicting exactly when natural cycles might coincide to produce such an event, perhaps this is why they are so hard to predict. For example, there was Dr. James Hansen’s 2006 prediction about a “super El Niño” that would rival the 1983 and 1997-1998 El Niño events.
In March 2006, Hansen wrote a paper claiming the following:
We suggest that an El Niño is likely to originate in 2006 and that there is a good chance it will be a “super El Niño”, rivaling the 1983 and 1997-1998 El Niños, which were successively labeled the “El Niño of the century” as they were of unprecedented strength in the previous 100 years.
We all know now that prediction was a bust. While there was in fact a 2006-2007 El Niño event. In the words of climatologist Mike McPhadden the event:
“started late, ended early and was below average strength”
Hansen’s prediction of a “super” event “rivaling the 1983 and 1997-1998 El Niños” never came true. Undeterred, Hansen is still predicting the onset of an El Niño event that will drive global temperatures to a new record high in 2009 or 2010. (h/t to Roger Pielke Jr on Prometheus)
Perhaps the applications of the studies of rogue ocean waves might be useful in figuring out if the 1998 event was in fact a synchronicity of natural cycles, linear, non-linear, and chaotic for a brief time, and if so, applied towards forecasting future super El Niño and La Niña events. I think it is worth considering. – Anthony
In all things there is a law of cycles.– Publius Cornelius Tacitus (55-117) Roman historian.
http://news.stanford.edu/news/2006/march1/ainansr-030106.html
“Flares hit Earth in 1998 and 2004”
In a 1999 issue of the journal Geophysical Review Letters, Inan and his STAR Lab colleagues reported the ionospheric effects of a giant gamma-ray flare from another star. It occurred on Aug. 27, 1998, in the middle of the night (as recorded at Stanford in the Pacific Daylight Time zone), but it ionized the atmosphere to levels usually found only during daytime.
Like a lighthouse whose spinning beam hits a specific point on shore at regular intervals, this neutron star had a periodicity. It spewed gamma rays every 5.16 seconds. “We observed the ionosphere respond to that,” Inan said. “The ionosphere was in fact pulsating at night.”
This is science at its best – seemingly unrelated observations leading to a(n) hypothesis requiring further observations, thinking, and refinement.
Who knows the outcome? But then the discovery of the “truth”, whatever it might be, is the primary goal, nothing more or less.
http://www.highbeam.com/doc/1P2-6654279.html
Newspaper article from our research archive:
See more articles from The+Milwaukee+Journal+Sentinel
Star surge: Massive blast from space hit Earth Gamma ray burst deflected by atmosphere is largest recorded beyond the sun
Article from:
The Milwaukee Journal Sentinel (Milwaukee, WI)
Article date:
September 30, 1998
Author:
| Copyright informationCopyright 1998 The Milwaukee Journal Sentinel. Provided by ProQuest LLC. (Hide copyright information)
A burst of radiation from a distant star smashed into the Earth’s upper atmosphere last month with enough energy to power civilization for a billion billion years, astronomers say.
The immense wave of energy, the most powerful ever recorded from beyond the sun, caused at least two satellites to shut down briefly, but it reached the Earth’s surface at a strength equal only to a typical single dental X-ray.
“We’ve been monitoring things like this for 30 years and we’ve never seen anything like this before,” Kevin Hurley, a research physicist at the University of California, Berkeley, said Tuesday. The burst of gamma and X-ray radiation struck the Earth over the Pacific Ocean at night on … “
Looking at the 1979-2008 UAH chart, if there were no Chichon and Pinatubo eruptions (decreasing the early average) and no 1998 super Nino (increasing the late period), there would be barely 0.2 °C temperature change during the 1978-2003. Quite consistent with high but stalling Sun activity after the 1910-1960 spike up.
So finally we realise that the spike in temperatures was due to an extreme El Nino. Of course this extreme also then cools the subsequent years (so you have to take out the peak and the tough). Guess that means global warming peaked very recently.
BTW there is something wrong with your trendline as almost all recent values sit well above the line. It looks like an extrapolation to me???
“Hansen is still predicting the onset of an El Niño event that will drive global temperatures to a new record high in 2009 or 2010”
And when this again does not eventuate the predictions will surely continue unabated with no apologies for the mistakes left behind. BBC and other media never seem to point out his errors.
Hmm the rogue wave event of Jan 1, 2005 seems conspicuously close to to earthquake / Tsunami event of Dec 26, 2004 to me. (I have seen speculation that that earthquake might have been triggered by a gravity wave from another major gamma ray burst which came through a day later, although going by the Oulu data the next major burst was a few weeks later on Jan 20,2005 (Ironically also had that drop spike drop pattern))
Speaking of the Oulu data, any thoughts on possible intractions leading to 1998 by the severe dropoff from mid-1991. Obviously if this has any relation it would need to be a very long lived one since the driver and driven response would be seperated by 6 to 7 years.
WUWT is risking to be prosecuted by the Inquisitionby insinuating again that barycentric nonsense hidden behind these wavy issue.
But, we´ll keep on saying: “E pur si muove”
What we need is all things in place, like Carsten A. Arnholm in their wonderful Solar Motion and Solar Simulator2 programs:
http://arnholm.org/software/index.htm
MarcH: “Hansen is still predicting the onset of an El Niño event that will drive global temperatures to a new record high in 2009 or 2010″….+-10 years
“…so all team members are on standby for last minute changes as plans D, E, F and G may be implemented. “
Plan D: Break out the freeze-dried hot-toddy mix that been lugged since the beginning, set fire to the radar machine and warm up three mugs full,
Plan E: shake hands and a round of hugs and warm, earnest goodbyes,
Plan F: break out the flares, shed a couple of layers so one can bend over and kiss their… goodbye…
Plan G: send the pre-constructed dataset that confirms the ice will be gone by the solstice and then bite down on the little pill packed for just this occasion….
for the record here is a site describing the graity wave theory
http://www.etheric.com/GalacticCenter/GRB.html
Ron de Haan (12:46:55) :
Like a lighthouse whose spinning beam hits a specific point on shore at regular intervals, this neutron star had a periodicity. It spewed gamma rays every 5.16 seconds. “We observed the ionosphere respond to that,” Inan said. “The ionosphere was in fact pulsating at night.”
All that talk about giant gamma-ray bursts is very interesting from the view point of gamma-ray astronomy, but it is most unlikely that the bursts have any weather or climate effects. The extra ionizations disappears on a time scale of seconds [otherwise one could not observe pulsations with a period of 5.16 seconds …], and the total energy was very low compared with what we get from the Sun. The various cosmic ray spikes [e.g. in 1991 and 2005] were due to flares on the Sun, not gamma-ray bursts from outer space.
Well I would be cautious about assigning the 1998 El Nino to a Draupner wave type of function.
The Draupner wave is essentially a standing wave pattern, which is the resultant of multiple travelling waves.
A Draupner wave phenomenon is well known to San Francisco Bay area boaters.
Just outside the Golden Gate Bridge there is a larger bay area bounded on the North by the Marin coastline. This area is commonly referred to as “The Potato Patch”. Wne you get ocean rollers and wind waves along with the GG currents, all of those travelling waves are going in several directions, and the Marin coastline drops relatively quickly into the water forming a reflective barrier, so there are waves all travelling in a lot of directions at once.
And when you try running a small boat (20 ft) through that area; what you find is that you cannot determine the dominent wave direction except for perhaps the long ocean rollers. Other than that you find that the water is “dancing”, and it simply pops up and down without moving in any direction; so ther id no boat speed or direction that is comfortable to run at. And that is the characteristic of standing waves. The waves in an organ pipe or on a violin string are standing waves formed by the interferrence (summation) of travelling waves going in opposite directions. The pipe or string is a transmission medium that propagates a certain wave velocity along it, and it also has a certain characteristic impedance.
On an electric transmission line such as a coax or parallel wirte line; the propagation velocity = 1/sqrt (LC) where L and C are the inductance and capacitance per unit length, and the characteristic impedance is sqrt(L/C) which works out to be Ohms if Henry’s and Farads are used for L and C (per unit length.
If the transmission line is terminated with an impedance equal to the characteristic impedance, the energy is absorbed in the termination, but if the lines is left open circuited, or short circuited, then a reflection occurs.
In the case where the line is open circuited, the reflected wave starts in phase with the incident wave so the amplitude steps up at the open end. In the short circuited case, the reflected wave is out of phase with the incident wave and the amplitude drops to dero at the termination. In either case a stadnign wave is formed between the incident and reflected waves.
So I don’t think there are any travelling waves in the climate sytem depicted by the temperature anomaly plots; so the 1998 El Nino is not likely to be a result of travelling wave superposition; but I do agree that it is likely to be a superposition of multiple climate effects that all hit it off together.
I must confess to having no understanding of just what physical phenomena result in either an El Nino, or a La Nina; but if I’m not mistaken, they typically manifest themselves in a localised climate pattern over a somewhat limited area of the Pacific to the West and south of Hawaii. So I am sure that the geographical structure of the pacific Basin is a primary factor in the phenomenon. The PDO on the other hand seems to be driven by somewhat more extended regional parameters. I don’t know beans about any of that, which is why I am not a climatologist.
George
DJ, a rogue wave has harmonics. Based on your logic, you would need to take those out too. Guess there hasn’t been any warming at all.
MattB (13:08:29) :“any thoughts on possible intractions leading to 1998 by the severe dropoff from mid-1991. Obviously if this has any relation it would need to be a very long lived one since the driver and driven response would be seperated by 6 to 7 years”
Henrik Svensmark & Nigel Calder, “The Chilling Stars”, p.77 graphs.
Driver and driven response: Sea water´s lag, after two drops in GCR, one in 1982 and the other in 1991.5
“Large patches of the Pacific and Indian oceans, and a region of the North Atlantic between Greenland and Scandinavia, show the strongest links between low cloud cover and cosmic rays”(Op.Cit.)
“”” DJ (13:06:22) :
So finally we realise that the spike in temperatures was due to an extreme El Nino. Of course this extreme also then cools the subsequent years (so you have to take out the peak and the tough). Guess that means global warming peaked very recently.
BTW there is something wrong with your trendline as almost all recent values sit well above the line. It looks like an extrapolation to me??? “””
What would be the physical phenomenon that causes an anomalous cooling following an anomalous warming.
Transient events that occur against a more or less steady background do not have to a zero net area. Presumably some transient energy increase caused the 1998 el nino; and whatever summation of sources created that anomaly; there is no requirement that they be a zero sum siuation.
So i think your assumption that 1998 el nino had to be followed by abnormal cooling has no physical basis.
George
BarryW (12:33:21) :
That would mean we’re at the peak of at least a 1000 year wave and a 60 year wave. What other patterns might have synced to produce the warming since 1900?
My favourite thinker of the month RayTomes produced this graph last year.
http://ray.tomes.biz/global-temp-cycles-human.png
It shows an impressively good hindcast fitting the temperature series, and a prediction for the next 30 years.
Although the cycles he used wouldn’t produce an el nino spike like 1998, you can see how a mixture of cycles can produce the ‘random looking’ variations in global temperature, taken on a running averae of 12 months or so.
Further on the subject of standing waves, the duration of a standing wave pattern is of the same order as the period of the travelling waves which caused it; and the 1998 el nino event contains a complete cycle in about 2 years maximum going by the graph above; so it would require travelling waves with a similar two year period to create a transient that also lasted two years total; and I don’t know what cyclic climate phenomena one sould propose that create multiple travelling wave phenomena at theat two year cyclic period.
So i think it was a chaotic event, that neverthe lesss resulted from multiple transient factors all summing in a favorable way.
George
Funny thing is that I saw a show on rogue waves a year or so ago. They have models for waves. Simple working linear models for simple phenomena.
There are examples of numerous large ships that have been crushed by huge rogue waves. The captains reported these events and weren’t believed. Well it turns out even these computer models were wrong. By handling the waves non-linearly they were able to predict the existence of rogue waves of a size reported by the captains of the numerous destroyed ships.
I don’t have any links unfortunately but its a case where computer models which were well known were unable to predict real natural phenomena.
—–
I was able to reconstruct the steig sat recon. It’s a lot of math but I got similar results.
http://noconsensus.wordpress.com/2009/04/05/steig-avhrr-reconstruction-from-satellite-data/
Adolfo Giurfa (13:41:32) :
Henrik Svensmark & Nigel Calder, “The Chilling Stars”, p.77 graphs.
Driver and driven response: Sea water´s lag, after two drops in GCR, one in 1982 and the other in 1991.5
Ironically next up on my list of books to get now that My Archibald Solar Cycle 24 has arrived
The way to look for the frequency components of a signal is to use a FFT. It seem odd to me that people just eyeball signals in the analog domain when the FFT is available. It is in excel.
Oldies around here will remember: It seems that such a rogue wave happened when putting off a radio receiver; just for an instant sound volume made a high peak…Hope nobody is doing the same with the Sun 🙂
DJ (13:06:22) :
If you’re referring to the purple trend line the trend is an OLS based on only the data prior to the 97/98 El Niño. The red is using all of the data. The dashed purple portion is an extrapolation of what the temps would look like without the super El Niño effects, and that part of the data is well above the purple trend line, but seems to be decaying back to that line.
In case someone is curious, I picked the start and stop points for the El Niño as close to the zero anomaly line as I could so they had some rationale since I didn’t have the data at that time. The official points probably differ.
The plot of the RSS trends with and without the data later than the 1998 El Nino is rather misleading – as DJ suggested the second line is an extrapolation from the data up to El Nino. There is certainly an argument to be made that a major event in a relatively short time series can skew the data, but it shouldn’t depend on ignoring the last eleven years of data! A simple way of determining how robust the value of the linear temperature trend is to the 1998 El Nino is to determine a new slope taking out just the points above the long term initial line.
As I have the UAH data to hand, I just removed all the data from October 1997 to February 1999. The result is a reduction of the linear trend from 0.0106 to 0.0100 degC/year. The reduction would be even less if the subsequent La Nina data were also removed.
Whatever the causes of the 1998 El Nino, it is doing very little to either enhance or mask any underlying long-term temperature trends.
REPLY: See Barry Wise’ response in this thread. Perhaps that will clarify it for you. – Anthony
Adolfo Giurfa (13:08:31) :
WUWT is risking to be prosecuted by the Inquisitionby insinuating again that barycentric nonsense hidden behind these wavy issue.
But, we´ll keep on saying: “E pur si muove”
What we need is all things in place, like Carsten A. Arnholm in their wonderful Solar Motion and Solar Simulator2 programs:
http://arnholm.org/software/index.htm
Many thanks for the compliments, but I can’t see any relation to barycenters in this story. And as has recently been shown in another thread here, the barycenter theory does not stand after close scrutiny. I thought it would, but it didn’t. Science is sufficiently fascinating, and the current thread is a good example of other lines of investigation we should be following. The talk about gamma ray bursts is very interesting for example.
REPLY: I am sufficiently sick enough of hearing about barycentric theory that anyone who posts anything else about it on this thread will have the post run through the byte grinder and reposted a collection of gobbledygook. Don’t make me go there. – Anthony