
From Dr. Roy Spencer’s Global Warming Blog
by Roy W. Spencer, Ph. D.
NOAA Climate Data Assimilation System (CDAS) July 2024 surface air temperature departures from 30-year normals, as of July 17, 2024 (graphic courtesy of Weatherbell.com).
That title might trigger some people, so let me explain. Yes, in a warming world due to increasing CO2 there will be a statistical increase in “unusually warm” years. But assuming the warming is entirely due to steadily increasing CO2 causing a slight (currently ~1%) energy imbalance in the climate system, then the warming that results is about ~0.02 deg. C per year.
Anything different from that small 0.02 deg. C per year warming is due to natural climate variability.
This can be easily demonstrated with a simple 1D energy balance model. Anything different is due to natural weather and climate variability.
If we take our UAH global lower tropospheric temperature product as an example, 2023 was a whopping +0.51 deg. C above the 1991-2020 average. Using our trend of +0.14 deg. C per decade as a warming rate baseline, then 2023 should have been +0.25 deg. C above the baseline, but instead it was twice as warm as that. So, about half that warmth was natural (AGAIN… assuming the background warming trend is 100% due to humans).
So, when we get a really warm year (like 2023, and probably 2024) then something other than CO2 is mostly to blame. All of the media and environmentalist hype is just noise. Really warm years will be offset by cooler years (which no one reports on because it’s not newsworthy) so that the long term temperature trends remains ~0.02 deg C per year of warming (+0.014 deg C per year in our satellite data).
Again, this assumes CO2 is 100% to blame for the long-term warming trend, and the 0.02 value assumes a climate sensitivity on the low end of IPCC projections, which is consistent with observations-based diagnoses of climate sensitivity; change it to 0.03 if you want, my point still stands.
It’s really that simple.
Wow! I have learned to detect a fraction of a degree change and a rising sea level of a penny thickness each year.
I am not all that scared except for freezing to death when my heat pump thing does not get the volts and amps from the snow covered solar farm panels or the windmills that just froze up.
Gums sends…
I don’t think anyone is saying that all of the 2023 anomaly can be explained by the long term warming trend, but as you yourself concede, at least half of the anomaly can be directly explained by CO2. Long-term CO2 driven warming makes the highs way higher.
And none of that diminishes the fact that 2023 was an extraordinarily unusual year, without a clear-cut explanation.
Why Blaming Recent Warming on Humans is Largely a Matter of Faith
Thursday, March 3rd, 2022
“ALL temperature change in any system is due to an imbalance between the rates of energy gain and energy lost. In the case of the climate system, it is believed the Earth each year absorbs a global average of about 240 Watts per sq. meter of solar energy, and emits about the same amount of infrared energy back to outer space.
If we are to believe the last ~15 years of Argo float measurements of the ocean (to 2000 m depth), there has been a slight warming equivalent to an imbalance of 1 Watt per sq. meter, suggesting a very slight imbalance in those energy flows.
One watt per sq. meter.
That tiny imbalance can be compared to the 5 to 10 Watt per sq. meter uncertainty in the ~240 Watt per sq. meter average flows in and out of the climate system. We do not know those flows that accurately. Our satellite measurement systems do not have that level of absolute accuracy.
Global energy balance diagrams you have seen have the numbers massaged based upon the assumption all of the imbalance is due to humans.
I repeat: NONE of the natural, global-average energy flows in the climate system are known to better than about 5-10 Watts per sq. meter…compared to the ocean warming-based imbalance of 1 Watt per sq. meter.
What this means is that recent warming could be mostly natural…and we would never know it.”
Being able to measure TOA flux imbalance and being able to calculate the forcing supplied by various processes are different things, as I’m sure Roy understands, as he has in this very post relied on the distinction.
I was addressing your claim:
Assuming that greenhouse gases and reduced aerosol emmisions are the primary cause of warming is largely based on models inputted with poor physics.
The article you’ve quoted does not provide any support for this sentiment, it’s talking about measurement uncertainty, not climate model physics.
“climate model physics”.!
ROFLMAO.
As opposed to actual real physics.
Your poor floor. You spend so much time there.
mindless muppet !
The results from climate modelling is not data. I would have thought by now that you understood that. Apparently not…..
If you can’t measure it properly,
You can’t model it properly!
Why you keep trying to contradict Ducky2 with what are basically scientific non-sequitors, I’ll never know.
Saying that CO2 is causing about 1 watt of difference is a lie if you can’t prove it. If the background is wobbling 5-10 watts, then you can’t prove it.
The civilization gave up on non-fact based science since at least Galileo’s time. Let’s not regress to the idea if it sounds right it must be true, which is what’s happening when it is assumed that CO2 causes warming in the atmosphere – it’s not a jar in a lab.
The non-sequitur is not mine. The linked post says nothing about climate model physics, it says we might not be able to tell how much warming is being produced by humans based on some uncertainty in the satellite observations of TOA fluxes.
And it’s a moot point because Roy’s position in the linked article is misinformed to begin with. The absolute value of the fluxes is not known with high accuracy, but the change in those fluxes is known quite precisely, as is the TOA energy imbalance. Whatever Ducky hoped to say with the article, it has not been a compelling demonstration.
Well that was another load of mouthy anti-science gibberish…
… pertaining to nothing.
The irony! You can’t measure accurately but you can accurately know the changes.
I’m glad you never worked for me, you wouldn’t have lasted long trying to pawn that off as an excuse. You very obviously have no education in metrology.
Here is a bit of advice you should take to heart. Two wrongs don’t make a right. It applies to measurements also.
If you can’t measure accurately, then anything derived from those inaccurate measurements can not be accurate either.
No kidding … what a waste of time and resources this would be.
My clock can be 5 minutes off but can still tell me very precisely how many seconds have passed.
Actually, that isn’t true. If your clock has lost or gained time that means the second intervals are incorrect. Therefore, you can’t be certain that your watch is measuring seconds accurately. If your intervals are short, you will have too many seconds. If your intervals are long, you will have too few seconds.
It doesn’t matter what your measuring device is, ALL measurements have uncertainty. Consequently, you can never know that you have an accurate measurement.
From the GUM:
You think you know all there is to know about measurements, but you constantly show your lack of knowledge.
So measurement is not an important part of physics? I see…..
Context is important. Roy is claiming that we don’t have the ability to observe some of the changes that physics dictate will happen, leaving the door open for the possibility that we have the physics wrong.
It would be like saying I can use the laws of physics to determine how long a ball dropped from 2 meters will take to hit the ground, but I can’t verify my calculation because the lights are off. In this scenario you haven’t falsified the laws of physics, just noted a lack of observability. That is why Roy himself says it is a legitimate but separate issue.
But Roy is wrong about the observability, so it is all a moot point.
Occam sez there is a simpler explanation…
The energy exchanges that take place in clouds cannot be modeled at the same spatial resolution as everything else. Thus, that part of the ‘climate model physics’ is not calculated at the level of first principles. Rather, it is parameterized. That means experts taking a best guess at what the typical behavior is. They could be right, wrong, or somewhere in between. We really don’t know. That is in part because those experts have relied on measurements, where the uncertainty is not given the consideration necessary to have high confidence. Your ‘weasel words’ do not provide support for your sentiment.
Hear, Hear!
Yes… and this is a legitimate, separate, point.
With an uncertainty of about +/- 0.5 Watts per sq. meter. 1-sigma or 2-sigma not specified.
Thank you for acknowledging the “experts” have a lot to learn about climate.
It’s an active field of research so that is rather obvious.
So how can they claim the science is settled?
In the same way that the theory of evolution can be considered settled science even though evolutionary biology is an active field of research.
They can make organisms evolve in laboratories.
And the minds of AGW-cultists devolve into those of chimpanzees..
Just add CO2 to the air.
The theory of evolution is so stupid it defies belief.
Evolutionary Biology is falsifiable, and makes testable predictions. Furthermore, it can be observed experimentally.
Climate “Science” fulfils none of these criteria.
Climate science is falsifiable and makes testable predictions, and can be tested experimentally, both in the lab and in computer simulations. Your own ignorance cannot be a basis for rejecting a proposition.
None of the quantifiable predictions have been verified. The best that can be said is that the qualitative predictions share the same sign as measurements, but the accuracy is so poor as to be worthless.
Name one single prediction made by climate pseudoscience practitioners that has come to pass.
Waiting…
“but as you yourself concede, at least half of the anomaly can be directly explained by CO2.”
Nothing was “conceded” – but a caveat of “assumed”
FTA
“ (AGAIN… assuming the background warming trend is 100% due to humans).”
“assuming the background warming trend is 100% due to humans”
The “background trend” is essentially zero in the UAH data.
Just major El Ninos and their associated oceans warmth spreading step change.
You have never been able to show any empirical scientific evidence that CO2 causes any warming whatsoever.
Just maintain the fantasy.. It is all you have.
You’ve been shown a lot of evidence, bnice, you’ve just rejected it. It’s important to grasp that distinction.
We require more than spurious correlation. We await your direction……
ALL OF IT JUNK !
It is important that you learn some real science and grasp the distinction.
“Long-term CO2 driven warming makes the highs way higher.”
There’s that scientifically unsupportable mantra again.. Yawn !!!
CO2 warming just hides away in the oceans (which can’t be heated by CO2 anyway) then just jumps out as a step change at El Nino events.
It is a funny little fantasy, isn’t it. 😉
Can be? Well of course it CAN be. Another utterly meaningless statement from our resident bed wetter.
AlanJ,
“Long term CO2 driven warming makes the highs way higher.”
Plain wrong.
Few temperatures measured over the ocean are above 31C. There are mechanisms like Rick Will’s convective instability and the Willis cloud cover feedbacks that cap temperatures in all but unusual cases. It has yet to be determined beyond doubt that there is no cap on land temperatures. 31C is not high enough to be classed as a heatwave threat in the tropics and extra-tropics over land. Geoff S
“…, at least half of the anomaly
canmay be directly explained by CO2.Roy,
Not wanting to deflect, but might you please comment on this comment of mine from WUWT a couple of days ago?
Thank you Geoff S
….
Some recent information needs to be put into context. It could be highly relevant.
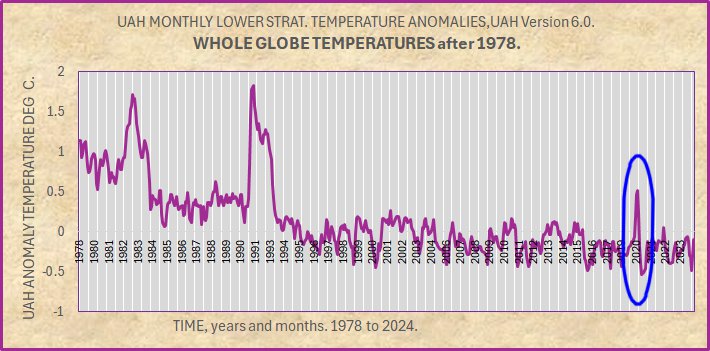
For other studies, I delved into UAH lower stratosphere temperatures for the whole globe.
In simple pattern terms, there are only 3 strong excursions each showing as a high peak.
Those around years 1982 and 1991 have been researched.
Steiner et al 2020. https://doi.org/10.1175/JCLI-D-19-0998.1
Explosive volcanic eruptions such as El Chichón in
1982, Mount Pinatubo in 1991 (Robock 2000) and also
minor volcanic eruptions after 2000 affect short-term
temperature trends in the troposphere and stratosphere
(Solomon et al. 2011; Stocker et al. 2019).
Solomon 2011. https://doi.org/10.1126/science.1206027
A reasonable hypothesis would have the 2020 peak caused by volcanic eruption.
However, there would need to be a strong volcanic eruption in 2020, stronger than any since 1991, otherwise they also would show a peak for their eruption year. No such eruptions can be found by search of the literature.
The 2020 peak must therefore be attributed to another physical process.
There is not much literature as to cause in 2020. The Hunga Tonga event was 2 years later and it does not show a peak, so is easily excluded.
The Hunga Tonga simple timeline is –
“In December 2021, an eruption began on Hunga Tonga–Hunga Haʻapai, a submarine volcano in the Tongan archipelago in the southern Pacific Ocean.[6] The eruption reached a very large and powerful climax nearly four weeks later, on 15 January 2022.[7]”
https://en.wikipedia.org/wiki/2022_Hunga_Tonga%E2%80%93Hunga_Ha%CA%BBapai_eruption_and_tsunami
The main search result gives Rieger et al with this Abstract extract:
“Stratospheric aerosol, temperature, and ozone anomalies after the 2020 Australian bushfires are documented from satellite observations. Aerosol extinction is enhanced in the Southern Hemisphere (SH) lower stratosphere (LS) in early 2020, comparable in magnitude to the Calbuco eruption in 2015. Warm temperature anomalies of 1–2 K occur in the SH LS during January-April 2020 and are coincident with enhanced aerosols.”
https://agupubs.onlinelibrary.wiley.com/doi/full/10.1029/2021GL095898
…..
This does not explain the 2020 UAH peak. There have been other fires since 1978 that show no peak on the graph that can be separated from its noise. Where is the peak for Calbulco 2015?
It is plausible that this 2020 peak reflects an event that has not been noted to date.
It was a “strong” event.
If all of this is correct, we have an example of a powerful event that has affected lower stratospheric temperatures but has not yet been assigned a cause.
….
This has significant implications. Presumably (but yet to be shown) this lack of attribution could also exist for strong peaks in the troposphere.
This places a large and new uncertainty on the interpretation of UAH temperatures.
It places uncertainty on the attribution of “hottest ever years or months. If there are indeed events like tis 2020 peak, they cound exists at other times to create an entirely false claim of hottest.
Geoff S
In 2020 human emissions of CO2 dropped by around 6% due to the pandemic lock downs and business closings.
‘Temporary reduction in daily global CO2 emissions during the COVID-19 forced confinement’
https://www.nature.com/articles/s41558-020-0797-x
Smog which blocks sunlight and sulfur emissions which seed clouds that reflect sunlight back into space were probably lower as well allowing more sunlight to reach the Earth and warming it.
https://www.livescience.com/planet-earth/climate-change/cutting-pollution-from-the-shipping-industry-accidentally-increased-global-warming-study-suggests
https://e360.yale.edu/features/aerosols-warming-climate-change
Six to ten percent was the average drop for the 2020 calendar year. However, during the seasonal ramp-up phase from October 2019 through May 2020, the anthro’ drop was much larger, reaching 14-18% in April 2020.
https://wattsupwiththat.com/2021/06/11/contribution-of-anthropogenic-co2-emissions-to-changes-in-atmospheric-concentrations/
___________________________________________________________
Dr. Spencer, why did you choose the word “Blame”
Short search says: blame; noun responsibility for a fault or wrong.
Roy,
Do you have data on the following?
Accepting a real increase in global temperature of about 1 deg C over the last century (the exact value does not matter here), is there or is there not a corresponding 1 dgree C increase in the severity of heatwaves?
Intuition suggests that this piggy-back effect is expected, but I have failed to find it as a consistent case it in a lot of Australian land temperature sets. There is a lot of noise. The warming is so small that much time is spent wading through the weeds.
Geoff S
If you want to ask Dr. Spencer questions, it might be better to do it on his site.
Charles, Roy,
My apologies.
Roy’s site can have lots of nonsense comments to wade through.
Geoff S
At Roy’s, there’s a poster who pretends to be a moderator but mostly provokes other commenters and rarely shares any scientific content.
Harold the Organic Chemist Says:
You should use Google and search for: “Still Waiting for Greenhouse”.
This is the website of the late John Daly.
From the home page, scroll down to the end and click on “Station Temperature Data”.
On the “World Map” click on “Australia”, and finally click on “Alice Springs”. The figure
shows a plot the annual average temperature since 1879. There has not been any significant increase in the annual average temperature for over 120 years.
You should obtain recent temperature data to 2023 to determine if there has been any increase in warming at Alice Springs. When there is “Open Thread”, you can post the results of your investigation.
Harold,
 lol
lol
By now I must have contributed over 100 pages of relevant WUWT articles, including the Alice Springs matter starting 10 years ago.
Here is where Alice is at. The official, raw BOM data shows no significant warming since 1879 as you note. The official BOM adjusted ACORN-SAT temperatures vary greatly between versions, with a short example shown
The BOM sends adjusted data to global compilers for GAT. These adjusted temperatures show a warming similar to the global average, while the raw data show little change. Both cannot be correct.
The BOM have made no obvious attempts to reconcile these differences at Alice and many other stations.
Geoff S
Did you check out John Daly’s website? There is still a lot of useful temperature data from all over the world at this site. My favorite weather
station is Furnace Creek in Death Valley. You should check out temperature data for this weather station. The temperature data falsifies claim by the IPCC that CO2 causes a significant warming of air.
It is a pity that John Daly died at only 61 years of age.
What temperature data is being plotted? What are the Raw-v1 Tmin, etc? Are data only Tmin’s? Are there any Tmax data?
About 20 or so years ago, I contacted the BOM about getting temperature on Alice Springs. I vaguely recall BOM wanted a fee for the data and payment by Visa was not possible.
BTW: What is GTA? Who is Geoff S?
“Who is Geoff S?” = “sherro01”
Go check out John Daly’s very interesting website:
“Still Waiting for Greenhouse”.
I am trying to figure out if it possible to use empirical temperature data to show that CO2 doesn’t cause much
global warming.
Thank you. Any info on “GTA”?
I forgot to mention that you should check out Roy Spencer’s website which now has feature for posting comments.
I’d say definitely NOT. Bear in mind most of the AVERAGE temperature rise has been nighttime LOW temperatures not getting as COLD, not an increase in HIGH temperatures.
Around 10 times as many people die from cold than from heat.
https://www.thelancet.com/action/showPdf?pii=S2542-5196%2821%2900081-4
https://www.thelancet.com/pdfs/journals/lancet/PIIS0140-6736(14)62114-0.pdf
Humans are tropical animals, that’s why we don’t have fur, we like the temperature to be in the 80’s F(27C).
According to the WUWT temperature on the right of pages the average temperature is 58F(15C) that’s why we have to live and work in heated building, use heated transportation and have warm clothes for most of the year.
Question to the smart people here! would not the Tonga eruption in 2022 cause temporary warming due to the large injection of water into the atmosphere??
Javier was a long here a few days ago analyzing all possible explanations for this unusually warm year. He concluded that Tonga Hunga was responsible due to the adage from Sherlock Holmes that once you have eliminated all other possibilities, then what is left, however improbable, must be the truth.
However, I had done a calculation with MODTRAN about a year ago and convinced myself that the effect of 150 million tonnes of water vapor injected by that explosion into the stratosphere is too small a perturbation to explain much — it only increases downward directed IR by about which would be offset by maybe a 0.025C surface temperature rise (not considering any water vapor feedback).
What Dr. Spencer is saying here is that the time series as shown in your comment is a random process consisting of a steady secular trend (0.2C per decade) plus a random, year to year, component of unknown distribution. There is some probability of exceeding any small temperature departure in any year. For example, if the standard deviation of the random process, modeled by a normal distribution, were around 0.1C per year, then a 0.25C excess departure like that of 2023 would occur around 2% of the time — i.e. 2 times per century.
I don’t know what the true measure of dispersion for global temperature is, and I have doubts that it is anywhere near normally distributed (maybe doesn’t even adhere to the central limit theorem), but I think you can get the essence of the argument from what I have said.
Obviously a huge amount of water vapour was ejected into the troposphere/stratosphere by Tonga Hunga, but was anything else also ejected which might alter atmospheric chemistry up there as a result?
Any particular metals, any particular anions?? Any particular compounds????
The Hunga-Tonga eruption had a large impact on the Ozone in the atmosphere, reducing it by about 30 percent, with unknown consequences..
Have you done a sensitivity analysis to see how much water vapor would be required to have a significant impact? MODTRAN may be insensitive to water vapor.
The anecdotal evidence clearly condemns MODTRAN as irrelevant.
The solar output has been the highest over the past hundred years of any 100 year period in the last 400 years.
https://lasp.colorado.edu/lisird/data/historical_tsi
The oceans store up large quantities of heat and can release it over many decades.
Plus, cloud cover has declined due to pollution controls reducing sulfur emissions which seed clouds that reflect sunlight back into space and smog controls which reduced smog letting more sunlight reach the Earth.
https://www.livescience.com/planet-earth/climate-change/cutting-pollution-from-the-shipping-industry-accidentally-increased-global-warming-study-suggests
https://e360.yale.edu/features/aerosols-warming-climate-change
None of which are in the IPCC models.
Story Tip: https://nantucketcurrent.com/news/vineyard-wind-reports-turbine-blade-damage-in-offshore-incident
Wind trubine off Martha’s Vineyard broke and now they’re closing beaches in Nantuvcket while cleaning up the debris. But windmills aren’t polluting, they’re totally clean. 😉
These energy balance models invariably ignore the fact that the uncertainty in the individual radiometric measurements of the various components are much larger that the magnitude of the claimed imbalances, so drawing conclusions from these numbers cannot be justified.
I swear. Climate Scientists exist so that Economists don’t look totally foolish.
I assume “Journalists” exist so that Climate “Scientists” don’t look so foolish.
I thought ‘man-made global warming’ was a projection of the ‘man-made economic booms and busts’ to stop people thinking too carefully about who was stealing billions and billions through insider trading?!
Warm year or two? Hell, they blame single, warm days on climate change.
Yes, and at the same time, any “good” weather is somehow never connected to “climate change.”
Meanwhile, previous warm periods, all warmer than today, were referred to as a “Climate OPTIMUM.”
Now why do you suppose they called them that? Because the weather was so bad?!
“Anything different from that small 0.02 deg. C per year warming is due to natural climate variability.”
As is the 0.02 degree Celsius per year warming trend; the notion that it’s not is little more than an assumption. And certainly no cause for destroying the massive progress to human health and living standards built upon the use of reliable and affordable energy (i.e., fossil fuels).
Most people don’t even want to engage with the reality of ‘natural climate variability’, because they’ll soon learn that the epochal shifts in climate are so huge that 0.02C/year is pissing in the Pacific Ocean. As you’d be hard pressed to detect the effects of an intra-oceanic piss near Venice Beach in Malibu, the chances of doing so up at Anchorage are pretty remote……
The HT eruption, boggles one’s mind why anyone would be guessing about this at this point.
At least NASA is kind of going down the proper path and admitting that the most powerful greenhouse gas (Stratospheric H2O) could actually be a forcing that must be dealt with.
Wow, imagine that…
Can Intense Thunderstorms Alter the Stratosphere? NASA Intends to Find Out | Scientific American
The truth is available.
.
Can intense Thunderstorms alter the Stratosphere and have long term climatic impact. If the answer is yes, can 90 billion gallons a year from aviation 24/7 have an impact. Physics, indicates yes, will increasing the moisture content of the MID stratosphere by 10% in one day have a long-term impact?
Did the Stratosphere react to the drop in aviation emissions? Yes
Is there any other explanation for a SW anomaly that has occurred only 3 times over the UAH data period.
Does the observed data fit this hypothesis.
Was there a triple dip La-Nina starting in 2020, that was not preceded by a large El-Nino, that has ENSO experts scratching their heads?
And last but absolutely not least, did Earths climate diverge from the solar trend when commercial jet aviation started?
According to the data,
Global Warming is caused by Anthropogenic Stratospheric Water Vapor from global aviation.
Still not convinced,
Here is the earliest clue that the Stratosphere can cause rapid and significant warming from water vapor.
The Year Without a Winter: 1877-78 | Minnesota DNR (state.mn.us)
A strange unexplained warming occurred, and it looks like a very unique eruption in Iceland put a significant amount of water vapor into the Stratosphere in 1875. And a couple of years later the world experienced record temps just like what is happening today.
The Askja volcano eruption in 1875 – where did all the water come from? (Invited) – NASA/ADS (harvard.edu)
Correlation does not ALWAYS mean causation, but most of the time it does, in my experience, or we would have never been able get anything done.
“The Askja volcano eruption in 1875”
Thanks for that information.
You bet, the last piece of the puzzle, is WWII, I do not have a temp series over that era yet, but there is an anomalous warming over the period.
250,000 B17 flights from England to Germany, cruising in the Stratopshere there and back.
About 9 billion gallons of aviation fuel burnt in that conflict.
The world got a little taste of what is in store, when global jet aviation launched in the 60’s, the world began diverging from the solar trend.
It is an easy to mistake for researchers to blame the divergence on CO2.
LT3,
Thank you for your comments, although they have sent me back to the work bench. I have long had concerns that populist science spent too much time with CO2 ignoring other plausible variables influencing temperatures.
Geoff S
Us battered Geophysicists from the un-conventional era of O&G had to be right. Time series analysis and signal processing is all very similar. We were hard wired to do un-biased forensics on data with only data derived justification. We did not operate under the correlation / causation causality loop, and it worked well the vast majority of the time.
Ignoring a single lament, could cause a multi-million dollar dry hole.
Going for a grant on a climate model for teleconnections of snow fall projections to selected surface locations, and we had put in Tonga, and quite by accident I saw graph showing the drop in aviation. And then it clicked. And when Willis did that story a month or so ago critiquing a media claim that temps saw there largest increase EVA. And when he showed that late 1870’s event and WWII as well, I already had two successful experiments in modern times. And when I read about the Askja event, I knew this was going to be a good well.
Empirically this model is a piece of cake, if you demultiplex the UAH into 2.5 x 2.5 time series for the LS. The deep atmosphere, ha, I don’t want to go there, sounds worse than dealing with shear waves.
We are contemplating extrapolating the UAH back to 1958 for modeling purposes.
The thing that I would like you to think about is, the shape of the tropopause boundary, is it possible there is a focusing amplification of the IR at the boundary to the surface, such as a parabolic surface invokes on reflected ray paths.
I would say half the time it does.
I would say it depends on how many different things you can find that correlate. Postal rates, fentanyl, drunks on highways, etc. Without experimental evidence, everything has to be considered.
Never kept track of the ratio, but I am much better than that, find something and try to kill it, if you can’t, move to the next step, and win or risk getting caught in analysis paralysis.
If Hansen would of took a couple of pointers from me, NASA would not be tinkering with surface stations, deleting El-Ninos and such.
I judge a methodology by its merit, I just solved a riddle that the entire world has been working on for decades with this approach.
I will stick to my discipline.
If you find something that correlates with global temperatures other than CO2, please let me know, regardless of if you condemn as a cause, because I could not find anything else.
About 71% of the earth surface is covered with water, which is the major greenhouse gas by far. The claim by the IPCC since 1988 that CO2 is the “cause” of global warming” is a lie.
Presently, a cubic meter of air contains about 0.789 grams of CO2 per cubic meter of air. This too little CO2 to cause any significant heating of air.
I am not talking about CO2, that rare gas has been removed from my modeling a decade ago because the data clearly indicates it is an effect of climate, not a cause. I am talking about H2O, burn 1 gallon of fuel and you create approximate 1 gallon of water, and if you are in the Lower Stratosphere, then you are emitting an equivalent number of gallons of water in the Stratosphere while you are flying above the bubble point.
And it remains there for approximately 3 years, quite the Anthropogenic forcing that just glided right by everyone’s nose.
Except me.
This data now, and when Hansen first showed his graph in the early 90’s breached the null hypothesis, and then of course the Al Gore graph. In science, the theory died right there.
And magical unverified climate sensitivity H2O feedback accompanying miniscule warming from CO2, lets just say that there is no point in bringing up that molecule unless your perturbing photosynthesis in a green house, various manufacturing processes and making soda pop.
It is very important to inform the people that CO2 does not cause
“global warming”.
I live in BC, Canada and the carbon tax is $80 per metric ton of CO2 equivalent. The federal and provincial governments collects over 8 billion
in carbon taxes.
This tax has increased the cost of food. My son and I have spent over $5,000 on food to date.
The carbon tax has not resulted any significant reduction the consumption
in fossil fuels.
The data, to me, shows that it is the water vapor from aviation, not a trace gas. If you are jetting around condemning mere mortals surface combustion of whatever, they are not the cause. You are.
How do you think Mr. Caprio is going to feel about that, if this is in fact the control knob.
About 71% of the earth’s surface is covered with water. Why isn’t there a
runaway greenhouse effect? This has puzzled me for many decades.
That 3rd graph of CO2 looks like it has surges and step cause by El Nino events, with flattish sections between… just like the temperature data, but with a slight lag.
I read it as the growth rate, is that correct ??
That would imply that the CO2 growth rate is tied to the atmospheric temperature.
Need to think about that !
Yes, its growth(derivative), but monthly values, they need to be multiplied by 12 to convert to annual PPM equiv.
Fluctuations in the El Niño-Southern Oscillation (ENSO), as reflected in the sea surface temperature (SST) values in the Niño-3.4 region in the equatorial Pacific Ocean, are clearly a major driver of changes in both global atmospheric temperatures and the growth rate of atmospheric CO2.
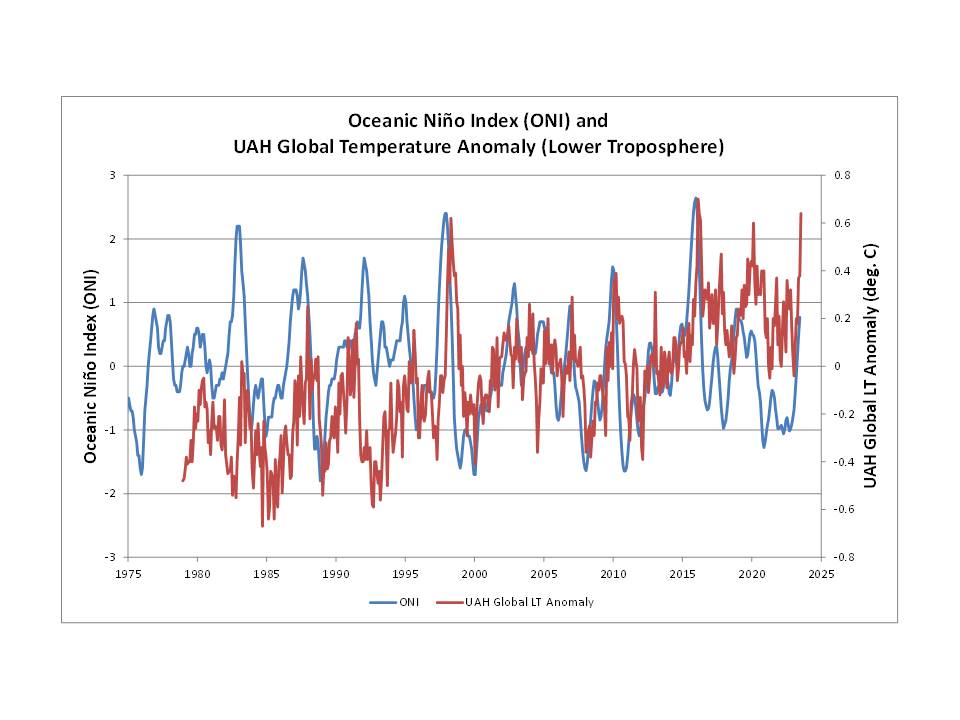
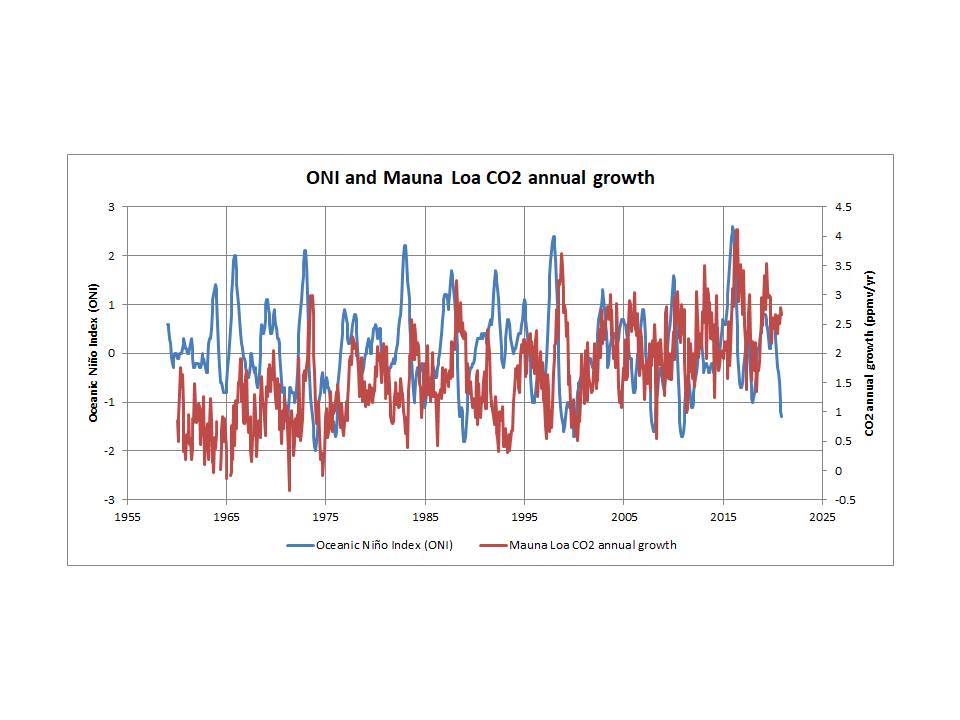
Note that in both relationships, Pinatubo over-rides the ENSO effect.
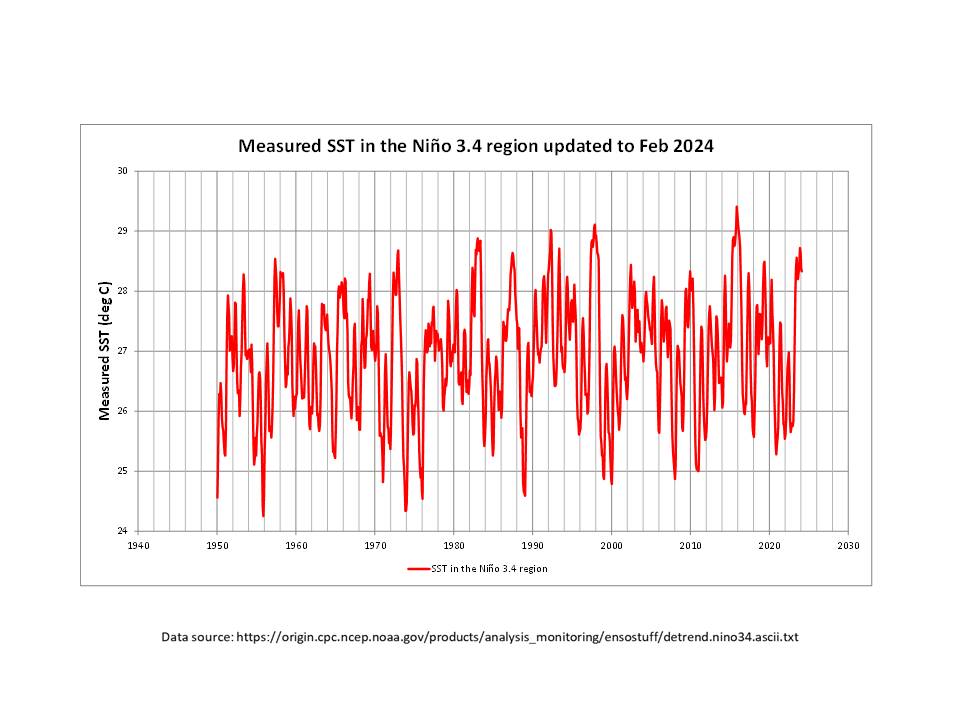
You also need to keep in mind that the Oceanic Niño Index (ONI) values are actually de-trended using a moving 30-year average applied to successive 5-year periods. So, they appear to be neutral over time. However, based on the following SST plot (which has not been de-trended) it is evident that, since 1950, both minimum (La Niña) and maximum (El Niño) SST values appear to have increased by at least 0.5C and perhaps as much as 1C (which would equate to 0.14C/decade).
Thanks, I did not know that, I always looked at the lack of a trend and thought it unusual.
Are we really sure that CO2 is causing a rise in global temperature ? The correlation is extremely poor. Rate of warming – the slope – to 1940 is the same as 1975 onwards. In 1975 ‘climate scientists’ panicked and wrote to the President that the past 30 years of cooling presaged a new Ice Age that would starve us all. Then there was the famous‘hiatus’ of over 15 years which panicked alarmists into changing global warming’ to the dishonest lying formula ‘climate change’. Then there was Lord Monckton nine year pause. I haven’t even mentioned the frequent ENSO spikes. Nah-it’s natural because the globe is warming,
“Anything different from that small 0.02 deg. C per year warming is due to natural climate variability.” Roy Spencer, Ph.D.
That is a false statement.
It assumes knowledge of how much warming since 1979 was manmade, That knowledge does not exist. So the statement is false — not based on data. Science requires data.
Speculative attribution is not data.
Afte 27 years of climate science and energy reading, 2024 is the first year during which I have observed climate skeptics, who I previously trusted, making false or deceptive statements.
Leftists have ramped up their reign of error, so perhaps conservatives are getting desperate?
Spencer’s UAH reflects +0.015 degrees C. warming per year since 1979 so I have no idea why he uses +0.02 degrees C. per year.
Nothing in the UAH numbers explains what caused the warming. It could range from 100% natural to 100% manmade. There is evidence of both.
There is enough evidence to say manmade causes of climate change are adding to natural causes of climate change for the first time.
Why would there be heat spiles and flat trends in a long term rising temperature trend?
The simple answer, that will make El Nino Nutters jump for joy, is that every El Nino creates a temporary warming spike while every La Nina creates a temporary flat trend.
So what?
The annual temperature change is the net result of ALL causes of climate change: Global, regional and local causes. CO2 is one of many causes of climate change, except for the There Is No AGW Nutters.
Reduced SO2 emissions cause warming too
Increased UHI cause warming too
Measurement errors seem to only cause warming in the present, and cooling in the past.
I do not need any Ph.D. scientists to tell me that our SE Michigan winters are warmer with far less snow than in the 1970s. This warmer winter trend has been happening for decades.
Late 1970s
Driveway snow shoveling about once a week
2023 / 2024 winter
Driveway snow shoveling one time for ten minutes
Same driveway since 1987
Four miles south from 1977 to 1987
Do I care what caused our warmer winters?
No. I celebrate warmer winters and retired my snow shovel this year.
The predictions of bad news climate change are a fig newton of overactive leftist imaginations.
+0.015 rounds to +0.02 degrees C per year and Spencer usually uses 2 decimal places for UAH_TLT on his blog.
So no mystery.
Only mystery is why he applies a linear trend calculation to data that is distinctly not linear, but step based.
You have no idea about real scientists using significant digit rules do you?
WOW !! RG finally admits to El Nino warming !!
Ignores the step change at the major El Ninos, though…. Baby steps !
The “flat trends”, take up most of the UAH data. !
“Spencer’s UAH reflects +0.015 degrees C. warming per year since 1979 “
No it doesn’t. It shows El Nino spike and step, with not much happening between.
If you want to use those spikes and steps to say there is a linear trend, when there isn’t… That’s up to you…
… makes you a trend-monkey like all the other AGW-zealots.
No evidence of any human causation of the El Nino spike and steps which are the only warming in the UAH data.
So why do you go on and on…….and on… and on about AGW?
Oh forgive me! You have solved it!
RG: “Speculative attribution is not data.”
Mike: “So why do you go on and on…….and on… and on about AGW?”
Good question.
RG does what he accuses Roy of doing. Speculation based, apparently, on RG’s driveway shoveling experience, as you noted.
Maybe driveway shoveling frequency is part of natural climate change. Some decades you shovel more, and some decades you shovel less. If the pattern repeats, then you don’t have a changing climate, it just took a while for this part of the natural climate cycle to present itself to you. You just thought it was changing.
Very nice.
Something caused the now subsiding El Nino event to have a longer and stronger effect on the atmosphere than usual.
The effect started earlier than usual in the year, climbed rapidly, spread out wider, and has hung around for longer, seems to have a double peak as well… making up over half of both 2023 and 2024.
Maybe a compound of increased solar input, HT and other ocean seismic activity ?
It takes a pretty long bow and a vivid imagination to find any human causation.
“Maybe a compound of increased solar input, HT and other ocean seismic activity ?”
“Maybe” is not science
Everything else makes sense.
Did you hire a ghostwriter?
Do you still “pretend” to yourself that human CO2 causes El Nino events.
That would put you at that same dumb anti-science level as fungal.
”Almost 100%” of climate scientists (lol) saying AGW is measurable and real coz it can’t be anything else is also not science then…is it?
Well said, Mike… +10 🙂
Yes, increased greenhouse gases and reduced aerosols.
You have ZERO evidence of that.
Greenhouse gasses do not cause El Nino events.. your comment is utter stupidity.
I believe that’s possibly the most stupid thing you’ve said so far.
Gees, that’s a hard comparison to have to make…
… basically everything he says is moronically stupid.
Please explain how a nearly constant emission of anthropogenic CO2 results in episodic step-ups and declines in temperature. Also, explain why a constant anthro’ emission would cause an increase in the ramp-up phase during El Nino events.
Then there wouldn’t be a statistically significant warming trend in the global data.
Really, a very disingenuous essay here by Dr Spencer.
Has desperation set in?
Warming that only comes at El Nino events.
No evidence of any human caused warming in the whole of the UAH data.
A really moronic comment by fungal.
If you remove the El Ninos and their associated step changes.
There is basically no warming.
Roy is talking about the natural variation, not the trend. You are taking his comment out of context.
Well, that “small” +0.02C warming per year equates to +0.20C per decade, which equates to +2.0C per century warming.
Not “small”; potentially catastrophic.
Also, exactly the warming rate the IPCC had forecast back in 2007.
You’re talking out of your ass.
None of the past climate epochs had the level of temporal resolution we have today. Inferring future warming, let alone potential catastrophe, based on data covering such a short geological time frame is stupid.
He has a special talent for this.
I don’t know why people still read and respond to this primate’s posts. Its IQ seems barely higher than the average Twitter user’s.
Except it only happens at El Nino events, which they have never forecast.
Between those events.. basically NO WARMING.
And the gormless idiocy of linear extrapolation out over a century.
Hilarious !
Yes – Greenland plateau January temp up a catastrophic 10C. The horror of minus 25C versus minus 35C.
Only scammers believe the catastrophic warming nonsense.
“Not “small”; potentially catastrophic.
Give me a break. We are moving into 1C territory now and there is nothing even remotely catastrophic. 50 years ago some were predicting feet of SLR. it’s been inches. Nothing that has happened is beyond natural variability.
You have no idea what the climate will do in the future, so you cannot extrapolate 0.02C per year to a Century.
Since previous warm eras (MWP, RWP Holocene) did not result in global catastrophe, why do you think it will be different this time?
“Well, that “small”
+0.02C+0.015C warming per year equates to+0.20C+0.15C per decade, which equates to+2.0C+1.5C per century warming.”Roy’s UAH trend is now 0.1532C/decade. It stood at 0.1355 a year ago. So you might say that is just an arithmetical consequence of a hot year. Yes, but the trend balances the effects of warm and cold years. That warm year evens out the effect of cold years in the past to get the current value.
WRONG again.
The underlying trend in UAH is basically ZERO….
With El Nino events causing transient + step changes..
which, when you apply a linear trend calculator, gives an upward trend.
Is this how stupid the warmunists are?
YES. ! Extremely stupid !
Or, disingenuous. Stokes is not stupid.
I’m 70.
True, in my 70 years I’ve lived in a number of different places but I’ve been where I live now for about half of that.
The last two years have not been “unusually warm”. I’ve seen warmer and colder here.
Why would my little spot on the globe be different than the the rest of the globe?
Maybe Man’s CO2 has changed the Space-Time Continuum where I live? It sure hasn’t changed the temperature much.
This is a fantasy world that only exists in climate models. The real world has powerful negative feedback that prevent the ocean surface temperature sustaining more than 30C.
Tell me how CO2 can cause cloud to reduce everywhere except just north of the Equator:
 ?ssl=1
The negative feedback factor over warm pools is 2; meaning the increase in reflected short wave EMR is twice the reduction in outgoing long wave EMR. This ensure a hard limit on ocean surface temperature of 30C once convective instability sets in. The sustainable limit of 30C is set by atmospheric mass so the addition of a little carbon causes an unmeasurable increase in surface temperature.
“Tell me how CO2 can cause cloud to reduce everywhere except just north of the Equator:”
It warms the air.
So CO2 warms the air just north of the equator or everywhere else?
And why the reversal?
Immeasurably. The air is warmed by the oceans giving off heat – which is a cooling mechanism. It is the sun that ultimately (indirectly and with an unknown lag period) dictates any change in the ”GAT” over time.
Sol The Influencer…
Your surface air temperature runs Jan-Dec. When earth’s imbalance is extremely negative (as observed) in April 2024, May 2023 and March 2022. Spring decreasing global snow and ice increase slowed and even increased for 4 days in April this year.
Earth cools right down in Feb/March not December (when NH sea ice and snow extent is at peak levels). NH is 68% land. 1/4 snow covered. Snow & ice cover 1/4 of hemisphere.
10 million sqkm of global snow and ice decrease per month in spring 2024.
ERA-5 is a dishonest dataset as it lies about coverage.
Claims world is 16.9C 90N – 90S 0-360E but reality it’s NH 50N – 23.5N (currently 22.4C) & SH 23.5S -50S (11.4C).
Added together, divided by 2 equals 16.9C.
Arctic and Antarctic is independent of global mean surface temperature.
Parts of the planet that releases earths heat.
Earths real temperature is around 5C which in spring happens in May not March (when solar irradiance goes below 340 watts). Earth is 2 months cooler than 5C than what is received by the sun.
Jan solar 351 watts, July solar 329 watts.
July earth 351 watts, Jan earth 329 watts
Sun and earth go in opposite direction due to land reflecting and absorbing solar heat and change in daylight hours.
For over a year UAH has been running too hot. In that time 2024 global sea ice has been 1 million sqkm above 2023.
I am currently reading Hubert Lamb’s ‘pre-global-warming’ treatises on climate and one gem to be found therein is that in certain high latitudes, it was noticed that decadal differences in temperature (average of 10 years data) varied 8C between data merely 20 years apart in the early 20th century. 8C.
That was an interesting ‘baseline localised natural weather variability’ observation, wasn’t it?
What was most interesting was that this fascinating observation was not followed by pages of diatribe about the imminent end of the world. It was noted, a brief discussion about the effects of how ice turns into water into water vapour and what effect that has on temperature was to be had and then, on to the next interesting nuggets of data.
In times of hysteria, climate bedwetting and the like, it’s often wise to seek out learned sources of information from less frenzied times. They may not be completely up to date, but those who truly have an interest in climate will glean enormous amounts of valuable knowledge from revisiting the steps of intrepid pioneers of generations past.
You’ll find the same to be true of learned bioresearch treatises from the days before DNA sequencing and PCR. Ooh, awfully low tech, but the seminal observations are usually precisely those things which the modern world ignores, simply because 99% of the modern world is supremely unaware that such observations were even made…..
Is it wrong to assume that +.02 (or +.03) is entirely open ended or even valid for another century – what with logarithms, saturation, and climate history? And when does this assumption reconcile with the next ice age?