Guest Post by Willis Eschenbach
My mind runs to curious corners of the climate question. I got to thinking about how little the atmospheric CO2 level has changed over most of the last two thousand years. Here is the CO2 data from ice cores (colored dots) and from the Mauna Loa CO2 measuring stations (red/black line).

Figure 1. Ice core CO2, and Mauna Loa instrumentally-measured CO2.
Note that there is good agreement between the thirteen different ice cores, as well as good agreement during the period of the overlap between the ice core and the instrumental CO2 data.
Looking to see how the CO2 related to the temperature since the year dot, I took that CO2 record and I overlaid it on the Ljundqvist reconstruction of the temperature variability of the extratropical northern hemisphere from 30°N to 90°N. It is a decadal average record that goes from the year 1 to the year 1999. I also added in the recent Berkeley Earth decadal averages for the period since the end of the study, for 2000-2009, and 2010-2019. (Because one is a proxy record and the other is an instrumental record, I have variance adjusted the Berkeley Earth record to match the variance of the proxy record over the period of their overlap, which is from 1850 to 1999. This is the same procedure that Ljundqvist used for the black dashed line in his reconstruction.)
Here is that graphic.

Figure 2. Ljungqvist decadal temperature reconstruction 90-30°N, to which I’ve added ice core and instrumental CO2, as well as the two final decades of Berkeley Earth mean 90-30°N temperatures (blue circles). The ice core data is a lowess smooth of the individual ice core data points shown in Figure 1.
In Figure 2, we can see the early “Roman Warm Period”, which lasted up to about the year 200 AD. Then temperatures dropped until about the year 500 AD. After that, the world warmed up again to the “Medieval Warm Period”. Then the temperatures cooled to the “Little Ice Age” which ended about the year 1700 AD, and finally, temperatures have warmed in fits and starts for the three centuries since the Little Ice Age.
Here are my questions about this historical temperature record:
• Why did the temperature start dropping after the Roman Warm Period? Why didn’t it just stay warm?
• Why did the cooling start in 200 AD, and not say in the year 600 AD?
• Why did the temperatures start warming around 550 AD, and continue warming up to the Medieval Warm Period peak at around 1000 AD? It could have stayed cold … but it didn’t.
• Why was that warming from 550 to 1000 AD, and not from say 800 to 1300 AD?
• What changed in ~ 1000 AD to flip the earth from warming to cooling?
• What caused the seven hundred years of steady cooling from about 1000 AD to the depths of the Little Ice Age, where temperatures bottomed out around 1700 AD?
• Why was that cooling from about 1000-1700 AD, and not e.g. 1250-1850 AD?
• Instead of stopping at the year 1700 AD, why didn’t the world keep cooling down to real glaciation? What flipped the earth from cooling to warming? Given the Milankovich cycles and the lengths of the other warm interglacial periods, we’re overdue for another real ice age.
• Why didn’t temperatures just stay at the 1700 AD temperature?
• Why has it warmed, in fits and starts, from the Little Ice Age up to the present?
Here’s why all of that is important.
NOT ONE CLIMATE SCIENTIST KNOWS THE ANSWERS TO THOSE QUESTIONS.
Not one.
And from Figure 2 above, it is quite clear that the answer is not “CO2” …
Without having enough understanding of the climate to know the answers to those questions, there is absolutely no way to say that the recent warming is not merely more natural fluctuations in the earth’s temperature.
Speaking of fluctuations, I note in Figure 2 that the Earth’s extratropical northern hemisphere surface temperature has wandered around in a range of about 1.5°C over the last 2000 years. The earth’s surface temperature is on the order of 288 kelvin, so including the variance adjustment, this represents a temperature variation on the order of one percent over a two-thousand-year period … to me, this is the most interesting thing about the climate—not how much it changes over time, but how little it changes.
This thermal stability is not from thermal inertia—the land in each hemisphere swings about 15°C over the course of every year, and the ocean in each hemisphere swings about 5°C every year.
I say that this surprising and exceptional stability is due to the thermoregulatory action of emergent climate phenomena including dust devils, tropical cumulus fields and thunderstorms, the El Nino/La Nina mechanism that pumps excess heat to the poles, tornadoes, and hurricanes. I describe this theory of emergent thermoregulation in a series of posts listed in my 2021 index of my posts here in the section called “Emergence”. These act to keep the earth from either excessive warming or cooling.
Anyhow, that’s where my mind wandered to most recently, to the question of two thousand years of temperature and how it’s not ruled by CO2 …
Today was sunny and the ground was dry for the first time in a while, so I spent far too much of the afternoon underneath my truck unbolting and taking off the camper hold-down brackets. There’s nothing like discussing the concept of excess rotational inertia with a recalcitrant bolt, a bolt located where you can only get one hand in to twist the wrench, to give a man a reminder of his lack of importance in this miraculous world of wonders … made me glad I own an impact wrench, but there are places where it can’t go.
But as the I Ching says, “Perseverance furthers”, and after using end wrenches, sockets, breaker bars, deep-wall sockets, two impact wrenches, and saying more than a few bad words, I got it all done.
Best of the sunshine to everyone, life is good,
w.
Technical Note: Some folks have asked, is it OK to splice proxy and instrumental data, or more generally, any two datasets purportedly measuring the same phenomenon?
My answer is absolutely yes, IF two conditions are met:
Condition 1: There is enough temporal overlap between the datasets to verify that the two datasets are giving the same answer. In this case, for example, there is an overlap between instrumental and proxy data for both the ice core/instrumental CO2 and the proxy/instrumental temperature records. Figure 1 shows the ice-core/Mauna Loa CO2 overlap. Here is a closeup of the overlap between the Ljungqvist temperature and the Berkeley Earth variance-adjusted temperature.

Figure 3. Closeup, overlap of Ljungqvist temperature and variance-adjusted Berkeley Earth temperature
Looking at Figures 1 and 3, you can see the overlap in each case and verify that the proxy and instrumental records are clearly in good agreement.
Condition 2: The fact of the splice is made clear and evident, with no attempt to hide it. In both graphs, the overlap period is clearly shown, and the existence of the splice is acknowledged in the text as well
Here’s a post of mine which discusses splicing, appropriately entitled “Splicing Clouds” …
Usual Note: I can defend my own words. I can’t defend your interpretation of my words. So when you comment, please quote the exact words that you are referring to.
Are those blue circles in the upper right corner of Figure 1 actual measured data or predictions from a climate model?
Those are from the Berkeley Earth global temperature dataset 1850-present, variance adjusted to agree with the Ljungqvist proxy data. See the technical note at the end.
w.
Over the past ~25,000 years, ie start of the frigid LGM, CO2 has varied from ~190 ppmv to last year’s 417 ppmv (HI).
When it’s cold, the oceans give up fewer CO2 molecules. When things warm up, the oceans go flat, like beer, releasing more vital plant food into the air, boosting life on the balmier planet. C3 plants, ie all trees and most crops, starve at ~150 ppmv.
Earth begins warming when CO2 is at its lowest.
Just out of curiosity (I really am trying to expand my understanding so please forgive me my “dumb” questions)
How come that the ice core CO2 measurements are so stable ?
Is this from the resolution of the ice cores ?
(Ah “Robert of Texas” has answered my question(s) below, makes sense — thank you!!)
You have a great mind to ask the pivotal question, Jeroen!. According to Fick’s Second Law of Diffusion, all gases have a diffusion rate through substances including ice. Very slow diffusion, due to temperature, pressure, the chemical potential of the gas, hydrogen bonding of CO2 and water, i.e. the diffusion constant, and the final concentration of the gas outside (the concentration gradient).
Given millions of years for the slow diffusion to take place, no matter what the concentration inside the ice is, it will gradually diffuse until it approaches asymptotically the concentration in outside air.
So even if the concentration inside the core is 10,000 ppm, say, and the concentration outside eventually is 300 ppm, the inside concentration will “deflate” (my silly word) and approach 300 ppm, which is the current CO2 concentration order of magnitude. I think Woods Hole Oceanographic Institute did this experiment for CO2 and Ice about 10 years ago. (I could be wrong with my attribution of Woods Hole).
Thank you for the explanation!
From the article: “Here’s why all of that is important.
NOT ONE CLIMATE SCIENTIST KNOWS THE ANSWERS TO THOSE QUESTIONS.
Not one.”
Love it! So true. Willis has exposed the truth about the matter. The alarmists don’t know what they are talking about. We should not be spending Trillions of dollars based on their advice.
This simple presentation from Willis might not satisfy everyone as representing a null hypothesis for agw, but it does it for me (simple old soul that I am).
Thanks again Willis for starting the week with a big does of rationality.
How about a null hypothesis that compares actual water vapor to what is required for the AGW positive feedbacks? Even if temperatures were rising rapidly – without the water vapor link, the CO2 shibboleth would be disproven and be attributed to its historic role as a trailing indicator of warming.
Water, in all its phase forms – liquid, gas, solid — are the true bugaboo that the climate dowsers and their models can NOT handle.
A blue sky Earth, a ball heated by a steady SW radiation with no clouds is what the cargo-cult modelers code for. The truly amazing thing is they think their hand-tuned model outputs actually predict the future states of Earth’s climate. Dumb beyond belief.
The presentation by Willis, and the article on Smil from the weekly roundup, should be enough to at least get the alarmists thinking.
I intend printing both to give to my kids. Wish me luck.
In addition to the list in the article Climate Scientists do not understand the following anomalies:
Why is the Southern hemisphere average temperature at 30 degrees south at least 1 degree cooler than the Northern Hemisphere.
When the inter-glacial ended why did the temperature rise a a few degrees within 50 years.
Far more oceans do far fewer UHIs. No idea if that accounts for 1C but it’s a start.
‘and’ not ‘do’.
Fig. 2 makes it look like the relationship between CO2 and recent temperature increases is only coincidental.
A couple of additional questions:
Why did the temperature suddenly jump up about 50-100 years before an increase in CO2 in the most recent period?
If it is primarily CO2 that is controlling Earth’s temperature, why was the temperature bouncing around for at least 1,800 years while CO2 was static?
“Fig. 2 makes it look like the relationship between CO2 and recent temperature increases is only coincidental.”
Furthermore, this work from Jaworowski demonstrates why there may be good correlation between recent ice cores and recent CO2 levels but may become all but useless the futher back in time you go:
https://wattsupwiththat.com/2018/01/20/what-do-the-ice-core-bubbles-really-tell-us/
BINGO! It’s clear that even during two millennia of recorded human history global temperature swings occur without a change in CO2 levels demonstrates the irrelevance of CO2 on global temperatures… CO2 is not the climate “control knob”
The early ringleaders of the CO2 hoax in the West knew this but CO2 was a wedge to attain the real target: Global de-population and de-industrialization leading to a New Dark Ages. Unfortunately Russia and China never agreed to this deal and as an alliance are surpassing the West that’s committing economic suicide.
In your bullets under figure 2 I found this:
“Why did temperatures start warming start again at the end of the Little Ice Age, instead of just staying at the 1700 AD temperature?” I think the second “start” word is an error.
As for splicing data, I think it depends on the what the message is. If two sets of data are measuring different things, or measuring in different ways, the error margins will also be different. Also, the fact that two data sets seem to agree over a short margin does not mean they will agree over a wider margin. One should be very careful in splicing data, very clear in the shortcomings, and avoid doing so where possible. In the case of Mann, he truncated the data he didn’t like and spliced in the data he did, one from tree core interpretations and one from land temperature measurements. I think you did an adequate job keeping them separated by color to make it apparent.
Ice core data is NOT what it seems. They insist it represents real CO2 measurements of the existing atmosphere, and I keep thinking it does not. One has numerous problems in using this data: 1) It is a smear of averaging years of CO2 concentrations until the pores close up, and in each location the amount of time for pores to close is different. 2) It assumes there is no way for CO2 to migrate or chemically react within the ice, both of which I think is occurring at tiny rates. Tiny rates over enough time lead to big changes – just ask a mountain. 3) There is no way to adjust for layers of snow being blown off and then being replaced, again over decades of time. Ice core data is so full of problems I would not use it at all – just like tree ring data where lots of things affect the ring size.
Now given that one accepts ice core data as actually representing something real, you point is a good one – you actually don’t even need the ice core data and the point stands – why were temperatures changing so often if it’s all caused by CO2. Natural variability is obviously in play and just as obvious it isn’t CO2.
Thanks, Robert. I’ve fixed the typo.
Regarding ice core CO2 data, if it is as unreliable as you say, why does it agree so well with, both between ice cores and with the instrumental data?
And if the ice core data is wrong, why does it so consistently agree with the changes in temperature over the repeated glaciations of the planet, with a lag indicating that the warming of the temperatures releases more CO2 from the global oceans?
w.
Dear Mr. Eschenbach,
You write: (year zero = 1995). However, in the graph we can see “Holocene” over zero. Why? Would be, please, 1995 “Holocene”?
Thanks, Asimovfan.
I find nowhere that I either mentioned “year zero” or “1995” … ? You sure you’re commenting in the right thread?
w.
Dear Mr. Eschenbach,
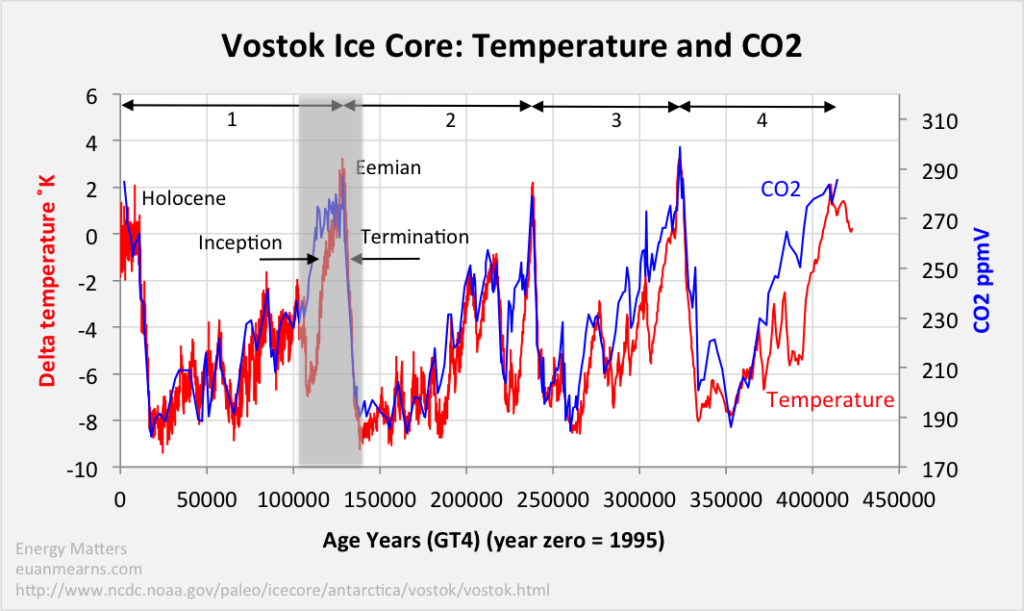
Thank you for your quick answer. Please, look to the picture “Vostok Ice Core: Temperature and CO2”. The text below the graph: “Age Years (GT4) (year zero = 1995)”.
Year zero is 1995 AD (or CE if you prefer). 50000 on the X axis is 48005 BC (or BCE). The Holocene refers to the current interglacial interval, which started around 11000 BC.
What R. Taylor said …
w.
I tend to agree with Robert of the great state of Texas. Anyway, you ask good questions. I would just add that there is a whole lot of circular reasoning going on with regard to ice-core measurements. Back in the 1980’s CO2 ice-core measurements generally showed higher and more variable levels of CO2.
Gradually, the sampling methods were modified until measurement results “made sense.” No one has gone about the task of creating standard levels of gases in artificial ice-cores to verify accuracy and bias. Instead, precision is mistaken as accuracy and a group of ice-core measurement gurus have agreed to do the analyses in the same manner to get “consistent” results.
Willis,
It depends on what ice core data you use and who is “adjusting it” and for what reasons – you get different results. Anyone who does not think that proxy data is “interpreted” does not understand proxy data – all proxies I am aware of are influenced by more than one variable.
For example the Antarctic Ice Core data shows a different relationship between CO2 change and temperature change:
whereas the Vostok Ice Core graph shows the opposite relationship. If CO2 is a “well mixed atmospheric gas” as claimed and is the control knob of temperature, they cannot both be right.
There does seem to be agreement in larger changes over longer times (but not necessarily a good agreement on exactly when). Fluctuations over smaller time periods are (in my opinion) smeared out which is why you do not see them in a 2,000 year sample.
If one could recover these fluctuations, one would likely see CO2 varying with temperature at least to some degree, but more interesting would be which is following the other.
The lag trends seem to agree to me: CO2 change lags Temperature change. I noticed they are time scale trend opposites–Vostok 0 is on the left; Antarctica 0 is on the right.
Or am I reading them wrong?
Great read, Mr. Eschenbach. Clear, concise, great point.
Just to be clear with everyone, I do not disagree with your point (Willis). I am merely suggesting people be careful with spicing data sets and also with any great confidence in CO2 and temperature proxies. Scientists are way too eager to demonstrate their points using proxies that are more complex then either they realize or maybe just willing to acknowledge.
Plant stomata CO2 proxies do not agree with the ice-core CO2 measurements, Willis.
In the attached figure, plant stomata CO2 is on the left, ice core CO2 on the right.
The paper is 2013 Steinthorsdottir, et al. (don’t you love that name?).
Stomata proxies generally show much more variation in [CO2]_atm than ice core measurements.
The Steinthorsdottir data show ~400 ppm of CO2 12850(±500) years ago.
Pat, please see my comment above on this question. Beck himself said his data is not useful for determining background CO2 levels.
Regards,
w.
Hi Willis — understood. Beck was an honest researcher badly mistreated by the consensusistas.
It’s interesting to note, though, that snow firn traps ground-level CO2. So, the comparison of ice core CO2 with stomata should be reasonable.
Thanks, Pat. “Ground level” is a bit of a misnomer, however. The ice cores are from either the Greenland Plateau or the Antarctic Plateau, both of which are about a mile up and a thousand or more miles from any CO2 source. It’s why one of the few sites for measuring background CO2 is at the South Pole … so no, the ice cores shouldn’t be expected to agree with the stomata.
After all, plants don’t even grow where the ice core CO2 measurements are taken …
w.
Hi Willis – the attached figure shows the vertical profile of CO2 in the atmosphere as measured in Xiamen China, in 2012, published here.
It’s a pretty linear decrease – about 5 ppm/300 m. The authors says that correlation between ground and aloft CO2 is lost above 800 m.
Unfortunately, it appears similar measurements have not been done at Antarctica, though the interest should be obvious.
Nevertheless, it you’re right. Stomata at ground level measure a different CO2 than occurs at 3000 m.
Ice core CO2 is also smeared across the firn-closing time, so that annual variations are lost.
Also, you’re right Willis that the elevation of core ground zero escaped my original thinking of the problem.
There’s an object lesson ooopsie. 🙂
Robert of Texas,
About your objections:
Hi Ferdinand
How are you?
I have a digital co2 measuring device. It is an inexpensive device and so therefore I do not expect it to be accurate to within 10ppm of the 415ppm that the equipment at Mauna Loa and Port Grim state.
However it is very noticeable that the measurements are all over the place, from 380 to 650ppm but most generally around 530 to 580.
Is my machine wildly inaccurate or do the sophisticated means of calculating ‘official’ co2 iron out these peaks and troughs?
I live at the edge of an urban area close to the sea and with very little industry. Currently there is limited traffic. There is very little plant growth at present
What do you think?
Tonyb
Hello Tony, I am doing quite well, with a few “repairs” and a lot of pills every day, still going strong (not as 20 years ago, but not bad). Hope you are well too…
The problem with local measurements over land is that there are too many local sources and sinks which make that local levels over the first 200 m over land are all over the place… Especially under inversion, levels can exceed 600 ppmv at night.
With sufficient wind, that get mixed with the above air and CO2 levels drop to about what they are at Mauna Loa or the South Pole within 10 ppmv…
I did see someone who had a very accurate CO/CO2 meter and could show a car starting at a distance of 50 meters… Plants are not assimilating CO2 yet, but still there is CO2 emitted by plant decay within and above the soils, even under a layer of snow. Plus a lot of wood and other fuels are burned for heating.
You may try the following: if you are at the beach and measure CO2 when the wind is from the seaside, you should get levels of around 420-430 ppmv (in the NH spring, levels are highest just before new leaves start to grow)…
If the current rise in CO2 is natural then it is coming from the warmer ocean surfaces as we recover from the Little Ice Age.
It then follows that if the CO2 record derived from ice cores fails to show atmospheric CO2 varying with global temperatures then the ice core record is flawed.
Ice cores do appear to show some long past correlation with global temperatures with an eight hundred year long lag period but nothing in the ice core record shows the large short term variability in atmospheric CO2 that we are currently observing.
The most likely conclusion is that atmospheric CO2 varies naturally much more than the ice core record has led us to expect.
The higher levels that must have occurred during previous millennial scale temperature fluctuations are simply not showing up in the ice cores.
So, either humans are causing all the increase or the ice cores are a bad proxy. I know which I am inclined to believe.
The suggestion that humans are responsible for all of it is implausible because that would allow a zero effect from warmer ocean surfaces.
Ice cores fail to reflect short term variability because it takes a very long time for the amount of CO2 absorbed into ice to arrive at a stable quantity. Probably as long as that 800 year lag time.
Stephen Wilde March 22, 2021 10:34 am
Warming does indeed cause increased CO2 to come out of the oceans. However, from the Vostok temperature/CO2 data immediately above, a temperature change of ~ 10°C causes a CO2 rise of about 100 ppmv. This is rate of 10 ppmv per degree, far too small to explain the ~ 120 ppmv of CO2 rise shown in Figure 1 above. During that time the earth has warmed a degree or so, which would only increase CO2 by about 10 ppmv.
Say what? Look at Figure 1. The ice core record is absolutely showing “the large short term variability in atmospheric CO2 that we are currently observing”.
Since you’ve started with an incorrect premise, your succeeding conclusions are not valid.
w.
Willis,
You said, “Warming does indeed cause increased CO2 to come out of the oceans. … This is rate of 10 ppmv per degree, far too small to explain the ~ 120 ppmv of CO2 rise shown in Figure 1 above.”
While most of the CO2 arising from out-gassing takes place in the tropics, there are significant contributions from cold up-welling along continental coastlines. These waters are relatively unaffected by the average global air temperature rise because they have very high CO2 contents that allow release not only by warming, but also the reduction in pressure from the deeps they originate in.
Out-gassing from the oceans is only one contribution from rising temperature. Bacteria responsible for aerobic decomposition of organic material increase their rate of decomposition and reproduction as the temperature increases. One sees that in the ramp-up of atmospheric CO2 during the NH late-Winter and early-Spring, reaching a peak when the trees start to leaf-out in early-May. We have to be concerned about the net change. Plankton are part of the equation, which doesn’t get addressed. The tilling of agricultural soils increases the surface area of the soil, allowing a more rapid exchange of gasses. The Vostok data show that the correlation and phase relationship between temperature and CO2 was not as good 350,000+ years ago. There are other things going on that don’t appear to be accounted for.
There is no question that the 5% of anthropogenic contributions to the Carbon Cycle have increased in the last century. However, that doesn’t really explain the temperature increase. The CO2 may just be ‘along for the ride.’
I don’t think that the out-gassing is linear. One of the implications is that daytime out-gassing rates will be higher than nighttime rates, and the nighttime rates will generally be increasing faster.
We know that the Arctic is warming faster than the global average. I don’t believe that all climate regions are warming at the same rate. Assuming that the areas of oceanic out-gassing are warming at different rates than other regions, to use global average temperatures and well-mixed global CO2 concentrations to calculate the average out-gassing CO2 volume increase per degree of temperature, is a first-order approximation.
Clyde, the CO2 equilibrium pressure (pCO2) between seawater and atmosphere indeed is non-linear, but there is an approximation used for the compensation of the continuous equilibrium equipment on board of research and commercial vessels and the “in situ” seawater temperature at the main cooling water inlet:
(pCO2)sw @ur momisugly Tin situ = (pCO2)sw @ur momisugly Teq x EXP[0.0423 x (Tin-situ – Teq)]
That gives for around 15 C global average seawater temperature around 16 ppmv/K change.
While the above change is for a single seawater sample, it doesn’t matter, as you can use the same formula for the whole dynamics of all global oceans (all other variables kept constant). A change of 1 K in global ocean surface temperature is good for about 16 ppmv change in the atmosphere.
The amount of CO2 input by upwelling and absorption in de deep oceans is roughly around 40 GtC/year. That changes by temperature, but also with the CO2 pressure in the atmosphere: with 1 K increase in temperature, the circulation is back in equilibrium with 16 ppmv extra in the atmosphere:
http://www.ferdinand-engelbeen.be/klimaat/klim_img/upwelling_temp.jpg
Thanks, Ferdinand. That gives an order-of-magnitude agreement with my eyeball estimate of ~10 ppmv/°C that I gave above based on the Vostok data.
w.
Willis, anyway a good estimate… The Vostok ice core shows a more or less linear ratio of 8 ppmv/K, but the proxy (δD and δ18O) temperature change is mostly from where water vapor condenses to snow, which is nearer to Antarctica, where temperature changes are twice as fast as global. That gives some 16 ppmv/K globally.
In my opinion not by coincidence the same as the pCO2 change of seawater with temperature around the current sea surface temperature…
Of course, there are other influences like what vegetation does between ice ages and interglacials and it takes time to get a new equilibrium with all ocean waters, including the deep oceans, which partly may explain the long lags of CO2 after T changes.
My impression is that the ocean surface temperature is the leading driver for the historical CO2/T ratio changes over the past 800,000 years…
“The CO2 may just be ‘along for the ride.’ Would suggest that the flat ice core “curve” is probably an artifact of the science – in other words bogus, probably because of the ways curves get flattened during averaging.
Bill Parsons, there are huge differences in resolution between different ice cores, as that largely depends of the local snow accumulation rate.
For the very high accumulation rate (1.2 m ice equivalent/year) summit ice cores of Law Dome the resolution is less than 10 years, including a 20 year overlap (1960-1980) between the ice core measurements and the direct measurements at the South Pole.
The drawback is that rock bottom is reached already with 150 years of average gas age.
A third core was drilled more down slope and has a resolution of about 20 years, but goes back some 1000 years in time. That shows a small drop (~8 ppmv) CO2 during the LIA cooler period.
And so on in overlapping time periods until 800.000 years for the Dome C ice core with a resolution of 560 years.
The point of interest is that the current increase of 120 ppmv in 170 years would be visible in every ice core of the past 800.000 years, be it with a smaller amplitude, but none such “peak” is observed anywhere in any period…
Willis, In chapter 5 of “Climate Change, the facts 2020” Jo Nova considers “The puzzle of stomata versus ice cores” and questions the accuracy of ice cores.
With all due respect to Jo Nova, ice cores and stomata are measuring totally different things.
w.
Can you explain the different things they are measuring. I’ve read that chapter too .. just interested in your comment further on this. Thanks in advance
Andrew, theoretically, the stomata density or stomata index is a reverse measure of the CO2 levels of where a plant grows from the average during the previous growing season. The higher the CO2 levels at the place where the plant grows, the less stomata are formed.
The problem is that these are local CO2 levels, not the “background” CO2 levels, which can be found in 95% of the atmosphere: everywhere over the oceans and above 200-300 m over land. Furthermore also influenced by other items like drought. Anyway far from accurate.
Near surface over land, you can find any level of CO2 you (don’t) want: 250 during the day, when plants remove lots of CO2 out of the atmosphere and over 500 ppmv at night under inversion due to soil respiration.
Even monthly averages can have sudden peaks of unknown origin, while the “base” for a fixed place can be +40 ppmv or more compared to “background” at Mauna Loa or South Pole or…
While one can calibrate the stomata data against ice cores, firn and direct measurements over the past century, nobody knows how the local bias changed over the centuries, as landscapes changed over time in the main wind direction and even the main wind direction itself may have changed in certain periods…
They have one advantage: the CO2 estimates have a better resolution, thus CO2 changes have a better detection limit, but still that are local/regional CO2 changes, not global…
Fig 1 just suggests that it takes a while for the initial CO2 content to settle to the long term baseline level within the ice core record.
I do not believe the ratio of 10 ppmv per degree since there are multiple processes governed by temperature that have an effect on the carbon cycle.
One way or another the ice core record is smoothing out large short term variability in atmospheric CO2.
The best test would be for a long spell of La Nina dominance leading to a cooling atmosphere. I would expect to see atmospheric CO2 start to fall back again.
Stephen, there is a near linear ratio between CO2 levels and temperature over the past 800,000 years in the ice cores
The discrepancies are mainly from the large lags when the earth is cooling towards a new ice age.
That ratio was exceeded from only 170 years ago and currently over 110 ppmv too high.
There is no way that the oceans would give 100+ ppmv extra from 0.8 K increase in temperature. That violates Henry’s law and all knowledge about the solubility of CO2 in seawater…
You get very different CO2 measures from Antarctica and Greenland. Some believe the Greenland CO2 figures are bogus because of contamination.
Nelson, CO2 measurements from Greenland ice cores are unreliable, due to frequent highly acidic dust inclusions from the nearby Icelandic volcanoes. Together with a lot of sea salts (which contain carbonates), you can form CO2 in situ and even more with the ancient method to melt the ice and extract CO2 from the solution: the longer you wait, the more CO2 you get.
Antarctic ice cores contain much less salts (factor 10 and more) and the nearest active volcanoes are at least thousand km away…
The melting method is not used anymore for CO2, nowadays it is grating under sub-freezing temperatures or more accurate (for isotopic measurements) the newer sublimation technique: everything is sublimated and cryogenic separated and measured…
“CO2 measurements from Greenland ice cores are unreliable, due to frequent highly acidic dust inclusions from the nearby Icelandic volcanoes. Together with a lot of sea salts (which contain carbonates), you can form CO2 in situ and even more with the ancient method to melt the ice and extract CO2 from the solution: the longer you wait, the more CO2 you get.”
Well, that doesn’t instill much confidence. Thanks for the details.
Some doubts about this chemical reaction were raised because the carbonate content of ice is difficult to measure directly and so the carbonate content is estimated indirectly from the Ca2+ concentrations. Tschumi and Stauffer concluded, after completing a detailed lab study on Greenland cores, that the acid-carbonate reaction can explain only about 20% of the CO2 surplus and they suggested oxidation of organic compounds may also be responsible. Therefore, the theory to explain surplus CO2 evolved to become the result of a combination from two different chemical reactions. Additionally, they were unable to find any clear evidence to explain CO2 depletion in the Greenland ice cores. Smith et.al. also acknowledges it was unclear how reactants could be mobile in ice where diffusion is extremely slow assuming the reactions occurred after the air bubbles in ice are formed.
Renee, thanks for the info, still that doesn’t explain the continued formation of CO2 with the melted ice measurements. And indeed also not the CO2 depletion in certain periods…
Anyway, there is a lot more dust inclusion in the Greenland ice cores than in Antarctic cores which gives a higher chance of interference…
Answers to your questions
1. Your temperature records are local. You must take Mann’s reconstruction. It is global. There is no “warm” or “cold” periods. Everyone knows, it is a hockey stick.
2. You have to plot CO2 in log scale
forgot the /sarc?
Thanks for the chuckle
Mann’s reconstruction is global? When he used one tree?
One tree brought us to this.
From the article: “Looking at Figures 1 and 3, you can see the overlap in each case and verify that the proxy and instrumental records are clearly in good agreement. ”
Well, it depends on what instrument record one uses.
See how well the CO2 record correlates with this instrument record:
The US surface temperature chart (Hansen 1999) and tack the UAH chart on the end to bring it up to date:
This is the real temperture profile of the instrument era. All other regional surface temperature charts resemble this temperature profile. None of them resemble the Berkeley Earth “hotter and hotter” temperature profile. The last 100 years or so of that Berkeley Earth chart are a distortion of reality. If the correlation matches this distortion, then what do you have? Not much of anything, it looks like to me.
Tom, I don’t understand this. You say “See how well the CO2 record correlates with this instrument record”.
But I didn’t say the CO2 record correlates with the temperature record. I said the Ljungqvist temperature proxy agrees with the Berkeley Earth temperature record.
Next, the Berkeley Earth graph is for the area 90°N to 30°N. This, as everyone from Hansen to UAH agrees, is the fastest-warming part of the planet. So yes, it is different from the US temperature record.
w.
I guess my main complaint is you are giving Berkeley Earth legitimacy. I don’t think it is a legitimate temperature record, so I think it is important to point this out.
I don’t have so much of a problem with Berkeley Earth’s rendition of the climate record during the satellite era (1979 to the present), although I think that has been bastardized, too, but I have a big problem with how they treat the Early Twentieth Century where they have turned the warmest era in the last 150 years into insignficance, and these Hockey Stick charts like Berkeley Earth are the only reason anyone is concerned about the Earth’s temperatures. This concern is unwarranted and is being generated by the bogus Hockey Stick charts.
I don’t think we should lend credibility to the Hockey Stick charts, the Alarmists ONLY “evidence” showing unprecedented warming. Blow this lie out of the water and it’s over.
So I’m trying to blow this lie out of the water.
Thanks, Tom. Here, just made today special for you, is a comparison of three main temperature records. Hey, you pays your money, you takes your choices. Me, I’m not happy with any of them.

Best regards,
w.
Because as Tony Heller has pointed out from time to time, Berkeley Earth is using the spuriously adjusted (i.e., only ONE WAY, and that is warm, for recent years, and one way cooler for the period of the 1920s and 1930s, when the hottest average temperatures of the 20th century were actually occurring) NOAA and NASA GISS temperature data. The raw data exposed them as playing games to fit their pet climate theories.
Yes, we get the charts comparing CO2 increases to temperatures, and they correlate very well with the instrument-era Hockey Stick global temperature charts. This is by human design.
If one compares CO2 increases to actual temperture increaes as recorded in regional temperature charts, then we see that CO2 increases do *not* correlate with temperature increases.
Here’s a chart of the AMO.
Now overlay this CO2 chart on the AMO chart. There’s no correlation.
Willis
I am glad you are beginning to see the truth now.
Indeed, all warming has nothing to do with CO2. Everything is natural:
https://breadonthewater.co.za/2021/03/04/the-1000-year-eddy-cycle/
When you click on my name you can read another report where I find a strange distribution of current global warming.
Obviously the answer to all of your questions is that there is heat from earth and there is heat from the sun.
The modern warm period is just another Roman/Mideviel period. Note a 800 year dormant volcano coming back alive again:
https://www.dw.com/en/iceland-bracing-for-volcanic-eruption-after-many-quakes/a-56893744
“Beginning to see the truth”? I’m saying NOTHING different here than I’ve said for decades. And when someone insults me like that, the odds of me following their links goes to zero.
And no, the answers to the questions is NOT “heat from earth and … heat from the sun”
w.
Sorry Willis. I have you on record as saying you could not find any millenial cycle. You want me to find it?
Anyway. There is no fight here if you agree that a natural millennial cycle does exist.
BW
Henry, are you intentionally irritating? It doesn’t matter to me, as I can recognize the often good points and comments that you make. But sometimes you rub people the wrong way when there’s no reason for it.
Henry, I just searched this post and all the comments. The only person who has said anything about a “millennial cycle” is … well … you. And you’re right, I’ve never found any “millennial cycle” in any natural dataset.
As to a 1000-year cycle in the Ljungqvist data in this post, I NEVER look for or trust a cycle that is longer than a third of the underlying dataset. You need a MINIMUM of three full cycles to diagnose a natural cycle, and even then you can be fooled. I recall analyzing a sea-level dataset where it SEEMED like there was a cycle 1/5 of the dataset length, which is five cycles in the dataset …
… but when I found a longer dataset that included the same data, the cycle disappeared entirely.
Regards,
w.
There are numerous reports mentioned by me in the article – that you do not want to consider looking at – that mention the millennial cycle.
I am here looking at this report (I cannot believe he is lying about the data)
https://foresight.org/some-historical-perspective/
Looking at the first 3 or 4 graphs, I see peaks
-7000
-6000
-5000
-4000
-3000
-2100
-1100 (Minoan)
-50 (Romeinen)
1050 (Vikingers)
2020 (Moderne tijd, coming up to a max soon.)
I consider that an error of 50 or 100 years on the analysis of the ice could be quite normal?
I think it would be worth it looking at it again? Don’t go looking for data before the big flood (which was probably caused by a big object from outer space) because after that everything changed.
Eddy hoeft niet persee solar van aard te zijn. Het kan ook iets anders zijn, bv. dit
https://www.nature.com/articles/d41586-019-00007-1
Maar ik denk dat het erg belangrijk is dat
As I understand, the recent Iceland volcano is mostly an eruption of Lava, not ash or aerosols. My layman’s understanding is that lava with little ash and aerosols is not a significant climate driver.
PM
Have a look at the acceleration in the speed of the movement of the magnetic north pole.
Do some research. There are two different basic kinds of volcanoes. : Andesic and basaltic.
The andesic sort usually come from plate subduction zones, rich in silicates, carbonates and other andesic crustal rocks. Lots of ash and stuff.
The basaltic sort usually come from a mantle convection hotspot (Hawaii) or a seafloor rift (here, Iceland). Basaltics are mostly molten ‘virgin’ deep mantle rock basalt lava (high in iron, low in silicates/reduced carbonates), so much lower pumice/ash/CO2 almost by definition.
Rud
The Eddy cycle does not have to be only solar. It may also because of a re-alignment of the inner core of earth:
https://www.nature.com/articles/d41586-019-00007-1
D’Andrea et al (2011) used a special way to detect the Eddy cycle but mentioned as a possible cause a combination of solar and volcanic activity.
Clearly my results are showing that the warming is coming from the north and slowly expanding to the south. Click on my name.
Exactly! And if they can’t answer those questions about warming—warming that is clearly unrelated to atmospheric CO2 levels—they have no business peddling the theory that CO2 is the primary cause of current or historical warming; a theory for which they have only one potential piece of evidence: a mathematical model based solely on the observation that CO2 absorbs infrared radiation at a couple wavelengths and supposedly prevents it from radiating away from the planet; wavelengths which mostly overlap wavelengths absorbed by H2O, water vapor. As far as I have seen, there has been no experimental verification that increasing the amount of CO2 in a mixed-gas atmosphere simulating Earth’s (78.09% nitrogen, 20.95% oxygen, 0.93% argon, 0.4% water vapor, 0.04% carbon dioxide) causes warming and no one has quantified by experiment how much warming results. It’s simply a mathemetical simulation based on unproven assumptions. Paleoclimate data suggests that atmospheric CO2 concentration increases as a result of warming associated, for example, from Milankovitch cycles, not the other way around; perhaps due to warming oceans and outgassing, who knows?
Emissivity is the ratio between the total energy in a system and the energy entering/leaving by radiation.
Consider IR energy entering a translucent, reflective system.
Suppose 30% of the incoming radiation passes through, 30% is reflected, 40% by balance is then absorbed.
Emissivity is 40%.
Consider energy leaving a system.
Suppose 10% leaves by conduction, 20% by convection, 15% by advection, 30% by latent, by balance radiation accounts for 25%.
Emissivity is 25%.
According to the ubiquitous K-T energy balance a net 160 W/m^2 arrives at the surface.
Upwelling are 17 sensible W/m^2, 80 latent W/m^2, by balance 63 LWIR W/m^2.
Emissivity by balance is 63/160=0.39.
Theoretical LWIR leaving a 16 C surface is 396 W/m^2.
Theoretical emissivity is 63/396 = 0.19.
IR instruments assume 1.0 emissivity not 0.19 which is how they (SURFRAD & USCRN) effectively double the amount of upwelling energy in the atmosphere out of thin air.
That’s prohibited by 1st LoT.
I fear your definition of emissivity is incorrect. Here’s an example to show that.
Suppose we have a block of steel that is cooling by conduction/convection to the air, and the rest by radiation. Your claim is that “emissivity” is the ratio of heat lost to radiation compared to the total heat lost by an object.
Now suppose we set a fan to blow on the block of steel. The amount of heat lost to convection/conduction to the air will increase, the temperature of the block will drop, and as a result, the fraction of heat lost to radiation will be much smaller.
And of course, per your claim, that would mean that the “emissivity” of the steel block is changed by a fan … which is not true at all. Emissivity of a substance is a property of the substance, and it isn’t changed by a fan.
Emissivity has nothing to do with radiation in a given circumstance. Emissivity is defined as the ratio of the radiant energy emitted by a surface to that emitted by a blackbody at the same temperature. That doesn’t change with circumstances.
For most natural substances including water, ice, and snow, the emissivity is quite close to 1.0. As a result, that value is used in many first-cut or general analyses of the earth’s energy budget.
w.
Thanks for summarizing my experiments that demonstrate rad does not function separately from the non-rad atmospheric heat transfer processes and as such there can be no theoretical, “What if?” calculated BB “extra” net GHG DUPLICATED energy loop (i.e. the 333 up/down of the K-T balance) all the while avoiding my two points:
1) The albedo makes the earth cooler with an atmosphere not warmer,
2) There is no surface BB up/down welling DUPLICATE “extra” energy for the GHGs to “trap” or whateveh so where do they get it?
“As a result, that (BB) value is used in many first-cut or general analyses of the earth’s energy budget.”
This DUPLICATES the energy calculation and is incorrect.
I know how to balance a checking account and detect DUPLICATE entries.
You?
“Suppose 10% leaves by conduction, 20% by convection, 15% by advection, 30% by latent,” This is false. The only way the heat energy coming in from radiation can leave is via radiation. Conduction, convection, advection and latent does not work at the boundary between the atmosphere and the vacuum of space.
Does air cool as it rises via convection in the earth’s lapse rate? As water vapor condenses does it radiate to space?
And the OLR shows no divergence from atmospheric temperatures.
There goes the heat being trapped nonsense meme.!
The whole AGW farce is based on heat being trapped in the lower atmosphere anyway, which it isn’t.
Extra CO2 at high altitude will help outward radiation..
So your comment is counter what you are slithering around try to say.
There is no evidence that atmospheric CO2 causes warming.
If you think there is, you should be able to produce it.
1… Do you have any empirical scientific evidence for warming by atmospheric CO2?
2… In what ways has the global climate changed in the last 50 years , that can be scientifically proven to be of human released CO2 causation?
My post refers to the atmospheric mass & associated K.E. between the surface/air interface and ToA.
There are no molecules, kinetic energy or temperature above ToA (32 km).
The cosmic temperature of 5 K (NOT C) refers to any molecules or atoms one might stumble upon at the EDGE of space not in the temperature of the general VOID of space where “it depends.”
Willis,
”Splicing clouds” is a super interesting post. If US temps are overlaid on Fig. 8, does it show a general temp. correlation ? C’mon, I know you did not leave that stone unturned ! I was not aware of any data set that showed such a large cloud cover variation over a long term. One would expect a long term higher temperature trend would cause a long term cloud increase. This because short term temperature trends result in higher surface water evaporation. This causes increased Water vapor IR feedback and more warmth, until the total precipitable water column causes clouds and the incoming SW is reflected away on a 4 hour thunderstorm to 10 day weatherfront cycle. So generally warmer…generally more clouds….
Consider the possibility that earth does not change temperature equally over both the poles and the equator. Similarly, does the cloud cover change equally with latitude?
I know those questions are somewhat rhetorical, meant to show the disconnect between climate and CO2, however Willie Soon gives a really “neat” explanation/hypothesis for this in the following lecture:
The “Global Blue Sun”: Solar Anomaly during 1450s-1460s (start at 39:37)
Willie Soon: “You all realize that the Sun is not at the center of the Solar System, right?”
https://youtu.be/XxiQoanjvLE?t=2377
Most of the lecture is about another topic, but that section is just fascinating. And I have shown it numerous times to open minded people who are doubting what the IPCC and news are telling them and who are looking for other theories.
Sections like that were the reason I got into science and had I seen that as a graduate student, I might have been persuaded to consider climate science. It is just amazing how connected everything is.
And I often follow-up that Willie Soon video, with this one, to demonstrate how incredibly complex patterns can emerge from a simple oscillation.
A simple demo of order and chaos (and order again) – Home made Pendulum Wave with 15 billiard balls
https://youtu.be/JsIgubUjTck
Climate Science has the potential to be an amazing field of research, once it gets beyond the CO2 hypothesis. IMHO
I don’t believe, 280 ppm was the upper limit of CO2 in the atmosphere.
Looking at stomata data, they were higher.
Looking at the data E.G. Beck collected, measured chemically there were too higher quantities.
Including data from 5000 m above Helsinki, f.e. or the data measured in Giessen, Germany, where later, together with Massen, as wind strengh and direction also were measured, the found a formula to calculate the background account of CO2, both far over 300 ppm.
The respective paper they presented at AAAS was nominated as best.
Krishna, as E. G. Beck himself commented on one of my threads, you are conflating two very different things. One is the amount of CO2 near the ground, as measured by stomata data and direct measurements. The other is the “background level” of CO2. From Beck:
Ernst Beck June 5, 2010 2:44 am
Background CO2 levels can only be measured in a few places where conditions are right. Among them are Mauna Loa Observatory, Cape Grim in Tasmania, and the South Pole.
Ground-level CO2 measurements, as you point out, are both larger and more variable than background CO2 measurements. However, ground-level measurements are not the “atmospheric CO2 levels” discussed in climate science.
See my post “Under the Volcano, Over the Volcano” for a detailed discussion of this question. That’s the post that Beck commented on.
w.
Willis, I know the comments, I know the problems loacal <> background data. But as I wrote in my comment above, Francis Massen and Ernst Georg Beck published a paper in later times, about just that problem of ground measured CO2 data and background level.
Accurate estimation of CO2 background level from near ground measurements at non-mixed environments
Abstract
Atmospheric CO2 background levels are sampled and processed according to
the standards of the NOAA (National Oceanic and Atmospheric
Administration) Earth System Research Laboratory mostly at marine
environments to minimize the local influence of vegetation, ground or
anthropogenic sources. Continental measurements usually show large diurnal
and seasonal variations, which makes it difficult to estimate well mixed CO2
levels.
Historical CO2 measurements are usually derived from proxies, with ice cores
being the favorite. Those done by chemical methods prior to 1960 are often
rejected as being inadequate due too poor siting, timing or method. The CO2
versus wind speed plot represents a simple but valuable tool for validating
modern and historic continental data. It is shown that either a visual or a
mathematical fit can give data that are close to the regional CO2 background,
even if the average local mixing ratio is much different.
Both, Beck and Massen knew the problem and tried successfully to solve it with the data from Giessen, as mentioned above. And the estimated data were much higher as they shouldt have been.
Krishna Gans, I had several years of discussion with the late Ernst Beck.
The problem with the historical data was not the method used (+/- 10 ppmv), the problem was where was measured. In the middle of towns, in forests, over, between and under growing crops,…
Depending of day or night, wind direction and wind speed, you could measure any level of CO2, except the real background level in 95% of the atmosphere…
See my comment on his tremendous amount of work here:
http://www.ferdinand-engelbeen.be/klimaat/beck_data.html
While CO2 levels measured in ice cores are direct near-global measurements of ancient air, be it averaged over 10 to many hundreds of years, the stomata data are proxy’s that reflect local/regional CO2 levels in the previous growing season of the place where a plant grows. That gives an inherent local bias, which is corrected for by calibrating the stomata data to ice core, firn and direct CO2 data over the past century.
The problem is that there is no possibility to know how the local/regional bias changed over the centuries before, because of changing land use or even changing main wind direction in some periods (MWP-LIA) over the past centuries…
Anyway, if the average of the stomata data differs from the ice core CO2 data over a period longer than the resolution of the ice core, the stomata data should be re-calibrated with the ice core data, not reverse…
Ferdinand
As previously reported the data here show no change in T over the past 40 years. Click on my name. In fact, minimum T dropped. Now, I happen to be a hiker. And everywhere I have been here I see more green on the mountains. What I am saying is that anything to do with life as a proxy for T might not work that well for the past 2 centuries due to the positive effect of CO2 on life.
Anyway. In the light of your results are you admitting now that CO2 does not cause any warming?
I am sure that CO2 has helped to boost the growth of plants and reduced the number of stomata (or the stomata density index) over the past centuries. The latter is of ultimate interest for (semi-)dry areas, as less stomata also mean less loss of water vapor and thus increases the survival rate of plants…
I am not “admitting” anything, because I never thought that CO2 had a huge influence on temperature, but “nothing” is too far on the other side, as there is a measured influence on the radiation balance. The net result is theoretically about 1 K for each doubling (280-560 ppmv), anyway far below most failed climate models show…
5000m over Helsinki measured data are not ground based, and these were higher as we are told to be 280 ppm
Khrisna, if the CO2 levels measured near ground level were around 300 ppmv, how can the CO2 measurements at 5 km height then be at 500 ppmv?
Or measured at ground level in the same year: 400 ppmv in India and 280 ppmv in Chicago?
Current CO2 levels measured all over the world with airplanes are within +/- 10 ppmv of the levels measured at Mauna Loa, once you are above the inversion layer:
http://www.ferdinand-engelbeen.be/klimaat/klim_img/inversion_co2.jpg
Mike’s Nature Trick makes us all leery of splicing the instrumental record with proxies. As you say, certain conditions have to be met for splicing to be valid.
On the other hand, when the proxies and the instrumental record agree, that gives us confidence in both.
Figure 2 is interesting. The CO2 proxies and instruments agree. Based on my poorly calibrated eyeballs, it does not appear that the increase in atmospheric CO2 leads the increase in the atmospheric temperature. If the increase in CO2 were causing the increase in temperature, the increase in CO2 would have to come first.
If the increase in atmospheric temperature comes before the increase in CO2, either the increase in CO2 is cause by the increase in temperature, or there is something else that is the cause of both.
The ocean ‘contains’ much more heat than the atmosphere and contains much more CO2 than the atmosphere. My guess is that the answer to the questions about what caused the RWP, MWP, LIA, etc. are to be found in the oceans. Certainly, the closure of the Isthmus of Panama is used to explain the current ice age of which the Holocene is the latest interglacial period. link
commieBob, most of the ice core literature agree that temperature changes first and CO2 follows the temperature. For the glacial-interglacial transition the lag is about 800 +/- 600 years in the Vostok ice core, for the opposite transition the lag is several thousands of years.
That short lag during warming allows the modellers to assume that CO2 helps the warming, as there is an overlap between temperature and CO2 during the 5000 years of warming.
Unfortunately for them, there is no overlap in the last cooling period after the previous warm period some 110-130.000 years ago (the Eemian). After the temperature dropped to a new minimum and land ice reached a new maximum, the CO2 levels started to drop with some 40 ppmv, without a clear effect on temperature or land ice formation:
http://www.ferdinand-engelbeen.be/klimaat/eemian.html
Maybe something for Willis and R to calculate the attribution between Milankovitch cycles, CO2 and temperature / ice sheets for the warming and cooling (and overall) periods…
My last use of a similar attribution program (Anova?) is already some 50 years ago…
‘They’ have excuses why not to believe the ice cores. That’s why I’m pleased to see the ice core data overlaying the instrument data so nicely.
Willis, an important caveat to this discussion is that the CO2 data are showing concentration for the whole atmosphere, while the Ljundqvist reconstruction is showing temperature in the extra-tropical Northern Hemisphere. If you want to examine a relationship between temperature and CO2 across the common era, wouldn’t it be more appropriate to use a global temperature reconstruction?
Thanks, Weekly. Background CO2 levels vary little around the planet, so the analysis is valid.
In addition, we don’t have a good reconstruction of global temperatures due to the paucity of southern hemisphere data.
w.
Background CO2 levels vary little, but surface temperatures vary quite a lot. The LIA and MWP, for instance, were not globally synchronous events. Thus comparing a global CO2 signal to a regional temperature signal might not tell you very much about the relationship between the two. I would propose that a global reconstruction using any proxy data from the southern hemisphere, or even tropical latitudes, would be more suited to the analysis you’re trying to do than a mid to high latitude NH reconstruction.
But isn’t it the Arctic climates that are warming even more “worse than we thought” than all the other climates that are warming “worse than we thought”?
So isn’t Willis’ analysis giving you agw disciples a better track to work on than you’d get if the tropical climates were used?
(Quit when you’re ahead, lad, is the best advice I can give you on this one)
Hi Mr., my aim is not to get an ideal “track” to work on, it’s to understand the truth. My position is only that I don’t think Willis’ approach adequately supports his argument that there is little relationship between warm/cold periods and CO2 across the common era. You’d need to compare CO2 with a global reconstruction to establish that.
.
Which is exactly what he does in Figure 2
So your position is meaningless.
Anyway, there is no evidence CO2 causes warming.. Period. !
Warming may cause some increase in atmospheric CO2.
Figure 2 shows global CO2 compared to a temperature reconstruction for 30-90N, or am I missing something?
Yes, a functioning brain.
Fred, you really must learn to behave like an adult if you want other adults to engage with you in a productive way. You do nothing but hurl insults and invective whenever you respond to me. Please try to control your manners.
The Pages2k is a highly biased fabrication, and has MANY issues with it.
https://climateaudit.org/2014/10/07/pages2k-vs-the-hanjiharvi-reconstruction/
https://climateaudit.org/2018/10/07/pages2k-2017-south-america-revisited/
Here is a much better reconstruction that doesn’t rely on the blatant inadequacies of tree ring data
You are assuming they were not globally synchronous events.
I provided a link to a research paper showing that they were not globally synchronous events.
Based on CO2 deprived tree rings
MWP existed and was GLOBAL
RWP existed and it was GLOBAL.
GET OVER IT !!
“I would propose that a global reconstruction using any proxy data from the southern hemisphere, or even tropical latitudes, would be more suited to the analysis you’re trying to do than a mid to high latitude NH reconstruction.”
I agree. Even though there are only a few sites used to draw these plots, you can see questions like:
“Why did the temperature start dropping after the Roman Warm Period? Why didn’t it just stay warm?” aren’t so relevant in the SH, certainly not for Antarctica.
“In addition, we don’t have a good reconstruction of global temperatures due to the paucity of southern hemisphere data.”
Aren’t you looking for your car keys under the 30°N to 90°N streetlight?
Loy-dodo presents a graph CLEARLY SHOWING the MWP was warmer than now, even in the Antarctic.
Antarctic temps aren’t based on tree rings , are they !
And yes, we KNOW the current slight warming is not global.
Well done Loy-dodo, you have just destroyed the global warming fallacy. 🙂
You need to get your dinky car out from under your bed, child. !
Actually, I think all Willis’s questions have the same answer. Its the sun with a bit of internal variability from the oceans, volcano’s, etc. thrown in. No I can’t prove it. There just aren’t any other good answers except maybe changes in the earth’s magnetic field strength.
THere is a huge literature on the questions Willis has listed. Here is a paper that provides some interesting data
(PDF) Holocene Climate Change and the Evidence for Solar and other Forcings (researchgate.net)
What I find interesting is how little attention is being paid to the earth’s declining magnetic field. We are currently losing about 5% per decade. There is lots of work on the paleo measures of the earth’s field strength. Here is one chart from PAPACORA-200 – Paleoclimate, Paleomagnetism, and Cosmogenic Radionuclides of the past 200,000 years (gfz-potsdam.de)
I find studies saying the earth’s magnetic field strength is decreasing by 10% per century … far from your 5% per decade.
Not sure what effect if any this would have on climate.
w.
Willis, the decline started in the mid 1800s. It has accelerated recently. Over the last 10 years it has dropped 5 percent. The mechanism is similar to declining solar activity. The protection against galactic cosmic rays is declining. This has all kinds of effects from cloud formation to volcanic activity. My point is that changes can happen fairly rapidly. Ship of Fools Turney just published a paper on the excursion 42k years ago. Look at the graph I provided. There can be profound impacts on climate from changing magnetic field strength.
Sorry, Nelson, but I’ve looked extensively for any evidence that cosmic rays affect either the clouds or the surface temperatures. I’ve found none. If you have evidence of such, please provide a link.
Regards,
w.
Ask and you shall receive!
Here is a link to an interesting post at Energy Matters.
Cosmic Rays, Magnetic Fields and Climate Change | Energy Matters (euanmearns.com)
While Euan Mearns provides the intro, the post is by Apollo astronaut Phil Chapman.
There are other links to follow in the post.
Here is figure 2
A longer term illustration of the ‘fatal’ attribution problem. Climate models assume the warming that started about 1975 was CO2 induced. But two thousand years of natural variation in temperature did NOT stop in 1975. So the necessarily parameterized to best hindcast models run hot predictively. Not something CMIP6 can fix.
A condensed version of this belongs on the editorial page of The Wall Street Journal.
What ever is the cause of the recent warming. Then the snow cover extent data suggests that its warming mostly between the months of February to September at least in the northern area’s of the NH. But is having less or no impact between the months of October to January.
The Antarctic/Greenland ice sheet CO2 proxy data does not agree with CO2 proxy data determined from analyzing plant leaf fossils to determine CO2 levels based on the number of stomata on the plant leaves. This is a weird fact.
The problem is fake graphs look no different that graphs that are correct.
CAGW/AGW is conceptually incorrect.
The Leaf CO2 proxy data analysis shows that atmospheric CO2, has in the recent past, physically increased and decreased correlating with short term temperature atmospheric changes.
Atmospheric CO2 concentrations has not been the same for the last 2000 years or 1000 years.
Before CAGW took over climate science, there were dozens of papers that showed the CO2 residence time in the atmosphere has around 5 years. As compared the CAGW Bern equation (CO2 sinks and residence time) of 200 years and 25% forever.
This is a summary of CO2 data and past analysis of CO2 levels, and the CO2 residence time scientific questions. CAGW is incorrect and AGW is incorrect, if humans did not cause the majority of the recent increase in atmospheric CO2.
https://www.co2web.info/ESEF3VO2.pdf
We should also note that a large number of the atmospheric CO2 lifetime measurements are based on anthropogenic additions of CO2 to the atmosphere by “bomb carbon-14”.
“The short atmospheric CO2 lifetime of 5 years means that CO quickly is being taken out of the atmospheric reservoir, and that approximately 135 giga-tonnes (about 18%) of the atmospheric CO pool is exchanged each year.
This large and fast natural CO2 cycling flux is far more than the approximately 6 giga-tonnes of carbon in the anthropogenic fossil fuel CO now contributed annually to the atmosphere, creating so much political turmoil (Segalstad, 1992; 1996).”
A detailed look at the C13/C12 isotope changes shows that the C13/C12 ratio of atmospheric CO2 has unexplainably, repeatively, made large step changes up and down.
What is physically causing large step changes in C13/C12 ratio in the atmosphere?
The sudden C13/C12 changes should not be physically possible with CAGW/AGW assumptions.
To suddenly change C13/C13 requires a large missing source of CO2, that is low C13 (primordial CH4) that is entering the biosphere.
Tom Quirk in the SOURCES AND SINKS OF CARBON DIOXIDE shows that C13/C12 ratio changes when there is an ENSO event. (i.e. Anthropogenic CO2 emissions do not increase or decrease when there is ENSO events.)
This is recent finding that the bomb C14 has been found in the marine life in the deepest ocean trenches. The Bern equation assumed no sequestration of carbon in the deep ocean from particulate matter.
The Bern equation is scientifically incorrect. The resident time of anthropogenic CO2 in the atmosphere is less than 5 years.
https://www.livescience.com/65466-bomb-carbon-deepest-ocean-trenches.html
Sources and sinks of CO2 Tom Quirk
http://icecap.us/images/uploads/EE20-1_Quirk_SS.pdf
The yearly increases of atmospheric CO2 concentrations have been nearly two orders of magnitude greater than the change to seasonal variation which implies that the fossil fuel derived CO2 is almost totally absorbed locally in the year that it is emitted.
A time comparison of the SIO measurements of CO2 at Mauna Loa with the South Pole shows a lack of time delay for CO2 variations between the hemispheres that suggests a global or equatorial source of increasing CO2. The time comparison of 13C measurements suggest the Southern Hemisphere is the source.
This does not favour the fossil fuel emissions of the Northern Hemisphere being responsible for their observed increases. All three approaches suggest that the increase of CO2 in the atmosphere may not be from the CO2 derived from fossil fuels. The 13C data is the most striking result and the other two approaches simply support the conclusion of the first approach.
This is a phase analysis which shows, it is fact, that in the last 30 years, CO2 is following changes in planetary temperature. Planetary temperature increases and CO2 rises and planetary temperature decreases and CO2 falls.
https://www.researchgate.net/publication/257343053_The_phase_relation_between_atmospheric_carbon_dioxide_and_global_temperature
The phase relation between atmospheric carbon dioxide and global temperature
Summing up, our analysis suggests that changes in atmospheric CO2 appear to occur largely independently of changes in anthropogene emissions.
A similar conclusion was reached by Bacastow (1976), suggesting a coupling between atmospheric CO2 and the Southern Oscillation.
However, by this we have not demonstrated that CO2 released by burning fossil fuels is without influence on the amount of atmospheric CO2, but merely that the effect is small compared to the effect of other processes.
Our previous analyses suggest that such other more important effects are related to temperature, and with ocean surface temperature near or south of the Equator pointing itself out as being of special importance for changes in the global amount of atmospheric CO2.
William Astley March 22, 2021 12:25 pm
See my comment above. Like that commenter, you are conflating surface and background CO2.
w.
I am not. The Stomata data has been corrected. What hand waving reason do you have for completely ignoring it.
Yes atmospheric CO2 changes regionally. That does not invalidated the stomata data.
You also do not reply to the linked to the discovery that the bomb C14 has made to the deepest oceans.
That invalidates the CAGW Bern equation which assumes there is no fast sequestration of CO2 into the deep ocean.
The point is the super large particular CO2 sink in the deep ocean requires a large new source of CO2. A source that is greater than 135 giga tonnes. Current anthropogenic emissions around 45 giga tonnes.
The short atmospheric CO2 lifetime of 5 years means that CO quickly is being taken out of the atmospheric reservoir, and that approximately 135 giga-tonnes (about 18%) of the atmospheric CO pool is exchanged each year.
CAGW has built on the scam that the only new source of primordial CO2 is from volcanic eruptions which is small source as compared to anthropogenic emissions.
Willis you and almost everyone else looked at one piece of data, the Antarctic interpreted data,,,, and assume it is correct,
The Antarctic ice sheet core data does not even capture the cyclic abrupt temperature change which is the issue.
The Climate in this interglacial Holocene has increased and decreased very rapidly following a pattern,
What is your explanation for the physical cause of cyclic temperature pattern over the last 11,000?
Greenland ice temperature, last 11,000 years determined from ice core analysis, Richard Alley’s paper. William: As this graph indicates the Greenland Ice data shows that have been 9 warming and cooling periods in the last 11,000 years.
http://www.climate4you.com/images/GISP2%20TemperatureSince10700%20BP%20with%20CO2%20from%20EPICA%20DomeC.gif
And you have no physical explanation as to why CO2 would not physically follow planetary temperature changes.
You completely ignored the fact that the recent CO2 Vs Temperature Vs Anthropogenic emissions Phase data unequivocally shows atmospheric CO2 follows temperature change, not anthropogenic emissions.
https://www.researchgate.net/publication/257343053_The_phase_relation_between_atmospheric_carbon_dioxide_and_global_temperature
And you completely ignore the fact that there are short term spikes and drop in the C13/C12 ratio in the record, following temperature.
As anthropogenic CO2 emissions are have the same C13/C12 ratio and do not abruptly change the C13/C12 ratio in the atmosphere should not spike up and down.
A logical explanation is that there is a large unaccounted for source of low C13/C12 ratio CO2 coming into the biosphere.
William, stomata data are corrected for their local bias with ice core CO2 and direct measurements over the past century.
The problem is that nobody knows how the local bias changed over the previous centuries, due to huge changes in land use in the main wind direction. Or even changes in the main wind direction in certain periods (like the LIA)…
Ice core measurements are direct measurements in ancient air, very accurate (+/- 1.2 ppmv in the same core +/-5 ppmv between different cores), stomata data are proxy’s, with their inherent problems: local bias, influence of drought,…
If the average of the stomata data differs from the ice core CO2 data over periods longer than the resolution of the ice cores, then the stomata data must be re-calibrated, not reverse…
What you completely forget is that exchange is not the same as change: even if every year thousands of tonnes CO2 are exchanged between atmosphere and other reservoirs, as long as all inputs together are as large as all outputs together, that doesn’t change the CO2 level in the atmosphere with one gram.
It is the difference between inputs and outputs which changes levels.
In the past 60 years, the difference for human input was always 4% in, 0% out. For nature: around 96% in, 98% out.
That means that the 2% of human input is the sole cause of the increase (with a small addition of warming oceans).
http://www.ferdinand-engelbeen.be/klimaat/klim_img/dco2_em2.jpg
Co2 follows temperature on seasonal (in reverse!), multi-year and millennium scale. CO2 leads temperature in the past 170 years with over 100 ppmv…
Ferdinand,
In reply to:
What you completely forget is that exchange is not the same as change: even if every year thousands of tonnes CO2 are exchanged between atmosphere and other reservoirs, as long as all inputs together are as large as all outputs together, that doesn’t change the CO2 level in the atmosphere with one gram.
It is the difference between inputs and outputs which changes levels.
In the past 60 years, the difference for human input was always 4% in, 0% out. For nature: around 96% in, 98% out.
The CAGW concept CO2 sinks and sources and resident times….
Is absolutely incorrect.
Humans caused less than 11% of the recent rise in atmospheric CO2.
There is a massive sink of CO2 in particulate matter that sinks to the deep ocean.
This is recent finding that the bomb C14 has been found in the marine life in the deepest ocean trenches.
The Bern equation assumed no sequestration of carbon in the deep ocean from particulate matter.
The Bern equation is scientifically incorrect. The resident time of anthropogenic CO2 in the atmosphere is less than 5 years.
https://www.livescience.com/65466-bomb-carbon-deepest-ocean-trenches.html
Measurements done 20 years ago estimated that 135 MTonne per year of CO2 is removed from that atmosphere/biosphere every year.
The current anthropogenic CO2 emission are about 45 MTonne/year.
To Keep CO2 for life… The C14 finding… means there must be and is a massive continual source of primordial CH4 that is being pumped into the biosphere.
The rate that the CH4 is being pumped…. Is changing in realtime. Two years before the El Nino events there is all over the world an increase in earthquake frequency at the mid-ocean ridges.
The mid-ocean ridges are being pushed apart by the ‘pumped’ CH4. The CH4 that is pumped carries with it heavy metals from the liquid core of the planet. When the core crystallizes the CH4 is extruded.
CH4 binds to metals, at high temperature and pressure, which is the reason why the CH4 was dragged down to the liquid core of the planet.
Metals in the mantel bind to the extruded CH4 forming a sheath around it, which is like a pipe.
The core is continually crystallizing so the CH4 is constantly being pumped up to the surface of the planet. Where it moves the ocean plates apart and pushes pieces of continents about. And raises mountains.
It is interesting that geology does not have a force to move the ocean plates and continental plates in multiple directions.
https://www.newgeology.us/presentation21.html
Plate Tectonics: too weak to build mountains
“In 2002 it could be said that: “Although the concept of plates moving on Earth’s surface is universally accepted, it is less clear which forces cause that motion. Understanding the mechanism of plate tectonics is one of the most important problems in the geosciences”8.
So the frequency of the mid-ocean earthquakes all over the world in 1997 increased by 300%. And stayed at the new high rate…. moving up and down two years below El Nino events.
Logically there must be a physical force to cause ridges to move apart and to cause the earthquakes at the mid-ocean ridges where the ridges are being pushed apart.
And logically that force must be able to increase by a factor of three suddenly.
https://www.omicsonline.org/open-access-pdfs/the-correlation-of-seismic-activity-and-recent-global-warming-2016update.pdf
The Correlation of Seismic Activity and Recent Global Warming: 2016 Update
The Correlation of Seismic Activity and Recent Global Warming [1] (CSARGW) demonstrated that increasing seismic activity in the globe’s high geothermal flux areas (HGFA) is strongly correlated with global temperatures (r=0.785) from 1979-2015.
The Bern equation assumes zero particulate sequestration.
The Fact that C14 produced by atomic bomb testing has been sequestered in the deep ocean…..
Invalidates the Bern equation assumptions…..
https://www.co2web.info/ESEF3VO2.pdf
We should also note that a large number of the atmospheric CO2 lifetime measurements are based on anthropogenic additions of CO2 to the atmosphere by “bomb carbon-14”.
“The short atmospheric CO2 lifetime of 5 years means that CO quickly is being taken out of the atmospheric reservoir, and that approximately 135 giga-tonnes (about 18%) of the atmospheric CO pool is exchanged each year.
William,
William,
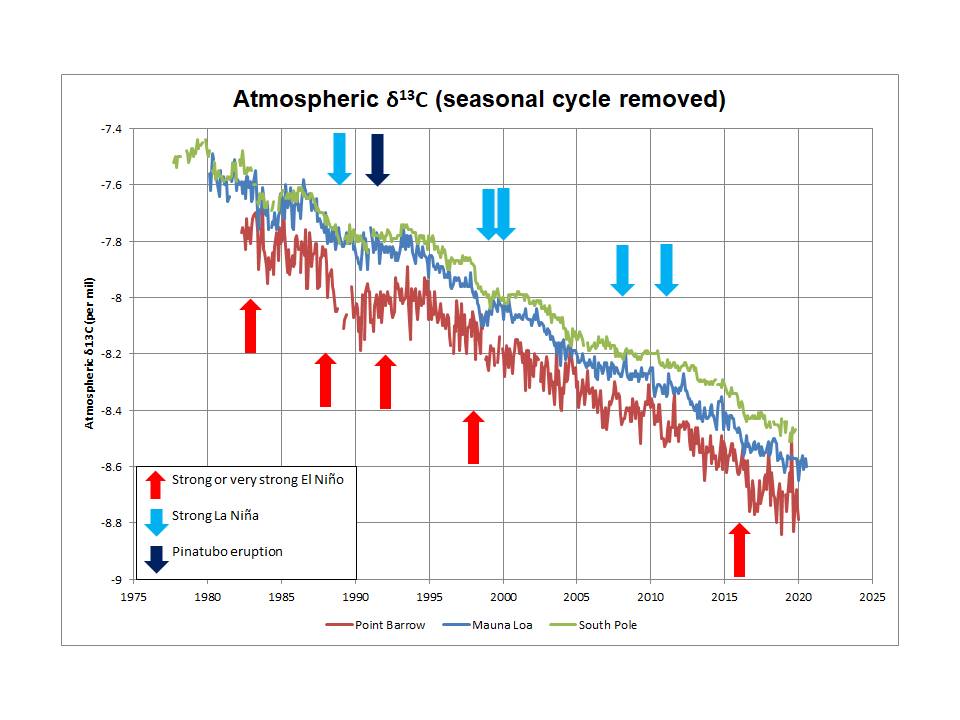
I agree with much of what you say about the 13C/12C data. Also, it’s good to see Tom Quirk’s work referenced again.
In terms of the possible link between El Niño-Southern Oscillation (ENSO) events and changes in the 13C/12C ratio in atmospheric CO2, that there appears to be no AGW-based models which are able to match the observed behaviour, which is sometimes referred to as inter-annual variations. See, for example,
https://agupubs.onlinelibrary.wiley.com/doi/full/10.1002/gbc.20048
The most obvious explanation of the observed atmospheric variations is that the 13C/12C ratio of the incremental CO2 does in fact change with ENSO events. It is constant when averaged over the longer term (-13 per mil in δ13C terms), but increases/decreases above and below that average in response to ENSO events. It decreases (more negative in δ13C terms) during a major El Niño, and increases during a major La Niña. The models cannot match this because they assume that the variation in CO2 growth rate is almost entirely due to less/more removal of anthropogenic emissions by the terrestrial biosphere, so their assumption is invalid. Here is a plot of the atmospheric δ13C observations with the seasonal cycle removed (values downloaded from Scripps):
I should add, for clarification, the “very strong” El Niño events of 1982-83, 1997-98 and 2015-16 (classified according to the Oceanic Niño Index, ONI) all correlate with significant and very rapid drops in atmospheric δ13C. The “strong” event of 1987-88 also stands out, probably because it was a continuation of a moderate El Niño during the previous year. The “strong” El Niño of 1991-93 does not show up; this is widely considered to be due to it being masked by counteracting effects of the Pinatubo eruption.
Based on ONI, no La Niña events are classified as “very strong”. Those that are classified as “strong” correlate with the opposite characteristic to El Niño events: they show a lack of change, or even an increase, in atmospheric δ13C levels. Similar to La Niña events, the Pinatubo eruption correlates with a period of relatively stable atmospheric δ13C, also indicating the incremental CO2 had a δ13C that was above the average of -13 per mil.
Jim Ross:
There is nothing mysterious about El Nino events. Without exception, they are caused by reduced levels of SO2 in the atmosphere, which increases the intensity of the sun’s radiation striking the Earth’s surface.
And vice Versa, for La Ninas.
Jim Ross, there is a good correlation between the interannual ENSO events and the δ13C variability and that is proven caused by the influence of temperature and rain patterns on tropical forests.
When a change in CO2 is caused by the oceans, that shows up as a parallel change of CO2 and δ13C in the atmosphere (CO2 of the oceans has a higher δ13C level than the atmosphere), if the change is caused by vegetation, that shows as an opposite change in CO2 and δ13C.
Here the graph 1991-2012:
http://www.ferdinand-engelbeen.be/klimaat/klim_img/temp_dco2_d13C_mlo.jpg
That includes the Pinatubo eruption (which did give a boost in plant growth) and the 1998 El Niño with a drop in plant growth and extra forest fires especially in the Amazon.
What matters is that the short term variability and the long term trend is completely opposite to each other, that means that they are caused by different processes.
The long term trend in vegetation is more uptake (proven by the O2 balance), which prefers 12CO2, thus leaving relative more 13CO2 in the atmosphere.
Neither is the case in the oceans, which too are more sink than source and have less influence on δ13C levels.
The only huge source of negative δ13C values is our use of fossil fuels…
Jim, if you know me you know I can’t resist actually running the numbers for myself. So I just went and got the full set of ∂13C data from here, and compared it to the variations in the ONI. There are 11 stations recording ∂13C.
Result? Nothing. The mean correlation of the detrended ∂13C data with the 11 stations of ONI data is a miserable 0.20, minimum 0.06, maximum 0.36, standard deviation 0.08 …
w.
Willis,
Excellent, thank you. And if you knew me you would know that I publish my interpretations of the data in order that someone will challenge them. That is how I learn stuff. My biggest frustration is when no-one engages in the discussion and that has been a real limitation with ∂13C data, which very few commenters here seem to understand. I do have a lot of sympathy with them, however, as I had a lot of trouble getting my head around negative ratios initially.
I will look at your input later, probably tomorrow, but I do appreciate your feedback.
In the meantime, I note that you refer to de-trended data. Why? If you de-trend the monthly data, all you see is the annual cycle (+/- -26 per mil) and not the longer term effect of the ENSO. Here is why:
Thanks, Jim.
I detrended the ∂13C data because it has a strong trend and the ONI has no trend. This will skew any correlation results.
w.
Willis,
My comment was poorly worded, for which I apologize. I agree that you do need to de-trend the data to investigate a possible correlation with ONI, but the monthly δ13C data that you linked to include the seasonal cycle, which largely masks the impact of ENSO. This is also true of atmospheric CO2 growth rate changes that are well correlated with ONI, and is the reason why most analyses of CO2 growth rate are performed on data that has had the seasonal cycle removed or is accommodated by using changes from each month to the same month the following year. It is clear that the atmospheric CO2 seasonal cycle does not correlate with ONI so it is not a surprise that the δ13C seasonal cycle does not either.
This is the reason why I was looking at the monthly δ13C data which had the seasonal cycle removed (by Scripps).
There is some noise in the data and also some data gaps, particularly for Point Barrow, so I am aware of its limitations, but the objective was to try to understand the variations in δ13C that coincide with changes in CO2 growth rate which are driven by ENSO (or Pinatubo), and which the latest models still cannot match.
Thanks, Jim. I de-seasonalized the data before looking at the correlations.
Regards,
w.
OK, fair enough.
BTW, I did smile when I read Ferdinand’s comment “there is a good correlation between the interannual ENSO events and the δ13C variability …”!
Thanks for the link to C13/C12 paper Jim. Here is something that changes geological science and kills CAGW. Everything that is observed requires a physical explanation, a cause.
There is hard unequivocal evidence that the deep earth is changing in real time starting in mid 1990s at the sametime the geomagnetic field strength started changes
It appears the deep earth changes are causing planetary temperature changes (the rate of spreading of the ocean plates is increasing in real time.)
We know (based on the fact it is happening) whatever is moving/pushing the large ocean plates all over the planet, is changing in real time, and the sudden increase in the spreading rate of the ocean plates at the mid-ocean ridges, is leading EL Nino temperature changes on the planet by two years.
At the fast spreading ocean ridges magma flows up from the spreading crack, heating the ocean and causes changes to the surface ocean that affect cloud cover and weather.
So there are multiple paradoxes. What is moving the plates? How does it change in realtime?
Why did the geomagnetic field of the earth also start changing at exactly the same time that the ocean ridges all over the planet suddenly in started to increase their spreading rate?
https://www.omicsonline.org/open-access-pdfs/the-correlation-of-seismic-activity-and-recent-global-warming-2016update.pdf
The Correlation of Seismic Activity and Recent Global Warming: 2016 Update
The Correlation of Seismic Activity and Recent Global Warming [1] (CSARGW) demonstrated that increasing seismic activity in the globe’s high geothermal flux areas (HGFA) is strongly correlated with global temperatures (r=0.785) from 1979-2015.
It is interesting that geology does not have a force to move the ocean plates and continental plates in multiple directions.
https://www.newgeology.us/presentation21.html
Plate Tectonics: too weak to build mountains
“In 2002 it could be said that: “Although the concept of plates moving on Earth’s surface is universally accepted, it is less clear which forces cause that motion. Understanding the mechanism of plate tectonics is one of the most important problems in the geosciences”8.
A 2004 paper noted that “considerable debate remains about the driving forces of the tectonic plates and their relative contribution”40.
“Alfred Wegener’s theory of continental drift died in 1926, primarily because no one could suggest an acceptable driving mechanism. In an ironical twist, continental drift (now generalized to plate tectonics) is almost universally accepted, but we still do not understand the driving mechanism in anything other than the most general terms”2.”
“The advent of plate tectonics made the classical mantle convection hypothesis even more untenable.
About a 15 years ago, explosions and seismic instrumentation was used to determine the structures in the vicinity of the mid-ocean ridges that are spreading apart and creating 4 to 6 magnitude earthquakes at the ridges.
So there needs to be a physical explanation as to what is moving the tectonic and ocean plates and why it suddenly increased by a factor of three.
What is moving the plates, is not mantel convection. There is zero evidence of mantle convection. There is no theoretical reason to have convection in the sticky mantel. And convection is up, the force to move a plate that is 5000 miles long needs be in the horizontal direction….. And the force to explain the observations needs to be able to change in realtime.
And because there is constant earthquakes at the ocean ridges zone all over the planet…. The mechanism must continue to pump 24/7 to cause what is observed.
The seismic reflections from the explosions showed there were parallel cracks in the ridge that were caused by compression fracturing.
The deep earth is pumping something into a cavity in the ridge which in turns causes the ocean ridge to crack and move in two directions. This is what is moving the ocean plates.
The something is CH4 that is extrude from the core of the liquid planet as it crystallize. This was discussed at Sloan deep carbon (CH4) conference. At high pressure CH4 bonds to metals. It is hence dragged into the liquid core by metals.
The a sheath forms about the extrude CH4 to form a pipe like structure that cares carries the CH4 and the core crystallization force to the planets surface.
The earth was hit by a Mars sized object about 100 million years after its formation. That impact stripped the mantle of CH4 and water and blasted the earth’s atmosphere into space.
How and when did the earth get is water? Why is it there is only evidence for deep ocean in the last 550 million years? When did the earth’s core start to crystallize?
https://www.sciencedaily.com/releases/2018/12/181212134354.htm
Why deep oceans gave life to the first big, complex organisms
The continuous release of CH4 up into the mantel and into the biosphere explains why the earth is 70% covered with water even though there is continuous removal of water from the earth’s atmosphere by the solar wind.
Organic metals form in the very, very, high pressure liquid CH4. These organic metals drop at specific pressures. This mechanism explains the origins of very highly concentrated heavy metals on the earth’s surface.
The forced movement of the super high-pressure liquid CH4 from the liquid core and drop out of the organic metals at specific pressures explains why there is heavy metal concentration in the crust of in some cases a million times more than the mantle
The same mechanism explains why there is helium in some natural gas fields and oil fields. The helium is produced from radioactive decay of the concentrated Uranium and Thorium that drops out at specific pressures. The super high pressure CH4 that is moving through the mantel provides a path for the helium gas to move up to higher locations where the natural gas and oil are found.
The same mechanism also explains why the tectonic plate movement has double in speed.
http://www.natureworldnews.com/articles/8831/20140902/tectonic-plates-moving-faster-earth-ages.htm
Thomas Gold twenty years ago, in his book, provided evidence (50 independent observation evidence to support that hypothesis) that most oil and gas was formed from deep primordial CH4.
A key observation is the fact that Helium is found in oil and gas deposits. The CH4 that is extruded from the core of the planet when it crystallizes contains heavy metals. This explains why bituminous coal (which has asphaltenes in it) and heavy oil (which looks like bituminous coal)
He provided an example in his book, of a commercial German Bituminous coal mine that has a large seam of bituminous coal runs for miles and miles that is bisected by thin 2 to 3-inch layer of shale.
The bituminous coal deposit was formed in two parts. The ancient sand bed has formed from quartz that was broken down by erosion and then deposit on the shores of a shallow ocean. The climate warmed and there was more moisture and vegetation and mud. This is the period that layered down the mud on top of the first quartz sand layer. The climate changes back to typical and there is again quartz sand layered down on top of the mud which overtime will become shale.
Sometime later, the CH4 is injected into the sand formation. CH4 uses the oxygen trap in the formation to incompletely burn leaving Carbon and creating a weak carbonic acid in the water this produced which removes most of the quartz.
The CH4 that has the C13 carbon moves slower through the old sand bed and hence has a higher probability of reacting with the oxygen in the formation that the CH4 C12 which explains the different C13/C12 ratio in different bituminous coal and heavy oil formation. As the oil gets heavy/more dense (less hydrogen) it has more metals in it and it has more C13.
Bituminous coal’s C13/C12 ratio increases as the density, hardness increases. There is no biological explanation to cause C13/C12 change.
Thank you for you comments, William. It will take me some time to go through them (I am quite slow on the uptake these days!), but I will review them tomorrow and let you know of any comments that I have.
Your welcome Jim. I watched all of the Sloan deep carbon (CH4 in the liquid core of the planet) lectures and read all of the papers.
What I am explain is not a new theory. It is a physical theory. The only possible physical explanation for all of the observations.
The CH4 extrusion from the liquid core of the planet raised the continents and covered the continents with limestone which is formed in shallow oceans.
The CH4 extrusion geologically reshape the surface of the earth and created the deep ocean and provided that water to fill those oceans.
North American continent is a layer cake, scientists discover
https://www.sciencedaily.com/releases/2010/08/100825131445.htm
The North American continent is not one thick, rigid slab, but a layer cake of ancient, 3-billion-year-old rock on top of much newer material probably less than 1 billion years old, according to a new study by seismologists. The new findings also indicate that the continent grew by addition of rock from subducting ocean floor, not by mantle plume upwelling from below.
The North American continent is not one thick, rigid slab, but a layer cake of ancient, 3 billion-year-old rock on top of much newer material probably less than 1 billion years old, according to a new study by seismologists at the University of California, Berkeley.
I read Thomas Gold’s book 20 years ago and have been following that subject ever since.
As I said Gold proved the concept that primordial CH4 that carries heavy metals from the core, is the source of oil, natural gas, and bituminous coal.
His book includes observations of details (C13/C12 ratio, Helium, and so on) of geological formations that can only be explained by that mechanism. Intrusion of CH4 derived hydrocarbon substances into porous formations.
Gold predicted the existence of the tubes that carry and contain the CH4, as it is carried to the surface.
I found David Pratt’s paper, about five years ago, which is a summary that explains that there is no physical explanation as to what moves the ocean plates and the continental plates and a summary of the geological observations that do not have explanations, such as the mountain ranges.
Here are a couple of other interesting observations and another paradox, same subject.
About 7 years ago there has a science journal announcement that deep earth specialists had solved a mystery as to what was immense structure has reflecting portions of seismic waves.
Deep earth specialists, prime information source is the speed of propagation and reflection from density changes in the mantle. It has been known for a decade that there was a massive structure in the mantle that was reflecting seismic waves.
It has known that the object(s) causing the reflection were not a simple density change at a surface or a lens of material. The problem is the structure is so complicated that a single seismic event does not proved sufficient information to determine what the form of the structure.
The science review article noted the solution of this mystery was to use an AI technique where all of the seismic information for multi seismic events is analyzed simultaneous to determine the structure that caused the reflections.
What has discovered is there is a massive interconnecting manifold of tube-like structures in the deep mantle. And that are tubes that connect to that structure and run down to the core of the planet.
The core of the started to crystallize about a billion years ago. However, there is another mystery. The liquid core’s temperature is 1000C too hot for the core to crystallize. It shouldn’t be possible for the liquid core to crystallize. Something we known now is causing the core to crystallize and that cause is changing in real time.
The pumped CH4 from the core of the planet explains the Terra forming events of the last billion years that evidence in the geological structure.
Challenging core belief: Have we misunderstood how Earth’s solid center formed?
Scientists question long-held understanding in new paper
https://www.sciencedaily.com/releases/2018/02/180207151842.htm
Summary:
Researchers are posing an important question about the formation of planet Earth’s inner core, arguing that it’s time to consider the nucleation paradox at the heart of the issue.
It is widely accepted that the Earth’s inner core formed about a billion years ago when a solid, super-hot iron nugget spontaneously began to crystallize inside a 4,200-mile-wide ball of liquid metal at the planet’s center.
Very late to this party. Gold’s abiotic oil and gas (and you add coal) theory was debunked decades ago. Simple stuff like fossils.
It is true that there is a bit of abiotic methane produced under unusual geologic conditions, like the methane clathrates around the Framm Strait seafloor spreading. But none of those involve primordial methane.
If you have been ‘studying this’ for decades then you are a very poor student. The two testst were the deep well in Sweden under cap granite (traces attributed to contaminated drilling mud), and the Russian papers concerning Ukraine (which involved a very faulty stratigraphic analysis, failing to recognize a subsequent overthrust. You can actually look all this up now.
Rud …… Gold drilled in the wrong lcoation.
That does not disprove the fact that there CH4 is being pumped up via a tubes…. from the liquid core of the planet.
Under very high pressures CH4 binds with metals which explains why the liquid core contains an estimate has high as 12% CH4.
That explains the existence of Say…. The Alberta heavy oil deposits.
The Alberta heavy oil deposit was created by a system that pumped the hydrocarbon material into massive sand beds.
The heavy oil melts at 300C. This is explained by three tubes that pumped into the bituminous like material into the sand.
The three heavy oil deposits are 60 Meters to 80 meters thick and cover an area as large as the UK.
Please explain how Plants or animals of your choice can be changed by earth processes to produce the three massive deposits full of heavy metals.
This is a no contest ‘fight’ to defend the Biogenic theory.
The Biogenic theory cannot explain the Alberta heavy oil deposits.
That is a fact.
These three strange deposits of a hydrocarbon substance that is full of heavy metals …. just like bituminous coal. full of heavy metals.
Some Chinese coal ash too radioactive for reuse
https://www.sciencedaily.com/releases/2017/11/171109224030.htm
Some Chinese coal ash too radioactive for reuseRadiation levels 43 times higher than UN safety standards
William,
Thank you for your extensive comments. I am at least partly outside my comfort zone now, so I will give additional consideration to your views rather than comment further at this time. I did look at Gold’s work some time back, and I have to say that my views at that time were in line with those of Rud Istvan here.
We don’t even know how much the natural variability is… It’s obvious that something like +/- 3/4ths of a degree C can’t be attributed to CO2, but it could be much much more.
We don’t have the answers but we’re ready to overhaul civilization on the gamble that it has something to do with CO2 and doubling down that some moderate warming is harmful.
Willis
I found in my many years of fixing every type of machine known to man, that a mans (meaning all humans) ability to fix things is directly proportional to their ability to use bad words at exactly the right time. In fact I think if you spend enough time learning all the ins and outs of a good curse storm you can forgo most technical training.
The geologists I interact with consider the Earth to be in an Ice Age, for from 5 million years ago to only 2.5 million years ago, with intra-glacial and inter-glacial (which we are now in and getting close to the finish?) cycles, which cycles are getting longer for intra-glacial and shorter for inter-glacial.
Ron, looked this up for my Greenland 1 mya vegetaion at bottom of ice core post. There is serious speculation that the current ‘ice era’ began with the plate tectonics closing of the Panama Isthmus, which in turn drastically altered ocean currents. That was, for example, Prof Deyyes of Princeton’s view. For about 1.5my it was ‘symmetrical’, about 40k years of ice followed by 40k years of melt. A little less than 1 mya it shifted to ‘asymmetrical’ with about 100k years of ice accumulation then about 20k years of melt. Nobody knows why. Whole different ball game, explaining the newly discovered ~1mya vegetation at the 1400 meter down bottom of the Camp Century ice core obtained in 1966. The 1400 meters of ice all accumulated after the switch from symmetric to asymmetric.