Guest Opinion by Kip Hansen — 5 January 2024 — 2500 words/15 minutes
Roger Pielke Jr. recently posted a piece at The Honest Broker titled: “U.S. Climate Extremes: 2023 Year in Review – A Very Normal Year” – which was subsequently reposted at WUWT.
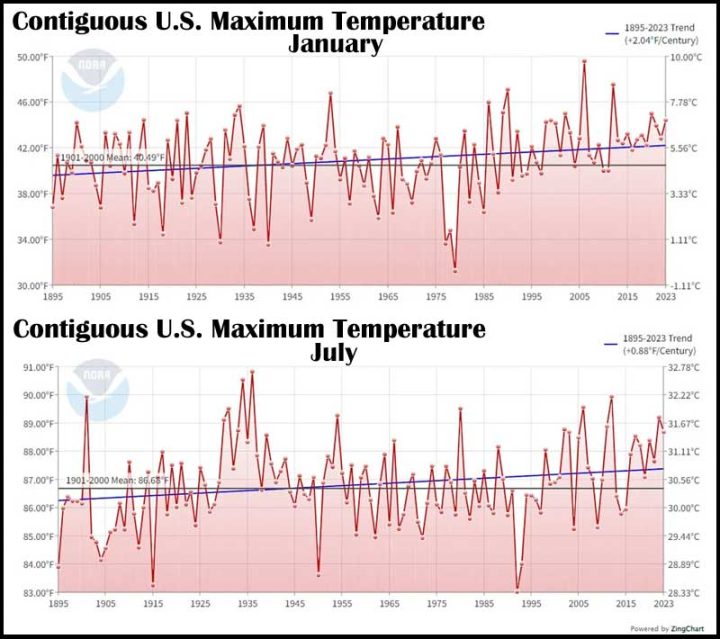
In that post, he uses this graphic:
(I have increased the size of the titles for clarity – kh)
It is easy to see that the trends of both the Maximum January temperatures and the Maximum July temperatures have been rising — more so for January temperatures than July — though this is somewhat obscured by the different scales of the two graphs. [Caveat: The temperature record on which this graph is based is not scientifically reliable before about 1940.] Also, one has to be careful to note what exactly they are really measuring.
This is not the usual average temperature. Not monthly average temperature.
It is Contiguous U.S. Maximum Temperature for these two months, January and July – based on the assumption that these are the coldest and hottest months. At least we can say they represent a cold month and a hot month.
So how do we calculate such a record? Let’s just assume NOAA has done what is usually does – it took some kind of an average of the maximum temperatures reported each day by its weather stations in the Contiguous United States – those temperatures reported usually as “Tmax” in the daily station records.
Let’s leave aside all my usual arguments about the inanity of such averages and just accept the idea that they are trying to represent. (None of this is Roger Pielke Jr.’s fault – he is just reporting what they say in the NOAA produced graphics.)
But rather, consider exactly what they are reporting – Maximum Daily Temperatures (averaged somehow). But how is this measured?
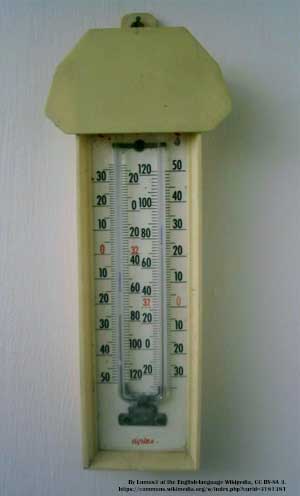
How was this measure in the early 20th century? They used something like this, the Six’s Min-Max Thermometer.
However, the Wiki explains:
“MMTS (meteorology)
A Maximum Minimum Temperature System or MMTS is a temperature recording system that keeps track of the maximum and minimum temperatures that have occurred over some given time period.
The earliest, and still perhaps most familiar, form is the Maximum minimum thermometer invented by James Six in 1782.
Today a typical MMTS is a thermistor. This may be read locally or can transmit its results electronically.”
Weather.gov offers this information:
[If you are familiar with weather stations you can skip this section.- kh]
Temperature Sensors – Liquid
Thermometers used in a CRS [Cotton Region Shelter] are Liquid In Glass (LIG) and are either alcohol or mercury. Alcohol thermometers are employed in the colder climates where winter temperatures drop below -40 degrees, the freezing point of mercury. Minimum temperature thermometers have a small bar embedded in the liquid that is pulled down the tube as the temperature falls. As the temperature warms again and the liquid moves back up the tube, the bar remains at the minimum temperature. This allows the observer to read the lowest temperature. Maximum thermometers have a small break near the base of the well of liquid at the bottom of the thermometer. As the temperature falls from the maximum, this break in the liquid keeps the liquid in place at its high point. The maximum and minimum thermometers are mounted on a rack. After noting the highest and lowest temperatures, the observer then tilts the rack. This resets the thermometers by rejoining the liquid in the “maximum” thermometer and sending the bar back to the top of the liquid in the “minimum” thermometer. The thermometers are now reset, allowing observation of the highest and lowest temperatures for the next day.
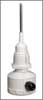
Temperature Sensor – Electronic
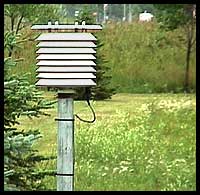
[The newer electronic MMTS can look like the one picture here.)
Another and newer type of thermometer is the Maximum Minimum Temperature System (MMTS). An MMTS is an electronic thermometer, not too different from the type one might buy at a local electronics store. The MMTS is a thermistor. This thermistor is housed in a shelter similar in appearance to a bee hive. This design is similar in functionality to the CRS. Currently, the MMTS requires a cable to connect the sensor with a display. Future plans are for wireless displays. This would eliminate many of the problems associated with cabled systems.
In the 1980s, thermistor MMTS units began to be introduced into the NOAA and NWS systems. [ source ]
In a larger application, such as the NY State Mesonet, a typical station looks like this:

This is a Mesonet station high in the Catskill Mountains, I took this photo a couple of weeks ago. Circled is the 6-foot temperature sensor. It is specifically a RM Young 41342 [spec sheet] in a RM Young 43502 – Aspirated Radiation Shield. The standard version has an accuracy (at 23°C ) of ±0.3°C (about 0.5°F), with a 10 second response time.
Why do we need to know the response time when measuring 6-foot (2 m) air temperature? Well, when you were a child (most of us, anyway) the doctor and your mother took your temperature with “liquid-in-glass” oral thermometer (for me, a mercury-in-glass then later alcohol-in-glass) which you were required to hold “under your tongue” for how long? “for 3 minutes.” That’s how long it took to get a “liquid-in-glass” [LIG] thermometer to reliably change and record temperature. Our original Six’s Min-Max Thermometer-style thermometers, used for many years and still in use in some places today, had a similar response time to changes in temperature measured in minutes – not seconds.
This becomes important when looking at the Maximum Temperature record for any weather station. For a properly sited weather station, which would look something like the Mesonet station pictured above in many ways, there is little chance of spurious very-short-term temperature changes being recorded by an electronic MMTS. There are no parking lots, no air conditioners, no jet exhaust, no delivery trucks, no buildings reflecting heat, no odd little shifts of blowing a stream of uncharacteristic hotter air over the sensor for a minute, etc.
Many NOAA weather stations consist of a MMTS alone, on a pole. (see Anthony Watts’ Surface Station Project reports.)
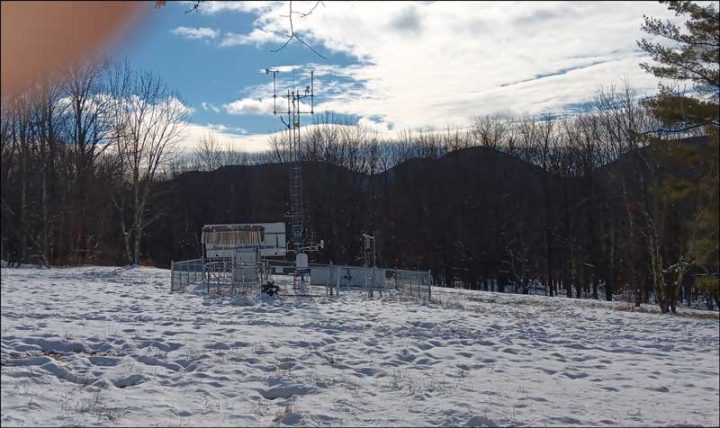
[Interesting note: The NYS Mesonet station TANN, pictured here with a UFO (unidentified finger object) in the upper left, looked to me, when I visited it on a cold snowy morning, to be a very well sited weather station. But on its site data page it gives a siting rating for various measurements according to WMO SITING CLASSIFICATIONS FOR SURFACE OBSERVING STATIONS ON LAND [required reading for anyone concerned about station siting and the temperature/weather record] in which “WMO guidelines give different variables a classification number, with 1 being the best [on a scale of 1-5]. Higher-numbered classifications indicate that the site’s surrounding environment may cause uncertainty in the data.” Of the three categories rated for this station, it received a “4” for Temperature/Humidity and a “5”s for Surface Wind and Precipitation.]
Back to response time: Why would this make a difference?
I didn’t know but I had suspicions….so, naturally, I asked Anthony Watts, probably the man most knowledgeable about how temperatures are measured inside of Stevenson Screens, in the somewhat similar Cotton Region Shelters (CRS), and in modern electronic weather stations, this question:
“Pielke Jr has published these graphs of January and July Maximum temperatures. (his substack and at WUWT.)

What are the chances that some of the rise is due to the use of electronic weather stations which report INSTANTANEOUS highs and lows?”
With Anthony’s permission, I quote his answer:
“Absolutely, I’m convinced that short, local events, such as a wind shift bringing heat from pavement can contribute to a high that is spurious. The MMTS system as well as the ASOS system logs the Tmax – it does not log the duration.
The response time of a mercury or alcohol max/min thermometer basically makes it a low pass filter, and such spurious events don’t get recorded.
The solution is to install a “mass hat” on an electronic thermometer sensor to get its response time down to that of a mercury or alcohol max/min thermometer.” — Anthony Watts (personal communication)
[“Mass hat” – this would be something like a sleeve that slips over the thermistor, which is the long skinny probe seen in this image, with sufficient mass that has to change temperature before the thermistor is affected – thus slowing the response time of the thermistor to more closely match that of liquid-in-glass max/min thermometers.]
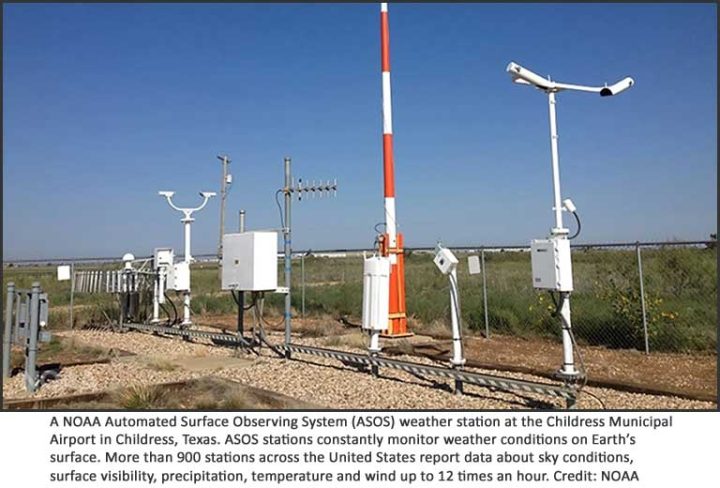
How’s that, you say? It is a result of exactly what they are measuring and recording: the Maximum temperature reading. Here are the hourly Maximums from an imaginary weather station:
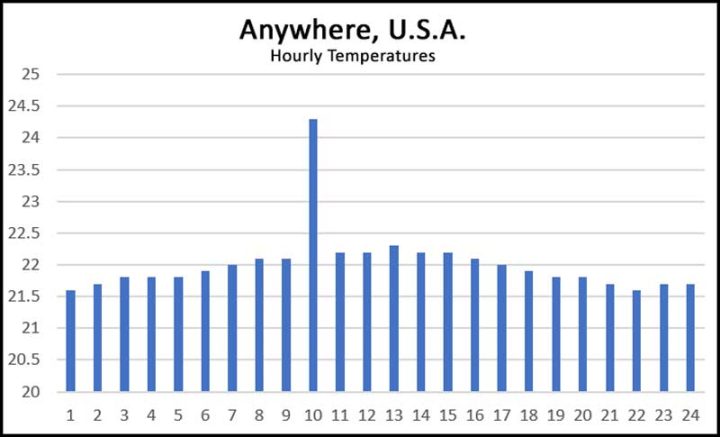
We can see the usual diurnal shape, warming to midday, cooling overnight. But, hey, what’s that sticking up in the middle? At 1000 hrs? That, my friends, is a spurious instantaneous temperature reading. You see, this below is the imaginary Anywhere, U.S.A. station:
You can see the MMTS there on the left-hand side, on the lawn, and the five air conditioning units 6 to 8 feet away. Maybe, around 10 o’clock, the buildings air conditions all started up, timer controlled, and kicked out lots of heat just as an errant puff of wind came around the corner from the building on the right, blowing all that extra heat over the MMTS for a minute. The MMTS dutifully records a new Maximum Temperature. That little spike would be reported as the Maximum for the day, averaged into the Monthly Maximum. As more and more MMTS are added to the network, the more spurious instantaneous Maximums can be recorded, slowly driving the Contiguous U.S. Maximum Temperature of January or July up a bit each year, as the number of MMTS units increase the number of spurious readings.
These types of spurious Tmax readings can be caused by all sorts of things. See Anthony’s two Surface Station reports [2009 here and 2022 here]. At airports, a badly sited MMTS can be influenced by passing or turning jet airplanes on the runway, taking off or landing. For parking lot sited stations, a UPS or Amazon truck parked right next to the MMTS can reflect extra heat onto the MMTS for a minute or two. An odd little puff of wind picks up the hottest air six inches above the black asphalt and wafts it up over the MMTS. The point is that it doesn’t have to last long – 10 second response time! New Tmax!
Let me provide a real-time, real-life example from a weather station I have visited many times: C – Turkey Point Hudson River NERRS, NY (NOS 8518962). We can find the real time standard meteorological data for last 45 days from this page. Temperatures are recorded at six-minute intervals (which are averaged instantaneous measurements). [Note: ASOS stations, on the other hand, use five-minute intervals.] Looking closely at the data for examples, we find this 30 minute period on December 18th 2023 from 1436 to 1500 – five six minute records:
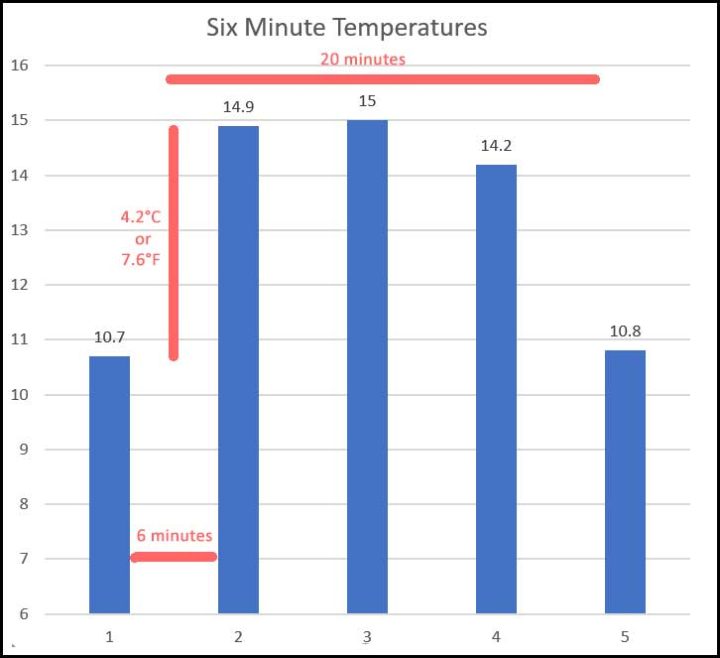
A temperature jump of 4.2°C (or 7.6°F) in six minutes? For over 20 minutes, the recorded temperature remains higher, and then is aback at 10-11°C. [See note just below] There are lots of instances of these types of oddities in the record of this station. In this case, we have a 10-11°C (about 50°F) day suddenly transformed into a 15°C (60°F) day — for 15 minutes. That 15°C is a Tmax for the day – almost 4°C higher than the rest of the day. The average temp (including the spurious reading) for the hour (all six-minute records) in which this oddity occurs is 12.7°C.
Note : “Once each minute the ACU [which is the central processing unit for the ASOS] calculates the 5-minute average ambient temperature and dew point temperature from the 1-minute average observations (provided at least 4 valid 1-minute averages are available). These 5-minute averages are rounded to the nearest degree Fahrenheit, converted to the nearest 0.1 degree Celsius, and reported once each minute as the 5-minute average ambient and dew point temperatures. All mid-point temperature values are rounded up (e.g., +3.5°F rounds up to +4.0°F; -3.5°F rounds up to – 3.0°F; while -3.6 °F rounds to -4.0 °F).” [source: ASOS Users Guide, 1998] The station illustrated is a NERRS station and uses 6 minute intervals, but the algorithm is similar – kh.
Here is how that works to bias the temperature record – both the Tmax record and the Tavg record:

(Click image see full size in a new tab or window)
The five latest 1-minute values are averaged, giving a new 5-minute-average every minute. In the NERRS network, 1-minute values are averaged every five minutes to created the Recorded 5-minute Temperature record. [Note: different agencies use slightly differing algorithms and timings – NERRS uses six minute averages, while ASOS uses five minutes.] A single 1-minute spurious temperature causes five spuriously high 5-minute averages in the “averaged every minute” system used in ASOS (the orange trace in the graphs above) . In the NERRS network, 1 spurious reading creates at least two spuriously high Recorded 5-minute values (red trace and stars).
The graph at the top of this essay – Contiguous U.S. Maximum Temperature – is created by this process: “Once each day (at 23:59 LST), the highest and lowest ambient temperatures for the current month, along with the date(s) of occurrence, are computed and stored in memory until the end of the following month. On the first day of the following month, ASOS outputs the Monthly Maximum Temperature and date(s) of occurrence, plus the Monthly Minimum Temperature and date(s) of occurrence.” It logically follows that spuriously high instantaneous readings can easily make that monthly Maximum Temperature listing and thus create the graph from NOAA highlighted by Pielke Jr.
Yes, it can be confusing, but: The NERRS network does not record each 1 minute temperature, only an average every six minutes. ASOS and MMTS record a new 5-minute average every minute, which are also not a record of the 1-miute temperature measurements themselves.
These are examples of spurious instantaneous MMTS/ASOS temperature readings and their effects – and lead to the bottom line:
Bottom Line:
There is a reasonable hypothesis that could or should be investigated:
With the widespread introduction of MMTS and ASOS weather stations over time since 1980, which record instantaneous temperatures every minute with a 10 second response time, spurious instantaneous high temperatures can be recorded as Tmax driving up both the daily temperature average (Tavg) and the daily, weekly monthly and annual Tmax records.
# # # # #
Author’s Comment:
A good question based on curiosity about an observation of something (anomalous or not) is the basis of all good science and research.
This topic could be important – as all the temperature records (local, US Contiguous, Regional, Global) are based on the record of Tavg – the daily “average” temperature of a weather station. That “average” is not the average of all the temperature measurements for a 24 hour period, but rather the “average” of the Tmin and Tmax of that 24 hour period. Thus, Daily/Weekly/Monthly Average Temperatures are highly influenced by Tmax. [for details, see this document![]() from the National Centers for Environmental Information]
from the National Centers for Environmental Information]
It is not just the Tmax record that can be nudged higher by anomalous instantaneous affects all of the subsequent temperature metrics.
Nearly 20 years ago, K. G. Hubbard et al. produce a paper titled “Air Temperature Comparison between the MMTS and the USCRN Temperature Systems” which found MMTS systems biased Tmax high and Tmin low. It was based on a single year’s worth of data but claims that MMTS data was or maybe still is being “corrected”.
Just to be clear: This Opinion piece represents my personal investigation and opinion on the topic – I have quoted Anthony Watts’ response to my emailed question. Everything else, every word, is my responsibility and does not necessarily represent his viewpoint.
Thanks for reading.
# # # # #
And even if in reality there is a little trend upward on tmax ; do we really expect temps to be so invariable in a system with so many variables and chaotic inputs natural or otherwise. I think it would be highly improbable emphasis on improbable if we saw perfectly flat averages everywhere for ever and ever.
Hmmm
…
John ==> There is an interesting paper about “Global Warming as a Manifestation of a Random Walk” by
A. H. Gordon and William Briggs discusses it here.
Not covered here in this OpEd, but interesting nonetheless.
This OpEd is about a bias in the Temperature Record.
Obviously a real problem, well described and written.
The real tragedy is that when they changed from mercury to MMTS, they didn’t run both at every station for a year. Wasted opportunity.
w.
The lack of overlap to determine the reference frame shift calibration was in my opinion deliberate. Proof: Germany did the same thing (lack of overlap), which Pierre Gosselin severely criticized over at NoTricksZone.
Rud and w. ==> It seems that meteorologists were simply convinced that the MMTS were “more accurate” and thus didn’t need checking against the “less accurate” LIG thermometers.
w. ==> K. G. Hubbard et al. produced a paper titled “Air Temperature Comparison between the MMTS and the USCRN Temperature Systems”. They did a 1 year “sorta” comparison.
It wouldn’t have fixed the problem with response times. The difference in response time would have still biased any offset determined from running both at the same time even over a year. Whenever possible they should have *kept* the old station for as long as possible and started a whole new record for the new station.
What the article and your (WE) comment point out is NOAA is not interested in good science or even giving the impression they are interested.
Similar to the 2009 study of weather station siting. A few years ago a repeat study showed the siting was worse than 2009, not better.
That’s bad science.
These examples of bad science lead to one obvious conclusion: We can not trust any number from NOAA
The average US temperature is whatever NOAA wants to tell us it is. To support a global warming narrative. we will be told there is a US rising trend … whether there is a rising trend or not. It doesn’t matter if their raw data are 100% accurate or not. The Department of Commerce expects a rising temperature trend from NOAA and that is what they will get, one way or the other.
The three questions I think of when reading a climate or energy articles:
— Are there enough relevant data to support the conclusion
— How accurate are the data
—- Do I trust the people collecting the data?
For NOAA, my answer is no
One reason is they are government bureaucrats and almost all government bureaucrats are leftists. Truth is not a leftist value. The coming global warming crisis hoax gives leftists in governments a lot more control over the private sector.
The second reason is NOAA’s NClimDiv networks, with up to 96% of stations improperly sited, seems to have almost the same US average temperatures as their USCRN network, with allegedly 100% properly sited rural stations that allegedly require no adjustments. My common sense says siting does make a difference and NOAA has fixed their numbers in one of the networks, or both of them. I don’t trust NOAA, NClimDiv or USCRN.
Back in the 1990s when I first learned how ocean temperatures, 70% of Earths surface, were measured, I looked for a study comparing the different methods and instruments used. This was before ARGO floats, yet another new method. I wanted to know if the change in measurement methodologies affected the trend. I was looking for a study of different measurement tools used in the same place in the ocean. Never found such a study.
That’s bad science.
The Honest Climate Science and Energy Blog
Bob Tisdale produced this nice little chart of ocean temperature coverage.
The lack of coverage in the SH and the unregulated way in which ocean temperatures were/are measured , makes them totally meaningless.
Which of course makes any fabrication of “global” temperature that uses them, combined with totally unfit-for-purpose surface stations.. ..
… utterly and completely meaningless as a measure of anything, anywhere over time.
It is very obvious that NOAA’s ClimDiv FABRICATION is being controlled by USCRN.
Make a graph of the difference the two.
You will see that Climdiv starts, in 2005, slightly higher (+/-), and that they have gradually got closer and closer as they hone there “adjustment algorithm”
I do trust NOAA,…… to ride and push the AGW scam as hard as they can.
Did at one location. What He measured
Interviewed was meteorologist Klaus Hager. He was active in meteorology for 44 years and now has been a lecturer at the University of Augsburg almost 10 years. He is considered an expert in weather instrumentation and measurement. One reason for the perceived warming, Hager says, is traced back to a change in measurement instrumentation. He says glass thermometers were was replaced by much more sensitive electronic instruments in 1995. Hager tells the SZ ” For eight years I conducted parallel measurements at Lechfeld. The result was that compared to the glass thermometers, the electronic thermometers showed on average a temperature that was 0.9°C warmer. Thus we are comparing – even though we are measuring the temperature here – apples and oranges. No one is told that.” Hager confirms to the AZ that the higher temperatures are indeed an artifact of the new instruments.
http://notrickszone.com/2015/01/12/university-of-augsburg-44-year-veteran-meteorologist-calls-climate-protection-ridiculous-a-deception/
Kip, excellent post. Your ‘metrology science’ is obvious, except to alarmists.
I did a less specific but much broader and longer term analysis of CONUS temperature issues after the original WUWT Surface Stations project, and was able to show (and then expand globally) that the ‘official’ surface temperatures are not fit for climate purpose. Lots of reasons beyond sensor thermal mass.
And some of NOAA’s claims otherwise are just pathetic, like the state by state shift from DRD97X (I might have recalled that method name slightly wrong) to ‘new and improved’ NClimDiv in 2014. NOAA added lots of new warming just by a ‘improved’ methodology change. Before/after details for three states (Ca, Mi, Me) plus net CONUS in essay ‘When Data Isn’t’ in ebook Blowing Smoke.
Rud ==> As you know, I am no fan of averaged temperature numbers. But if we must have and see them, we ought to know how they are really measured and compared.
The Climate Howlers outsmarted you. Sure the historical average temperatures are inaccurate.
But predictions of a coming global warming crisis call for CAGW. CAGW has never happened before. It can not be found in historical instrument data. It’s a new boogeyman.
If we had an accurate historical average temperature, and maybe UAH is that, it would not matter. We’d stil be hearing predictions of global warming doom.
If the Climate Howlers used the current inaccurate average temperature data for their climate predictions, the future warming rate would be cut in half, versus the current predictions (not based on any data at all) and no one would be scared of climate change. The IPCC would be a failure if they couldn’t scare people. We can’t have that.
“Sure the historical average temperatures are inaccurate.” Only when they work against your narrative. Very accurate and reliable when they work for you. Welcome to modern science.
“spurious instantaneous high temperatures can be recorded as Tmax driving up both the daily temperature average”
“they” know that
That’s why “they” want to use it.
Matthew ==> K.G. Hubbard showed that MMTS were biased….in 1991.
And then there are the insights provided in
https://wattsupwiththat.com/2011/01/22/the-metrology-of-thermometers/
https://wattsupwiththat.com/2023/06/29/the-verdict-of-instrumental-methods/
among others
Andy ==> Thanks for those important reminders. The temperature record is in many ways “the dogs breakfast“.
Two points. First, the “fast response” issue is analogous to what is extremely familiar to electronic engineers. If you have a wanted signal plus random noise, then a circuit with a large bandwidth (“faster response”) will let through a greater amount of random noise. The “peak” of this (in both directions) will be greater than that from the small bandwidth circuit.
Secondly, switching from a max-min to a continuous (or quasi-continuous) measurement for diurnal cycles may introduce “asymmetrical bias”. Consider first a hypothetical station where the temperature varies with an identical periodic signal over each day between Tmin and Tmax. Let there be two thermometers, a max-min and a continuous one. Now if, hypothetically, the temperature were exactly sinusoidal, then they would agree on a diurnal “mean”, which would be (Tmin+Tmax)/2. However, if the temperature were a distorted sine wave, with blunter peaks but sharper troughs (“night frosts”) then they would disagree: the “mean” temperature computed by the continuous device would be higher than that computed by the max-min device. For example, a night frost would depress Tmin more than it would depress the overall daily average. This parallels your air-conditioning day time blip”, but does not posit poor siting beside heat sources.)
I don’t know what typical diurnal cycles look like, specifically regarding their possible asymmetry about their mean, and how it varies from site to site. That would be interesting to investigate, though I’m sure it would have been done long ago, as presumably your references point out: it’s hardly an subtle problem.
The suggestion therefore is that switching from max-min to continuous thermometers may introduce a non-existent warming if the site has “spikey” cool nights and “blunt” hot days.
That was exactly something that bugged me with my little dataloggers and also watching the nearest nearby Wundergrounds
All of them running at 5 minutes intervals and the loggers I used (Elitech RC51) have a fair amount of inertia.
What was uncanny if not creepy and from actual experience using my own and the Wundergorund data was that, when working out a daily average….
It didn’t matter what trajectory the day’s temperature took or what season what weather conditions or anything.
There really is ‘something odd‘ going on out there.
Meanwhile and what shows up on my (new Norfolk) Wundergrounds are things like this attached..
Just. What. Did. Happen: between half midnight and 01:30 on that morning?
or…. did it happen between 01:30 and 02:30?
It wasn’t just that station, others within a 5 mile radius all showed near identical graphs and identical timings
Personally I’m convinced, especially by the after midnight to 06:00hrs timing when they always occur, it is something to do with the cold-stores that farmers now have, dotted all around the countryside here
Those timings corresponding to when the farmers may have access to ‘cheap electricity‘ to run those stores
It’s the distance that amazes me, how for miles around one single refrigeration plant starting up can affect sensors all over the town and surrounding countryside – and – by so much.
It has to be the cold stores, those sorts of graphs only occur when the ‘natural ambient‘ temp is in the range of maybe 4°C to 12°C and between midnight and six in the morning.
I included the ‘wind’ plot in that graph, something happened with the wind when those peaks and dips occurred, as you can see.
Maybe a night-time equivalent of a micro-tornado or giant dust-devil (or flock of them) – which would exactly be what a large refrigeration plant would set off with the huuuuge fans they have.
Though if standing up close, you’d liken it to more of a hurricane when they strike up.
And if you’re inside the cold store when they kick off, it really is the intro/trailer to Day After Tomorrow
Is it an actual change in temperature, or a change in the temperature reading ?
Could it be the sudden surge of electricity use be affecting the electronic sensors ?
suffolkboy ==> There are a lot of methods of “averaging to find daily temperature”. In my opinion, they are all foolish.
The diurnal temperature curve is a sinusoidal signal during the day, primarily driven by the sinusoidal movement of the sun across the sky. The diurnal temperature curve is an exponential decay during the nighttime, primarily driven by the radiation of heat from the surface following Planck’s law. The radiation from the surface increases during the day as the sun heats the planet but when the sun’s input starts to wane then the radiation curve becomes dominant. This happens before the sun actually goes below the horizon.
Neither curve is perfect. Weather creates a natural excursion from perfection. Is this noise? I don’t consider it to be noise, it’s just more information overlaying the base, like a modulated signal.
I have long advocated for the use of an integrated temperature value for the daily temperature curve, commonly known as a degree-day, Almost all other disciplines (e.g. agricultural science, HVAC engineering, etc.) have moved to the use of an integrative degree-day value. Only climate science adamantly refuses to do so – and that is a telling refusal.
The use of the degree-day would tend to suppress the impact of any “noise spikes” because they would become a small part of a larger total.
The degree-day value would also eliminate finding a MEDIAN value of temperature, Tmax + Tmin divided by 2 is not an average, it is a median value from a bi-modal temperature distribution – the median of a multi(bi)-modal distribution isn’t of much use in describing the distribution.
The next step would be to start using enthalpy instead of temperature. Temperature is a piss poor proxy for heat content. Most of the data need to calculate enthalpy has been available for over 40 years, (e.g. temperature and humidity). We could have records of more than 30 years had this switch been made. The median temperature can be the same value for very different climates meaning it is a poor indicator of climate, think Las Vegas and Miami and “dry heat” vs “wet heat”. Enthalpy is a measure of heat content. Using it would allow just adding up the enthalpy across the globe to get a total – no need for “anomalies” to try and equally weight median temperatures from different measuring stations.
In essence, climate science is stuck in the 17th century. It needs to join the rest of us in the 21st century.
Tim ==> I think we have discussed this many times: “using enthalpy instead of temperature” — absolutely correct — if we want to know about increase-decrease-change in energy in the Earth climate system. But we both know we can’t backfill the data record to allow that for the past.
Degree-days is an alternate — but has a similar problem to straight temperature readings — it doesn’t really tell us about the heat energy.
This piece is just exposing a problem with the “temperature numbers“. Numbers which are given far too much attention and used to try to bend public opinion in favor of political ends.
It’s not a matter of back-filling. It’s a matter of STARTING. If they never start then we will NEVER have a proper record. The data has been available for 30 years or more. We could have had a record hat would fit the 30 year requirement for assessing climate! If they would start today it would still be 30 years in the future to meet that requirement!
The excuse is always “we need a long record”. That *is* an excuse, not an answer. There is absolutely nothing stopping climate science from doing BOTH at the same time.
I agree that degree-day wouldn’t help with the measuring of heat. But the data needed for that has been available for over 30 years as well. We *could* have had a 30 year long record of enthalpy for at least some stations. Once again, if climate science never STARTS the record then it will never exist. Why the absolute refusal to even start the record and run it in parallel?
Degree-days would fix some problems. Trying to combine temperatures from a sinusoidal distribution with those from an exponential decay would be eliminated. With a common baseline in Kelvin you wouldn’t need to do anomalies any longer, just add up the degree-day values and track them. If you integrate the entire curve for the degree-day value then you minimize the impacts of short-term “noise” (it wouldn’t help fix siting problems or even micro-climate differences).
One would hope that the data has been retained, but many of these agencies seem to be penny wise but pound foolish.
If the data is still available, the degree day and enthalpy values can be readily calculated.
The use of anomalies appears to be an attempt to reduce the impact of weather stations joining an leaving the network over time. It introduces its own problems, but does seem to have benefits.
I agree with the top part of your post.
Anomalies have *NO* actual benefit as they are used today. They inherit the very same measurement uncertainty as the component values used to calculate them. That measurement uncertainty interval is so wide that it puts any changes less than the units digit into the GREAT UNKNOWN.
Just having a number is useless unless it actually means something. The fact that they never propagate any measurement uncertainty anywhere in the process is telling. They only use the SEM value which only tells you how precisely you have calculated the average, it tells you absolutely nothing about how accurate that average might be.
Climate sciences needs to make some MAJOR changes in order to regain any semblance of integrity in their product – and they adamantly refuse to do so when other disciplines are leaving them behind.
“Anomaly” is rather a poor term. “Delta” would be more correct, since each “anomaly” is a difference from an idealised site-specific baseline value during a common time period.
Yep, they have the same measurement uncertainty as the period of interest, as well as the variance of that period. People seem to miss the fact that these are additive.
Where deltas have an advantage over the use of Kelvin is that the reported values aren’t up and down like the Assyrian Empire as stations are added or removed.
Doesn’t matter if you call it a delta or an anomaly.
As long as you calculate it with two values that have uncertainty the uncertainties of the two values add. It doesn’t matter if you add the values and subtract one value from another.
Delta’s/anomalies have no advantage over direct use of the absolute values. The same delta/anomaly can come from two different Tmax/Tmin combinations – i.e. two different climates. At least with the absolute values you have some idea if you are dealing with temps from Nome, AK or Lincoln, NE.
The use of deltas/anomalies only make sense if you are comparing temperature distributions with the exact same distribution, the same range (i.e. variance, standard deviation). and the same shape. Just shifting the distributions along an axis doesn’t help at all.
The *best* way to evaluate the heat content of the earth is to use enthalpy. The next best way would be to use degree-days. No deltas, no anomalies, just add it all up and see what the total is.
Since deltas/anomalies aren’t climate specific they can’t really help analyze climate. They are a broken crutch that leaves the user flat on the ground.
“delta” is less loaded than “anomaly”. Mathematically, it doesn’t matter, but semantically it does.
That’s why the offset must be treated as a constant.
They do have an advantage in consistency if stations are added or removed from the mix. Adding high altitude/latitude stations will tend to reduce the average absolute temperatures, removing them will increase the average.
Deltas have their own problems, especially for stations which didn’t report during the entire baseline period.
Coverage and distribution are still a problem, but definitely better than daily midpoint temperatures.
There is still the problem of stations being added or removed. Deltas do make some sort of sense in attempting to compensate for sampling errors resulting from the use of samples of convenience.
““delta” is less loaded than “anomaly”. Mathematically, it doesn’t matter, but semantically it does.”
Ok.
“Deltas have their own problems, especially for stations which didn’t report during the entire baseline period.”
Another hypocrisy in climate science. They whine about not having data from some stations when doing grid averages but then turn around and use an average from other stations to infill for it. If they just ignored the missing stuff the average would *still* come out the same (or close to it).
“Coverage and distribution are still a problem, but definitely better than daily midpoint temperatures.”
Of course. But it makes things a LOT simpler. Just simple addition.
“There is still the problem of stations being added or removed. Deltas do make some sort of sense in attempting to compensate for sampling errors resulting from the use of samples of convenience.”
Yeah, adding/removing stations would still be a problem. You would need a baseline that doesn’t change, something like the CRN only on a global basis. That Is perfectly feasible to do, it just requires a committment to doing it.
As far as I remember, the electronic temperature sensors in most countries (Australia notably excluded) have to take several readings over a short time period and average the results (5 mins in USA, 3 mins in UK I think) – is this still the case or is it not doing what it was supposed to do and needs changing?
Richard ==> For details, see this document from the National Centers for Environmental Information.
Doesn’t say anything about how the temperatures are taken, just gives an extremely long list of codes and methods of recording the data coming in and identifying the sources. Those aren’t the droids I was looking for.
Richard ==> I’ve given you the wrong link. The algorithm is given in the ASOS User’s Guide.
Sorry, can’t open that, Kip, at least not on my phone.
What I was actually looking for were sets of national standards governing how the temperatures should be taken. I know the WMO used to set an international standard and most countries followed suit with that and the siting of temperature stations. I also know that Australia’s BoM got strong criticism for ignoring them and going with individual readings rather than an average over a few minutes. What I don’t know is whether we still follow the national/international standards or whether we’ve quietly junked them and followed BoM’s lead.
Richard ==> There are some links in this essay to follow. The Surface Stations project has links to standards. The WMO link in the Author’s Comments covers siting.
I don’t think thar’s how they measure the maximum temperature.
Curious ==> TXx is defined as “TXx — Maximum value of daily maximum temperature in month k, period j.”
Daily Tmax is simply the highest recorded temperature in the 24-hour period. It is Tmax that is used to determine Tavg in the formula: (Tmax + Tmin)/2 = Tavg
“take several readings over a short time period and average the results (5 mins in USA, 3 mins in UK I think)”
Probably to report temperature at the moment. I wonder if they simply use the maximum reading for the maximum temperature. It is tempting.
We are deciding climate choices based on the spurious data that I would have thrown out when i was a data adminstator for another application.
Many on here will already know am currently studying this very topic.
While doing this reseach l think l now understand the reason why most of the recent warming has been happening during the winter. lts been down to the fact that winter sunshine has a greater warming impact on the casing of these thermometers are contained in when compared to there surroundings.
During the winter months the sun shines at a very low angle. Which means that because these thermometers are upright on a pole, then when the sun shines it warms these thermometers up far quicker then the flat surrounding ground.
lts the quick reponse of electronic thermometers that makes them much more prone to be effected by this warming then it would compared to glass thermometers. This would certainly be true if the sky also had cloud cover which would only cause the sun to shine over short period of time. While during the summer the effects would be more the other way around
lts this what l think has been a large cause of the winter warming during recent years.
taxed ==> The manufacturers and the designers of MMTS systems go to a lot of trouble to avoid what you describe. — see this document.
Kip
l think the fact they have now gone to such trouble,suggests that this was a issue that was far greater then they were expecting.
So l think there is a real issue that the data from the earlier MMTS systerms was running “warm” at least during the winter months, and this is the cause of the sudden jump in the UK winter warming trend between the mid 1980’s to the 2000’s.
Sorry l did not make myself clear.
When l said about the issues of earlier MMTS what l was talking about was the early electronic thermometers. Am utterly convinced these were running warm during the winter months. Also they were aware they were issues and was the reason they went so much trouble to try and correct it
While my study’s are showing are still showing there are issues with electronic thermometers as l think the focus was on dealing with the summer months rather then the winter.
They can minimize impacts but they can’t eliminate them. The only way to eliminate them would be a temperature stabilized enclosure.
While they have designed the enclosures to minimize the impacts of the enclosure on the measured temperature the impacts can’t be eliminated, only minimized. The only true way to eliminate the impacts would be the sue of an environmentally stable enclosure, e.g. one whose temp is monitored and either heated or cooled to maintain a stable temperature. This *is* possible. It would make the stations more expensive but spending money doesn’t seem to be an issue for government today. Do it only for the CRN stations only and the powers-that-be could trumpet they are actually “saving” money in government-speak.
Good work. Are there any trends in Tmin temps?
dk_ ==> Don’t know, sorry.
http://wattsupwiththat.com/2015/08/11/an-analysis-of-best-data-for-the-question-is-earth-warming-or-cooling/
Clyde ==> Thanks for the link to the answer.
Once upon a time, we had the “law of averages”, and now we have the “inanity of averages”, but it’s not a law, heh.
Good article.
I find the 2022 NOAA state summaries very interesting. Here is Wyoming, for example.
https://statesummaries.ncics.org/chapter/wy/
Data is through 2020.
Look at figure 2 “Observed number of very hot days” and its caption. A graph for the contiguous U.S. is given, so as to put the shorter record for Wyoming in better context.
Such a statistical view of daily data from a fixed set of stations seems a lot more meaningful to assess the trend. Is Tmax trending higher as an overall condition? It depends on how you look at it.
Here is the figure 2 image.
And its caption.
“Figure 2: Observed annual number of very hot days (maximum temperature of 95°F or higher) for Wyoming from 1950 to 2020. Dots show annual values. Bars show averages over 5-year periods (last bar is a 6-year average). The horizontal black line shows the long-term (entire period) average of 7.2 days. Values for the contiguous United States (CONUS) from 1900 to 2020 are included to provide a longer and larger context. Long-term stations dating back to 1900 were not available for Wyoming. The highest number of very hot days in Wyoming occurred during the 2000s and early 2010s. Sources: CISESS and NOAA NCEI. Data: GHCN-Daily from 35 (WY) and 655 (CONUS) long-term stations.”
David ==. Thanks for that link — especially the graph of Contig US Very Hot Days.
I am very thankful for this post. As person who might like to work inside, I have been fated to work outside more than I desired. Therefore I am an authority on the ups and downs of temperature in the reality actually felt by the skin, as opposed to the people who sit cozy, indoors. Consequently, at times I scorn thermometers.
Allow me to brag. Allow me to tell of an incident an outdoors person might find themselves in, which few indoors people can conceive.
Herring are delivered to a cannery from the boats in long tank trucks very much those that delivery gasoline to the gas stations. Arriving at the cannery, a vent is opened at the rear of the truck and the slippery fish come sluicing out onto a conveyor belt which zooms them into the building. However a problem arises. The equivalent of log jams occur. Sometimes it is a couple of twisted herring forming a knot, but usually it is a predator of herring (called a hake) who got netted along with the herring. In any case they plug the exit of the truck. Someone must climb into the tank truck through the top and, in thigh deep herring, in a space that doesn’t even allow one to stand up straight, wade to the rear, reach down through the cold, slimy herring, and pull the plug from the exit, to allow the cargo to flow. (Such a problem is no concern of truck drivers delivering gasoline.) Understandably, no one who works at the cannery wants to do this job, and therefore it is given to the fellow most recently hired, ostentatiously to “see if the rookie has what it takes,” but in reality because few in their right minds wants such a job.
Mind you, this is in Maine in January. It is so cold even the salt water is freezing. Worst, after the rookie has cleared the plug and thinks he can flee the bowls of a tank truck, he discovers his purgatory is just beginning. As he nears the porthole in the ceiling that represents escape, he is handed the nozzle of a high-pressure saltwater hose and told to use it to make sure every last herring is flushed from the tank.
As I once was, once upon a time, that “rookie”, I can tell you people who work outside know a damn lot more about minimum and maximum temperatures than dopes who never go outside. (Even if, as was true in my case, those who work outside are very sensitive poets, who only are forced to work in a cannery because no one will buy their very sensitive poems.)
Not that I don’t have a minimum-maximum thermometer both by the front door and back door of my house (currently in New Hampshire.) However often what my thermometers report drops my jaw. They differ from what I actually experienced. However I forgive the poor inanimate thermometers. I understand, for I was outside, and experienced what they experienced.
When you work outside in the dead of winter you spend a lot of time wincing and gritting your teeth. You may be working on the trails of a ski resort; or shoveling snow off a dangerously overburdened roof; or overseeing children on a playground; or bloodying your knuckles rescuing a broken down car by a highway; or splitting wood for those who heat with wood, but you know it is cold when it is cold. And you also know of brief moments of mercy.
Even on bitterly windy days there are moments when the wind briefly dies. (Let meteorologists explain why.) The sun, even at its lowest, is at is highest. As the winter worker slaves, he abruptly pauses. Abruptly he looks about, basks in slight warmth, and says, “Life isn’t so bad.” He looks about the winter landscape, sees the beauty, and feels sorry for those indoor people who only see computer screens.
However just because winter workers know of those moments when the bitter wind dies does not allow them to tell anyone the entire winter is like that. They know damn well most of the winter isn’t.
Those who only see computer screens need to learn the same thing.
Caleb ==> Thanks for the poetry….
Yes Caleb l quite agee.
Between June 1979 to June 1982 l kept a daily record of the weather and during that time l learned far more about the weather then l ever would have done by been at college.
Robots won’t know the beauty outdoors, and they won’t complain about clearing a plug of fish from a porthole in a cold dark tank.
Very nice, also one also learns the value of a local heat island, especially when collecting data from a poorly located sample port half-way up a 200 ft. refinery furnace stack in the dead of winter.
What a job that must have been! I hope you got paid well!
Through my reseach l have been surprized by just how much the low winter sun can effect electronic thermometers on AWS’s when compared to a glass thermometer in the shade. The difference can be as much as 2C or more. They are real isses with electronic thermometers when dealing with winter sunshine that’s really going to impact on the temp data they give.
Here in the UK we have some colder sunnier weather comimg up. So it will be interesting to see what results l get from that.
Today’s been a good day to bench mark my glass thermometers temps recordings with the AWS temp data. As the cloud cover and little change in the temps will allow both thermometers to record a accurate temp reading without been impacted to much by been glass or electonic and urban or rural. .
Results are
My glass thermometer Scunthorpe urban
max 4.4c
min 2.7c
Hatfield AWS rural
maz 4.8c
min 3.0c
Lincoln AWS urban
maz 4.8c
min 2.4c
This has confirm my glass thermometer is accurate and will be a good benchmark, to allow me to see the way glass and electonic thermometers differ in recording temps under different weather conditions.
Today l have been a good day to be able to baseline the temp recordings between my glass thermometer and the AWS’s
So now l will be able to record how they differ under different weather conditions.
Kip,
Your average of all the measurements is pretty much the way an integration over 24 hours is done. The more the readings the better the integration (average). Making the increments smaller and smaller is exactly what you do in calculus.
HVAC engineers are moving to exactly this. They are using the same temperature data climate science is using. Data with seconds increments have been available for going on 40 years.
Climate science COULD, if they wished, move to a better and more description of a Temperature•Day. In essence, a better measurement of a continuous phenomenon.
No more averages. Just sum 365 daily temps to obtain an annual temperature total. You want a monthly global temp, just add all the Temp•days from all stations together. You want to know if temp•day is increasing, just sum over the time period you want!
With fine enough (< 1 sec) data, outliers will not have a large effect. It is the 2nd treason I do not claim that climate science is done by SCIENTISTS. What real scientist do you know that wouldn’t jump at the chance to utilize a measurement device that provides better information?
2nd reason
Always politicizing things! 🙂
Jim ==> Thanks for that input. CliSci has chosen to measure “sensible heat” — temperature, with thermometers. Better that they measure HEAT.
CliSci could add ip the heat in a day, but they need more information to do so, and can’t go back and recover the information from the unrecorded past, thus can’t compare.
But it would seem, Kip, as from your “instant reading, anywhere USA” chart that duration has some influence on the perceived state and effect of the weather at any given location. In changing weather I’ve experienced temperature and radiation spikes in both directions – e.g. lifting fog, the midnight winter loss of cloud cover that comes with a front or the sudden loss of cloudcover at the beginning or the end of a storm. If we were to truly need ot measure temperature as a significant input to interpreting change, a series of perhaps 15 minute readings, from triply redundant sensors, across adjacent sites, would be more useful for judging changes.
This is part of the reason that interested in Tmin (question above), since at least half the average day encompasses little or no warming from solar radiation.
dk_ ==> “…duration has some influence on the perceived state and effect of the weather at any given location.”
Certainly duration of any weather state, like air temperature’ influences the perceived effect. Both for humans and for instruments.
Instantaneous changes can be perceived by an MMTS/ASOS but can be recorded for very short changes in a very localized space –say 10 seconds in a cubic meter of air. These instantaneous records are not weather.
Tmin usually happens during the night when the Sun isn’t shining, but not exclusively. Remember, they are measuring AIR TEMPERATURE. Air Temperature is not solely dependent on ambient solar radiation — at least not as measured at MMTS. Mass of air at various temperatures move over the land, day and night. MMTS measure changes in masses of air (at least, that is what they are intended to measure.)
Ag science has been using “heat accumulation” figures for a long time. They are moving to integration of the temperature curve to do so. Why doesn’t climate science? If they never start then we’ll never know about the heat – we’ll keep seeing similar “median” temps for Las Vegas and Miami when the climates have different enthalpies.
I think air pressure and relative humidity figures have been collected and recorded for a very long time, though probably only once per day. That allows the calculation of enthalpy, albeit with a rather wide uncertainty interval.
old cocky ==> MMTS sites don’t record air pressure and only some record relative humidity. See Surface Stations project reports.
Well, that is a major improvement, isn’t it?
Our Bureau of Meteorology has them in their observations, so I thought it was standard – http://www.bom.gov.au/nsw/observations/sydney.shtml
ASOS measurement stations record ambient temp, dew point, and pressure. Since these are mainly at airports they won’t be free from UHI but their data could be used to track enthalpy at their locations. They provide measurement data at one minute intervals.
Tim => Yes, ASOS measure more factors than the thousands of MMTS stations — as in the photo of the MMTS on a little pole near A/C units in the essay.
The ASOS User’s Guide says “Once each minute the ACU [which is the central processing unit for the ASOS] calculates the 5-minute average ambient temperature and dew point temperature from the 1-minute average observations (provided at least 4 valid 1-minute averages are available). These 5-minute averages are rounded to the nearest degree Fahrenheit, converted to the nearest 0.1 degree Celsius, and reported once each minute as the 5-minute average ambient and dew point temperatures.”
So, while the report looks like 1-minute records, each 1-minute record is an average of the current 1-minute and the last four.
The one minute data could be made available since it is taken in order to calculate the average.
My only point is that doing enthalpy *is* possible if climate science wanted to do so.
That wide uncertainty interval applies to the temperature as well. Temp is not a totally independent factor. Temp is somewhat dependent on pressure and humidity and therefore inherits any uncertainty introduced by those factors.
The actual temperature depends on these (humidity dominates), but the measurement uncertainty shouldn’t be affected by these in the range of terrestrial surface temperatures.
“measurement uncertainty shouldn’t be affected by these in the range of terrestrial surface temperatures.”
Of course the measurement uncertainty is affected since they are factors in the functional relationship.
Any instrument with hysteresis (i.e measures different if the value is going up or going down) will introduce different measurement uncertainty in the value being measured. That applies whether it is a barometer, a hygrometer, or a thermometer. It creates an asymmetric uncertainty profile which must be recalculated at each point in the measurement range.
If climate science was truly following measurement uncertainty methods and protocols (instead of calling the SEM the measurement uncertainty) I would agree with you since this asymmetry would hopefully be insignificant in comparison to the other uncertainties, but that would also mean the deltas/anomalies would be stated in the units digit at least. No more anomalies in the hundredths digit.
A liquid in glass min/max thermometer isn’t going to hit its max while temperatures are falling or min while they’re rising 🙂
Yep, hysteresis could well be a factor with the higher sampling rates now in use – I missed that.
Older manual weather stations had a minimum and maximum temperature for the 24 hour period, but only one spot reading for pressure and relative humidity. Any calculations of min and max enthalpy for the day would have to use those spot readings. It might sort of work if just calculated as e_average using the mid-point temperature, but the uncertainty interval would be even wider.
A perhaps tedious and tiresome remainder, since it isn’t the main focus of this essay, is that poor siteing conditions, such as the one pictured with all the air conditioners on display, has the potential to provide a record biased quite a bit more than a well sited station when considered over half or a full day, even if all short term sudden variations are deleted from consideration.
Also, there is the question of whether any differences less than 1 degree C, or perhaps that should be 3 or 4 degrees C on a decadal basis, are worthy of scientific consideration, rather than just a philosophical, or perhaps purely political, viewpoint.
Andy ==> It’s a math thing == Tavg is the average of Tmax and Tmin — spurious Tmax’s increase Tavg and thus the whole record.
I have found spurious Tmax of over 4°C in a quick glance at the record of a local weather station.
More properly, what you are calling an average should be called the “mid-range” value.
https://en.wikipedia.org/wiki/Mid-range
Tmean?
T_median
It’s a MEDIAN of a multi-modal distribution. It’s the range of the distribution divided by 2.
From “The Active Practice of Statistics” by Dr. Moore:
“The five-number summary is usually better than the mean and standard deviation for describing a skewed distribution or a distribution with strong outliers. Use y_bar and s only for reasonably symmetric distributions that are free of outliers.”
While this doesn’t address multi-modal distributions directly this same advice applies to them.
There is simply no doubt that Tmax and Tmin are from two different temperature distributions and the median value does *NOT* properly represent the daily temperature curve.
Part of the problem is that in climate science they only use y_bar (median). They totally ignore s (standard deviation). Thus their description of the distribution is faulty even if it were a symmetric distribution.
Tim,
We are in agreement again.
It is difficult to delve into Aussie data because –
1. There are no statements giving the precise date of end of LIG and start of MMTS at each weather station. Just text like “Became primary instrument on this date.” And “Formal date for Australian change to AWS was 1 Nov 1996 (or whenever)”, but many stations even now are still LIG.
2. There are very few overlaps where LIG and MMTS were run in parallel in the same screen. Or where there was overlap, if there were separate screens, how far apart they were, etc.
3. Metadata are brief and not very useful for reconstructing.
4. Our BOM has authored next to no reports on the changeover.
5. Our BOM is hostile to attempts by others to research such problems. They influence peer review to the stage where paralysis of new papers by outsiders is usual.
However, I have more work almost ready to send to WUWT. One shows overlap in Melbourne around 2015 with systematic differences up to 1.7 deg C in Tmax, but the two records are simply spliced by BOM with no adjustments. Both are MMTS, so it is site move problems, large and easily seen, but uncorrected. Geoff S
Tim and Geoff ==> Ah, yes, is Tavg an average or a median or what the heck? When I have called it a median, I have been chased around the block by mobs bearing pitchforks… easier to just call it what it is: (Tmax+Tmin)/2 = Tavg
Easy isn’t the right way. Sometimes the right way is hard.
Calling it an average covers up the fact that it is garbage. And you can’t fix garbage by creating averages of garbage. Garbage in ==> garbage out.
Climate science can’t even explain why they don’t weight the anomalies of coastal areas differently than inland areas, e.g. San Diego and Ramon, CA.
Ignorance is bliss in climate science. I become more convinced of that every single day!
Tim ==> We are on the same side in this, as you already know.
wouldn’t it be nice if we could make them change their terminology. we can’t though….so stuck with Tavg.
On page 41 of this report is an MMTS with solar panel above and mailbox mounted below. Rural people know that mailboxes attract those little jeeps which have hot exhaust — bias winter cold temperatures upward. Scientists have not all learned this.
Kip, good essay as always.
Some of this topic was a point I was hoping to make in my very first WUWT guest essay. I made it a bit too technical for WUWT in hindsight. I used an AWOS with an MMTS sensor at our regional airport as an example, but I also pointed out an admonition common in the cut sheet for microcontrollers that allow ADC. The usual rule is to optimize a system by matching bandwidth of measurement system to the bandwidth of the signal and so the MMTS should have been designed to mimic exactly the mercury in glass. But what I saw for KLAR suggested 2F bias for signals that were likely very brief.
It is completely expected that converting to MMTS would bias Tmax high and Tmin low. Unless designed to be slower than the mercury in glass time-constant, the MMTS Tmin recording is unwittingly designed to capture those brief episodes of a unrepresentative blob of cold air coming across the KLAR sensor from the Laramie plains. Tmax unwittingly designed to capture the momentary and unmeteorological jet exhaust on the nearby taxi-way.
Should they not have put the electrontic thermometer into a glass tube like mercury if they wanted to better mimic a mercury thermometer.
As this looks a much more simple way of dealing with the issue then what is currenty been tryed.
It would have helped. But the response of the sensor would still be faster than the mercury.
The thermal conductivity of mercury is about 4.8. For aluminum (as an example) it is about 120, more than 20 times higher.
Yes, but Tim as long as the mercury response is made slow enough then the electronic sensor is “slaved” to it. It would work fine except for the hysteria about mercury which is even greater than for climate change.
This is true if the sensor is immersed in mercury inside a glass tube. That’s not quite what was proposed. Just putting the sensor inside a glass tube wouldn’t be sufficient.
Kevin ==> Yes, the “problem” is “response time” – minutes for LIG and seconds for thermistors.
The question is “What are they really counting?” “What do they really want to count?” (count = measure).
If they are interested in the fleetingly short fluctuations in temperatures at the spot where the MMTS is located — thermistors are the way to go.
If they want to measure temperature for weather (or, later, climate) then MMTS is not the way to go.
For analysis of the impact of AWS one second readings across the Australian Climate Observation Reference Network … http://www.waclimate.net/aws-corruption.html (page built for desktops, not phones, although possibly worth viewing on a tablet).
Chris,
Works fine on my old Android Lenovo tablet.
Geoff S
waclimate ==> Terrific work!
Geoff … thanks for the feedback that all’s fine with an Android tablet.
Kip … thanks, and ditto re your post above.
I researched and built that page a year or two ago and, having lured myself back to have another look at it, today corrected a spelling mistake (one second, not on second 🙂 and added a link to an FOI document that sources the BoM definition of how it averages one second AWS observations.
Unfortunately, it’s a moderately complicated and definitely long page of research without external links from climate sites such as WUWT, so it’s a lost page that at any rate would be beyond the comprehension of the modern media.
Thus a pity the Australian public will never know that the AWS switch is one of two instrumentation changes that have influenced temperature averages over the past 50 years (the other being 1972 metrication and the end of the ~60% rounded (x.0F) Fahrenheit observations since the 1800s – if interested, see http://www.waclimate.net/round/index.html).
Kip, that is a little under 3 words per second. I’m not sure I can move my lips that fast. 🙂
And the 2500 words doesn’t include the comments…
Cylde ==> Hmm…there are multiple words-to-reading-time converters. Some are intended to “speeches” and “presentations” and some are intended to inform readers of magazines, newspapers, and web pages how long it will take them to read (silently) the essay or article.
I run into this when writing here. Most won’t read anything longer than a few minutes (which is a shame ..but who has the time?). When I am writing sermon, I find I have at actually read it out loud and time it — as public speaking isn’t the same as reading aloud — speed and cadence change, one adds pauses and doubles speed for effect, etc.
Silent reading skills vary wildly from person to person. Some can “speed read” (sentence at a time, instead of word at a time).
There are podcasters that speak so fast I can hardly understand them. (ever listen to Ben Shapiro? I don’t personally, but I have heard others listening to him. )
How’d we get on this topic?
Just trying to add a little levity to a hot topic.
Clyde ==> I often am too serious — I knew it was a pint — but I spent some time lately trying to find the best reading time estimator. Appreciate you and your input.
From the ASOS User’s Guide quoted above: “These 5-minute averages are rounded to the nearest degree Fahrenheit, converted to the nearest 0.1 degree Celsius, and reported once each minute as the 5-minute average ambient and dew point temperatures.” So the reported temperature is reported to 0.1°C after rounding off to the nearest whole degree F? Why would you round off and then report the value to a much higher but false precision? This makes no sense at all. It also supports assertions that the temperature record is no better than ±0.5°F.
This is typical in climate science. It stems from the conversion to a different scale involving the fraction 5/9, a repeating decimal of .5555…..
Far better to have measured in C to begin with.
Loren ==> Yes, and it is worse than that for many reasons.
There may be a worse way to do it.
Very nice Kip. No comparison of present temperatures with different working instruments should ever be compared to historical temperatures made with vintage instruments. Both instruments should be used to record current temperatures but only the vintage instrument results should be used for comparison to historical readings.
Bob ==> what are you? a scientist? we do the new thing ’cause its better (and far easier!) Then we just pretend that it is valid (like tide gauges and satellite sea level).
Back in the day, I did reports on two weather stations for WUWT’s “How not to measure temperature.”
I suspect many recent readers have not gone back and looked at all those many reports. I also do not know how much of the series is available.
Anyway, there were many photos that made me laugh. I remember one where the sensor was on top of a street light (15 to 18 ft) because after being vandalized at the normal height a couple of times, the responsible agency solved the problem with height.
I also suspect that many have been improved since then.
John ==> How Not to Measure Temperature — many have the vintage post image problem — try clicking on the empty space where the image should be – sometimes brings up the images
also at Goggles here.
Most are good for a chuckle even when the image fails.
There was a WUWT site with photos and text for many stations.
The documentation by volunteers, such as me and many
others could be searched.
For a town near me — Cle Elum, WA — a local pilot flew
over and took photos.
That place is here: 47.189034, -120.913045
This is a waste-water treatment facility. The temperature
sensor {white spot} is next to a fence, under trees. The other white
spot is a “snow table”. Instruments are in the shed to the right.
Brownish/red surface clinkers- rocks/coal from fires.
That’s it we’re doomed Down Under-
Australia heats up with eighth-warmest year on record (msn.com)
Help! Please crowdsource as many evacuation yachts and sailing ships as possible a la Dunkirk?
But, with UAH satellite obs for Dec 2023 just reported by Dr Spencer, the lower troposphere over Australia is reluctant to join the sensationalism.
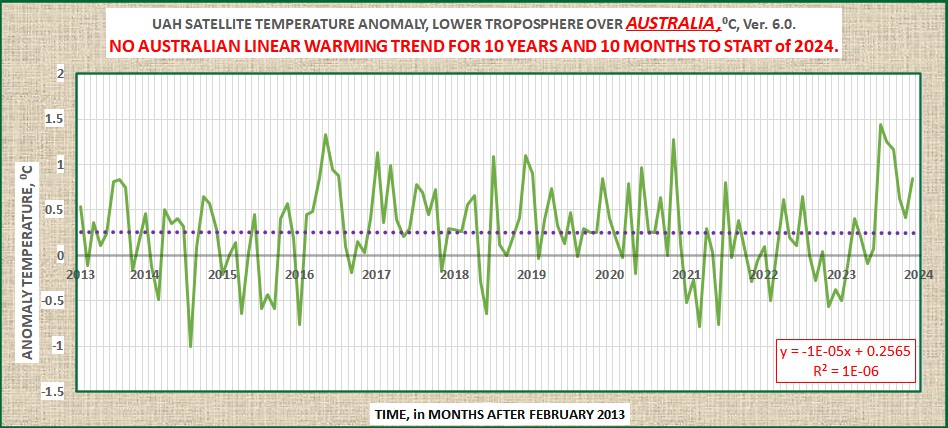
Geoff S
When I started secondary (high) school in 1967 one of the Geography teachers had set up a small weather station, a min/max thermometer and a rain gauge are all I can remember being referred to. The thermometer was housed in a Stevenson (?) screen. The whole setup was located away from school buildings. The school is located on the top of a hill with the playing fields located to the West of the buildings overlooking the town some 300 to 400 feet below in a river valley. I’m not sure what the obtained data was used for or by whom.
Our local university also had a similar setup, this was again placed as far from buildings as possible.
I must admit to being highly suspicious of measuring outdoor temperatures every few seconds or minutes, the data becomes meaningless. It’s not the same as measuring the temperature as part of a closed loop control system.
When I was aged 11 at primary school in 1952 in Queensland (50 pupils in the class, by the way) they appointed top-of-class kids to read, record and reset the max-min thermometer kept under view from the Headmaster’s office. Do they still do this at schools? Geoff S
I used to do that at my high school in Wales during the 60s, I don’t know if they still do since the teacher responsible retired a long time ago.
JohnC ==> Setting up weather stations, measuring temperature and rain totals (not so much rain in Los Angles, CA) was an early STEM effort (along with manically following the space race).
We has a weather station in the Agriculture Dept of our Junior High School (well, it was a 1/4 acre gardening area).
With the clean air acts and reduction in SO2 I’d expect higher insolation which would increase Tmax. By how much?
son of mulder ==> There have been studies on reduced air pollution and increased temperatures. A good Google Scholar search will turn them up.
Yes, duration is the issue. How much data do you want?
Well anyway what I really came here to post is, “What about the minimum temperatures?” After all, the IPCC says,
“Almost everywhere, daily minimum temperatures are projected to increase faster than daily maximum temperatures, ” [IPCC AR4 Chap10 pg750 pdf4]
And below is what that looks from from NOAA’s Climate at a Glance .
I would have expected the winter and not the summer Mins to be warmer
I agree, there is significant trend bias in the July temps from 1997 onwards which is not so obvious in the January temps.
I wonder what the trend was up to 1995 in the July temps?
Steve ==> I would guess that it is a matter of the mass surrounding the MMTS that has that effect — soil, buildings, etc retain the daytime heat more, which keep the Tmin up more at night. The warmer the day, the warmer the night. Maybe….
I thought that was why the 6′ altitude was chosen as well as the siting distance from the surroundings. To minimize conduction bias from warm objects such as the ground and buildings.
Heat transport is a complicated matter. Between a fluid (air) and a solid (MMTS) it is primarily by convection and is described by the value known as “surface conductance”.
If the surrounding environment keeps the air temperature up then you will see *MORE* radiation of heat over time then if the air temp dropped.
Once again, climate science is not really measuring the correct thing. It should be integrating the temperature curve in order to estimate how much heat was radiated over time. You can’t really get at it by using the median temperature.
Tim ==> Not sure what you are saying here. Warm soil warms the air above it — the air moves upward and is sucked into the MMTS by the aspirated shield. So, I don’t think it is conduction but rather, like the heat island effect, warmer solids and surfaces warm the surrounding air.
I’m just saying its complicated. If the soil is considered a solid and the air as a fluid then you have to know the surface conductance at the interface to determine how much heat is exchanged in that manner. The surface conductance is a combination of convection and radiation. Is the radiation loss higher or the convection? It makes a difference in what the MMTS sees. Climate science uses what the MMTS sees as the “surface temperature” but it actually isn’t. It’s a sample of an unknown parcel of air and properties of that unknown parcel is affected by a number of factors. If that parcel of air has a varying amount of GHG’s then exactly what is being measured?
Ag science measures soil temperature all over the US. If climate science *really* wants to know SURFACE temperature the why don’t they use that data?
Tim ==> The amount of GHG in any parcel of air does not change its temperature. GHG affect the larger atmosphere.
They are not pretending to measure surface temperature with MMTS or ASOS — they are measuring Surface Air Temperature.
defined as “ambient air temperature 2 meters above the ground surface”.
Yet it is surface temp that determines the environment. It’s why snow can melt on the surface as it falls. It’s why it’s soil temp that is a major factor in crop harvests, not just air temp, that’s why ag science measures it.
It’s why winter wheat farmers like to have snow on their crop. It keeps the soil temp up. It’s why leaving stubble on the fields keeps the soil temp up leading to an earlier last frost date.
Freeman Dyson’s main criticism of climate science and its models was that they aren’t holistic. They don’t consider even a small range of holistic factors in their models.
Tim ==> “My only point is that doing enthalpy *is* possible if climate science wanted to do so.” Well, of course they could…and they could keep better records, documents changes, be honest, write science papars and no advocacy papers, and a lot of things….but Media Visible CliSci isn’t interested.
See Pielke Jr on NOAAs Billion Dollar Disasters.
And, the increase in Winter minimum temperatures can be expected to promote both increases in Boreal tree transpiration of CO2, and bacterial decomposition of detrital organic material into CH4 and CO2, depending on the availability of oxygen.
The range of the two graphs is different, winter shows the fastest rate of rise: 2.29ªF vs 1.69ºF
Phil ==> Yes, that is correct — the scales are different.
Thanks for pointing that out, a quick graphical check says that the rise in July minimum temps since 1895 is ~2°F and for January it’s ~3°F. Dunno how I missed that. I can go back to saying that the IPCC says that most of the warming is at night, in winter and in the Arctic and Antarctic.