MEDIA ADVISORY: 96% OF U.S. CLIMATE DATA IS CORRUPTED
Official NOAA temperature stations produce corrupted data due to purposeful placement in man-made hot spots
Nationwide study follows up widespread corruption and heat biases found at NOAA stations in 2009, and the heat-bias distortion problem is even worse now
ARLINGTON HEIGHTS, IL (July 27, 2022) – A new study, Corrupted Climate Stations: The Official U.S. Surface Temperature Record Remains Fatally Flawed, finds approximately 96 percent of U.S. temperature stations used to measure climate change fail to meet what the National Oceanic and Atmospheric Administration (NOAA) considers to be “acceptable” and uncorrupted placement by its own published standards.

The report, published by The Heartland Institute, was compiled via satellite and in-person survey visits to NOAA weather stations that contribute to the “official” land temperature data in the United States. The research shows that 96% of these stations are corrupted by localized effects of urbanization – producing heat-bias because of their close proximity to asphalt, machinery, and other heat-producing, heat-trapping, or heat-accentuating objects. Placing temperature stations in such locations violates NOAA’s own published standards (see section 3.1 at this link), and strongly undermines the legitimacy and the magnitude of the official consensus on long-term climate warming trends in the United States.
“With a 96 percent warm-bias in U.S. temperature measurements, it is impossible to use any statistical methods to derive an accurate climate trend for the U.S.” said Heartland Institute Senior Fellow Anthony Watts, the director of the study. “Data from the stations that have not been corrupted by faulty placement show a rate of warming in the United States reduced by almost half compared to all stations.”
NOAA’s “Requirements and Standards for [National Weather Service] Climate Observations” instructs that temperature data instruments must be “over level terrain (earth or sod) typical of the area around the station and at least 100 feet from any extensive concrete or paved surface.” And that “all attempts will be made to avoid areas where rough terrain or air drainage are proven to result in non-representative temperature data.” This new report shows that instruction is regularly violated.
For more information, or to speak with the authors of this study please contact Vice President and Director of Communications Jim Lakely at jlakely@heartland.org or call/text 312-731-9364.
This new report is a follow up to a March 2009 study, titled “Is the U.S. Surface Temperature Record Reliable?” which highlighted a subset of over 1,000 surveyed stations and found 89 percent of stations had heat-bias issues. In April and May 2022, The Heartland Institute’s team of researchers visited many of the same temperature stations as in 2009, plus many not visited before. The new survey sampled 128 NOAA stations, and found the problem of heat-bias has only gotten worse.
“The original 2009 surface stations project demonstrated conclusively that the federal government’s surface temperature monitoring system was broken, with the vast majority of stations not meeting NOAA’s own standards for trustworthiness and quality. Investigations by government watchdogs OIG and GAO confirmed the 2009 report findings,” said H. Sterling Burnett, director of the Arthur B. Robinson Center on Climate and Environment Policy at The Heartland Institute who surveyed NOAA surface stations himself this spring. “This new study is evidence of two things. First, the government is either inept or stubbornly refuses to learn from its mistakes for political reasons. Second, the government’s official temperature record can’t be trusted. It reflects a clear urban heat bias effect, not national temperature trends.”
An example of the bias problem
The chart below, found on page 17 of the report, shows 30 years of data from NOAA temperature stations in the Continental United States (CONUS). The blue lines show recorded temperatures and the trend from stations that comply with NOAA’s published standards. The yellow lines are temperatures taken from stations that are not compliant with those standards (i.e. near artificial hot spots). The red lines are the “official” adjusted temperature released by NOAA.

“If you look at the unperturbed stations that adhere to NOAA’s published standard – ones that are correctly located and free of localized urban heat biases – they display about half the rate of warming compared to perturbed stations that have such biases,” Watts said. “Yet, NOAA continues to use the data from their warm-biased century-old surface temperature networks to produce monthly and yearly reports to the U.S. public on the state of the climate.”
“The issue of localized heat-bias with these stations has been proven in a real-world experiment conducted by NOAA’s laboratory in Oak Ridge, Tennessee and published in a peer reviewed science journal.” Watts added.
“By contrast, NOAA operates a state-of-the-art surface temperature network called the U.S. Climate Reference Network,” Watts said. “It is free of localized heat biases by design, but the data it produces is never mentioned in monthly or yearly climate reports published by NOAA for public consumption.
The Heartland Institute, a free-market think tank founded in 1984, is one of the world’s leading organizations promoting the work of scientists who are skeptical that human activity is causing a climate crisis.
Heartland has hosted 14 International Conferences on Climate Change attended by thousands since 2008, published the six-volume Climate Change Reconsidered series by the Nongovernmental International Panel on Climate Change, and for 21 years has published Environment and Climate News. The Heartland Institute has also published several popular books on the climate, including Why Scientists Disagree About Global Warming (2015), Seven Theories of Climate Change (2010), and Is the U.S. Surface Temperature Record Reliable? (2009).
###
Not quite as blatant as GISS “correcting” the record, but . . .
You beat me to it by ten minutes. See below
The Final Nail will be upset 😉
The usual suspects will just declare that this data just proves that skeptics are ignoring the science.
I would have thought that the surface stations projects in the US would have spawned global weather station auditing by now. I recall there was a group in New Zealand that took the weather felons to court and won. The official “Clime Syndicate” (thnx Mark Steyn) NIWA was ordered to advise that their network is not suitable for climate evaluation.
I’m nor sure what they do now. They voted in one of the stupidest doctrinaire PMs there is who is wiping out their meat farmers industry if Nadern wants an outcome of such policies, UK just slaughtered and burned ⅓ of their hogs (it would have been nice to invite the poor to pick up pork for the price of butchery).
Here is another bit of Clime Syndicate work on Capetown, S.A’s Temperatures (note the the raw temp pattern is identical to that of the US with the 20thC highs in 1930s-40s):
Here’s the Clime Syndicate’s
handiwork:
Disgusting, shameful! And now GISS’s Gavin Schmidt has been forced to admit climate models are running a way to hot. And the adjustments to temperature were made to satisfy the CO2 “T Control Knob”. They even have an algorithm that makes hundreds of tiny cumulative adjustments to the aggregate global ‘record) per diem (!) based on this falsified cult science. The Temperature Fiddlers even use ‘station moves and closures to get rid of those not showing warming.
“ I recall there was a group in New Zealand that took the weather felons to court and won. The official “Clime Syndicate” (thnx Mark Steyn) NIWA was ordered to advise that their network is not suitable for climate evaluation.”
Your memory is very bad:
“In the High Court judgement, released today, Justice Geoffrey Venning ruled that the New Zealand Climate Science Education Trust had not been successful in any of the challenges they brought against NIWA.
Justice Venning also decided that NIWA’s cost should be paid by the trust and he said that if an agreement on the costs could not be reached he would make another ruling at a later stage.”
Well Nick I was wrong on some details but NIWA did fold considerably as a result of the challenge. Here is what happened to NIWA’s iconic ever upwards temp record as a response to the lawsuit:
“But now, para 7(a) of NIWA’s Statement of Defence states that “there is no ‘official’ or formal New Zealand Temperature Record”.
In para 8(b) it says the NZTR is not a public record for the purposes of the Public Records Act, using the exemption of “special collections” defined (in para 4(b)) as non-public records used for “research purposes”.
In para 4, NIWA denies it has any obligation to use the best available data or best scientific techniques, while conceding that it has statutory duties to pursue excellence and to perform its functions efficiently and effectively.
The juxtaposition of these conflicting stances leaves NIWA looking decidedly awkward. Should it go all out to defend its most famous product, or throw the NZTR under a bus?”
The replacement of 7SS doesn’t repeat the Salinger adjustments but it is to include any adjustments agreed between NIWA and BOM, both of whom will supposedly apply state-of-the-art homogenisation technology.
So the old 7SS has already been repudiated. A replacement NZTR is being prepared by NIWA – presumably the best effort they are capable of producing. NZCSC is about to receive what it asked for. On the face of it, there’s nothing much left for the Court to adjudicate.
Big ‘tell’ here: NIWA took out the disputed “Salinger adjustments” and sent the unfinished stuff to the BOM, Australia’s infamous climate fiddlers, to let them adjust it as they see fit!!! Obviously BOM is the big daddy they have to collaborate with (probably had a hand in making NZ temp conforming in the first place). You can’t have New Zealand cooling while big brother next door is approaching meltdown. BOM has mellowed a bit from attacks on their massive adjustments. An eye over the shoulder has that kind of affect.
https://www.climateconversation.org.nz/2010/10/whats-left-of-the-niwa-case/
Gary Pearse,
If you seek a detailed look at what adjustment can do, here is an Excel page from BOM official data for Alice Springs T max daily, adjusted to give in turne versions 1, 2, 2.1 and 2.2. An earlier High Quality set was withdrawn after protest.
These numbers are not like the score for an orchestra to play sublime music. They are the discordant, non-harmonious ramblings of composers without a clue, resulting in white noise.
Geoff S
http://www.geoffstuff.com/alice-springs-adjustment-versions.xlsx
“Well Nick I was wrong on some details “
That’s one way to say you said the wrong team won. And as I recall they were asked to pay 80k to Niwa.
“In para 4, NIWA denies it has any obligation to use the best available data or best scientific techniques,”
That in itself is enough to start the guffawing and permanent dismissal of any of their conclusions or recommendations.
Nick Stokes.
It’s great to see your comments. Well researched and picking up on others’ exaggerations and errors. It’s a great service for the accuracy of these comment threads. The helpful confirmation for me is that you say nothing substantive to refute the core assertions made in the main post. You clearly have all the available resources, including time, punctuality and extensive knowledge, and remain unable to effectively argue against the bombshell in the main article.
As usual thanks again for the contribution you do therefore make albeit by highlighting your incapability to put a cogent argument forward in this case.
Nick Stroker presents himself as an expert on temperature data, but when asked questions about those data, specifically about infilling and UHI adjustments, he has no answers.
He is no expert.
He is a science fraud.
A defender of al government bureaucrats
as if he is on the payroll.
The weather station siting is bad news, both in 2009 and 2022. Stroker’s response is that NOAA adjusts the data to fix all the siting problems.
How they adjust the data — concerning the details of these adjustments — he has no idea — just trust them. because he says so!
Then Stroker pulls the ultimate sleight of hand.
He insists the USCRN weather stations are sited properly therefore must provide accurate numbers.
That is false.
The numbers from those weather stations are compiled by NOAA government bureaucrats — the same bureaucrats who could not care less that so many other weather stations are not properly sited.
The same bureaucrats who believe in a coming climate crisis and want to see faster temperature rises, because most of them have predicted just that.
We have evidence that NOAA does not care about good science (poor weather station siting) and their employees are biased -“pro-warming”…
But we must trust USCRN because NOAA says it is accurate. And Nick Stroker repeats that claim like a well trained parrot.
The bottom line is we do not know if USCRN is accurate and we do not trust NOAA.
So when Mr, Stroker claims other NOAA data MUST be accurate, because they are similar to USCRN, he is deceiving us.
Both USCRN and other NOAA data could be similarly WRONG.
Having properly sited weather stations does not mean the resulting temperature average reported to the general public will be accurate.
Having properly sited weather stations and an accurate national average temperature does not mean the climate scaremongering will stop.
How many times must climate realists be lied to and deceived about the coming climate crisis (predicted the past 50 years — where is it?)
and falsely blaming bad weather on “climate change” … until we DO NOT TRUST ANY GOVERNMENT CLIMATE DATA
… think of the global cooling from 1940 to 1975 that has mysteriously “disappeared” from the history books. NASA-GISS did that.
Should we trust them now?
The core assertion of the post is
“Official NOAA temperature stations produce corrupted data due to purposeful placement in man-made hot spots
Nationwide study follows up widespread corruption and heat biases found at NOAA stations in 2009, and the heat-bias distortion problem is even worse now”
And what I have been saying over and over, which is absolutely central to the post, is, let’s look at the results. In the post we read
““By contrast, NOAA operates a state-of-the-art surface temperature network called the U.S. Climate Reference Network,” Watts said. “It is free of localized heat biases by design, but the data it produces is never mentioned in monthly or yearly climate reports published by NOAA for public consumption.”
And so I say, again, let’s compare:
Just the same. What happened to that “purposeful placement in man-made hot spots”?
Nick, that is not proof of anything. It makes your argument worse. Without doubt, as Anthony explained above, some sites are very poorly placed to give accurate readings. Therefore they cannot be included in analysis to improve accuracy. The fact that both sets of data from good and bad sites have been fiddled to match each other is not proof of accuracy. Anthony’s graphs show the doubling of warming caused by poor sitingvusing original data. Again, if this is all you’ve got, it increases my confidence in the primary assertion that NOAA can’t be trusted.
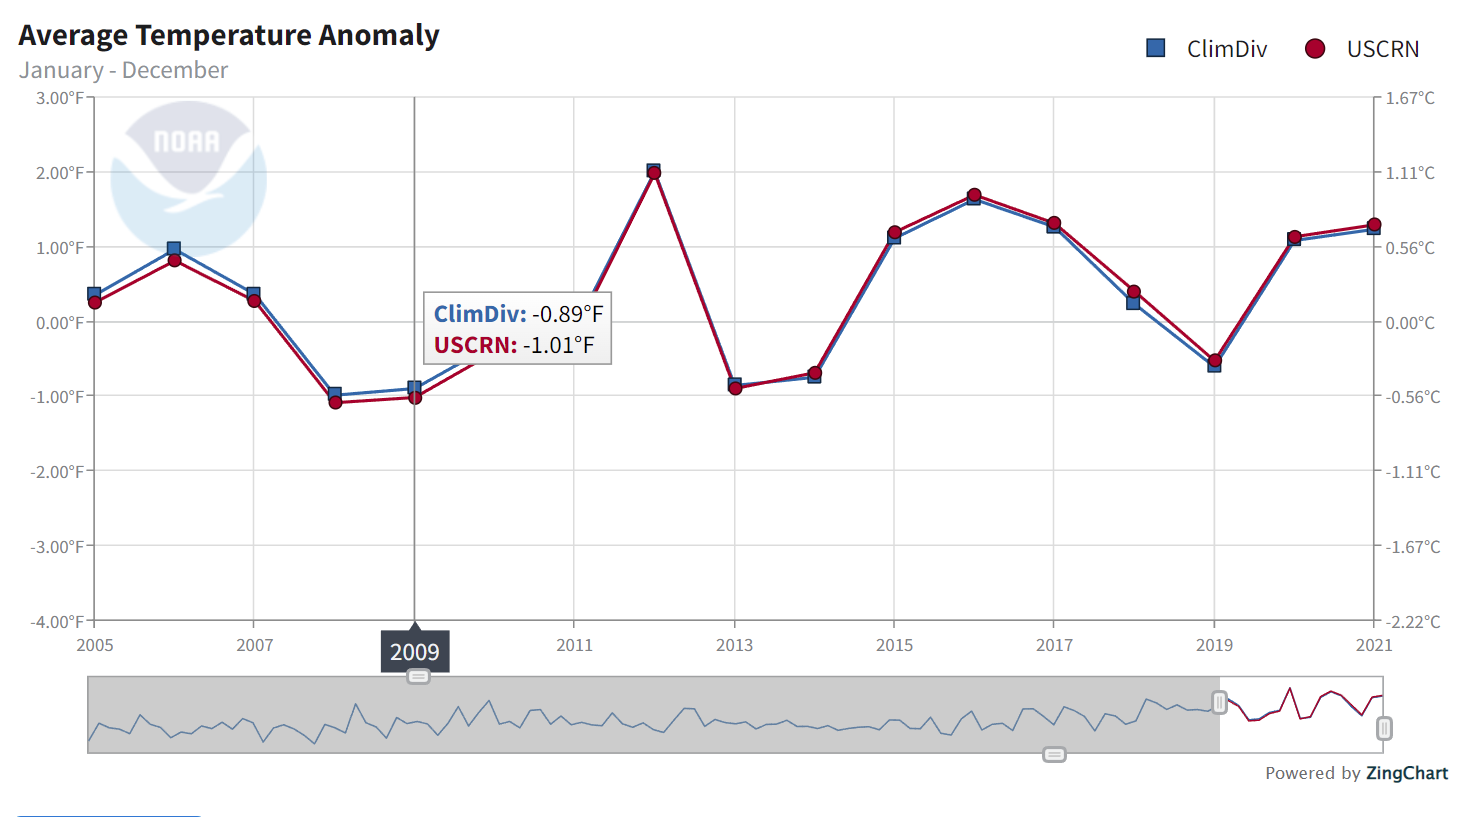
The CRN has not been “fiddled.” It is the reference series. Anthony Watts himself acknowledges that the stations in the CRN are well-sighted and maintained, he even laments that they are not more widely displayed. The fact that this pristine reference series matches the ClimDiv network strongly suggests that there are no significant effects from siting issues in the network.
If you want to claim that there’s fraudulent data tampering happening at NOAA with the CRN you’ve got to provide some evidence for that.
Alan, no, you are wrong. Anthony shows that there are major siting issues. Therefore the raw data do not match – he shows this with his graphs. you say:.”pristine reference series matches the ClimDiv network” What do you mean? Some overall average number for the USA? The global average? Some number for the average of the CRN network? What? What adjustments are made to the ClimDev network to ‘match’ the CRN?. Where are the error bars on all these graphs? What’s the variance?
This is all a load of unscientific claptrap in any case. But you can’t have 1). Clear evidence of siting issues + 2). No evidence of siting issues in some aggregated number for some different area. The whole ClimDiv is unfit for purpose, Anthony clearly shows this, and the ‘it all comes out OK in the end’ argument is complete rubbish, and self evidently is bound to cause major errors in the record.
To look at it another way: the siting issues should turn up in the overall network record, or it is unfit for purpose.
Your points are very cogent and well stated. These folks want to use statistics but only part of them, i.e., the mean. Not one of the CAGW proponents will discuss even the minimal piece of statistics that goes along with a mean, e.g., variance.
Although I received pushback about calling variance the amount of data dispersion surrounding the mean on another thread here, I’ve seen no reference that contradicts that definition.
Quoting a mean without also quoting the variance/standard deviation shows how lackadaisical the people calculating the mean are in handling measurement data and how little they care about accurate statistics.
This doesn’t come close to dealing with the uncertainty in measurements or how Significant Digit rules are totally ignored.
Only the mean providing the answer they want is important.
“What do you mean? Some overall average number for the USA?”
I showed you just above. The US average, which is the measure of warming. Here again is the monthly comparison.
“To look at it another way: the siting issues should turn up in the overall network record, or it is unfit for purpose.”
No, that is just faith-based. Your “proof” of siting issues is just a bunch of amateurs going around saying – “Gee, I don’t like the look of that”. No-one has shown that measurements are affected. That the “issues” didn’t turn up in the record is an observation. An actual result. The speculation about bad effects is undone by measurement.
Nick, your argument is that the changes don’t affect anything. Then why spend the time, effort, and money to even do them? The money could certainly be spent more wisely assisting poor people than spending it doing busy work.
Malarky! Measurement uncertainty makes it impossible to define a “true trend”, including direction.
Nick, you’re a complete pig-headed idiot. See the peer reviewed study at Oak- Ridge cited in my report – proof that siting affects temperatures. Of course you’ll probable deny that too.
The USCRN stations are stations selected specifically to to eliminate citing issues.
Mr. willis: An excellent retort, I note Mr. Stokes didn’t dispute you either.
Now I see him down the line, better read that first
A common tactic of eco-bleeps is to define words differently than most people do.
That’s a standard method of Marxism, which most eco-bleeps believe at heart, and consistent with related ideological teaching that words create reality.
So for example ‘dialogue’ means agreeing with them, not discussion or debate.
They use ‘science’ to support their anti-human agenda.
oh come on, everyone was doing acid and listening to disco in the 1970s, it’s no wonder they thought the world was headed to an icy, well-deserved doom
modern scientists may have no idea how many genders there are but surely they can re-interpret a thermometer far better many decades later
Say what?
Acid and disco? Sounds contradictory.
Cocaine and disco, maybe. There was another drug that the discoettes liked because they could dance for hours.
That’s saying they actually wanted to be accurate with the thermometers. Big government is not here to save you.
record, but . . .
See below
The usual suspects will just declare that this data just proves that skeptics are ignoring the science.
Not quite as blatant as GISS “correcting” the record, but . . .
The only accurate data are 42 years of satellite data since 1979
All the rest is bull manure and agenda driven
SOME COMMENTS ON TEMPERATURES
The average temperature has gone up just over 1 C in 100 years.
Temperatures go up and down 5 to 10 C, or more, every day, so that really is not a big deal!
If you step out from the shade on a sunny day, you experience a 10 C or so increase.
The alarm of an increase of 1-plus/100y cannot be justified as catastrophic!
100-plus years ago:
-There were not many weather stations worldwide. They covered less than 2% of the world land area.
– Above the entire ocean area (71% of the planet’s surface), there were no air temperature measurements at all!
– Thermometers were used only on land. Many were not 1) high quality, 2) properly-calibrated, or 3) cross-checked.
– The only accurate data are 42 years of satellite data since 1979. The graph of the data indicates much lower temperatures than of computer-generated graphs, which are based on agenda-driven, massaged/adjusted data
Thus, the BASE-POINT of the 100y-old temperature reference from which to judge what has happened during the past 100 years is extremely dubious, to say the least.
Carbon dioxide is added in actual Green Houses to increase plant and crop growth rates! Carbon dioxide has been a real boon in all food producing countries in the world.
Pollutants such as heavy metals, unburned carbon particle, dioxins, organic chemicals like benzene and fluorocarbons, toxins, and many more can come from natural fires, all combustion process, industry, volcanic eruptions, and more.
Sea levels have been measured worldwide for well over a century and the level-increase is only about 2mm/year (or less). Some land areas like in Scandinavia are actually subsiding. There is no sea-level crisis anywhere in the world, and no sudden upsurge has been recorded anywhere at all in the world.
All about the money 💰
“The problem with following the science is that the science follows the money.”
Gee, who would have thought 😡
Tracking in a circle usually means you are lost
Just wait until the people getting the money for this no longer live in a country with an economy to buy anything.
Might just be time for the ‘power of the purse’ to step in after the election.
Wishful thinking, the 2022 election is going to be more corrupt than 2020 was.
I fear you are correct, Steve.
We can’t afford to think that though. We still must vote.
“By contrast, NOAA operates a state-of-the-art surface temperature network called the U.S. Climate Reference Network,” Watts said. “It is free of localized heat biases by design, but the data it produces is never mentioned in monthly or yearly climate reports published by NOAA for public consumption.
_________________________________________________________
But GISTEMP is mentioned by media and so far here are the number of adjustments each month for 2022.
Jan Feb Mar Apr May Jun Jul Aug Sep Oct Nov Dec
291 243 252 401 346 261
And of course, over the years these adjustments add up to to significant changes, and that looks like this:
Do you have any idea what the rationale is for changing the 19th C temperatures?
THat’s what was needed to get the data to match the models.
Why a negative vote? This statement is both honest and correct. It show that at least for true believers the model output is more important and more correct than the actual measured data since computers are always right. Actual measurements may contain errors. (/s) :<)
so true
many people have heard the saying
It doesn’t matter how beautiful your theory is, it doesn’t matter how smart you are. If it doesn’t agree with experiment, it’s wrong.
but what they don’t know is with that second “it’s” Feynman actually meant experiment is wrong
Of course you are being sarcastic. Everyone knows Feynman wasn’t that stupid.
That would be like climate “scientists” claiming that, if the data did not agree with the models, the data must be wrong and must be changed. Sorry, “adjusted”.
/sarc/
I finally figured it out, you meant the 19th Century. Jesus Christ, is there some God Damn reason people insist on using undefined acronyms & abbreviations? To answer your question here’s what NASA’s Reudy Rito had to say several years ago:
“Your main concern seems to be why data from 1880 get
affected by the addition of 2018 January data and a few
late reports from the end of 2017. To illustrate that,
assume that a station moves or gets a new instrument
that is placed in a different location than the old one,
so that the measured temperatures are now e.g. about
half a degree higher than before. To make the temperature
series for that station consistent, you will either have to
lower all new readings by that amount or to increase the
old readings once and for all by half a degree. The second
option is preferred, because you can use future readings
as they are, rather than having to remember to change
them. However, it has the consequence that such a change
impacts all the old data back to the beginning of the station
record.”
You can interpret that any way you want. In any case the changes continue month after month, year after year in a steady drone cooling the past and warming the recent.
Reto is wrong. Transfer functions don’t adjust temperatures. They transmit uncertainty. I’ll show that in my next paper on air temperature measurement.
I apologize for causing you some consternation. But, C following some number, such as “20th” has been a common abbreviation for century for a very long time. However, after some online checking, it appears that I may have violated the recommendations of one or more style guides. The reason was to save some typing. I’ll try to be more verbose in the future.
My comment was in response to Steve Case, Clyde. Sorry I was unclear. No need for any apologies.
And, in turn, my comment was intended for Steve Case. Sometimes comments seem to end up in strange places in the thread.
If a site is moved slightly, then why is the temperature record adjusted more than once? Did the site move a few feet every year? Why did the adjustments continue?
Rito’s explanation is bullshit.
Only in Climate “Science” would such an “adjustment” of past data be acceptable. In any other physical science or engineering discipline it would be considered data tampering or even outright fr@ud.
It is fraud. Adjusting has no scientific basis to it. If a station has changed, it is measuring a new microclimate and probably has a new instrument included.
The ONLY reason for ARTIFICIALLY CREATING a long record is for statistical purposes. It IS NOT for a demonstrable instrument calibration purpose since there is no physical proof that the previous instrument was incorrectly calibrated.
If you’re going to adjust one station based on another, then you are just making the information up. That is what homogenization does. It smears temperature information all over the place.
They want to flatten out any “climate change” that happened before fossil fuel took off.
The little ice age flattened out climate change for 400 years before fossil fuel took off. But no scientists ever ask why or how that happened. That’s because there is no money available for the trough to find out. If there were, you can bet there would be all kinds of papers explaining that cooling.
The 2009 surface station study attracted me to this excellent website and this update is great too.
The number of adjustments to the raw temperature data are important too.
More important is the wild guesses — infilling — that can never be verified.
In the 1800s there had to be a lot more infilling than actual measurements.
Even today there is still too much infilling. I do not have accurate numbers — perhaps someone else does — but I believe at least 20% of surface grids have one or more infilled numbers every month. There are areas of the planet where grids are 100% or nearly 100%, infilled numbers — such as in central Africa. Areas where NASA-GISS claim are making high temperature records (TMAX) based solely on NASA-GISS infilling !
Now let’s imagine that the UAH temperature compilation is perfect, and the surface numbers are very similar. There was global warming since the 1970s.
Now consider if that imaginary perfect global average temperature would make a difference to the coming climate crisis scaremongering.
I say no.
Historical temperature records are NOT used for the prediction of climate doom.
The Climate Howlers call for a rate of future warming at least double the rate of warming in the UAH record since 1979. They are not extrapolating prior temperature trends because those trends are not dangerous, and would nor scare anyone.
They are completely ignoring the global cooling from 1940 to 1975 too.
The Climate Howlers scare people by predicting rapid, dangerous warming. Climate Howlers have made the same predictions for the past 50 years, and will probably be making them for the next 50 years too. They program their computers to make the same predictions. And the accuracy of temperature history records will make no difference. The climate predictions of doom will continue to generate fear … while actual global warming since the 1970s has been very pleasant.
Science + Politics = Politics
It seems to me that most of the world outside of Western Europe and north America is all infill all the time? It seems reasonable that most of the readings we have from the rest of the world back to 1900 are all from cities and likely mostly part of European empires and therefore are far more corrupted by UHI?
I always thought it suspicious the two graphs Hansen had side by side in his 1998 paper, the “world” graph showed far more linear warming?
You must be referring to this:
NASA has deleted the webpage that had this graphic but the Wayback Machine still has it.
And here’s the text of that webpage via the Wayback Machine. Below is Hansen’s lame excuse for why the U.S. temperature profile differs so dramatically from the global temperature profile. Hansen says the U.S. has been following a different course than the rest of the world! No, James, the temperature profile of the world looks just like the U.S. temperature profile with the Early Twentieth Century showing to be as warm or warmer than the present day. Your Hockey Stick Fraud is exposed with your own words.
Hansen: “How can the absence of clear climate change in the United States be reconciled with continued reports of record global temperature? Part of the “answer” is that U.S. climate has been following a different course than global climate, at least so far.”
That’s so lame! He expects people to believe that lie.
Tom
Why are you still using the (old) graph that stops at 2000 when you have been given(last week) an updated version that went all the way to 2020 and clearly shows todays US is warmer now than at any time in the time shown?
“More important is the wild guesses — infilling — that can never be verified.”
+100!
Most important is the fact that historic recorded temperatures conform to the temperature profile of the United States where the temperatures in the Early Twentieth Century were just as warm or warmer than today.
When you have the same temperature profile recorded all over the world, then that is the temperature profile of the planet. People can complain that there wasn’t enough coverage of the areas of the Earth, but the areas that *were* covered all show the same temperature profile. All over the world.
And the temperature profile looks nothing like the bogus, bastardized Hockey Stick global temperature lies.
“Science + Politics = Politics”
Or Science + Politics = Politics – Science?
Science + Politics = Politics (squared)?
Science + Politics = “selective” science?
You are on the right track.
It’s worth considering what may be the most important question:
Do you trust the people compiling the global average temperature number?
Were certain climate beliefs important for getting their jobs?
Do they demonstrate unbiased science and strive for the most accurate measurements possible?
Do they accept new measurement methodologies that could be more accurate, such as satellite data and the USCRN network?
Do they celebrate the Russian INM model that least overpredicts the rate of global warming?
Do they refine their climate models to make more accurate predictions?
Do they publicly predict a coming climate crisis, creating a pro-warming bias with their raw data adjustments and infilling?
Ae there any consequences for wrong climate predictions?
Do they have the freedom to express opinions contrary to the current global warming consensus?
I would not trust government bureaucrat “scientists’
to tell me the time.
“It’s worth considering what may be the most important question: Do you trust the people compiling the global average temperature number?”
Absolutely not. What they compile ends up looking nothing like the written temperature record.
Meanwhile Nick Stokes maintains up and down that the adjustments make no difference in the “trends”.
No he doesn’t maintain it, he proves it with verifiable data. In fact as you have been told countless times, the unadjusted data is warmer than the adjusted.
And you guys bang on about honesty. Shish!!!!
I would add. Are they trained mathematicians or trained physical scientists with a background in physical measurements?
Apparently, those adjustments look sorta gaussian. If you plot them in a histogram and squint, that means you can justify treating them as randomly distributed about a mean when calculating the contribution to the errors.
But they show a non-random pattern in time.
Exactly, bur that’s what they do, apply CLT to the adjustments.
Exactly, but that’s what they do, Assume that they can apply CLT to the adjustments.
What the is “CLT”? My [Ctrl F] search on “CLT” turned up just the 2 from Sparko and Kevin Kilty above.
Why do people find it necessary to use undefined acronyms.
Central Limit Theorem
Central limit theorem. Applies to measurement error that is assumed to be randomly distributed about a central mean, but not to systematic errors or bias.
Steve,
If USCRN data are not reported published by NOAA perhaps we (or the Heartland Institute) should file a FOIA request.
Oops! Belay my last comment, I see the graph in the right sidebar. Sorry.
That graph is crap. It shows the 30-40’s colder than now… Tone Heller at realclimatescience has the facts of those times and that ‘graph’ is Govt BS!
We have a thermometer [in the shade] by our pool [in the sun] in central FL. It NEVER shows the morning low reported on the weatherstation, always maybe 5deg above. Pool of course is from 86-89 deg here in the summer. Just more peripheral evidence.
AP headline tomorrow:
Florida Pools Cause Global Warming!
Subhead:
Governor DeSantis At Fault.
🤣
Or Trump’s fault 🙂
DeSantis is the new Trump.
Please keep up with your boogeymen.
Trump was never a politician…that scares them more.
“Trump was never a politician…”
And it is starting to show more than ever. I see he is now finally under criminal investigation. About f@ur momisugly@king time.
True, true, the investigation is criminal, and baseless.Now they’re just stirring the ashes of the previously scorched earth investigations to see if there’s an intact corner of a process crime the lab can reconstruct. “Show me the man and I’ll show you the crime,” doesn’t mean the crime has to be real.
Just ask Martha Stewart.
For what, genius? All your Democrats are actually criminals and nothing ever happens to them. But please show your mental deficiency by telling us what did Trump do that was criminal. I know you can’t because none of you have functioning brains.
“But please show your mental deficiency by telling us what did Trump do that was criminal. I know you can’t because none of you have functioning brains.”
There’s that, and there is the fact that they can’t name anything criminal that Trump has done. “Orange Man Bad” is as far as their thought process goes.
Hahahaha the colluuuusion clown appears. Did you find any yet?
Oh wait it’s not your turn to borrow the brain from Griff.
All you are left with is searching for colluuuusion and inflation…good one clown.
For the “crime” of being Donald Trump.
Trump is the most investigated President what on God green earth are you talking about, when you say “its about time”? You do understand in this country it was once considered illegal to investigate someone when you have no evidence to a crime.
“You do understand in this country it was once considered illegal to investigate someone when you have no evidence to a crime.”
And so it should be…. but that is clearly not the case here. They have been quietly collecting evidence for some time now. Will be great to see what they have when it is released. But I tell you this, if it leads to a charge, it won’t be nothing.
You are waiting for Griff’s brain.
The same kind of BS “evidence” of Russia, Russia, Russia, for which the taxpayers shelled out tens of millions of dollars investigating to come up with the real criminals being the accusers. Shove it, clown!
Lavrentiy Beria smiles at this “criminal investigation”.
Our Founding Fathers weren’t politicians either! Our problem today is professional politicians and their toadies, the Bureaucratic Hegemony. Not a lot of difference between pre-Revolution France and today’s USA.
Read our Declaration of Independence – very little difference in the overreach of current U.S. gov’t and that of King George.
And Hunter Biden still walks free.
Hunter Biden was not the president.
Yeah but his biz partner is.
doesn’t matter, any other person did what he done would be locked up by now, & that includes you fool
Hunter Biden committed crimes, Trump didn’t.
His equally corrupt father IS!
The “Big Guy” is the president. The Big Guy is lying about his involvement in Hunter’s foreign deals.
When January rolls around we will find out a whole lot more about the Big Guy and his crime family.
Come on Tom you have said that stuff before…
As does his complicit father.
TDS-boi here is about to have a meltdown when his scheme is finally exposed.
We shall see.
OMG THE WALLS ARE CLOSING IN ON TRUMP!!!
Actually it’s the drugs you’re taking Simon. The walls are fine.
That fake news article over which you had an 0rgasm about DJT being “investigated” was attributed to four anonymous sources.
Says the guy who, if American, almost certainly voted twice for an unindicted felon. Or perhaps for the slaver, Bernie Sanders.
And if not American, certainly would have done were he.
“Says the guy who, if American, almost certainly voted twice for an unindicted felon. Or perhaps for the slaver, Bernie Sanders.”
Ummm no. Most of the convicted vote fraudsters seem to be Republican. I have never and would never vote twice.
Hillary: used an unsecured server. Felony offense. Unindicted.
Destroyed 33k emails in the face of a Congressional subpoena. Unindicted.
Joe Biden: took a $1.5 billion bribe from China. Felony. Unindicted. Used his power as VP to extort $50k/month from Burisma. Impeachable high crime. Unindicated.
Blows smoke: Simon.
“Joe Biden: took a $1.5 billion bribe from China.”
Bollocks.
“Used his power as VP to extort $50k/month from Burisma.”
Bollocks again. You my friend are talking Shite…. If there was any truth in those two there would be some evidence and there isn’t(except on the crazy right wing conspiracy sites).
And the Clinton thing was potentially a crime, but a very long shot at best. And anyway if she is guilty, then prosecute her I say. I’m no big fan of her.
Trump on the other hand looks to have committed a number of very prosecutable crimes including tax and election fraud, and an attempt to overturn an election using force. So blow your own smoke and break out the popcorn I say.
Subjective prosecution of politicians will eventually lead to civil war. What you sow is what you reap.
TDS-boi is part of the Nov. 3 color revolution that installed a puppet government in USA.
Buuuuut….. what if they are guilty? Just saying.
A DC jury pool will never convict a Democrat or allow a Republican to go free.
That’s a possiblity.
Do kiwis routinely bury their heads in the sand? This kiwi certainly has done so.
Joe Biden self-admittedly using his VP powers to extort graft from Ukraine. To benefit Hunters $50k/month payola with 20% for the big guy.
Biden and the Chinese billions.
SLAC is a DoE lab. I had to take a DoE workshop on protecting sensitive government information. Willful violation is a felony. Every single email Hillary sent on her unsecured server constituted a felony. That’s 33,000 felonies for Hillary and zero points for you.
tax — small potatoes, at best.
election fraud — now rationally undeniable.
and an attempt to overturn an election — Given the clear fraud there was no election.
using force — disorganized crowd, FBI provocateurs, no weapons.
Wrong on all counts, Simon, as usual. You voted for criminals and point a finger. Typical.
Re that first clip. I was embarrassed to be the 572nd viewer to that. It is so well documented that Biden had full authority from Obama to get rid of the crook (Shokin) and so that is why he withheld the money. Why the hell we he admit in full view to the world if he had taken a bribe?
https://www.usatoday.com/story/news/politics/2019/10/03/what-really-happened-when-biden-forced-out-ukraines-top-prosecutor/3785620002/
As for Clinton… as I have said if she is guilty then they should prosecute her. But that doesn’t alter the fact that Trump is also currently in deep dodo so if you are, as you imply, all for law and order, then why would you not want him investigated? Now that is selective.
full authority from Obama to get rid of the crook (Shokin)
The crook Shokin who just happened to be investigating crooked Burisma, where Hunter was collecting $50k/month for doing nothing.
Of all the crooked politicians in crooked Ukraine, Obama and Biden just happened to focus on Shokin.
I see you’ve abandoned defending Hillary, and have sidestepped the Biden $1.5 billion bribe by China.
“The crook Shokin who just happened to be investigating crooked Burisma,”
Did you even read the article I sent? At the time that Shokin(the crook) was investigating Burisma (2012) Biden hadn’t even started working for them. It is a BS story. And it wasn’t just the US who wanted Shokin out. He was a notoriously corrupt man. Half of Europe wanted him gone.
“In July 2015, shortly after his appointment, reformist minority member Yehor Soboliev advanced a motion to dismiss Shokin for corruption, gaining 127 of the required 150 signatures including several members of the ruling parties.[56] Representatives of the EU and the United States pressed Poroshenko for his removal,[2] as did the World Bank and International Monetary Fund.[3]“
Colluuuuusion stupid.
Oh look it’s Monte the Moron with nothing worth adding except his renowned childish comments.
TDS-boi heads to Ironyville…
You are the moron dude.
You are so stupid…wow.
It is matter of public record that Hunter Biden “worked” for Burisma.
Ask Tony Bobulinski bout the Biden Family corruption. I suspect he knows a little more about it than you.
“It is matter of public record that Hunter Biden “worked” for Burisma.”
I don’t recall saying he didn’t. He just wasn’t on the payroll when Shokin started his investigation so the line that Biden sacked Shokin to stop and investigation into his son through Burisma, is absolute rubbish.
Hard to imagine how stupid this person is…
‘Destroyed 33k emails’
You believe a Clinton number?
It could have been 133,000 !
Nope, probably more like a dozen or so.
To investigate a crime there must be a crime. All federal crimes are codified in United States Code.
In regards to Donald Trump, No one has ever stated what US Code is being investigated.
One would think that public servant Merrick Garland would tell us since he is in charge. If he can’t do that, then it’s a fishing expedition
“One would think that public servant Merrick Garland would tell us since he is in charge. If he can’t do that, then it’s a fishing expedition”
I think it’s coming….
Just stop, its not working for you.
Garland is as corrupt as the other Democrats.
TDS much ??
Yeah, the Democrats are carrying out a Soviet-style political show trial.
Of course, they are going to indict Trump. That’s the whole purpose of this political hit job.
They are doing all this in an attempt to prevent Trump from running for president again, because they think he can win and if he wins then they lose their poltical power and their socialist paradise. And Trump has vowed to root the Democrat/Swamp evil doers out, if he gets back in.
The Evil Democrats won’t be successful because Trump has committed no crime. It’s not illegal to question the integrity of an election. It’s not illegal to seek any legal remedy for a corrupt election process. That’s all Trump did.
The Evil Democrats have been trying to nail Trump with something/anything for the last five years, criminally using the power of the federal government to do their dirty work and they *still* haven’t laid a glove on Trump.
Trump is the most vetted, innocent man in American politics. He owes nobody anything and is not obligated to anyone except the American people. The perfect person to clean house in Washington DC.
And Trump is still leading the Republican pack by a substantial margin and he’s not even trying yet.
Trump has to be elected again. Otherwise, the Evil Democrats and their efforts to undermine our government win, and if they win, then the rest of us lose Big Time.
We can’t let the criminal Democrats get away with their crimes. It’s time to hold them accountable for their lies and their crimes against the United States and our way of government.
“Yeah, the Democrats are carrying out a Soviet-style political show trial.”
Not just dems though is it.
“They are doing all this in an attempt to prevent Trump from running for president again,”
And do you honestly think he should. Here’s a man who promoted a violent group to attack the capital in an attempt to stop the democratic process. Then sat on his hands while it all erupted. Against the advice of all his advisors and family) costing lives.
” It’s not illegal to question the integrity of an election. It’s not illegal to seek any legal remedy for a corrupt election process. That’s all Trump did.”
No it’s not Tom.
“Trump is the most vetted, innocent man in American politics.”
Here I’ll correct that so it is true. Trump is the most vetted, man in American politics. And for good reason. He has numerous charges against him pending. Some of them very serious. Tax and election fraud just two. But let’s not forget the sexual assault charges too. Ohhh and he is the only president to have been impeached twice. That takes some doing.
“Trump has to be elected again. Otherwise, the Evil Democrats and their efforts to undermine our government win, and if they win, then the rest of us lose Big Time.”
It is called democracy.
“We can’t let the criminal Democrats get away with their crimes. It’s time to hold them accountable for their lies and their crimes against the United States and our way of government.”
Good point. OK so what are their crimes?
LIAR!
You are just a dupe for your communist masters.
Liar you call me. Well what is this then? I’ll look forward to your answer…
TDS-boi believes the fake news, how dumb is this?
….and Carlo Moron believes his lord and saviour tRump when he says it’s fake. You are a true disciple. Now, tell me what part is fake? ‘d love to know.
You call me a moron but you believe all the lies pumped out by Adam Sh*thead and allies. How dumb is this?
You should go back to Fakebook and Twatter, this reality stuff isn’t working for you.
Then tell us about Hunter Biden and the Biden Crime Syndicate, moron.
No you tell me. You seem to know something I don’t. Hunter is a crack head. Beyond that I’m not aware of any crimes that J Biden has committed.
How does that sand taste, TDS-boi?
Haha. Says the man who admitted he wont read anything but right wing information.
Yep, stuck in the sand.
I’m genuinely keen to know what crimes J Biden has committed or is being charged for? I mean you call them a crime family.
All the time Trump faces numerous civil and criminal charges. But he’s not right?
Your lies are more and more transparent by the day.
Maybe you can tell me oh honest one. what crimes has J Biden committed?
Crickets.
Trump refuses to be a politician… that double-scares them
AP headline the day after tomorrow:
Florida Pools Global Warming Worse Than Previously Thought,
Scientists Say !
AP headline two days after tomorrow:
Florida Pools Warming Twice As Fast As Pools Everywhere Else!
NB:
“By contrast, NOAA operates a state-of-the-art surface temperature network called the U.S. Climate Reference Network,” Watts said. “It is free of localized heat biases by design, but the data it produces is never mentioned in monthly or yearly climate reports published by NOAA for public consumption.
How about we have a section on WUWT that publishes this data, eh? Their website says it is downloadable, someone qualified just needs to start putting it together. Contrasting it to the”official” data might be fun.
Look at the right sidebar.
It would be nice if the US temperature graph (surface) started in 1979, just like the global temperature graph (satellite).
Ooops, my bad. How come UAH and CRN are so different?
UAH is not the surface temperature, but is instead a convolution of the 0-10km altitude profile and the microwave sensor response.
Which UAH data are you referring to? https://www.nsstc.uah.edu/data/msu/v6.0/tlt/uahncdc_lt_6.0.txt lists “lower tropospheric” data broken down to several regions. For USA data, see global, land, northern hemisphere, northern extratropical, USA48, and USA49.
UAH is global. CRN is US land only.
US = Hawaii & Alaska + 48 contig !
Does that include DC? How about Guam, the US Virgin Islands, the Commonwealth of Puerto Rico and American Samoa?
In 2018 -19 I submitted an MS xcel produced trend graph of uscrn data vs Hawaii co2 data ( both monthly ) ! Next year I would like to revisit and update the graph !
LOL
Is there a way to graph the USCRN data for a single site? The NOAA website allows you to graph the combined data. I’m interested in creating a graph of a single site.
Some browsers no longer support FTP natively (you may need an “add-on”) but the following NCDC “…/pub/data/…” link contains the raw data you are asking for :
ftp://ftp.ncdc.noaa.gov/pub/data/uscrn/products/
The “./monthly01/” subdirectory contains all available per-station data directly.
The “./daily01/2000/” to “./daily01/2022/” contents will need more work on your part to put together for the specific station(s) you are interested in.
NB : See also the “./monthly01/readme.txt” and “./daily01/readme.txt” files.
As I recall, the USCRN was begun under Bush (43) specifically to get better data on temperature trends. Its build-out was halted by the Obama administration because it was producing the “wrong” answers.
There was no halt. But more significantly, it produced the same answers as ClimDiv.
Adjusting data 😉
Are you interested in people dying from your policies?
Climate change is used to justify gov spending on weather stations (USCRN), satellites, etc. and as soon as the data doesn’t match the narrative, it goes silent.
The Climate Reference Network is official data. It shows no warming for 11 years.
“Contrasting it to the”official” data might be fun.”
NOAA does that. And USCRN almost exactly matches the “official” data
 
Well Nick, once again, you’re wrong. Of course you’ll never admit to it, because you’re a pigheaded “know it all”. Still waiting for that apology from 2011 over that idiotic story you supported claiming climate scientists in AU were threatened.
They use the USCRN data to ADJUST nClimDiv data to closely match. And there is only 17 years of it, which means the past century of data is still as useless and corrupted as ever.
Just admit that the surface data is a mess and save yourself further embarassment….oh wait, I forgot. Your ego makes you incapable of being embarrased, much like Mann and Gavin.
Insta-Fact Check – TRUE Nick is a PKIA
“They use the USCRN data to ADJUST nClimDiv data to closely match.”
Any evidence that that is done? Or even how it could be done?
But what is the point here? You now claim that the nClimDiv stations are corrupted, but they throw away that data and use USCRN anyway?
”Any evidence that that is done? Or even how it could be done?”
Any 2 sets of data that match that closely is collusion.
“Any 2 sets of data that match that closely is collusion.”
I calculated that data myself, beginning with the raw station data for both CRN and GHCN V4. I described it here. In the graph MoyCRN is my calc from raw CRN data and GHCN_u and GHCN_a are my calc using GHCN unadjusted and adjusted respectively. They all agree to about the same very great extent. This reflects the fact that they are measuring the same thing with very dense station coverage – far more than is needed.
If as you claim, the adjustments/data frauds make no difference to the answer, why bother with them?
Nick, in that graph the ClimDiv value is 11.9% higher than the USCRN value at the 2009 mark. At the 2018 mark it’s about the same amount lower.
Do you consider a 23.8% variance “an almost exact match”?
Those would be the maximum deviations. But the key thing is, do you think ClimDiv, with its supposedly corrupted stations, is telling a different story than USCRN? Is the agreement just coincidence?
The important question is “Why did the graph swing one way, and then the exact same amount the other way?”
The variance can’t be handwaved away just because the graph matches nicely elsewhere.
Has anyone run a regression on the USCRN data lately? (like Lord Monckton does)
Last time I did it there was a slight warming trend.
This is the best temp monitoring network in the world, and needs wider distribution.
Of course warmists point to its short duration, but it is the best we have got.
I use it often when a warmist says X has become worse in the USA (pine bark beetles, tornadoes, what ever) during the past 10-15 years. Then point them to the USCRN and say, well probably not due to temperature and therefore the hypothetical CO2 caused warming.
I did it once, crn vs Hawaii c02, in MS xcel and will update next year !
I did one here in Feb 2020 for 2005-2019:
USCRN 3.10 °C/century
ClimDiv 1.96 °C/century
The extent of trend is surprising from the graph, but is not apparent by eye because of the shortness of the period. The difference is also surprising, since the curves look very close, but again the short time makes a small difference into a big trend. The difference is probably not statistically significant. I did my own calculation of the spatial averages from station data, with similar results.
Latest and greatest trendology results.
Yawn.
Thanks for the link Nick.
Keep updating it.
Nick You are a bullshi! artist ..
You take 15 years of data then multiply the minimal warming by 100 years .
There is no way that the world will see 3C warming in 100 years .
You should know and we know that you do that this present mild warming has occurred 4 times over the last 12,000 years .
You should also know that the effect of CO2 on warming is logarithmic and will not and cannot warm the world much more if at all .
You should also know that the UHI is corrupting temperature records and this warming can never be blamed on rising levels of CO2.
You should also know that CO2 is NOT a pollutant but it is essential for all life on earth .
If you do refuse to accept these facts then I would say you are a Know All who twists the facts to suit your story .
“You take 15 years of data then multiply the minimal warming by 100 years .”
The request was for regression on USCRN data (ie trend with time). 17 years of data is what we have. It isn’t trying to predict 100 years. It is just asking how we are currently going.
What is the optimum concentration level of carbon dioxide in Earth’s atmosphere?
Nick stop twisting what you wrote ,and what so many so called climate scientists do .
You said you had run the figures from 2005 to 2119 = 15 years .
Then you state that the rise in the USCRN data shows a trend of 3.10 C per century .
This is the unsupported scare mongering that the News Media splashes across the pages and the TV news .
“We are all going to cook ,a scientist has calculated that it will be over 3 C degrees warmer in 100 years ”
BS Nick.
When you’ve only got two clocks and they’re 15 minutes apart, you have no way of knowing which is correct — or even if either of them are.
If they stay 15 minutes apart, you know at least they are both working as clocks, or something very coincidental is going on. And then you know a lot more about the time than if you had no clocks.
But this is more like 15 seconds. It’s a disparity far less than the behaviour we want to know.
I dunno… 3.1 and 1.96 are about 50% apart. I wouldn’t be happy with those results,.
The USCRN is the best temperature monitoring network in the world. It deserves more mention and wider exposure.
Has anyone run a regression lately (like Lord Monckton does) on the monthly data? I did a while back and saw a small warming trend.
The only defect the warmists will point to is the short record length. But is a nice retort to “the past 10-15 years have seen an increase in X in the USA” (pine bark beetles, tornados whatever)
We can point out that any degradation in X must not be due to temperature or the hypothesized influence of the CO2 increase.
Don’t forget, it wasn’t too long ago that 97% of climate scientists used to agree that 15 years with no warming trend was reason for them to start worrying about the hypothesis. Of course, back then it was polar bears, ocean pH and sea level rise they were worried about. Now its forest fires, barkbeetles and human extinction.
The problem with the USCRN is that it started in 2005 with something like 7 stations. More have been added every year, but it’s a hard data set to parse.
Is it a correct assumption that there are more temperature recording stations located in and around urban areas than there are in rural areas which of course would lead to over sampling of higher temperature areas?
Yes Sam. Also, the urban areas have been build up over the past century, which adds a spurious warming trend.
And, as Anthony noted in 2009, a good number of stations with “continuous” records for more than a century even though the station was relocated several times to avoid urban expansion.
Since I was born there is a lot more blacktop for sure.
We had a couple of hot days in the UK last week. Two 40C+ temps were quoted: from Heathrow airport and Coningsby airport.
Exactly. The UK temperature stations are in a very similar state to the US ones, for exactly the same reasons. I wonder if the GWPF could be persuaded to head up a UK temperature station survey? I think it needs to be done soon and maybe, just maybe, we can get a little more traction.
I would be happy to go and look and take pictures.
If paid per diem, of course. 😉
Re my and Oldseadog’s reply to Richard Page – I said volunteer which, generally, means for free – certainly in my case.
We’ve been seen coming from a long time and a long way off
The significant stations are at military bases or ‘air-side’ at airports.
One can not just casually wander into and around those places taking photographs – well – certainly not the hideously paranoid world we now find ourselves you can’t.
Indeed – I put the published coordinates for RAF Coningsby into Google Maps and it put the location somewhere near a runway. Of course, this is just Google Maps and you can’t just walk onto an RAF base; however, surely the majority of sites should be accessible in some way?
The airport and airfield locations are, indeed, a no-go but we know that the location that makes them useful for aircraft eliminates their usefulness as weather network stations. I think we can confidently categorise those stations as contaminated and concentrate on the other stations in the UK; the Met Office website should have a list of those stations and their co-ordinates.
Most are on MOD sites and therefore inaccessible
I should be happy to volunteer time to locate and photograph/describe the locations if such a project was to go ahead.
Peak temps for perhaps a single hour of those two days.
I live only 50 miles from Heathrow. It was a hot day but nothing to write home about.
I am but 20 miles as the crow flies from Heathrow. It was certainly hot (particularly when walking across a supermarket asphalt carpark) but felt just like holiday temperatures experienced in Spain. Just missing the swimming pool and a drink with a little umbrella in it.
A few year ago there was an HURRAY put out by Skeptical Science about a new highest ever temperature. It was at Heathrow. Someone posting on WUWT attempted to get the data for that claim from MET Office, who had reported the claim to the Skeptical Science group. Met office said it was available for a rather large sum of money.
But, it turned out that the data had already been provided to Skeptical Science and was available ON their web site. It showed that the reading lasted only some number of seconds, well below the official 2.5 minute average calculation for electronic temperature sensor stations that can take a reading every second. Investigation showed that the temperature sensors were very near a major runway.
Suggestions that the reading was induced by aircraft operations were vehemently denied as certainly not true, or even possible, by Skeptical Science and other True Believers.
Investigation found that airport security camera recordings were available on-line and that at the exact time of those exceptionally high readings a large passenger jet, just out of the sky, was going right by the sensor position, all jets at full reverse thrust to slow the behemoth. The security camera time stamps matched the MET Office temperature tie stamps. Quiet prevailed thereafter.
Fascinating.
Several times since this event I made comments similar to: “The only question is whether it was caused by a 747 or A380….”
Is it possible to see the video? Maybe it would answer my question….
Chris
I can never find a past WUWT article. However they are indexed, tagged, or whatever is used by the search function, seems to something incomprehensible to me. I don’t remember a search ever being suscessful, so you are on your own unless there is an insider’s secret section somewhere that explains it.
The third site, Charlwood, is at the end of the runways at Gatwick
Where I live 40c is below average for this time of year. Oh by the way we have not come close to 40C in the last few days.
Since the heatwave peak on Tuesday last week it’s been steadily getting cooler. The last few nights I put on my sweater, and last night I was actually thinking of switching on the electric fire.
Chris
The UK records are absolutely genuine. The Met Office says so. https://www.metoffice.gov.uk/about-us/press-office/news/weather-and-climate/2022/record-high-temperatures-verified
Though I think the Hawarden Airport weather station, which recorded Wales’s highest ever temperature, has been moved recently closer to a service road.
Indeed. Airports.
For how long were those temperatures measured? It can not be more than a few minutes.
If we would have measured with the system of the old days (checking the mercury level a few times per day) would we have gotten the same result? I bet we would have missed that peak, and stayed below 40C.
Soon though, someone from the alarmist acolytes camp will be along to declare –
“but look, the straight line is still heading upwards”.
While totally missing the point about thumbs on the scales.
Likely Nick Stokes
Which gave rise to the adage: Different Stokes for different folks!
Come on now. Nick is unfailingly polite and is always willing to explain his methods. I’ve had several conversations with him at his site, and while we didn’t always agree, ad homs are not his style.
ad homs aren’t his style, but evasions, nit picking and goal post moving, are.
The PKIA?
What thumb on the scale do you see here?
What’s amazing is that you don’t! What’s the temperature difference between the 40s and now?
I see that the adjustments reduce the net warming trend, but I don’t think that’s the “thumb on the scale” Watts et al are trying to allege.
Have another cup of coffee and look again.
The “adjustments” lowered the old temperatures from the 40’s through 1980 (easier to get away with lowering old temps than raising new ones) which raises the “adjusted” trend starting in 1970, the 50 year trend that they often quote.
Not only that, but there are UHI biases built into the newer raw data, as bad or even worse than the old data. The new data should have been adjusted down just as much or more. But it wasn’t.
That’s a CLEAR thumbprint on the scale.
The adjustments have very little (<0.1 degrees) impact on the trend since the 1970s. Most of the impact of the adjustments is on the historical trends, and the adjustments lower them. The amount of warming shown in the raw data is greater than the amount of warming shown in the adjusted data.
Simply not true unless the captions of the two curves on your graph are reversed. The raw data shows about the same temperature rise brom 1880 to 1940 (with little CO2) as from 1940 to 2000 (with more CO2) and doing so, falsifies the idea that modern warming is anything special or “unprecedented”.
The impact on the trend since the 1970s is entirely irrelevant.
The adjustments very obviously make the natural, “pre-anthropogenic” warming of ~1910-1940 look a lot less sharp than it really was, while at the same time make the supposedly anthropogenic warming of ~1980-2020 look much more remarkable relative to the natural warming period that preceded it.
In other words, Hausfather manufactured data to tell a story in which the few decades of recent warming appear to be noticeably different from the warming periods of the past. This is data mangling in service of a narrative, not science.
When was the last time you had your eyes checked by an optometrist? The issue, because alarmists are blaming humans for causing rising temperatures, is that the trend line for temperatures since the 1940s is steeper in the ‘corrected’ data than the ‘raw’ data.
What is the basis for the historical adjustments? Have the researchers been able to locate the original thermometers and check their calibrations?
Nicely put. But we aren’t supposed to believe our lying eyes.
‘Course it helps if one actually is capable of reading a graph, and knows the difference between the data and the trend of the data.
The issue … is that the trend line for temperatures since the 1940s is steeper in the ‘corrected’ data than the ‘raw’ data.
_________________________________________
BINGO!
Lol..good one
GISS handles land (and ocean) temperature measurements derived from orbiting satellite instruments, not land based measuring stations.
The corrections indicated in the graph that you provided may not be a “thumb on the scale” type that you insinuate, but instead necessary corrections to adjust for various satellite measurement-introduce errors and/or calibration factors. Hard to say since you did not provide a reference/link to the source of your graph.
As to the whole point of UHI contamination of land-based temperature measurement stations, one would logically expect this to be a world-wide problem since most such station are—for convenience and security and especially for easy access to power and ease-of-maintenance—located in urban areas, quite often at airports near large areas of concrete and/or asphalt.
(This reply was incorrectly positioned below)
That is incorrect, from the GISTEMP website:
“The GISS Surface Temperature Analysis ver. 4 (GISTEMP v4) is an estimate of global surface temperature change. Graphs and tables are updated around the middle of every month using current data files from NOAA GHCN v4 (meteorological stations) and ERSST v5 (ocean areas), combined as described in our publications Hansen et al. (2010) and Lenssen et al. (2019). These updated files incorporate reports for the previous month and also late reports and corrections for earlier months.”
Urbanization is indeed a worldwide phenomenon, and adjustments have been developed to handle trend inhomogeneities resulting from it. The US has a fairly unique problem, though, in that it has an incredibly dense surface station network that has been entirely run by volunteers. The bottom line is that the issues Watts’ new survey outlines are very well understood by scientists already and the literature describes the efforts implemented to deal with them. Watts’ new study does not address how adequate those measures are, it’s just dismissing them en masse with little justification.
AlanJ,
Your are correct, and I was wrong in my posting regarding GISS being involved only with satellite temperature measurements.
I should have stated they are involved predominately with satellite temperature measurements:
“A key objective of Goddard Institute for Space Studies research is prediction of climate change in the 21st century. The research combines paleogeological record, analysis of comprehensive global datasets (derived mainly from spacecraft observations), with global models of atmospheric, land surface, and oceanic processes.”
— https://en.wikipedia.org/wiki/Goddard_Institute_for_Space_Studies
That being said, I am curious about this statement in your above post:
“Urbanization is indeed a worldwide phenomenon, and adjustments have been developed to handle trend inhomogeneities resulting from it.”
Can you cite a reference or provide a link that gives the details on such “adjustments” . . . I would greatly like to read about such.
Thanks.
See Menne, et al., 2009 “Homogenization of Temperature Series via Pairwise Comparisons.”
AlanJ,
The reference to Menne and Williams [2009] that you alluded to (downloadable pdf available at https://www.ncei.noaa.gov/pub/data/ushcn/v2/monthly/menne-williams2009.pdf ) is fundamentally flawed in its methodology.
The basic flaw is seen in this statement of their “homogenization” approach given in Section 3(a) of their paper:
“The pairwise algorithm starts by finding the 100 nearest
neighbors for each temperature station within a network
of stations.”
Their proposed approach would only work if most of the temperature measuring stations under consideration were fairly sited with respect to the range of the primary variable in question: in this case, possible UHI effect.
However, as the above article clearly points out, approximately 96% of the temperature monitoring stations being evaluated are incorrectly sited, leading to average temperature reporting on the high side for the overwhelming number of stations.
Thus, all the “homogenization” corrections offered by the Meene and Williams approach serve to do is to incorrectly adjust the “outliers”, in this case the fairly sited temperature reporting stations upward in temperature based on the preponderance of their 100 nearest neighboring station having existing UHI bias.
It is laughable to suggest that NOAA has developed such automated adjustments as those offered by Menne and Williams to “handle trend inhomogeneities” resulting from the UHI effect.
The PHA produces almost the same number of downward trend adjustments as upward trend adjustments for the CONUS:
“The PHA produces almost the same number of downward trend adjustments as upward trend adjustments for the CONUS”
Yeah, but I never asserted or implied that some of the UHI-affected stations would not themselves be biased artificially high compared to other 96% of all stations that are incorrectly sited.
The graphical data that you present only goes to show that the “adjustment” for inhomogeneities in the data sets amounts to little more than driving peaks and lows toward the average. That is a mathematically construct . . . not something rooted in reality.
There have been multiple studies that already show that UHI corrections are inadequate. This is easy to see as the trend from properly sited stations (and the satellite land trend) is substantially lower than the “corrected” GISS trend.
Watts’ study showed this. I suspect that you missed this clear and obvious point because you didn’t want to see it.
On your other point, just note that Dressler has a habit of making stuff up and never acknowledges his error – even if he was caught red handed.
UHI is not an error that needs to be corrected – it is a real phenomen that has real impacts on the surface temperature. UHI is fundamentally an oversampling challenge. The language being thrown around on this website is quite inaccurate.
There is also a difference between an “improperly sited” station and a station that is merely located in an urban area. Watts’ analysis makes no distinction as far as I can tell. The graphic shown in the main post is primarily showing a difference between stations situated in urban areas and stations situated in rural areas rather than a difference between badly sited stations and well-sited stations. We don’t want to remove the stations in urban areas from the record, we just want to ensure that they aren’t being oversampled.
You are deflecting. The purpose of the temperature databases as being used is to show what effects CO2 has. That is a totally different subject than UHI being included. If you want to accurately assess the effects of CO2, then you MUST remove the UHI because UHI has a different cause than rising CO2.
That is completely and utterly incorrect. The purpose of the surface temperature analyses is to understand how the surface temperature is changing over time. Figuring out what has caused the observed changes is an independent endeavor to measuring what the observed changes are.
Alan J,
The number of stations in urban or rural places has to be in proportion to the areas of urban and rural in the nation or on the globe. Geoff S
Points cannot be proportional to polygons.
Did I propose that they were?
Geoff S
You said they had to be.
Alan J,
And I wrote ‘polygons’ precisely where?
Geoff S
Stations: points
Areas: polygons
Nice evasion there. Have you been taking lessons from Nick?
If the ratio of points or polygons that are located in urban areas is not proportional to the number of points or polygons that are not in urban areas, they you are not accurately measuring what is happening to the planets temperature.
You got that completely wrong AlanJ.
The debate about global warming is about the warming potential of CO2 .
The urban heat Island UHI is not at all connected to CO2.
Any one should know that and if you had any knowledge you would know that walking bare foot over grass is ok but step onto tar seal and you can burn the skin off your feet .Conversely step onto a white painted line on the seal and it is not at all hot .
The news screams about high temperature in the cities but this has nothing to do with CO2 warming the world .
There is far to much dishonest fudging of temperature recording to push this climate warming scare .
Why, then, are we constantly scolded that the warming shown in the record is the result of our use of fossil fuels and the CO2 output thereby?
“Figuring out what has caused the observed changes” has fallen into the category “the science is settled!”
The purpose of the temperature databases as being used is to show what effects CO2 has.
_________________________________________
BINGO!
Human activity has more effect on the temperature than just CO2 emissions, but it’s all attributed to just CO2, CH4 and most recently N2O. Dams, deforestation, irrigation, aircraft contrails, and of course urban heat effect are ignored. Natural cycles are also ignored if not intentionally erased from the record. It’s all about the so-called greenhouse gases.
Alan, your “UHI is not an error that needs to be corrected – it is a real phenomen [sic] that has real impacts on the surface temperature.” misses the point. In CliSciFi UHI is used to support the “CO2 is what dunnit” narrative. Quit drinking the Kool-Aid.
So, you don’t want to oversample urban stations? Pick any ONE to include.
That is not what is mean by oversampling. I’ve made a silly cartoon showing three station, two of which are rural (B and C) and one of which is urban (A):
The urban station will have a higher trend than the rural stations. However, we need each station to represent not just the exact point location where the station sits, but the entire field around it (represented by overlapping circles). If we left the trend at station A untouched, we would implicitly be assuming that everything within the circle around it is an urban area with a high trend. We know that isn’t true, though, because somewhere within the circle the city peters out into the rural area which has a lower trend. Thus we’d be oversampling the trend in the urban area.
But you can imagine that if instead the urban station was simply surrounded by two more urban stations than we would be right to consider its entire circle as urban. So we need all the urban stations, we just need to ensure that we’re not overrepresenting how much of the region is urbanized.
Homogenization algorithms use the trends of nearby stations to determine if the trend at the target station is significantly different than its neighbors (i.e. is the target an urban surrounded by rurals or is it urban surrounded by urban or maybe even rural surrounded by urban), and adjust it to some “midway” trend if it is.
This is an oversimplification in many ways but hopefully gets the general idea across.
AlanJ
Mate, you’re wasting your time. This so-called ‘study’ is just grist to the mill. It’s not peer-reviewed; it’s published by the Heartland Institute. It will never even be submitted to a proper journal for the reasons you’ve mentioned.
It’s another little bone for the ‘skeptics’ to chew on, bless them.
TFN stated “It’s not peer-reviewed . . .”
Since when does “peer-review” mean anything?
Peer review is often a prerequisite for publication, not the underlying science. And even having a scientific article or paper “peer-reviewed” prior to publication actually doesn’t establish the scientific rigor that many people believe it does. For example, see:
http://www.washingtonpost.com/news/morning-mix/wp/2015/08/18/outbreak-of-fake-peer-reviews-widens-as-major-publisher-retracts-64-scientific-papers/
and
http://www.washingtonpost.com/news/speaking-of-science/wp/2014/12/08/two-scientific-journals-accepted-a-study-by-maggie-simpson-and-edna-krabappel/
Even more shocking from a historical perspective is that many, if not most, scientific papers don’t even get subjected to peer-review, but nevertheless can present extremely valuable research.
See this following link for the evidence that ONLY ONE of Albert Einstein’s more-than-300 published scientific journal articles was ever subject to peer-review:
http://michaelnielsen.org/blog/three-myths-about-scientific-peer-review/
ROTFLMAO.
He has arrived
He certainly has – you can tell by his skidmarks!
Is there some reason the material here can’t be reviewed by one’s peers? No, there’s not
I’ve stated before that the level of peer review offered here is orders of magnitude better than that done in any of the so called “science” journals.
“I’ve stated before that the level of peer review offered here is orders of magnitude better than that done in any of the so called “science” journals”
But… just because you state something doesn’t make it true. If you think the level of rigour is higher here than during peer review, then that explains a lot.
Lol…coming from one is still looking for colluuuusion. Good one moron.
Alt.peer reviewers from the folks pimping alt.electors….
Word salad Bob is in the house….seems like all the trolls know one another 🤔
bigoilbrandon: Ya got me- what’s the alt. signify? Does it mean we commenters here are all on the same page somehow? But we have alternative voices here, like yours, to protect us from the worst. Right?
Being true makes it true.
You really don’t know how peer review in so called science journals works, do you.
Then again, you don’t know how science works.
“But… just because you state something doesn’t make it true.”
Just because Democrats, or you, state something derogatory about Trump doesn’t make it true. See how that works? Of course, you do. You just explained it.
TFN,
Here in Australia, a group of about a dozen of us free volunteers have done an enormous amount of study of the Australian temperature data curated by the BOM.
We have found numerous matters that need improvement.
However, the BOM has declined discussion, often saying that they cannot look at anything less than a published, peer-reviewed paper in a noted journal.
Australia has about 1,200 stations, some starting before 1870. Our land area is similar to the USA48. We have had a flat UAH lower trop trend for the last 10 years. We can sympathise with USA data, methods, problems.
Both countries have problems of such magnitude that the data are near useless. Worse than useless, for they are misleading.
There seems to be a determination by the relevant curators to stonewall improvements and to feel smug about the known deficiencies.
Wrong assertions about official warming rates feed back to policies and we are paying out huge sums of money under the global warming dogma. It is wrong, but easy to make a lot better.
So, Anthony and Heartland, thank you and keep up the observation.
Geoff S
“However, the BOM has declined discussion, often saying that they cannot look at anything less than a published, peer-reviewed paper in a noted journal.”
Between you and your cohort, that should be easy to provide.
“There seems to be a determination by the relevant curators to stonewall improvements and to feel smug about the known deficiencies.”
This would be best exhibited by you all writing a paper, subjecting it to peer review, and then posting the unedited, personally attributed (by both you and the reviewer(s), back and forth, here.
bigoilbob,
While I admire your chivalry to the Cause, you might benefit from knowing why we do not write peer-reviewed papers very often
Now, is the penny starting to drop? Can you see that the BIG problem is a reluctance of some researchers to contemplate another view? A pseudo-intellectual arrogance, like the olden days of taking snuff while the masses sought scarce food?
Geoff S
“Previous attempts at joint authorship with BOM have been rebuffed.
So? I am proposing authorship by you and your cohort.
“The reviewers proposed by a publisher have been almost always dominated by the various authors whose work is being criticised.”
A very good reason to do so. The public back and forth would only reflect well on you and your superior arguments. Right?
“My position is that a scientific publication should be infrequent and that it should represent a significant advance in scientific knowledge.”
The “numerous matters that need improvement”, along with a data based evaluation of how those improvements would change things is certainly much more than a “significant advance”. And since you’ve already done the work, you just need to write it up cogently. Right?
2 reasons why this process would be valuable.
Too good of an opportunity to pass up. Unless you are having 2nd thoughts about how to justify – above ground in the sunlight – those proposed “improvements”.
Hahaha…you are cracking me up BigOil
bigoilbob,
You must be new to this.
““The reviewers proposed by a publisher have been almost always dominated by the various authors whose work is being criticised.”
A very good reason to do so. The public back and forth would only reflect well on you and your superior arguments. Right?”
……………………….
What happens in reality tis that submitted papers are held up in review for years or simply dismissed. Not one member of the group has got past this barrier.
Geoff S
You’re missing the point. The name of the game would be to shine a light on this. The canned responses. The non responses. Your erudite replies. All published in entirety, along with a timeline. Has this been done before – unedited?
Gosh, it’s almost as if there are elements to such a back and forth that you don’t welcome. Naaaaah!
bigoilbrandon: No, he makes the point you refuse to get- the game has been rigged, sorta like rigging an election. The “light shiners” have been rigging the game so no light ever shines on submissions that question the narrative. Your suggestion is hopelessly naive, and you know it. Your connection to the energy sector, whatever it may have been in the past, is now limited to gaslighting.
Ah, the worldwide Dr. Evil “rigging” conspiracy. Please tell me how they can “rig” the review of a paper submitted for peer review, with all of the following technical back and forth publicized, in full. And if the submission was ignored, that would be publicized as well. The technical fallacies of this world wide sinister cabal, getting rich as Roosevelt from grants, would be exposed for all to see, in their sphere. It’s a golden opportunity to do more than just whine about totally undocumented peer review “rigging.”
Folks, why in the world would the paul courtney’s of the world object? Yes, rhetorical….
bigoilbob,
We have ready for publicity, an analysis of this problem to be heard in Australia if you question climate change dogma. Names, actual examples, a terrible story of corruption of long-held useful scientific principles. Geoff S
bigoilbob and rigging conspiracy.
How cooperative is the Australian BOM, as opposed to the ideal of a non-political group offering neutral, solid, good advice?
CXlimategate: Emails from 2007. How much was neutral> How much was correct?
0601.txt cc: “Shoni Dawkins” ??@bom.gov.au> date: Fri, 7 Sep 2007 08:28:03 +100 ??? from: “David Jones” ??@bom.gov.au> subject: RE: African stations used in HadCRU global data set to: “Phil Jones” ??@uea.ac.uk> Thanks Phil for the input and paper. I will get back to you with comments next week. Fortunately in Australia our sceptics are rather scientifically incompetent. It is also easier for us in that we have a policy of providing any complainer with every single station observation when they question our data (this usually snows them) and the Australian data is in pretty good order anyway. Truth be know, climate change here is now running so rampant that we don’t need meteorological data to see it. Almost everyone of our cities is on the verge of running out of water and our largest irrigation system (the Murray Darling Basin is on the verge of collapse – across NSW farmer have received a 0% allocation of water for the coming summer and in Victoria they currently have 5% allocations – numbers that will just about see the death of our fruit, citrus, vine and dairy industries if we don’t get good spring rain). The odd things is that even when we see average rainfall our runoffs are far below average, which seems to be a direct result of warmer temperatures. Recent polls show that Australians now rate climate change as a greater threat than world terrorism. Regards, David
Ah, the totally undocumented world wide Dr. Evil “rigging” conspiracy theory raises it’s ugly head once again.
So, why not submit a paper, and then publicize the back and forth with the grant rich peer reviewers, with no censorship, to highlight this “rigging”? If you are correct, your erudite technical arguments will prevail easily. And even if you don’t get a response, then publicizing that is just as effective.
Yes, rhetorical folks. We know why…..
bigoilbrandon: Why reply to an oaf commenter who needs two comments to express a (half) thought? You’re recent comments demonstrate that you have not been paying attention. Your suggestion (to which nobody objects) to submit a paper has been done, many times. The fact that you are ignorant of this is no surprise, as you insist on displaying your ignorance here.
“Your suggestion (to which nobody objects)….
Mr, Sherrington, the subject of my request, inexplicably does.
to submit a paper has been done, many times.”
With a published, unexpurgated back and forth between the authors and the peer reviewers? Please link.
bigoilbrandon: Don’t see the word “objects” in Mr. Sherrington’s post, he didn’t “object”, he explained. Since your second comment is a fine example of moving a goalpost, no response to oafish comment needed. I would give you a sausage link, if you were starving.
“Don’t see the word “objects” in Mr. Sherrington’s post, he didn’t “object”, he explained.”
Read for comprehension. Excuse after excuse to avoid doing so. And his “explanations” are all self serving BS. It’s almost like watching Pat Toomey justify screwing over US veterans.
BTW, an link yet to an uncensored public back and forth between any of the AGW disrupters and their peer reviewers? Seems pretty easy, considering the “many times” you claim…
bigoilbrandon: Pat Toomey and veterans??!! You do know what “gaslight” means!
My reading comprehension is pretty good, I comprehend that you’ve been reading at this site long enough to see first hand accounts of what Mr. Sherrington posted, by several commenters here who have experienced it first hand. You only show your extended ignorance by continuing to pretend it isn’t true. Nobody is listening.
“I comprehend that you’ve been reading at this site long enough to see first hand accounts of what Mr. Sherrington posted, by several commenters here who have experienced it first hand.”
No, I have been indicating over several comments that I have not seen this back and forth, unedited, “firsthand”.
But yet, for some mysterious reason, not even one example of such an unedited back and forth from you. Instead, you and Mr. Sherrington are going with the predictable, “Just trust me” faith based approach. Certainly good enough for the slipper clicking “I want to believe” WUWT’ers. But I’ll stick with the good sense of Chris Hitchens:
“That which can be asserted without evidence, can be dismissed without evidence.”
Which is precisely why you are so easily dismissed.
bigoilbob,
Is your memory so short that you have forgotten the start of this nonsense of official censorship> As described verbatim in Climategate?
Remember this?
file:///C:/Users/Geoff/AppData/Local/Temp/msohtmlclip1/01/clip_image002.gif
From: “Thomas.R.Karl” <Thomas.R.Karl@noaa.gov>
To: Phil Jones <p.jones@uea.ac.uk>
Subject: Re: FW: retraction request
Date: Tue, 19 Jun 2007 08:21:57 -0400
Cc: Wei-Chyung Wang <wang@climate.cestm.albany.edu>
Wei-Chyung and Tom,
The Climate Audit web site has a new thread on the Jones et al. (1990)
paper, with lots of quotes from Keenan. So they may not be going to
submit something to Albany. Well may be?!?
Just agreed to review a paper by Ren et al. for JGR. This refers
to a paper on urbanization effects in China, which may be in press
in J. Climate. I say ‘may be’ as Ren isn’t that clear about this in
the text, references and responses to earlier reviews. Have requested
JGR get a copy a copy of this in order to do the review.
In the meantime attaching this paper by Ren et al. on urbanization
at two sites in China.
Nothing much else to say except:
1. Think I’ve managed to persuade UEA to ignore all further FOIA
requests if the people have anything to do with Climate Audit.
2. Had an email from David Jones of BMRC, Melbourne. He said
they are ignoring anybody who has dealings with CA, as there are
threads on it about Australian sites.
Mr. Sherrington: NOtice how our resident expert on all things oil has reduced himself to a troll, the type who demands something and then tries to claim he’s right because you didn’t produce “peer-reviewed” things that don’t exist. A very common sort of troll, no longer any challenge at all.
He’s wasting his time because he doesn’t understand the meaning of words. The temperature stations have been set-up to monitor the climate not the heat affect of cities. That can be done from data collected from newspapers, radio stations and airports not climate network weather stations.
He didn’t even get the table of contents in the right order. That’s the level we’re at here.
temperature data instruments must be “over level terrain (earth or sod) typical of the area around the station and at least 100 feet from any extensive concrete or paved surface.” And that “all attempts will be made to avoid areas where rough terrain or air drainage are proven to result in non-representative temperature data.”
Having to be at least 100 feet from any extensive concrete or paved surface, and free from air drainage from concrete etc, rules out any urban station.
Infilling is invalid in most cases.
If you assume the temperature profile at any location is a sine wave then the correlation between stationA, sin(A) and stationB, (sin A + ⱷ) is cos(ⱷ)
ⱷ is a function of many variables,
ⱷ(vector distance, elevation, humidity, pressure (including weather fronts), terrain, geography)
Each of these will affect the correlation of the temperature between StationA and StationB. Trying to infill StationB with StationA temperatures is a lost cause unless each of these factors are properly evaluated and accounted for.
How many of the temp data sets actually do this?
Note: It isn’t any different for trends than it is for absolute temperature values. The temperature trend on the north side of a river valley can be far different than the temperature trend on the south side of a river valley.
But the location of each reporting station is known as urban, suburban or rural. Why do we need an algorithm to make any neceesary corrections to avoid oversampling? We know which stations are valid for how much area.
AlanJ,
You are quite wrong with your assumption.
Nobody knows how the temperature as routinely measured by a thermometry device inside a screen can be related to surrounding temperatures.
If the device records 25C, where around it is also 25C? Is it good for 100 metres away, 1 km, or 1200 km like the optimists claim from correlations?
Anthony Watts showed a critical point in this argument years ago. He noted that the type and condition of the paint or whitewash on the scree exterior could change the temperature. So, if for some mental reason you are happy that your device is good for a km away, just keep the paint finish exactly the same.
This is not metrology, this is not meteorology, this is not science.
This is rule of thumb judgement applied on a grand scale of deceit, with the result that trillions of dollars are now at risk of waste from the shakey idea of global warming.
Wake up and smell the roses, mate.
Geoff S
I look at this image and ask myself how do the mathematicians/statisticians justify manipulating averages without also manipulating the associated variances. A mean, even of anomalies, tells you nothing without knowing the variance of the data that was used to calculate it from the beginning to the end. The procedures do exist for doing this. Combining different random variables has been done for years and there are detailed calculations for doing this. Why doesn’t every graph of anomalies also have the variance or standard deviation shown? How can you know that a regression line has any meaning if you don’t know the error bars (statistical error AND measurement uncertainty) associated with each piece of data?
If it’s in an urban area, it is incorrectly sited.
UHI does impact the temperature of the local area, however it has no impact on actual global temperatures.
Lol it absolutely does have an impact on the global surface temperature. Urban areas are warmer than non-urban areas.
Then the problem is the urban environment and not CO2!
Urban areas are a tiny fraction of the world’s surface area, yet are the majority of all sensor stations.
MarkW,
Yes, but the concern is that UHI affects the CALCULATED global or regional temperature and so heightens the scare. Geoff S
Alan, Since the U.S. has been increasingly urbanized over the past 100 plus years, the urban heat island effect causes a steeper temperature trend. That steeper trend is then used to predict a warmer future. The U.S. Climate Reference Network shows no warming for 11 years.
Urbanization contributes only modestly to surface temperature trends, but you are absolutely right that it is a contributing factor to global warming. Scientists don’t merely extrapolate future climate projections from historic records, they project future climate based on forcing scenarios. Those scenarios certainly include land-use changes.
“Modestly”?!?!?!? Are you for real? Griff have any kids or other relatives?
AlanJ,
What part of this article do you not understand? Geoff S
https://wattsupwiththat.com/2018/12/20/the-science-of-the-urban-heat-island-effect-is-pathetic-and-misleading/
Alan,
Long term temperature trends are often put forth as evidence of the claim that human CO2 emissions are causing global warming. The hockey stick graphs are good examples of that. To suggest they are not is highly misleading. You defend the records as being fit for that purpose, then you claim they are not used for that purpose.
What evidence is that claim based on? The 140 year surface temperature records show about 1.5 °C of warming. It’s well documented that UHI can make cities warmer by 3 °C or more.
It’s also not just urbanization. There are many non-urban sites with thermometers located near air conditioner exhausts, carparks, airports, etc. In 1880, when many of the records begin, there were no carparks, no air conditioners, and no airports.
Thomas,
While the US is not the globe, since the US average temps have actually been cooling then some other place on the globe must have been warming enough to override the US values in the global average to cause the increase in the global average. For instance, if the slope of the US temp is -1 then someplace must have a slope of 2 in order to get an average slope of 1.
No one ever pinpoints where that offsetting warming exists. No one ever explains how the US can be cooling while the rest of the globe is warming since CO2 is supposedly well mixed.
Kind of makes you wonder…..
Yes, UHI is real. The issue is one of over-representing the UHI by a sampling bias. That is, the warming is given too much weight because of the large number of stations in and around cities. The situation is further exacerbated by urban stations that are not sited properly, according to the official guidelines.
The claim is that UHI is being oversampled in the surface record, but that claim has not been proven. Nor has it been shown that improper siting is significantly biasing the record since homogenization algorithms explicitly address such biases. Watts’ latest survey merely re-highlights issues that are well known, it does nothing to refute the measures already in place to address those issues.
Has 100% been proven. There has been many discussions which show that since the 1970s the proportion of rural vs urban stations which used to be in the majority has flipped.
Previously we had 70 or 80% urban sites where as now we have a large majority of urban sites.
You also keep going on about measures to adress these issue.
I assume you mean adjustments for UHI.
When looking at the data and adjustments the opposite appears to have occured. Past temps were lowered instead of untouched, and recent temps were increased instead of lowered to account for UHI.
That is the thumb on the scale.
“UHI is not an error that needs to be corrected – it is a real phenomen [sic] that has real impacts on the surface temperature.”
If one wants to say UHI is real to the extent that it significantly impacts global warming trends or, heaven forbid, climate change™, then it will necessary diminish the claimed warming effect from increasing atmospheric CO2.
UHI results primarily from (1) the increased solar absorption associated with use of concrete, asphalt, buildings, etc. in urban areas compared to rural areas or open water areas, and (2) the concentration of waste heat in urban areas compared to rural areas or open water areas. The first of these is only tangentially relatable to use of fossil fuels, and the second only indirectly so.
Please tell me to what extent the supercomputer GCM models used by the IPCC to predict future global warming have factored in UHI effect if it is has the “real impact” that you assert.
Not true, the claimed warming effect from CO2 is derived from the physics, not from examining surface temperature datasets. Urbanization certainly contributes some fraction of the observed temperature increase (though it appears to be a fairly minor component).
So why not leave out urban area temps readings altogether, and just measure what’s happening with the earth’s surfaces in unadulterated areas?
Urban readings are so flakey – when the Australian BoM moved its Melbourne city-central station to a city park a few years ago, the difference in readings between the 2 locations just 1 km apart was -2C at the same time on the same afternoon.
Are you genuinely asking why we shouldn’t pretend like parts of the earth’s surface don’t exist?
Last week in the UK the Met office and all weather reporting services were pretending that the entire Sahara desert does not exist, not one of them said it was the source of the hot air. Guess what they did claim as the cause..
Shouldn’t pretend, or should pretend?
Whatever you meant, my answer is –
yes, I think if we know that readings are adulterated / contaminated by unnatural influences, we should omit them altogether from comparative timeframe analyses.
Sure, keep track of urban temps for use in local weather forecasting etc, but what use in analyses are readings from say airport stations situated for pilots’ guidance?
That is certainly a choice that you can make, and hopefully you understand the caveat that all of the missing regions of the world now take on the value of the mean of the retained regions in your analysis, and you carefully document the impacts of this choice and explain them to anyone using your analysis. You’ll also need to explain exactly how you identified all non-climate effects in all station records.
Another choice you can make is to remove the non-climate influences from all of the station records and use them all for your analysis. After all you had to identify them to begin with.
A station at an airport will simply have a higher mean temperature than surrounding stations – this will not be a feature you need to contend with provided you are using the anomaly. Any non-climate effects at the station would result from things like station moves, instrument changes, observation behavior changes (e.g. time of day readings are captured), or land-use changes surrounding the airport. All of which scientists have well developed, well tested methods for adjusting for.
Now you’re getting to the nub of the issue –
ADJUSTMENTS.
If you’re tempted to apply “adjustments” to recorded measurements, you’re either putting your thumb on the scale to increase the reading, or blowing off some of the product to make it read lower.
So yes, just set aside all readings you’re not confident to use “as is”.
(Keeping measured temps records would then require so much less work and cost $$$s for taxpayers too.
What’s not to like?)
You don’t have to apply any adjustments, you just need to understand the implications of not doing so, and you need to understand how it might impact any conclusions you draw from the data. Not making adjustments is a choice, and it is one with implications.
For instance, we know for a fact that in the US:
Not making any explicit adjustments for these factors is making a choice about the data, and it’s fine if you don’t do it, but you need to understand exactly what impacts all those factors listed are having, and you had best make damn sure than anyone using your dataset assuming that it shows them climatic trends is well aware of those factors and their impacts.
There are hundreds if not thousands of unique climates around the world.
Each one has its own idiosyncrasies.
If you’re interested in what has/is happening with a particular climate, you only have to use the records that pertain to that one.
For example, the Puget Sound area of the Pacific North West.
If we want to know what is happening to the planet as a whole we have to combine many records from many locations.
Weighing more records than others and adjusting them too 😉
If we want to know how much of it is CO2 we have to eliminate any records from locations which have potentially overwhelming causations such as UHI. How hard is that to understand?
It’s not hard to understand. It *is* hard to admit for climate alarmists.
“If we want to know what is happening to the planet as a whole we have to combine many records from many locations.“
We don’t want to know what is happening to the planet as a whole. There are two simple reasons: 1) nobody cares. 2) The Washington Post can’t use it as propaganda during La Nina. Instead they print stories about hot weather in specific locations, caused mainly by La Nina.
The way to handle this is to START NEW RECORDS!
Almost all of the adjustments are made to create artificial long-term records. That’s actually makes the data fraudulent.
When you measure different things (i.e. different sites) using different devices you should *NOT* make them match by adjusting one of the measurements.
I’ll look forward to you launching your new Time Machine so that we can travel back to the turn of the century and install new pristine surface stations.
Adjustments are optional, you just have to acknowledge and discuss the implications of using or not using them.
Where is *YOUR* time machine that you think you can make adjustments to past records?
Every field station loses calibration at a different rate. Thus the actual readings over time also vary in different amounts. If you replace one measurement device with another how do you come up with a time rate of change in calibration for the older device? Even if you run them in parallel you are only checking the *current* calibration of the older station, not its past calibration.
So how can you adjust the past readings from the older station unless you have a time machine and can go back and check the calibration over time?
The answer is that you do *NOT* adjust older readings at all. You just start a new record for a new station. If that results in losing “long” records then so be it. At least you don’t create a fraudulent record.
The professional trendologists will never understand this.
“Adjustments” are fraudulent, period.
Of course, in the real metrology world, this is exactly what is done.
If the data is not fit for purpose, you either toss the records or DERATE THE CLAIMED ACCURACY of the measurements.
Adjusting the data after the fact is a crime in the engineering world. It is no different than witness tampering in the legal world. The data is the witness.
Omg the complexity of creating a global temp is outstanding. I am sure we will need more funding and committees for rules and definitions 😉
That will meet quarterly in far-away, exotic places in the best hotels, with really great restaurant for the meals.
Don’t forget the hookers and blow.
“A station at an airport will simply have a higher mean temperature than surrounding stations – this will not be a feature you need to contend with provided you are using the anomaly.”
What surrounding stations?
Since the anomalies being used are primarily mid-range temps found from maximum temp and minimum temp, UHI affects *will* bias the anomalies as well as the absolute temps.
AlamJ,
When the Berkeley Earth project kicked off, I was involved in information and data exchange with Steve Mosher, who was doing some of the central work.
The concepts that you are raising, as if they were novel, are old and hoary and thoroughly investigated as to what can practically be done about them.
Where were you when the game started?
Geoff S
Mr.
It is almost like people are arguing it is OK to put a screen next to an outdoor barbecue because that is a natural part of what people do. Crazy. Geoff S
Technically CO2 is well mixed and constant over the globe. Only using non-UHI affected stations will allow the isolation of a temperature trend due to CO2. If you include UHI effects then both land use changes and CO2 will be used to predict only CO2 changes.
That is pretty much what is happening as we write. Why do you think Anthony wants to see how many stations are buggered up?
Of course the urban heat island (UHI) effect raises the spatially averaged global temperature. Whether it’s a significant amount is a different matter. But certainly, the extra heat in urban areas comes from the sun, due to land use changes. It’s not as if some heat is pulled from a rural area to warm the urban area so that it all averages out. Without the changes that cause less heat from the sun to be reflected and/or less water to be transpired, the urban areas would be just as cool as the rural areas. Restoring the urban areas to the wilds would not warm the existing rural areas. I can’t imagine that too many people miss that fact.
What you apparently miss or wish to obfuscate is that warming due to land use changes is totally irrelevant to the question of whether we need to destroy Western economies by eliminating fossil fuel burning. First of all, it’s far from established that a mild increase in temperature is anything but beneficial. And then you’re unable to separate how much of the beneficial warming is thanks to CO2 from how much is the UHI effect.
Don’t forget that UHI can impact rural stations that are downwind of the urban area! So UHI *can* affect rural stations that are miles away by warming the air that they see.
Mr,
Part of the answer is that the more remote the weather station was, the poorer the data. Big gaps of missing data, sometimes months at a time when the observer took holidays or went on a bender.
Another part is that the trends over time are so tiny that they are in or close to the noise envelope, so data quality really matters.
To make it even worse, there are practically zero public cases where uncertainty and instrumental errors were quantified, as by formal experiments with duplicate or triplicate systems working in parallel for a number of years. Some elementary concepts of metrology like this were largely ignored from the start and so cannot now contribute to advancement of knowledge. Many of the few such studies in Australia were in city locations anyhow. Geoff S
“Not true, the claimed warming effect from CO2 is derived from the physics, not from examining surface temperature datasets”
I can not think of a more appropriate rebuttal than to cite Richard Feynman:
“It doesn’t matter how beautiful your theory is, it doesn’t matter how smart you are. If it doesn’t agree with experiment, if it doesn’t agree with observation, it’s wrong. That’s all there is to it.”
I like Ron White too. There is not a pill you can take. There’s not a class you can go to. Stupid is forever.
Oh brother, you have sucked in the bait+hook+sinker+line.
AlanJ,
If warming rates are derived from physics, why are estimates from one model so different to another and why are they almost all so different to observation?
Physics is built upon much better agreement between investigators than we see here.
Geoff S
Which also predicts a tropical tropospheric hot spot that has not and cannot be found using independent satellite and radiosonde measurements.
HAVING urbanized temperature stations is not the problem. USING such stations to measure changes to the Earth’s CLIMATE is the problem, since the historical instrument temperature record in its entirety was not taken under those conditions.
Even IF you think sparsely and inconsistently sited temperature stations are fit for the purpose of measuring changes to the fictitious “globally averaged surface temperature” (they aren’t), at the very least you would need the same number of the same instruments in the same locations, which locations cannot have changed over time in any manner that would affect the temperature readings, in order to achieve something resembling a “scientific” measurement.
The “instrument temperature record” is unfit for the purpose of measuring “climate change” in terms of temperature, and UHI effects are one big reason for that. Measuring increasing UHI effects tells you ABSOLUTELY NOTHING about CLIMATE.
Except we don’t have a pristine network of surface stations whose locations have never changed through time, and we don’t have a time machine to get back and set one up. We have to make use of the data we have, and that data includes spurious trends arising from non-climatic effects like stations moves and TOBs. Certainly the surface station network is not ideal for measuring changes in the climate through time, but it is absolutely fit for this purpose when a careful and thorough analysis is performed.
We can see, for instance, that ClimDiv is perfectly consistent with the USCRN (that pristine well sited station network we can only dream of for historical years):
This suggests the adjustments are doing a good job of handling non-climate biases in the data.
It also means creating new information for stations that “have a break” real or imagined. Instead of stopping the data record and beginning a new one, just fudge the data with new information so you can artificially make a LONG RECORD. Long records are preferred because they are much less likely to cause spurious trends. Most other scientific endeavors just mark the data as no longer fit for purpose and move on. Not climate science. Data is fluid, just like gender!
Data is fluid, just like gender!
_______________________
Ha ha ha ha ha! First chuckle of the day (-:
“We have to make use of the data we have,”
The data we have has been adjusted using GUESSES. *WHY* do we have to use it?
You don’t have to use the adjusted data, you can construct a surface temperature estimate using the raw station records if you please (many people have already done this, including myself), you’re just stuck using the data we have. No going back in time machines to make it better.
Was Mann a fraud?
Was Mann a fraud?
____________________
Using the raw data is not much better if it includes UHI impacts. Especially prior to 1950 much of the data was obtained from field measurement devices that were poorly maintained. Not only that but the data was recorded to the nearest integer temperature leading to at least a +/- 0.5C uncertainty and probably more like +/- 1C. This is very true for mechanical min/max thermometers which have only a +/- 2C uncertainty TODAY!
This uncertainty simply dwarfs the ability to accurately identify temperature trends out to the hundredths digit.
To make it even worse databases like Berkeley Earth note the uncertainty of past data with what they think the resolution of the thermometer would have been. Resolution contributes to uncertainty but it is *not* the entire uncertainty associated with a measurement device.
Trending and averaging simply can’t overcome the uncertainty in the past data. It is simply unfit to calculate long term trends in even the tenths digit.
We don’t have to use the temperature record at all. Sea level is probably a more accurate proxy for global temperature. It has been rising at a steady rate since the late 1800s, suggesting that human CO2 emissions are not the cause of the warming.
Steve Mosher told me BEST doesn’t calculate a global anomaly, they predict one.
They also print however many significant digits their customer wants, since it’s not a calculation, but a prediction.
Adjusted to fit expectations 😉
No it doesn’t. It suggest that, since 2005, ClimDiv is being adjusted to agree with USCRN. You would need to show that there was no change in the way adjustments were made after 2005 before you can state that agreement is evidence that adjustments are valid.
If you look carefully at that graph, the climdiv values swing from + 12% to -12% of the USCRN values.
Do you consider that a good match?
CO2 is a well-mixed gas. It has the same effect across the planet. Since only a few percent of the Earth’s surface is urban, UHI has very little effect on the global average. Unfortunately, it has a great effect on the GISS trend. If what you mean by “oversampling” is that there are far, far too many stations in urban environments, then I agree.
That’s EXACTLY what Anthony Watts proved.
Properly sited stations have to be situated on grass 100ft/30m away from anything else that would affect the readings – even if situated in an urban park the buildings and asphalt surrounding it would still affect the readings. Essentially the urban station would be measuring UHI not climate.
The stations can’t be in an urban area, regardless of distance from building or road. It’s not like a station in a rural area 101ft from a single garage or barn, that is itself surrounded by grass and open area.
I did an article on UHI for WUWT a year or so back. Search the red bar atop the WUWT page for ‘Sherrington UHI.’
Lots of references to how it works.
[Sorry, away from my PC and links just now). Geoff S
You missed the /sarc tag.
Most of US high temps occurred before global warming.
Well basically –
NASA Goddard Institute For Space Studies
What is the basis for cooling the 1940s temperatures by 1/3rd of a degree? Did they find some old thermometers in a war surplus warehouse and calibrate them?
Mr. Spencer: Quite a ways up, Mr. J. tried an old stokesism, “adjustments since the ’70s….” After that I viewed all his comments with a gimlet eye.
I see a claim of a 140 yr old (10 yr) common baseline for … something … (average world temp?)
I see a claim of ‘raw data’ for something … (average world temp?) reaching back over 140 years.
I see NASA data that was ‘corrected’ in the 40’s through the 60’s by 4 times as much as the correction in the 2010’s.
Help me out here … what else am I supposed to see?
It’s almost as if the bad siting was intentional.
They wouldn’t do that, would they?
I wouldn’t put it past them.
I can’t speak for all, but airport situated thermometers have a different purpose and shouldn’t be include in ANY climate related temperature database.
Yep, Temperature and pressure are very important in an airport!
You can speak for me.
Indeed airport thermometers are there to monitor the parameters of interest to aviators, not climate scientists, reporters or the BBC. Two record high temperatures during the two-day heat wave (!) were both at airfields: Coningsby and Hawarden. The first is an Royal Air Force base and the second is an airport on the Welsh/English border, not used for scheduled passenger flights, and is also the site of a modern light industrial complex. If you have a few hours to waste, you can drive yourself to distraction looking for the Stephenson Screens on Google Maps: a two-foot white box viewed from directly above is not easy to spot amongst all the other white pixels, so there is an element of guesswork and inference.
A naive reader of the BBC, especially one not native to the UK, might think that the names are quaint English villages in open countryside. Indeed they are, but the locations of the Stephenson Screens most certainly are not!
I think most of it is more negligent than intentional. The change from the old Stevenson screens to MMTS sensors requires an electrical cable run from the instrument to the actual recording/reporting unit, which is usually inside a nearby building where it can connect to the network. The cable is typically buried, which is easy across an expanse of lawn, but costs $$ if it has to run under pavement or sidewalks.
It seems a fair number of sensors are located at waste treatment plants and there is seldom a compliant sensor location that can be cabled from the administration building without trenching through a paved road or sidewalk. That was precisely the situation at the Tifton, GA site I surveyed.
This of course doesn’t excuse using data from non-compliant sensors, but I don’t think the defective siting was intentional.
Gee, Alan, its a shame they haven’t invented wireless communications.
That costs extra, and you still need to provide power to the sensors and transmitters.
With the Federal government able to throw trillions of dollars around (and from personal experience with the Feds), cost is never an issue. And small solar + battery installations are common. They don’t even have to be mounted on the same structure.
Around here in Kansas there are lots of sensor locations for things like river level that use solar/battery for power. It’s not unheard of for use in government work.
Use solar panels.
With windmills as a back up 😉
Solar panels are dark and if too close to the sensor structure will cause localized warming.
Would distance be an issue?
Only if they are miles distant.
If you watch closely while driving I’ll bet you can find sensors for lots of things that actually have beam antennas in use for linking to a distant collection site. I know there are such around where I live.
I looked at several models for my farm that had sensor transmitters in the 300-500 meter range using solar panels and batteries for a power source. I just couldn’t force myself to spend $3000 dollars for the full parameter setups.
The full report notes that some MMTS stations have been converted to wireless with a solar panel to provide power. But if the solar panel is located close to the sensor, it can create a warming bias that negates a better location.
The climate network seems to be like the story of the little red hen: everyone wants to enjoy the final product but nobody is willing to put in any effort to help produce it.
Take today’s technology and add some budget and competent administration and these problems could be corrected. As you’ve noted the technology exists; don’t hold your breath waiting for the other two requirements.
It’s already been done. It is called UAH.
Look, if they solved the “problem” with good technology and management systems, they’d all be out of a job. Can’t have that in a bureaucracy!
BUT, they NEVER ran the new sites and old sites for any length of time to get a baseline to compare the new to old readings.
Not doing that invalidates the use of the data as one continuous record, IMO.
Anthony’s research also mentions the change from white washing the screens to using latex paint that can be shown to result in a higher temperature reading. Also power supplies for new recording and measuring equipment IN the enclosure below the sensors. All crazy and incompetent, and it seems ALL of these changes would lead to increased temperature measurements. But was it purposeful? I would lean toward government incompetence, but using the data without noting clearly the problems with the data, is purposeful.
Running in parallel only identifies *current* calibration issues. Since field measurement devices drift at different rates over time how do you go back and find out the calibration in the past? Adjusting past data to match current calibration just creates a fraudulent record for the past.
It’s hard to be wrong 96% of the time, unless you are working at it.
Go get them, Anthony! Your first pummeling those responsible for being either ignorant of the siting or willingly utilizing contaminated data was a good beating about the head and shoulders. Now, it looks like phase 2 is warranted, this time go for the low blows to sensitive areas. Good hunting, because this is a target-rich environment.
So, over a decade and they still refuse to move the problematic stations, or to even admit there is a problem. Yes, they are lying, this is a politically driven agenda.
Or at least driven by economics over science.
Yep. No attachment to reality, just stealing taxpayers dollars.
Not economics, just money greasing palms.
I can believe that some manager whose responsibility it is to sign off on requisitions to spend money might well respond, “We can install the equipment over near the air conditioners and save money by not using valuable land. There is already power near by, and it is paved, making it easier to service.”
What is the relationship between “poorly sited station” and “station in an urban area?” I would expect significant overlap between the two. I would also expect more warming in urban areas than in rural areas, and this urban warming should be captured as part of the surface temperature record. The question would then simply be whether the urban warming is being oversampled, which this survey does not address.
I’m also not sure that simply showing that the net impact of adjustments to the CONUS record increases the trend is in any way meaningful, since the adjustments aren’t merely addressing urbanization.
GISS handles land (and ocean) temperature measurements derived from orbiting satellite instruments, not land based measuring stations.
The corrections indicated in the graph that you provided may not be a “thumb on the scale” type that you insinuate, but instead necessary corrections to adjust for various satellite measurement-introduce errors and/or calibration factors. Hard to say since you did not provide a reference/link to the source of your graph.
As to the whole point of UHI contamination of land-based temperature measurement stations, one would logically expect this to be a world-wide problem since most such station are—for convenience and security and especially for easy access to power and ease-of-maintenance—located in urban areas, quite often at airports near large areas of concrete and/or asphalt.
See response above.
AlanJ,
Unfortunately, nobody knows how far the temperature measured in a screen in the routine way, extends to represent the space around it. You cannot infer that a T of 25 deg on the thermometer will be 25 deg 100 yards away or even a yard away.
Support for this assertion comes from earlier work by Anthony Watts. He observed some effects from paint/whitewash finishes to the screen exterior. Their variability disallows the choice of any particular screen temperature to speak for the surroundings, because you can change it with a paint job.
However, despite known misgivings like these, ‘authorities’ have pressed on regardless because they felt they needed a way to show that global warming was happening.
I do not know if global warming is happening. I can make a poor case for at most 0.5 deg C over the last century, but there are 2 sigma error bounds around that of +/- 0.5 deg C, so the whole effect might be no more than noise.
It is the unwillingness of authorities to express proper uncertainty limits that is the cause of much argument. And poor science.
Geoff S
Hubbard and Lin in 2006 did a study using multiple measuring devices at the same location. They found that you *must* make data adjustments on an individual device basis. Even different surfaces under the station (e.g. grass, sand, dirt, etc) makes a difference in the device reading.
I believe Hansen et al. 1987 showed that strong correlation exists in the temperature anomaly between stations located >1000km from each other. That implies you can represent robustly the mean global surface temperature with a small number of stations (fewer than 1000). Where we have records from >26,000 stations in the latest GHCN.
His correlation only showed a daily correlation and seasonal correlation – meaning the slopes of the temperature change at any point are similar. That does *NOT* mean that the temperatures themselves are equal and can be substituted.
When it’s summer, temperatures go up during the day (usually). When it’s moving into fall, temperatures start to decrease (usually). At least they do here in Kansas. They do the same thing in Nebraska. That doesn’t mean that Kansas temperatures are the same as in Nebraska.
I’ve given you this function before. If the temperature profile at StationA is a sine wave, sin(A) and at StationB is a sine wave, sin(A+ ⱷ) then their correlation is cos(ⱷ).
That does NOT mean that StationA temp is the same as StationB.
In fact, since ⱷ(latitude, longitude, elevation, weather front, terrain, geography, etc) even the correlation quickly becomes low.
You do realize that this is an argument against making adjustments to the measured temperatures don’t you? Why make adjustments when converting them to anomalies eliminates absolute temperature imperfections?
Converting to anomalies makes the station record representative of a broader area, but it does not remove spurious trends from things like station moves or instrument changes.
As I’ve said elsewhere, you don’t have to adjust for these things – using the gridded anomalies will get you most of the way there (for global trends particularly) – you just need to understand well the implications of ignoring TOBs, station moves, etc.
Anomalies carry with them the very same measurement uncertainties the absolute measurement values have. You just can’t get away from that unless you assume 100% accurate stated values for the measurements or that all uncertainty cancels. Anomalies totally mask the underlying temperature profiles that are essential to evaluating actual climate. The temperature anomaly in Alaska can be exactly the same as in Australia on the very same day – but have a totally different climate!
We should be tracking maximum temperatures and minimum temperatures separately. Then we would have a much better picture of actual climate effects. The models should do the same – project maximum temperatures and minimum temperatures.
The thing that we are measuring is climate change. By their design, anomalies do not retain information about mean climatology, they retain information only about how the climate is changing. It is vastly more likely that two adjacent regions are experiencing similar changes to their mean temperatures over time than that those two regions have the same temperature.
And in fact scientists are tracking both daily highs and lows, this is how the daily mean is computed.
“ It is vastly more likely that two adjacent regions are experiencing similar changes to their mean temperatures over time than that those two regions have the same temperature.”
Really? If a developer starts building houses near one site does that mean that the “changes” over time in the measurements from that station should remain the same as another site in an adjacent region? That development could take and extended length of time. Why should the mean temperature changes near the development be the same as a station not near the development?
Land use changes are VERY important to temperature measurements. Yet you seem to want to ignore them so you can just guess at what a station should be recording.
And you call that science?
Trends resulting from localized changes are exactly one of the things adjustments are there to address. I’m glad we seem to be reaching some kind of agreement on the need to address these things in the data.
“The thing that we are measuring is climate change”
Cold climes have a wider temperature variance than do warm climes. That impacts the “change” you see at different locations, even the anomaly change. How do you account for that?
Bottom line? Climate scientists don’t seem to be overly concerned with reality. They just like to create temperature data sets that provide confirmation bias!
Tim,
Well stated. If you go from raw to anomaly form by subtracting a single from each observation, this has zero effect on the uncertainty bounds.
Geoff S
Yep! Constants have no uncertainty so can’t contribute to the uncertainty, it neither adds or subtracts.
What kind of spurious trend are you talking about? If you use a station baseline why would a “growth” trend be spurious? Any spurious change should disappear in a month! Your argument is incoherent!
Imagine you have a station that was moved from high elevation two a low elevation site in 1950, you might look at the raw station record and see a breakpoint like this:
If you computed the mean climatologies before and after the breakpoint, you’d see something like this:
That’s very odd looking – all of us should intuitively know from every day experience that the climate doesn’t change by 6 degrees overnight. Of course, what has happened here is not that the climate around the station has changed significantly, what has happened is that the station was moved to a place with a warmer mean temperature. If you adjusted the station record to remove the breakpoint, the mean climatologies would align:
And now you know what’s been happening to the climate around the station because you’ve removed the spurious trend.
Using the anomaly here would not alleviate the problem because it would merely center the station’s zero point on the 30-year mean of the baseline, it would not remove the breakpoint.
Demonstation of lying with mannipulated data noted.
Each of those changes could be from someone changing the surface below the station from grass to gravel. So you are seeing an accurate representation of the microclimate both before and after.
So why would you want to “adjust” past data when it was providing an accurate representation of the microclimate before the change and create false data?
Why not just start a new temperature record? So you have two accurate records!
You do not want a microclimate change to be smeared out across the surrounding region, which is what you are doing by not making any adjustment for it. The station might have been moved, or someone might have put a parking lot under it, but that doesn’t mean the entire county was concurrently covered in asphalt.
If you can’t identify the UHI impact then how do you adjust for it? It would be far better to just eliminate any measurement station that might have UHI.
Think about it. UHI changes with season. It changes with things like buildings being refurbished (e.g. being painted). UHI even changes as asphalt ages and changes color (i.e. albedo).
How does a *single* adjustment factor cover all the possible factors determining UHI contribution? Especially when you are trying to identify differentials in tenths or hundreths of a degree?
See Menne, et al., 2009 for an application of an automated homogenization algorithm. You are looking for stations whose trends deviate significantly from their neighbors – it is then necessary to adjust the station record so that you aren’t over representing a localized trend. You are not using a single adjustment factor, the adjustment is specific to each station (and if no discontinuity can be reliably identified you leave the station record alone).
“automated” — means it does only what it is programmed to do.
I mean that’s… literally what automation is, yes.
You are making a mathematician/statistician argument. Let’s change the NUMBERS so they match up!
You are changing what are possibly calibrated and accurate MEASUREMENTS to make a TREND look like you want it.
The ethical thing to do is to recognize that a CHANGE in SOMETHING occurred even if you don’t know what. At that point you STOP the previous record and begin a new one.
Your only argument is that you need a LONG RECORD. Explain why! You need to indicate just what it is you hope to accomplish by creating information to make a record look like a long one.
You need to justify to yourself the reason for wanting a long record. Does that reason truly justify creating new information that replaces accurate data?
The most ridiculous reason I have been told is that short records create spurious trends in the data. In order to create data that eliminates spurious statistical trends, long records are needed.
My training in engineering says you either get new measurements or throw the original away. There is no other choice. Manufacturing new information to use in place of MEASURED AND RECORDED data is NOT AN OPTION. That is fundamentally a reason to declare one or the other unfit for purpose and drop the data from your analysis.
You also need to ask yourself why you “raised” the old data to match the new data. Is that a bias? Why didn’t you lower the new data to match the old? Maybe the old data was from a Stevenson screen and was entirely accurate. The new data is from an MMTS enclosure and reads higher. Does that automatically make the new data better?
To keep the information on a level basis, why not change the new data? Do you see the conundrums involved in deciding to change data by replacing it with what YOU consider to be better information? Do you understand why there are policies for declaring data unfit?
We want a longer record so that we can see what was happening 10, 20, 30, 50, 100 years ago instead of just the last decade. We are not manufacturing new information, but removing systematic bias to precludes a straightforward combination of station records.
We “raise” the old data because our point of reference is the present – we want to know what the station would look like today if its conditions had never been different than they are right now. We could use the past as a point of reference with no difference in the trends, so it is simply convention. It makes no difference as long as the convention is followed consistently, which it is.
Don’t lie, this is exactly what you do.
As I said:
First, the data is there for 10, 20, 100 years ago. You can see the trend for as long as the station remained the same. The trend may not be as long as you would like, but guess what, that is life. Changing recorded and accurate data to simply make the numbers MATCH is what a mathematician would do but a person whose purpose is science would not do that because it invalidates accuracy.
Would you allow a water treatment plant to go back and change all their previous contaminant data because the changed a filter and the new readings are lower and they want a long record for trending?
Would you want prosecutors to go back and charge you with a DUI because a new analyzer has a higher trend than an old one?
How about an engineer raising the safe weight limit on a bridge because of a new strain gauge just so he could have a long record to trend?
What I’m trying to say is that new data can not, by itself, invalidate old data. You need a valid physical reason for creating new information to replace old data. The fact that the two may disagree is not a valid physical reason for doing so.
AlanJ,
Thankyou for the wisdom of your contribution, but concepts like this have been known for decades and there have been many ways suggested to cope with the problems.
One large, over-arching problem comes when you want to correct the step change that you show. The observations each have uncertainty bounds around them. When you adjust your step change, how do you move your uncertainty bounds? It is clearly incorrect to move the envelopes with the averages because the uncertainties before and after the break point are likely due to different effects at the 2 sites, which would not produce equal uncertainty bounds.
Your illustration uses flat-line averages. When you get into strong time trends before and after the break point, you run into a need for corrections for which no data exist because time has passed. Believe me, the logic that is being used is immature to wrong, as we oldies have known for decades.
I suggest you do some reading to catch up with what has been known for a long time.
Geoff S
I agree that this is essentially a solved problem in climatology.
AlamJ,
A very good correlation between the data on 2 graphs arises if the data form a nice straight line. You can get a correlation of 1 if the lines are perfectly straight. There is an element of this math problem in the correlations to which you refer. They are unreliable until that is understood and fixed.
Geoff S
Getting a straight line from data with uncertainty is an ASSUMPTION made by those looking for a straight line. In other words the inherent bias of the analyzer biases the result.
This is the essence of trendology—without a straight line there is no way to proclaim how many degrees per millennia and they would have nothing.
Notice how Nick Stokes always reports his trends as C/century on the basis of a few decades of data. This makes the numbers look “bigger” and is an implicit prediction of the future, without having to state it as such.
Well, if we are talking about the United States, your Hockey Stick doesn’t apply.
Here’s the real temperature profile of the United States.
Hansen 1999
As you can see, the 1930’s are warmer than the present day, unlike your bastardized Hockey Stick chart which shows the 1930’s as being much cooler than the present day.
One of these charts is wrong and it’s not James Hansen’s.
Your graph ends in 1999, here are US temperatures through 2021:
That is after “adjustments”. Somehow the 30’s lost a half a degree?
Both of these graphs are “after adjustments.” The methodology used to make the adjustments and the number of station records available for the analysis are just improved with each new version of the dataset. The main difference is that the early graph is missing the last 20 years of data.
I love adjusting data.
To me adjusted data is not data, adjusted data is what you think it should be. In most jobs adjusting data will get you fired. In climate science adjusting data get you awards.
In all jobs. Generally, if data is incorrect, you can correct it with new measurements. However, some times that information is in the past and new measurements aren’t possible. Then, just throw it out.
In this case the data are not incorrect, the data just contains two signals (roughly, “climate stuff” and “non-climate stuff”) and we are interesting in analyzing one of those signals, so we have to account for the other one.
How do you account for the other signal when the data is in the past and you have no way to measure it?
Your answer (and most climate scientists as well) seems to be “We’ll just guess what it is!”.
Mr. J: “the data just contains two signals (roughly, “climate stuff” and “non-climate stuff”) and we are interest[ed] in analyzing one…to account for the other one.” See the problem? You have defined the problem in a way that steers the answer. Which one of your “stuffs” contains the human-caused “stuff”, or are we getting too technical? Two signals? Not the sun, and the clouds, and oceans, and….. Sorry, Mr. J., I’m just a commenter here, but you are clearly not as smart as you think.
The “climate stuff” component contains all of the climate stuff, whether sun, clouds, ocean, etc. The “non-climate stuff” component contains all the things unrelated to climate, like stations moves, instrumentation changes, TOBs, etc.
Now you are moving off into ‘signal processing” trying to remove an interfering signal. That is a difficult process and you need a whole lot more information sampling to be able to do that.
First thing you must have is an idea of what the true signal is so filtering can be done to remove extraneous information by filtering. No way to do that with low resolution temperature data.
You can do something similar with a process like diversity reception but the easiest way is to simply disregard the measurements from a compromised signal and use the one that is being used for comparison that is unaffected. In other words declare the stations with UHI unfit for purpose.
Yep
Why does the graph differ so much from the USCRN graph for the period 2005-2021? The latter shows essentially no warming at all for that period.
A quick comparison suggests that GISTEMP for the US shows considerably less warming over this time period than USCRN/ClimDiv. I don’t know the reason why.
Alan, just pick your dataset and you can prove whatever you want. That’s the problem.
USCRN shows no trend whatever, whereas there is a strong warming trend in GISTEMP. That is my point.
Have you run a regression on the USCRN data ala Lord Monckton? To see if there is no trend. Hard to eyeball on a noisy graph, though I does not look like a catastrophic warming trend !
There should be some warming with the PDO negative through 2014 and then turning positive.
Forgive me for being an old-school pedant, but I still hold that recorded measurements that have been changed from what was actually instrumentally logged are no longer “data”, but instead are “numeric constructs”.
Reason being, as soon as you devise to alter recorded measurements (calling it correcting or whatever), you must make assumptions about the how, what, when, where, why such alterations are warranted.
This opens up a whole new avenue of scrutiny to determine if such assumptions are warranted at all, let alone valid.
So to my mind, temps records should be considered just on what individual stations record – no “infilling”, “adjusting”, “pairing”, “homogenizing” or worst of all – “averaging”.
Let everyone who is interested work from the same unalloyed set of real recorded data, and make their conclusions accordingly, and leave the “numeric constructs” to those who want to play Excel “what if” games.
It is objectively true to say that the surface temperature records are analytical products rather than simple measurements, and no one is saying differently. One does not have to perform any adjustments at all, and you could still get reasonably robust estimates of global surface temperatures. If you do nothing more than take the raw station measurements and place them onto an area-weight grid and average them you will obtain a result almost identical to the adjusted/homogenized products from NASA/CRU etc (black line in this image):
But scientists aren’t satisfied with “ok enough,” so they look for better ways to combine these disparate and transient surface stations into robust records that can be used to study changes are global and regional scales, and doing that requires performing adjustments.
It should be understood that the adjustments are not “correcting” anything in the data – they are methods used to take point-level temperature measurements and combine them into temperature fields. If all you want to know is the temperature at point X on date Y, the raw values right from the station record sitting right on top of that point will do perfectly well. If, on the other hand, you want to know how the climate in a region is evolving through time you have to consider all the ways in which the station, or a combination of stations, might contain signals that are not related to the evolution of the climate but are instead related to things like station moves, instrument changes, or changes to measurement practices.
Improved data is just some guys idea of what the data should have been.
Maybe the adjustments are justified, maybe they aren’t.
Maybe the adjustments are in the right direction and magnitude, most of the time they aren’t.
Complete nonsense.
There were few Southern Hemisphere weather stations before 1920, and certainly not enough until after World War 2
In the late 1800s and early 1900s there were only very rough estimates of the Northern Hemisphere average temperature, with far too few weather stations outside of the US and Europe. That these averages are called “global” is science fraud.
Charts at the link below show the poor distribution of land based weather stations:
Honest global warming chart Blog: Poor distribution of land-based weather stations (elonionbloggle.blogspot.com)
What happened to the ~5,000 stations that disappeared after the collapse of the USSR around 1990? I remember reading about it here many years ago.
I beg to differ AlanJ.
They are calling these “analytical products” DATA.
They’re not ‘data’ as traditionally understood.
In the same way that “vaccines” were used to describe the mRNA treatments that Pfizer, Moderna, etc developed.
Misleading.
The headline of NASA GISTEMP website:
GISS Surface Temperature Analysis (GISTEMP v4)
Analytical products can be datasets.
You’re snorting pixie dust. If you divide the earth into 8,000 or 16,000 cells, two thirds of the cells will have NO data in them at all. You have NO way of calculating your uncertainty.
Lol so divide it into fewer cells.
Keep snorting. That doesn’t change the fact that there is NO data for two thirds of the planet.
I’d say there is no data for like… 99.9% of the planet since a single surface station takes up like a square meter of surface area (eve less if we just consider the temp sensor) and there are like 30,000 stations in the world. Thankfully we can use a temperature value to represent more than just the precise point location where the measurement was taken, and we can extend that area even further by using anomalies.
The earth’s surface area is about 197 million square miles. If you divide it into 16,000 equal area grid cells, each grid cell would have an area of about 12,300 sq. miles, of which about two thirds have no data. If you divide the earth’s surface area by 30,000 stations AND they were equally distributed, then there would be one station for about 6,600 sq. miles or a bit more than the area of Hawaii. Nyquist tells us that’s stretching it too far AND the stations aren’t evenly distributed. Keep snorting.
If that station is sited over bermuda grass and is 1000′ away from 640 acres of half-grown corn, will the station give an accurate reading for most of its surrounding area?
If that station is on the south side of the Kansas River Valley will it give a representative reading for the north side of the Kansas River Valley? (about 20 miles distant)
Are you beginning to understand why the Global Average Temperature is so useless in explaining a fake global temperature?
The anomaly will certainly be representative (barring there being a micro-site trend in the cornfield, which we would want to use those dastardly adjustments to deal with).
You are just another dry-labbing fraud.
“The anomaly will certainly be representative”
Representative of what? The entire area? Probably not!
Why won’t you address the temperature difference on each side of a river valley?
Probably it will, as Hansen 1987 showed. The temperature difference across a river valley is irrelevant since we are talking about anomalies.
You *really* don’t understand variances, do you?
The variance of temperature can be different on each side of a river valley! That is going to affect the anomalies you calculate from the temperatures!
When you combine independent, random variables what do you do with their variances? What does the variance tell one?
It will not affect the anomaly since the anomaly is the deviation from the mean climatology of the station. The deviation from the mean climatology is the trend, which will be consistent on either side of the river valley.
You have NO way of knowing this, you just hope it is true.
This is the essence of climastrology?
Hansen et al., 1987 showed that it is true. Anomalies are highly correlated over >km.
You have NO way of calculating your uncertainty.
Ahhhh… Someone who gets it!
“ place them onto an area-weight grid and average ” that where you go wrong. Temperature measurements can only tell you what going on at that place and time frame, area-weight grid and average produce a number that is not real and means nothing. Keep drinking the Kool-aid.
You are dancing around the issue. Anomalies were created so that area weighting was not necessary since CO2 is well mixed and the “global growth” should be the same everywhere. That is the radiation budget as devised in the early days. Everywhere on earth receives the same radiation, emits the same average radiation, and CO2 radiates back the same average radiation everywhere.
How many studies of insects, plants, crops, polar bears, coral reefs, etc. at places all over the globe are suffering from increased temperatures as a result of CO2? In other words, everywhere is seeing the same rate of growth in temperature. Why do you need any kind of weighting, if everywhere is experiencing the similar growth?
Your insistence on “area weighting” indicates that you should be very critical of any study that simply declares that Global Average Temperature is increasing and affecting a very local phenomena. Is that your position?
Area weighting is necessary even when gridding anomalies because not all of the grid boxes have equal area because the earth is a sphere.
Then you must not believe the radiation diagrams that rely on average insolation everywhere and that show CO2 is what causes that.
How do you reconcile average insolation with area weighted temps.
As usual with climate scientists you have included *NO* uncertainty bars with your data graph.
Do this simple exercise:
Daily maximum temp = x1 +/- u(x1)
Daily minimum temp = x2 +/- u(x2)
where u() is the uncertainty interval.
Daily mid-range value = (x1 + x2)/2
Uncertainty of the mid-range value = u(x1) + u(x2)
If the uncertainty in each measurement is +/- 0.5C (the Federal Meteorology Handbook No. 1 specifies +/- 0.6C as acceptable) then we get
mid-range value = (x1+x2)/2 +/- 1C
Your mid-range value has already started out with an uncertainty of +/- 1C. When you average the daily mid-range values over a month that uncertainty interval just keeps on growing It will quickly overwhelm the differences you are trying to identify. When you average the monthly values to get annual values the uncertainty becomes even larger.
This is the main problem I have with *all* of the climate stuff, including UAH. Measurement uncertainty is simply ignored.
Measurements should *always* be specified as “stated value +/- uncertainty”. That uncertainty should then be propagated through every stage of analysis.
You simply cannot ignore it or assume it is zero or assume that it all cancels out!
So you’re saying if we made 3 measurements the uncertainty would be +/- 1.5 degrees, and if we took 1000 measurements the uncertainty would be +/-500 degrees? Lol that’s what you really think?
“So you’re saying if we made 3 measurements the uncertainty would be +/- 1.5 degrees, and if we took 1000 measurements the uncertainty would be +/-500 degrees? Lol that’s what you really think?”
It’s true. Only statisticians with no real world experience would think any differently.
Take three boards, lay them end to end. Board 1 = 3′ +/- 1″. Board 2 = 4′ +/- 0.25″, Board 3 = 5′ +/- 0.3″. Now join them with a fish plate to create a beam spanning a 12′ area. What is your uncertainty that the beam will reach the whole way?
Temperatures are handled the same way when you add them together.
Note: average uncertainty is *NOT* the same thing as uncertainty of the average.
That is how measurement uncertainty is propagated in a sum, it is not how the uncertainty of the mean is calculated.
Just what do you think uncertainty of the mean tells you?
It tells you an interval around the sample mean where the population value may lay. That is all. It says nothing about the accuracy, precision, uncertainty, resolution, etc. of the measurements and how the uncertainty affects the mean value.
Here are two references from the NIH who has recognized the problem scientists in the health field have in relation to reporting statistical information.
https://www.ncbi.nlm.nih.gov/pmc/articles/PMC1255808/
https://www.ncbi.nlm.nih.gov/pmc/articles/PMC2959222/#
Read these carefully and consider what you have with temperature data.
Do you have samples or a population?
What is your sample size? Lots of folks count the number of stations as the sample size. That’s a dead giveaway they know not what they do.
Is each station a random variable?
If each station is a unique random variable, what is the variance of each of them?
How do you combine the variances of a number of random variables.
Show references for your answers to these questions. They are important.
That is exactly what it tells you. And the interval gets smaller as the sample size grows.
Oh please, not another one of these morons. Is this the best that climastrology has to offer?
“That is exactly what it tells you. And the interval gets smaller as the sample size grows.”
So what? Is the mean of a population as calculated from only the stated values of the measurements while ignoring the uncertainty of the measurements 100% accurate?
If it is not 100% accurate then what determines the accuracy of the population mean? Is it the measurement uncertainty of the individual elements?
If it is the measurement uncertainty that determines the accuracy of the population mean then why doesn’t the measurement uncertainty of the elements in the sample determine the accuracy of the sample mean? Or is the sample mean always 100% accurate?
How do you justify always ignoring the uncertainty of a temperature measurement?
The estimate of the population mean derived from sampling will never be 100% accurate unless you sample an infinite number of times. But we can determine our range of uncertainty in our estimate, and that range is reduced by using a larger sample size.
FALSE!
The number of samples in a time-series (i.e. temperature) is always exactly equal to one, you have one chance to measure it, and it is gone forever.
Averaging does NOT reduce uncertainty!
There is a LOT more to measurement uncertainty than just standard deviations from averaging!
The thing that we want to measure is the global mean, and we are sampling various points on the earth’s surface to derive an estimate for the global mean. So the number of samples oused to estimate the global mean at any point in time is the number of station measurements we have.
The larger the sample size, the smaller the uncertainty in the estimate of the mean. You keep saying that averaging does not reduce uncertainty as though I’ve ever said that it does.
ONLY if you are making multiple measurements of the same quantity, which is IMPOSSIBLE with air temperature measurements! Can you not see this?
The LOCATIONS of these sites NEVER change, so you are not taking samples from random locations, quite the opposite.
The GAT is a meaningless number that cannot represent climate! You are fooling yourself that it does.
You are mixing statistical error with measurement uncertainty.
I recommend that you download a copy of the Guide to Measurement Uncertainty (search for GUM) and study it in detail.
If I shoot six arrows at a target and they all hit each other but they are six inches away from the center of the target am I accurate with my shots?
The interval around the sample mean is where those arrows hit. The standard deviation of the sample means is very small.
But the accuracy of where they hit is poor! The standard deviation of the hit points of those arrows tells me nothing about accuracy.
The measurement uncertainty of where they arrows hit is the distance from all those closely grouped arrows to the center of the target!
If you ignore the measurement uncertainty and you go out hunting you’ll likely come home with nothing!
Does this help you understand the difference between the statistical description of the standard deviation of the sample means and the accuracy associated the average of the sample means? Or are you just going to starve because you can’t hit anything?
Systematic biases will not be reduced by taking a large sample size, so we apply adjustments to remove them. Random measurement error and random variance in the data will be reduced by taking a large sample size.
What about the biases that you don’t know, and can never know?
“That is how measurement uncertainty is propagated in a sum, it is not how the uncertainty of the mean is calculated.”
Uncertainty of the mean is *NOT* the standard deviation of the stated values nor is it the standard deviation of sample means.
The standard deviation of the stated values only gives you a hint of where the mean of the stated values will lie. But that interval ignores the measurement uncertainties.
The standard deviation of the sample means only gives you a hint of where the mean of the sample means will lie if you only consider the stated values of the sample means.
Neither of those tell you the uncertainty of the mean!!! They all ignore the measurement uncertainty!
Did you have *ANY* examples in ANY of your statistics textbooks that used data elements given as “stated value +/- uncertainty”. Or were they all just “stated value”?
And then a fake margin of error is claimed too
That’s old fogey science !
Reemeber the good old days when scientists had uncertainty?
Not only are raw data adjusted but many numbers are wild guessed (infilled) and can never be verified.
And, those assumptions are rarely stated explicitly on the graph, such as “Corrected for UHI effects” or “Corrected for calibration errors.”
And, as usual, there are no error bars shown. I would expect that a rigorous and honest assessment of uncertainty would show an increase in the uncertainty range because of the assumptions made to make the ‘corrections.’
… Because the graph is a graph. If one wants to understand how the graph is produced one will want to turn to the documentation in the published literature, where everything is laid out in excruciating detail. NASA does provide error estimates in the datasets available on their website.
Hardy, har, har. What a joke. NASA temp folks wouldn’t know measurement uncertainty if it bit them on the arse. The most they deal in is statistical error which IS NOT measurement uncertainty.
A serious problem with your suggestion is that the graph frequently gets separated from the metadata that is essential to a correct interpretation and understanding. That is particularly true today with the internet.
I have yet to see a climate study that propagates actual measurement uncertainty into their averages. At most they calculate the mis-named “standard error of the mean” which is far better described as the “standard deviation of the sample means”.
Each sample mean should be stated as “mean +/- uncertainty”. Then you can calculate the standard deviation of the mean values which really only gives you a measure of how precisely you have calculated the mean. It should be followed by propagating the uncertainties associated with the sample means onto the average of those sample means. THAT NEVER GETS DONE! Everyone assumes that the uncertainty is either zero or cancels so they don’t have to actually show it in their results!
If the uncertainty were to be actually shown on something like the graphs you have given by blacking out everything in the uncertainty interval the entire graph would be black and you wouldn’t be able to discern *any* trend of any kind!
“improved”
LMAO. They sure improved the pay for career climate pseudo-scientists.
All your get with homogenization is UHI spread out over rural areas. Same with infilling. The result is nonsense.
Those are NOT adjustments. They are manufactured information to replace data. Adjustments are done along with calibration charts that allow one to CORRECT readings. That does not apply here.
Name one, just one area of science that allows scientists to go back and manufacture new information to replace prior recorded data. And, I’m not talking about declaring prior data no longer fit for purpose and replacing it with NEWLY measured data from better measuring equipment,
Except no data is being replaced. The raw records are available to all and sundry. And of course anyone who wishes to do so can perform their own surface temperature analysis with their own adjustments (or lack thereof) and present it for scrutiny to the public. People who have done this in the past (Berkeley Earth and myself among them) have found that they got almost exactly the same result as everybody else. Perhaps it is little surprise then why the most ardent skeptics show zero enthusiasm for such effort.
“Except no data is being replaced.” that bs the raw record have been shown to have been replaced.
Again, you are dancing. How many climate related studies use the raw data? If they all use the official analysis of raw data, then you have no basis for your argument.
I don’t think anyone should use the raw data, because the adjustments improve it quite a bit. The point is that you can if so inclined. All of the data is right there. I’ve prepared a surface temp analysis of the raw data myself to confirm that it was consistent with the major adjust datasets. You could do it, too, but I think you won’t because you don’t want your misconceptions to be challenged.
“The adjustments improved it quite a bit..”
Ding ding ding ..hello?
How do you “adjust” data from 1900? Do *YOU* know what the calibration was of any specific measurement device at that time?
Where is your propagation of measurement uncertainty? Are you assuming there is no measurement uncertainty or are you just assuming that it all cancels?
“Perhaps it is little surprise then why the most ardent skeptics show zero enthusiasm for such effort.”
Yep.
A moron indeed.
Who laps up the Fake News like it is tequila.
The raw records *all* have uncertainty associated with them. The measurements should be given as “stated value +/- uncertainty”.
What has happened to all the uncertainty in the surface temperature analyses? Where is it propagated, shown on graphs, and allowed for?
Berkeley Earth assumes the uncertainty in the raw data to be the assumed resolution of the measuring device. They actually have records from the 1800’s that show an uncertainty in the tenths digit, e.g. +/- 0.1C! Unfreakingbelievble!
Did YOU propagate the measurement uncertainty in YOUR analysis? Please give us a graph you have generated that shows the propagated uncertainty interval for annual averages!
GISTEMP with uncertainty:
Is this a “spot the actual temperature measurement” puzzle?
That is a Bloody estimate .This graph is straight out fraud .
The 1930s were at least as hot as now right around the world .
This is exactly what we are trying to tell you .
There was little UHI back in the 30s and less than 2 million people on this earth .
If you locate thermometers where they are warmed by the surroundings of course you will show a warming trend .
Based on what? None of the available global temperature datasets show this at all, nor do the raw station data.
That’s because the “raw” data has been manipulated as well. All you see for “raw” data is what is on some computer. Unless you can get access to the paper forms which the station manager filled out how do you know the “raw” data hasn’t been manipulated?
The temperatures in the 1930s are well documented and they were as warm and warmer than present .
The three climate optimums in the last 10,000 years were also warmer than present .
As this information does not confirm with the scary scam that is being forced onto the world to impoverish most of the worlds inhabitants .
Co2 is not a pollutant but it is a life giving gas that is essential for all life on earth .
Malarky! That gray stuff isn’t measurement uncertainty! The uncertainty you are showing is less than 0.5C total or +/- 0.25C and most are less than that. Most of them show a 0.25C interval meaning the measurement uncertainty is +/- 0.125C or less. IN 1930!!!!
In 1930 the LIG measurement uncertainty would been at least +/- 0.5C FOR EACH MEASUREMENT! There is simply no way the uncertainty for 12 sets of 30 daily mid-range temperatures could sum to be any less than +/- 0.5C. In fact, each daily mid-range value would have an uncertainty of at least +/- .7C.
I’ve attached a copy of your graph with the uncertainty area blacked out. Tell us what you can glean from the blacked out area!
The grey stuff (it’s delicious) is the 95% confidence interval reflecting the uncertainty in the mean. There is a 95% chance that the true value of the global mean lies somewhere within those grey bars.
The measurement uncertainties tend to cancel, so the resulting confidence interval is much smaller than the individual uncertainties in the measurements.
A confidence interval is NOT measurement uncertainty!
“The grey stuff (it’s delicious) is the 95% confidence interval reflecting the uncertainty in the mean.”
As MC has already pointed out confidence interval is *NOT* measurement uncertainty!
Temperature measurements are given as “stated value +/- measurement uncertainty”.
The confidence interval is based solely on the stated values and their standard deviation while ignoring the measurement uncertainty!!
“There is a 95% chance that the true value of the global mean lies somewhere within those grey bars.”
No, there is not a 95% chance that the true value of the global mean lies somewhere within those grey bars!!!
There is a 95% chance that the mean of the stated values lies somewhere within those grey bars, NOT THE TRUE VALUE!
The uncertainty interval of that mean is the propagated uncertainty from the individual members of the data set! THAT propagated uncertainty interval is the interval within which the true value lies.
That uncertainty interval grow so large as you average an average of an average of yet another average that it just totally masks any small differential you may be trying to identify.
Showing temperatures in the 1800’s and early 1900’s to 0.1 or even 0.01 should be a trigger to you. These are statistical error calculations. In other words Standard Error of the sample Means, i.e. SEM. They have nothing to do with the uncertainty in measurements. SEM only provides tells how close the estimated mean will be to the population mean. It doesn’t even tell you what the precision of the value should be. Significant Figures tell you that.
Here is a quote from a Washington Univ. chemistry department (no longer available on the net, I made a copy) that discusses significant digits and the ethics of why they should be followed.
Let me restate what this says. If the measurements of temperature are recorded as INTEGERS, the calculated mean should be displayed as INTEGERS also.
What climate scientists, along with statisticians and mathematicians have ignored is that they are dealing with uncertain measurements and not simple numbers to be manipulated. They assume that the SEM allows them to determine the number of significant digits in the mean. It doesn’t.
Read again above to see what chemistry and physics and engineers are taught about physical measurements.
If we express a number beyond the place to which we have actually measured (and are therefore certain of), we compromise the integrity of what this number is representing.
Here is another reference.
Microsoft Word – Document3 (purdue.edu)
It says:
Please note: “known with certainty”. In other words, what was recorded, not what was calculated in a statistical analysis.
Here is the publication describing in detail NASA’s approach to estimating uncertainty in the GISTEMP analysis.I greatly look forward to your thorough assessment.
Pop quiz:
What are the units that should be attached to these numbers?
Alan,
Did you actually READ the abstract of the article you linked to?
“Uncertainties arise from measurement uncertainty, changes in spatial coverage of the station record, and systematic biases due to technology shifts and land cover changes. Previously published uncertainty estimates for GISTEMP included only the effect of incomplete station coverage. Here, we update this term using currently available spatial distributions of source data, state-of-the-art reanalyses, and incorporate independently derived estimates for ocean data processing, station homogenization, and other structural biases.” (bolding and italics mine, tg)
In the first sentence (bolded) they mention measurement uncertainty. In the last sentence (italics) THEY MENTION NOTHING ABOUT MEASUREMENT UNCERTAINTY! NOTHING!
“The resulting 95% uncertainties are near 0.05 °C in the global annual mean for the last 50 years and increase going back further in time reaching 0.15 °C in 1880.”
In other words their +- 0.05C is a statistical construct called the confidence interval, in other words it is based on the standard deviation of the stated values while ignoring measurement uncertainty!
Does NO ONE in the climate business understand the difference between standard deviation of the stated values and measurement uncertainty?
What temperature measurement device are you using to measure to 0.1 resolution? What temperature measurement device are you using to measure to .01 resolution?
Are 0.1 and 0.01 integers?
Yes,Jim,
You and I know the penalties for doing adjustments to gold assays from an emerging new mine. Think jail.
Geoff S
No, the main difference is that the data shared by both isn’t identical, showing the extent of the uncertainty that apparently exists. Both come from the same source, so both are equally valid for the overlapping decades. And I see they can’t decide how much it warmed from 1880 to 1930, so why should I trust them for the late 20 years? There was no honest reason to change the earlier part of the data either in 2000 or in 2020 because nobody can go back and check what is “right” so we have to take it at face value today, after those who built the equipment and collected the data back then and would be in a position to point out errors and problems are no longer with us).
The only proper way of assessing errors in early measurements – not even a particularly difficult one from an engineering standpoint – would be to rebuild a few turn-of-the-20th-century weather stations and take the temperatures manually as they did in the old days over a few years, then compare these readings with the ones taken by modern means at the same locations, to find out any inherent bias of either method empirically and derive a mathematical function that translates one type of measurement into the other to make them comparable. Once done, such a “synchronization” of measurements by different methods would never be in need to be corrected again in future. And I might add that I don’t expect it to be substantial either. Nor changing much from one decade to another.
Guy from Berlin,
You suggest “rebuild a few turn-of-the-20th-century weather stations and take the temperatures manually as they did in the old days over a few years, then compare these readings with the ones taken by modern means at the same locations”.
This is eminently sensible, low-cost, high reward work that has been floated as worth doing many times over the years.
We were close to setting up a private station a few years ago but it became too complicated unless you had the cooperation of the present curator (in Australia, the BOM). You would have to match existing gear too closely, otherwise critics could say “Invalid, you used the wrong brand of paint on the shelter” or things like that.
It is a sign of corruption of the scientific mind when people reject testing because they fear it might show them wrong.
Science, in the real world, advance when ideas are shown to be wrong.
Geoff S
You would also have to be able to duplicate the environment at the measurement site, right down to the surface below the thermometer. Surrounding structure would have to be duplicated as well.
The uncertainty associated with such an endeavor would overwhelm any differences you might identify.
“improved”. uh huh
That you can’t admit to the obvious manipulation between these two graphs is shameful and speaks volumes about you.
Here is the missing data:
Note that 1998 and 2016 are statistically tied for the warmest temperature since the 1930’s. That would make the 1930’s warmer than both 1998 and 2016 in the United States.
So, the United States has been in a temperature downtrend since the 1930’s.
The United States temperatures are unaffected by the demon gas CO2. Hotter and hotter? Not here.
“So, the United States has been in a temperature downtrend since the 1930’s.”
Not according to the updated version of the graph that you show repeatedly. So come on Tom, show the last 20 years of your favourite graph. I dare you.
You are a moron.
Yep. How long until TDS-boi turns into a one-way poster like griffffffff?
There’s a reason I use Hansen 1999: It is the least bastardized chart of the U.S. we have.
Then I follow with the UAH satellite chart, which overlaps Hansen 1999, and shows the temperatures up to the current date.
I don’t do NOAA and NASA Climate bastardized charts. You shouldn’t either, if you want the truth about the temperatures.
Except you’re trying to append Hansen, 1999’s US temperature record to the Global temperature record from UAH. If we use Hansen, 1999 global temps and append UAH, it looks like this:
Which looks an awful lot like just, y’know, comparing UAH to the latest GISTEMP:
There is no reason to adjust the old data. If the data is adjusted it is no longer data, just somebody’s’ best guess to fit their personal agenda. There is no way anyone could know enough about any historic single measurement to be able to correct it. With the older measurements you don’t even know for sure the time the reading was taken since the people taking the reading more than likely didn’t even know if the time on their clock was correct.
From Nick’s blog 9 nov 2020
The primary data is the unadjusted, which would correspond to USHCN raw in that dataset. Everything GHCN does works from that, so there is no TOBS to be undone. They record the unadjusted (which doesn’t change) in QCU, and put into QCF the current PHA calculation of the adjustments, going right back through the record (same algorithm for all years). That is why you read complaints about adjusted records changing.
But, that is a perfect explanation that “adjustments” are in the eye of the programmer and have nothing to do with a concrete, scientific environmental basis for making the change.
How do you adjust past data when you have no idea of the calibration status of the measurement device in the past.
ALL field measurement devices drift over time. You are the one that mentioned needing a time machine. What time machine was used to calibrate the readings in the past in order to determine the correct adjustment?
You simply cannot improve past data by GUESSING at what it should have been!
AlanJ,
You are wrong again. The heatwave data for Australia that I have been showing are raw, unadjusted, as recorded by the observer. To highlight a problem or two, I have also included officially-adjusted data known here as ACORN-SAT.
There are differences on a single day at some locations of up to 7 deg C IIRC, with many more around 4 deg C.
You might awaken to the inaccuracy of adjustment if you take a time to study (more than just a glance) the comparative temperatures in this compilation by colleague chris Gillham. There is daily data for each of the 110 or so sites, if you move to a site and click on the link to daily data that appears with each site’s annual data. It is a huge amount of work and it indicates a huge problem with adjusting the way you are starting to learn about.
Geoff S
http://www.waclimate.net/acorn2/index.html
ACORN 2.2 changes to Australian temperature history (waclimate.net)
Somehow the 30’s lost a half a degree?
__________________________________
“beware of averages. The average person has one breast and one testicle.” Dixie Lee Ray
The dust bowl years had very cold winters and extremely hot summers. NOAA’s Climate at a Glance will verify the very hot summers. However they show recent years with just as hot summers, and that’s got to be bullshit.
With the 1930s and 1940s adjusted downward over time. Dirty pool.
Tom
Can you please use AlanJ’s updated graph from now on. It would be a lot more accurate (and honest).
No, it’s not. It is a bastardization of reality.
Feel free to live in your false climate change reality. I like the real world, myself.
Lmao I didn’t realize the last 20 years were a bastardization of reality. Why don’t you just use a graph that ends in 1970 instead and lop off the past 50 years? You could pretend even more readily that the US isn’t warmer now than in the 40s.
Again, Alan, UHI is supporting the “CO2 is what dunnit” narrative. Its one of their “multiple lines of evidence.”
Different comment but the same answer. The temperature database is used to show how CO2 effects rising temperatures. Thermometers having UHI should not be used for this purpose. UHI is basically caused by a change in albedo, not increased CO2.
The temperature record is used to show that the planet is warming (or cooling, or whatever it is doing). We then do attribution studies to understand why it is warming. Part of the warming is due to land-use changes, and a bigger part is due to warming from an enhancement of the atmosphere greenhouse effect. But there is nothing inherent in a temperature record to elucidate drivers.
Show an attribution study that has attempted to separate warming into CO2 caused and UHI caused. You are making assertions with no evidence to support the assertion. You have reached the point where some evidence is required.
We just can’t get through to you AlanJ.
Urban heat is not caused by the demon CO2.
All these shifty temperature recordings in cities and built up areas are being used to dupe the public into believing that CO2 is going to cook the world .
You and so many shifty scientists want to paint a picture that the heat is getting worse because of that CO2 and CH4 .
Take a data set from rural and ocean sites and with the UHI effect removed there is nothing to show .
The UHI effect is here to stay but you and other rouges want to include it to scare the hell out of the wider population
Urban versus rural temperatures:
From Hausfather et al., 2013.
So urban and rural anomalies are the same?
Can you tell us *exactly* how these anomalies were generated? Can you show what the measurement uncertainty associated with each are?
I’ve cited the paper from which the graph is sourced, it will contain all of the relevant details for you.
“and a bigger part is due to warming from an enhancement of the atmosphere greenhouse effect.”
You couldn’t prove that if your life depended on it. You are doing just what all the other alarmists are doing: Making claims about the Earth’s weather you can’t back up.
Assertions are not evidence of anything. All you have are assertions.
This is not that hard to figure out. Alarmists cannot prove their claims.
You won’t prove this claim. Because you can’t.
Mr. Abbott: A long march with Mr. J., but you have found a gem that tells us Mr. J. is not really engaged in the discussion, he will not concede the blazingly obvious- there is no need to adjust more recent data because it is polluted with UHI heat, so it goes up, up, up with no need for adjustments. Maybe Mr. J. would persuade somebody if he could show examples of stations that purposely give COLDER readings?
Actually, for sprawling cities like Los Angeles, or ‘Silicon Valley,’ the UHI effect does have a significant local effect. And, the loss of transpiration also contributes to daytime temperature increases, and the release of heat from pavement and buildings increases the nighttime temperatures.
Suppose it is accepted that UHI impact should be included in the global average temp calculation. Do we still blame CO2, or do we start a campaign to end urbanization and asphalt, which, based on this article, is behind half the higher temperatures being recorded at these sites?
Yes! Let’s start moving urban dwellers (educated and poor) out into the rural areas. We’ll get the same result Pol Pot did and we will reduce the amount of CO2 emitted by that result. /sarc
The problem is that the vast majority of these sensors are in areas that have been built up over the last 100 years. The number of sensors in truly rural settings is minuscule.
Was Mann a fraud?
What if there was an independent certification process for weather stations to determine if they were suited for measuring climate change? Otherwise, the temperature record will continue to be in the hands of the spreadsheet data manipulators.
The ISO 9000 quality control standards could be used that require a third party administration but that would hamper manipulation.
What an outstanding report . . . but not unexpected coming from Anthony Watts and the Heartland Institute.
This is the type of scientific “bird-dogging” that NOAA (in the US) and the IPCC (worldwide) should be doing if they were really serious about understanding measurements of parameters they use as inputs to computer models of climate and, moreover, as the basis of claims made about “global warming”.
It is a literal shame that such relatively-simple-to-investigate work had to be done under private funding/resources when it is so impactful to forming government-level policy and actions, current and future.
To all those WUWT posters that previously dismissed out-of-hand claims that urban heat island (UHI) effect on US/world land temperature measurements was not credible, here is the takeaway point provided in the above article:
“Data from the stations that have not been corrupted by faulty placement show a rate of warming in the United States reduced by almost half compared to all stations.”
Thank you, Anthony Watts, for spearheading this effort . . . you deserve way more than the 42E+42 intergalactic credits I give you!
I like 42X42^42. More 42s.
“With a 96 percent warm-bias in U.S. temperature measurements, it is impossible to use any statistical methods to derive an accurate climate trend for the U.S.”
I don’t agree with that statement. It is <b>CHANGE</b> in bias that distorts trend, and the example cited is one where the change should be known from metadata, and could be detected in the data. In principle that change in bias can be estimated and corrected, though in practice that procedure seems to create as many problems as it removes.
Once again, we get sucked into the meme that higher temps are proof that CO2 is driving the higher temps. We should be pointing out that trace amounts of CO2 in the atmosphere can’t possibly serve as a temperature dial. If it’s warming, stagnant or cooling, it has nothing to do with trace CO2 gasses, whether natural or manmade.
Exactly! Everyone misses the forest for the trees and gets bogged down in a morass of “science”. The logical flaws in the whole CAGW model are big enough to drive a bus through. For instance, we know indisputably that the temperature spikes in 1998 and 2016 were caused by strong el Nino’s. CO2 has virtually nothing to do with el Nino’s. Or heat waves, like the latest examples in Europe and the US. Anyone want to explain how trace levels of CO2 suddenly mobilized over the European continent for a few days to drive temperatures 20 degrees higher? And then mysteriously dispersed back into the atmosphere as Europe cooled? Doesn’t it take 30 years for a climate to change? Has the European climate changed by 20 degrees? Why do we spend a minute talking about their “science” when we can see with our own eyes that it is nothing but bald-faced lies? They ran exactly the same playbook with Covid. How did that “science” prove out?
Thank you for pointing out the huge logical inconsistencies in the CAGW narrative.
I’ve asked alarmists to explain how they can distinguish natural variation in climate from anthropogenic warming due to CO2. They can’t or won’t answer.
They can’t answer the question because they don’t know the answer.
Actually, the El Ninos demonstrate the opposite. There is a temporary spike in atmospheric CO2 that can only reasonably be explained by the warmth causing increased out-gassing, increased Winter respiration of trees, and increased biological decomposition of forest detritus.
https://wattsupwiththat.com/2021/06/11/contribution-of-anthropogenic-co2-emissions-to-changes-in-atmospheric-concentrations/
Sorry, your argument is dead on arrival. Did you know there are 4 X 10^40 CO2 molecules in the atmosphere? It may be a trace gas compared to other gases but the raw numbers are massive.
The real reason CO2 has no effect is because absorption of surface radiation in the 15 mm frequency range is saturated in less than 10 meters. Always has been. In addition, almost all downwelling IR is also absorbed at these low levels of the atmosphere and never reach the surface. Downwelling IR by the CO2 low in the atmosphere does not cause warming due to thermal equilibrium of the boundary layer.
Actually the best indicator that CO2 is NOT the “driver” of the Earth’s temperature is the period for which we have instrument records for both, from the 1950s when Mauna Loa CO2 readings begin to date.
During that time frame, CO2 levels have been rising, rising, and rising.
Meanwhile, temperatures were falling, then rising, then pretty much flat.
Essentially every possible outcome regarding temperature has been seen in the face of steadily rising CO2, which shows CO2 to be the “driver” of precisely NOTHING.
Excellent point. The temperatures have been up and down, and all over the place while CO2 steadily increases.
CO2 is said to be driving the long term underlying warming trend, not the short-term internal variability within the system. Temperatures have been undeniably rising in the long term, which is exactly what we would expect under greenhouse driven warming:
“Temperatures have been undeniably rising in the long term, which is exactly what we would expect under greenhouse driven warming:”
*WHICH* temperatures are going up? Your chart doesn’t show.
If I give you three average temperatures, 50/51/52, can you tell me what maximum temps and what minimum temps caused those average temps?
If I give you three anomaly temps, .10/.11/.12, can you tell me what average temps caused those anomalies? Can you tell me what minimum and maximum temps generated those average temps?
If you can’t give me those answers then how do you know they were greenhouse driven warming?
“Warming is consistent with warming.” Duh.
Meanwhile, Earth’s surface has been and still is warming faster than the lower troposphere, which is completely antithetical to ‘what we would expect under greenhouse driven warming’.
How? How do you correct for something that varies and that you have no framework to establish estimates? The best way would be to place a temperature station nearby that was in an uncontaminated location, but then why on earth would you need the contaminated site?
We don’t have time machines (yet), so can’t go back in time and place perfectly cited stations around the country. What we can do is use the context from neighboring stations to help ensure that the target station is as representative of the surrounding region as it can be.
An absolutely critical thing to note is that a station situated in an urbanized area is not by default “contaminated.” Urbanization is a real phenomenon that has a real impact on surface temperature trends. The challenge with urban stations is that we want any given station to represent a wider area than the single point location where the station sits. If the station’s neighbors are all urban, then we can assume the station’s urban trend accurately reflects the region between itself and its nearest neighbors. If the station’s neighbors are all rural, or a mix of rural and urban, we can assume that the station’s trend should be adjusted to make it reflective of the surrounding region.
The is the basic idea behind the Pairwise Homogenization algorithm or other similar approaches.
The idea that UHI is not contamination would be fine if the data were presented in way that provides both climate warming and UHI effects. It’s not. End of discussion.
Lol am I witnessing a talking point emerge or has this line been around a while? You can’t neatly separate out each component of the warming into “GHG driven” and “Land use change driven.” You can estimate the forcing resulting from observed GHE or land cover changes and model how much warming that forcing produces and then compare that to observed temperatures, which is exactly what scientists do, but there is no way to start with tidily separated data.
I see. So, the only thing we know for sure is that the UHI causes warming. Any claim about climate change is pure speculation. Since there’s no way to separate UHI from other potential causes, shouldn’t it all be presented as UHI?
It should definitely be presented as all speculation.
UHI causes warming but gridded datasets implement measures to ensure that urban warming isn’t overly-represented in the dataset. This means that urban warming has only a very small impact on global trends. We know how much warming is produced by CO2 because of the underlying physics. It would be wrong to present incorrect information.
What measures do they use? UHI affects can be seen many miles out into rural areas downwind of the UHI. How is this accounted for?
If you can’t neatly separate out each component then how do you ESTIMATE the forcing resulting from each?
Once again, you are trying to support GUESSES as being data!
You don’t estimate climate forcing from temperature observations, you estimate climate forcing then model temperature change resulting from that forcing, then compare your results to observations. That is, the forcing is derived from the physics, not the observed change.
How do you compare model outputs for future temps to future temps that haven’t happened yet?
Why do most of the models using RCP 8.5 and 4.5 deviate from observations so much?
Apparently their “forcing” is incorrect. It has been so for almost two decades now. When will the models be fixed?
Models capture surface trends fairly well:
There is a subset of models in the latest CMIP6 experiments that are producing sensitivity estimates that are too high, but I think understanding why is an active area of research. But overall models do a good enough job to tell us very clearly where most of the warming is coming from:
How can climate models capture surface trends well when not even weather models can do so?
Take your first graph. Almost ANY slope of trend will fit in the uncertainty interval that is shown, from negative to zero to positive from the year 2000 on.
You ignore the uncertainty and only focus on the stated values of the data points. That’s the problem with the whole concept of a global average temperature!
How do you discern *anything* with an uncertainty area that large. BTW, that is not an actual uncertainty interval either. I suspect it is the area covered by the individual models. That is *NOT* measurement uncertainty, it is model uncertainty – two entirely different things!
Weather models try to emulate the behavior and evolution of a specific weather system over time, whereas climate modeling is trying to capture the evolving nature of such systems over the long term. For instance, it is extremely difficult to model the exact features of a specific individual hurricane, but climate models do a very good job of capturing the behavior of hurricanes. Run a climate model for a long time and you’ll see realistic storm systems form and dissipate, but you likely will never see a specific storm that occurred in the real world.
You can hypothetically fit a line of any slope within a narrow enough region of the interval, but the models show a warming trend that approximates observations, so we’re not working in the realm of hypotheticals.
I call BS.
“Weather models try to emulate the behavior and evolution of a specific weather system over time, whereas climate modeling is trying to capture the evolving nature of such systems over the long term.”
Malarky! Climate is based on the temperature profile at a location. That INCLUDES the weather at a location. There is a *reason* why the climate in England is not the same as the climate in France. It’s because the weather in England is different than in France because of the geography!
” For instance, it is extremely difficult to model the exact features of a specific individual hurricane, but climate models do a very good job of capturing the behavior of hurricanes.”
Is that why the climate models predict more hurricanes while the number of hurricanes is decreasing? Is that why the climate models predict the Arctic should already be ice free – but it isn’t?
The climate models don’t predict *anything* except rising temperatures and we don’t know if that is rising max temps, rising min temps, a combination of both, whether some parts of the globe are seeing much higher max temps while others aren’t, etc.
” Run a climate model for a long time and you’ll see realistic storm systems form and dissipate, but you likely will never see a specific storm that occurred in the real world.”
Climate models are iterative. Thus a small uncertainty at the start of the run grows with each iteration, eventually causing the model output to become physically impossible. Thus the models are artificially tuned to not blow up. Anytime artificial tuning is required, e.g. parameterization that can be adjusted, then the model is basically inaccurate and who knows if the storms it predicts mean anything!
“You can hypothetically fit a line of any slope within a narrow enough region of the interval, but the models show a warming trend that approximates observations, so we’re not working in the realm of hypotheticals.”
The models do *NOT* approximate observations. Even the IPCC says this for the latest run of the models. That means the models are actually useless for anything. Every year the future projections become more and more religious dogma based and less and less physics and real-world based.
Have a close read of the compounding of uncertainties in iterative climate models by Pat Frank at Stanford.
Not possible to use such models for political outcomes of enormous magnitude. Honest scientists would call a halt before models were taken seriously. Geoff S
AlanJ,
In short, your emerging talking point was in action before US Congress in 1988 when James Hansen spoke of human attribution now detected. This was a rogue statement contract to overwhelming science then understood.
Richard Lindsey had noted that anthro had not been separated from natural.
Two camps developed. The honest one said there was no measurement data that allowed attribution and there still is not. The Establishment used models incapable of separating and with many subjective inputs, to claim separation without supporting measurements.
The Establishment failed to create significant, fruitful experiments to see if the separation could be detected, let alone quantified. They resolutely stuck with wrong, missing and adjusted data to claim settled science.
The failure of the Establishment to perform correct and appropriate studies is the reason why Anthony Watts and Heartland made the post here, the one that your naive enthusiasm is “rediscovering” 30 years after the debate.
Have you actually opened any of the data links offered here already?
Geoff S
New tablet, new ways to alter my words at the last moment.
A word program that homogenises for me.
Apologies, should be Lindzen, also should be “contrary to overwhelming science”.
Geoff S
Our current heat wave in Seattle has been reported by at least the ABC station as being exacerbated by the urban heat effect, up to 20 degrees F in some places. I was shocked at the honesty. But then they went on to say that climate change is racist because people of color mostly live in the urban areas and it affects them more. So there’s that.
If all you were after was temperature change, you might be right. However, this information is being used to show how CO2 effects changes in temperature. That is a far different thing that what you assert. Try addressing how UHI affects the assumptions of GHG’s changing temperature. Don’t deflect into another argument.
As to homogenizing, which temps here in the attached image are correct and which are not? Why would an average give you a more accurate picture? What is the standard deviation of the temperatures shown? Is that carried through further calculations so the variance can be seen by all?
Jim,
You didn’t really expect to get an answer, did you?
Homogenization addresses discontinuities in time-ordered observations, not individual measurements. What exactly is your level of awareness around the various adjustments being applied?
Huh…..?
Homogenization is “averaging” various points to come up with a value. That value is then used to adjust prior and subsequent time-ordered observations.
If you have a discontinuity is a time-ordered observation of temperatures then how does homogenization help anything? You just wind up putting the calibration problems and measurement uncertainties of a bunch of stations onto another one.
How does that help anything become more accurate?
Homogenization is a way to adjust discontinuities in a time series. You do not homogenize singular data points – what you are adjusting is the trend. Discontinuities can appear either as step-breaks in the series (sudden) or gradual drift in the station trend. You cannot always identify such discontinuities, but where they can be identified they can be accounted for.
Recommend you read Menne, et al. 2009, as it lays out an automated approach for the implementation of a pairwise homogenization algorithm that is widely used.
If homogenization is used to calculate an adjustment factor then it affects all SINGULAR data points which is what defines the trend!
“Discontinuities can appear either as step-breaks in the series”
How do you determine what caused the break? Was it device related or micro-climate related. If it was microclimate related then why should the temperatures be adjusted at all, it could be accurately representing the temperature profile at its location. So why artificially change the data it is generating.
“gradual drift in the station trend.”
How do you know what caused the gradual drift? Maybe Dutch Elm disease decimated a nearby forest over a couple of years thus gradually changing the actual climate at the measurement site. The measurement site may be accurately representing the temperature profile at that site. So why artificially change the data it is generating.
“You cannot always identify such discontinuities, but where they can be identified they can be accounted for.”
Just because a discontinuity happens it doesn’t mean that they have to be accounted for. The measurement device may *still* be accurately representing the conditions at its site.
All you are saying is that GUESSES at what a station should be reading are more accurate than actual measurements. If the calibration is suspected then go to the site and re-calibrate the station and start a new record. You don’t know what the past calibration was so you can’t accurately adjust it. Go to the site and examine the microclimate. Did it change? You likely won’t be able to tell unless someone has documented the site over time using pictures.
Typical statistician – just change the data to make it say what you want!
The whole point of combining station records is to obtain regional records of climate change – each station needs to represent a larger area than the tiny point location on which the station itself sits. We do not want changes that impact only a single site to be smeared around into the surrounding area. If we wanted merely the specific history of that exact site we would use just the single unadjusted record from that site.
Impossible! Typical climastrology windmill tilting.
“The whole point of combining station records is to obtain regional records of climate change – each station needs to represent a larger area than the tiny point location on which the station itself sits.”
Magic! Just plain magic, hand waving, and religious dogma.
That’s like saying that measuring ONE board coming out of a sawmill accurately represents all boards coming out of that sawmill!
There is no *need* to do anything of the sort! Other than to somehow try and confirm religious beliefs I guess!
“We do not want changes that impact only a single site to be smeared around into the surrounding area.”
You didn’t answer the question I asked about this! How do you know that a change at a single site isn’t representative of that location? Are you God? Are you omnipotent? Are all the climate scientists omnipotent?
“If we wanted merely the specific history of that exact site we would use just the single unadjusted record from that site.”
In other words: “let’s just guess at what that station should have recorded because we are so wise and smart!”
I’ll ask you again, why are temperatures on the north side of the Kansas River Valley always different than the south side?
Which set of temperatures are most representative of the surrounding area? Since you are a climate GOD then you *must* know. Please tell us!
Look at your logic. A trend is made up of singular data points. The singular data points are used to create a mean, for good or bad. For you to say that modifying a trend does not change the singular data is absurd to say the least.
Either the trend is made up of individual parts or it is not. You can’t adjust the sum and ignore how the parts add up.
Do you have any experience in MAKING things? The individual parts are critical to the finished project. Your world is turned upside down. Those of us educated in the physical sciences see measurements, what phenomena is being measured, what functional relationships exist and the math behind them. Too many climate scientists and mathematicians view the world from the other side. How do you make math work out to show what I want. What statistics can I use to create the value I need. It makes you more interested in the trend than what causes it.
It why mathematicians ignore significant digits. It is why statistical error is more important that measurement uncertainty and error. You haven’t once discussed drift in measuring devices. Nothing about physical surroundings that affect measurements. Nothing about physical calibration effects. Nothing about the resolution of the data. Your whole attention is on how you can manipulate the statistics to obtain an answer you think is correct and means something.
I’m not saying the individual data points aren’t moved during adjustment, I’m saying the basis of the adjustment isn’t how different a single observation is in one location is from a single observation in another location. Breakpoints are identified in the trends of the time series.
All of this stuff is the subjects of the adjustments you don’t believe should be performed.
“I’m saying the basis of the adjustment isn’t how different a single observation is in one location is from a single observation in another location.”
Malarky! You have to compare the readings of the measurement device against SOMETHING in order to determine an adjustment is needed!
The slope of a trend can *NOT* be used to determine an adjustment value for another trend. Not unless you assume that the conditions at each location are *exactly* the same. Since the stations are at different locations with different microclimates you can *not* assume the same microclimate exists at each location.
Clouds, wind, elevation, pressure, terrain, geography, etc determine the slope of the temperature profile at a station location. Those simply can’t be duplicated between stations.
Oh come off it, Alan.
Many of us here were active when Menne published and some of us commented.
You are today doing little more than select links to past work that you like. You can do that privately because it is having no effect on this public except to waste time trying to direct you to other work.
Maybe you are thinking of study for a tertiary qualification, but it is best to gain such qualification before commenting here. Also experience, of which you repeatedly demonstrate a lack.
Geoff S
And assume that there is no such thing as a local microclimate.
If you adjust a station to look like that of its neighbors, then why bother with the anomalous station? Replace it with an altitude-corrected (lapse rate) average of the adjacent stations. Surely you wouldn’t expect an oasis to have a diurnal temperature profile that looks like the surrounding desert. Just as UHI is real, the microclimate of the oasis is real.
All of your logical assumptions are in fact baseless conjecture – how on earth can you adjust for UHI that you cannot estimate? Every study done on UHI confirms the same thing: it changes with urban activity and solar activity from day to day, season to season. The total amount of heat due to urban activity, as well as reflected and absorbed heat cannot be accurately estimated – the only possible way is to have another temperature station outside of the UHI contaminated microclimate – comparing the 2 readings for the same is the only way of determining the full impact of UHI. And yes, it will be increasingly important to identify the UHI component of an urban microclimate, especially if we are about to vastly increase it with a multitude of car recharge ports (more electric cables = more resistance in the materials = more heat). We already know that significant urban microclimates affect weather patterns around them – we need to quantify UHI, identify how it changes and investigate how, exactly, this will affect other weather patterns. Sticking your head in the sand and waving your hands will no longer be a viable option.
“the only possible way is to have another temperature station outside of the UHI contaminated microclimate – comparing the 2 readings for the same is the only way of determining the full impact of UHI.”
UHI gets spread out into rural areas via wind and conduction. By the time you find an uncontaminated site for comparison it will probably be too far away for correlation based on distance, elevation, terrain, and geography.
That is a big problem in the more developed countries – how do you site another station outside of a UHI microclimate that is representative of the original site without the UHI component? Without mapping the extent and the way that the UHI changes within each urban microclimate I couldn’t guess but I think it would be possible.
“What we can do is use the context from neighboring stations to help ensure that the target station is as representative of the surrounding region as it can be.”
How do you do that? Hubbard and Lin showed in 2006 that adjustments *MUST* be done on a station-by-station basis! Why are so many climate alarmists ignoring that well done study?
If you can’t go back in time to place new machines then neither can you go back in time to determine the calibration status of machines in the past! Any adjustments are GUESSES! Guesses are not data!
The PHA does perform adjustments on a station-by-station basis. Each station receives a station-specific adjustment (or no adjustment) based on the trends of its neighboring stations.
Total fraud, vaporware.
Again, correlation of temperatures between two stations is based on vector distance, elevation, terrain, geography, and probably several other factors.
You totally mis-construed the restriction of doing adjustments on a station-by-station basis. You must *evaluate* the adjustments on a station-by-station basis. Hubbard and Lin specifically concluded that regional adjustments (i.e. based on neighboring stations) only ingrained calibration offsets at those stations into the others!
Really?
Consider as an example the photo of the station given just below the start of the above article: if the wind blows from the direction of the stone wall and parking lot in from of it, one would expect its mid-day temperature readings to be noticeably higher than if the wind direction was reversed (i.e., coming from the background tree-shaded field).
The point is that UHI biases in data measurements would NOT be expected to be constant, but instead to vary with local weather conditions (although on long-term average still remaining on the hot side of truth). Given this, I cannot see a practical way to mathematically filter out this, short of doing year-long “calibrations” of each station using a reference not subject to UHI effect at each station location. Clearly, that ain’t gonna happen.
Metadata for station changes don’t cover all the environmental changes surrounding a temperature station. Parking lots, building changes, tree growth and new plantings, nearby land use changes are not available nor recorded.
Even in rural areas. I assume such changes in rural areas would have an amplified effect.
You left out ground effect. When summertime green grass under a station turns brown in the winter what does that do to the calibration of the measurement station. Certainly the heat effects on the station will be different!
Surface temperature stations were never intended to be used for climate science. They were originally located at urban airports for air travel and local weather.
That no one ever divided the earth into equal areas and located one station in each area at mean altitude free of any heat island effect is how you know this was never about science, always about propaganda.
This ^
Just to be the Devil’s Advocate, why were weather stations established before air travel became common? Might agriculture have been an influence? Or, simple curiosity of amateur scientists like Thomas Jefferson and Benjamin Franklin?
Berkley earth already looked at tens of thousands of temp stations and concluded warming is real and there’s no UHI distortion.
Griff, let me just say this, with all sincerity. You are unable to assimilate new information.
That makes you a brainwashed fool.
Hey, Anthony, why don’t you just censor him as is done on CliSciFi sites?
Don’t. He’s entertaining.
Christ, downvoters! I refuse to apply /sarc to my comments.
I knew what you meant. I wouldn’t worry about Alarmist Trolls downvoting you.
griff,
Your first mistake was in giving objective credibility to Berkeley Earth.
Berkeley Earth’s founder and current head, Richard A. Muller, stated this to the New York Times according to Wikipedia:
“On July 28, 2012, he stated, “[G]lobal warming [is] real …. Humans are almost entirely the cause.”
— https://en.wikipedia.org/wiki/Richard_A._Muller
Your second mistake was in posting that unsubstantiated claim here, in your typical fashion of not including any supporting reference paper or link to such.
Your third mistake is in not learning from your previous continuum of mistakes.
griff lectures Anthony Watts on “mistakes”.
Let us all know where your website is griff, we all need a good laugh.
🤣 🤣 🤣 🤣 🤡
Muller claimed that prior to this study he was a skeptic. Then people found many quotes from prior to the study indicating that he was fully bought into the CO2 caused all warming meme.
If he’s willing to lie about something that is so easily checked, what else is willing to lie about?
That quote is a great response for people I’ve Nick Stokes who insist Berkley Earth is an organization of “SKEPTICS.”
😆😅🤣😂
Go back to sleep griff.
when you only look for what you want to see, you only see what you look for. That’s the entire motivation for all the watermelon warmunist drivel.
“when you only look for what you want to see, you only see what you look for”
This is called “living in a delusion”. A lot of people do this. Too many.
Of course actual scientists an statisticians have examined Berkley’s work and found many problems with their conclusions.
It was an improperly conducted analysis. It failed to account for prevailing winds removing heat into adjacent rural areas.
Take a look at the following satellite thermal image and tell me how the UHI effect could not bias the average temperature when most of the weather stations are urban.
Nice even roads show up warmer.
The rural surface temperatures are 10-20 deg C cooler than the cities, yet make up the bulk of the scene.
griff? Hello, griff?
Griff mate
Berkley earth did not look at any temperature stations, they looked at the adjusted temperatures provided by the stations
The only team that looked at the temperature stations sitings was led by Anthony Watts and published in the peer-reviewed JOURNAL OF GEOPHYSICAL RESEARCH, VOL. 116, D14120, doi:10.1029/2010JD015146, 2011
Even NOAA has accepted the findings of the paper
Go away, read the paper in the link above and then come back to us when you have a sensible argument
Berkeley Earth project started with at least some raw data. We exchanged notes and metadata from Australia, just about all that we could find. I have now lost track of what they did with it to attract criticism here. My expectation at the time, many years ago, was that the data would be too noisy to be useful for detailed work. There was a vast lack of many types of metadata that had to be present for researchers like Berkeley Earth to understand what the temperature numbers were capable of revealing.
That is still the case. It cannot be overcome, the data collection effort has passed into history without adequate records of conditions affecting them. The present problem is mostly people trying to use historical data that is not, was not, never was suitable for their purposes.
Geoff S
This result is disappointing but not surprising. NOAA has no incentive to put a damper on global warming; the opposite is true. And that is why they never mention USCRN results—would expose the inherent bias.
Temperature records not fit for purpose since overheated.
Climate models parameterized to best hindcast a match to not fit for purpose temperature records. So yet another reason models run hot.
“And that is why they never mention USCRN results”

Of course they show USCRN results; they are plotted on the site. A more surprising absence is mention in this article. Because the comparison of CRN with ClimDiv, which averages these supposedly corrupted sites, gives identical results:
 
“Average”
I live at no. 142.
My good friends live close by at no. 164.
So on average, we all live at no. 153.
Except – no we don’t.
The Lovelocks live at no. 153, and we don’t talk to those pompous buffoons. And vice versa.
Perhaps you should.
WRONG AGAIN, NICK “RACEHORSE” STOKES
I’m referring to monthly and yearly climate reports by NOAA. Learn to read without cherry picking.
I was re4sponding to Rud, who I quoted.
But to continue that quote
” And that is why they never mention USCRN results—would expose the inherent bias.”
And what it in fact shows is that there is no bias.
Did you ditch your extra blanket yet 😉
“Because the comparison of CRN with ClimDiv, which averages these supposedly corrupted sites, gives identical results.”
Ummm . . . Nick, would that be the average before or after ClimDiv has “homogenized” the raw data from the reporting stations?
I’m betting it’s after.
In other words, GIGO.
What? . . . you think that NOAA doesn’t have a dog in this race?
“In other words, GIGO.”
If it is G, how does it so closely match the definitely unhomogenised USCRN stations?
Then why bother with data mannipulation?
That has been my point for years now. Claiming that all the different changes makes no difference, then why are we even bothering to do them? For those doing the changes this is a stupid argument!
And cogent answers (or any answers at all) are never provided.
Because the changes require an adjustment. It would be malpractice not to do it. You don’t know the various adjustments will cancel until you have done them. There could have been a bias.
Changes never justify creating new information to replace old data. Name one scientific pursuit that allows one to replace old data with new calculated information to use in statistical analysis. Would you allow a nuclear power plant to modify old radiation measurements because a new sensor showed a change in results? Would you allow a water treatment plant to go back and change previous measurements of concentrations of carcinogenic compounds? Would a company allow a quality engineer to change previous SPC values because a new measuring device was purchased?
And you claim to know the magnitude of each and every bias?
All hail the all-knowing Nick Stokes!
Nick,
If you do corrections to gold mine assays, that IS malpractice.
What is the special plead for climate change?
Geoff S
Why do you think that’s a close match? We’ve agreed variance between the two reaches 23.8 percent, that’s not what I consider, no matter what the rest of the lines do.
Also, it’s pretty obvious that if you rotate the ClimDiv line around the 2012 or 2013 points it will lie much more closely to the USCRN line.
Why is that?
I don’t know how consequential it is, but some of the requirements for CRN 1/2/3 are challenging to meet without human assistance outside of arid areas. CRN 1 requires “Grass/low vegetation ground cover <10 centimeters high.” CRN 2 and 3 require “Surrounding Vegetation <25 centimeters.” Reference: https://www.ncei.noaa.gov/pub/data/uscrn/documentation/program/X030FullDocumentD0.pdf which appears to match https://wattsupwiththat.com/2007/07/03/standards-for-weather-station-siting-using-the-new-crn/
I have panoramic photos of the two CRN sites in New Hampshire that are located in fallow(?) farm fields that I took on May 15th. One field had grass pushing up the dead grass from last fall. I’ll see if I can make it back to them and get summer photos with a yard stick.
After breakfast I’ll see if I can post them here or online.
The same text is in the 2022 report, page 6.
This should link to my FaceBook post for the photos. Instead of the ridiculous link below, you can also simply start at https://www.facebook.com/ric.werme
https://www.facebook.com/ric.werme/posts/pfbid0jYG9x1f8faPAAnR8ZeN9bjPut41xSjAMp3Njm4ym6N5QmTwL5SkZi2hLHy8u2fNKl?__cft__%5B0%5D=AZXcGRErUNW8Jwqv6ENHbYsLKQLX3yvl5hrz_626lc17lSfjtd4NGdsgs2T7a-9VLwT8A6mPqenuf14gJK7bCiQEnKlF_F_wlDIiY5jr7H9oc-p2YysXIN76fpYauiNeWFosPsTFatj09BiBRZkYNvPEpoWGnrQgoVjpHPzisgwihA&__tn__=%2CO%2CP-R
Ric,
Looked at one of your photos. What happens in winter when that grass turns brown? Does the calibration of the measurement station change from summer to winter?
It shouldn’t – the CRN site data isn’t adjusted.
Here in New Hampshire, the ground generally turns white in the winter. 🙂
I am deeply grateful to Anthony and the entire SurfaceStations team of volunteers, for your hard work in the cause of sound science.
Can you please add a link to this work, on the SurfaceStations.org web site?
of all the lies and fraud that make up the climate jackals hoax, temperature measurement is the most fraudulent, imo.
is it possible that a new standard for device location be proposed?
should we even be measuring air temperature to determine global temp?
is it just me or does anyone else here see how preposterous it is to place a device anywhere near a uhi or source of heat or cold caused buy human activity.
if the greens are insisting world policies change to stop human caused global warming, then the method of data collection must be designed to measure temperature with zero temperature influence from human caused activity. you can’t have it both ways.
Congrats, Anthony, on the success and speed of the new Surface Stations Project….and to all WUWT visitors who helped in the endeavor.
Regards,
Bob
PS: A question, Anthony: Didn’t NOAA claim they were going to fix the problem after the first go round?
Yes, they did. Instead, they threw more money at climate modeling.
There is nowhere in the terrestrial landscape that has not been impacted by human influence. Over 50% of the global land surface has been directly and deeply influenced by human activity since the advent of gas powered machinery. This creates confounding correlations.
Outside the cities, or in parkland and lawns, the soils have eroded to mineral rock flour, not unlike concrete. This due to the extraordinary slowdown of nutrient cycling and biological activity in soils. Exotic vegetation with shallow roots such as soybeans, corn, and turf grasses have changed energy flux. Additionally, seeds for drought tolerance in the eroded soils have been selected that minimize evapotranspiration, severely limiting heat flux away from the surface.
Soils and wetlands drained, forests felled, grasslands plowed. Soil moisture reduced to nil. Landscapes actively drained with innumerable culverts, ditches, and other drainages. The oft-omitted part of surface energy budgets for any location, advection, mixes this human influence over 100% of the terrestrial surface. The concession must be that the heat island effect is not limited to cities, but to the entire landscape and beyond.
Factoring these influences into temperature analysis renders GHG sensitivity considerably less. Temperature can change, and it can be related to human activity as the entire system is rendered to a heat sink. Adjusting temperature to remove these human influences obscures the very real human influences on temperature. Under current global warming hypotheses, the warming definitions and influences have been poorly defined.
Good points here. I am thinking of the interstate highway system and all of the lesser roads. It is an astounding amount of paving added in the last 100 years in the U.S.
Cumulative change to land surface properties not only impacts temperature, but the associated pressure dynamics and gradients. Stationary high pressure systems persist over the eroded continents due to increasing vapor pressure deficits. Zonal jets interrupted and must wrap around these pressure anomalies spinning off vortex eddies of anomalous extremes. Practically everything observed outside of supposed natural variability is associated with land surface properties. The current strategies pushed by people like Gore and Kerry will continue to undermine environmental restoration and facilitate ongoing degradation of Earth systems. The global indirect solutions for weather hazards cited by the political class and reciprocated by publicly funded academics and subsidized media is net damaging. The political gridlock is a consequence of a poor characterization of problem definitions. It is net damaging to humanity and biosystems. Politics has created a feedback loop in media, academia, and financial markets where reality has been cast aside. Scientific reductionism to suit simplistic concepts has been a disaster. Meddling with the concentration of atmospheric gases will be a centuries long exercise and will do nothing to quell the weather hazards discussed daily in media today. Ocean buffering will give every ounce of CO2 back to the atmosphere that we cut for many generations to come. The story being sold is undeniably damaging to societies and environment. Every effort on this website to shine some reality on the situation is welcome.
Where did the White Cliffs of Dover come from? Or the Dolomites in the Alps chain? Or the hundreds of feet of Paleozoic limestones across all the continents? Even today, limey muds are accumulating in the Bahamas.
Ocean is a saturated buffered system when it comes to dissolved carbon balance with atmosphere. Atmospheric CO2 will continue to rise regardless of what’s happening with fossil fuel emission until the ocean-atmosphere system equilibrates.
This will take centuries even with net negative human emission, and as you mention, the processes of biological sedimentation of accumulated shell, coral, algae, etc has moderating effect by removing a proportion of dissolved carbon from the ocean-atmosphere system.
The limestone accumulation is a much slower process than the equilibrating process of ocean-atmosphere. Every ounce of CO2 cuts from emission will be given back to atmosphere for centuries, until such a point as the ocean-atmosphere system equilibrates.
Limestone accumulation + CO2 emission cuts will bring this equilibration date some short period sooner in later centuries. Additional carbon sequestration into stable soil organics can also have some effect. Unless, of course, the Earth system finds another way to cool.
It is a plainly a lie to suggest atmospheric CO2 emission reduction will have any observable impact on greenhouse effect. Those pushing this narrative will cause net harm to humanity. Because scientists and politicians feel so close and so personally and emotionally passionate they will never admit this.
Could you explain a bit more. In particular where do you think the excess CO2 in the oceans is coming from that will be released in the future, even if we put no more into the atmosphere. Is this storage from the Little Ice Age or is it just that the oceans are slowly warming thus releasing CO2?
@Alastair
In unperturbed systems carbon drawdown rates exceed oxidation rates in ecosystems/soils. For thousands of years human land- development has reversed this process, sending thousands of billions of tons of additional oxidized carbon into the atmosphere ocean system. In unperturbed systems the soil contains 10x the organic mass compared to what is observable above the surface as vegetation, etc. Recently fossil fuel emission is contributing as well. The ocean has absorbed much of this content over millennia and will continue to give it back while the atmospheric temperature is relatively warm. The equilibrium state of atmosphere oceans is largely controlled by the relative temperatures between the reservoirs. Human emission has revered the relative atmospheric deficit under the current warm state of the atmosphere. Human emission cuts will create a relative atmospheric deficit that is immediately filled under the currently observed system dynamic state.
47,000 miles of interstate highway, probably with a minimum of 50 feet of width, giving 1.2E10 square feet, or about 450 square miles for just the interstate.
JCM,
Please take a trip through outback Australia to see how wrong you are. Hours and hours of driving with little evidence of the Hand of Man. Even more so in Antarctica. Then, confided the oceans over 70%or so of the global surface.
Your comments above correct for here and there, but are insular. Geoff S
@ur momisugly Geoff Sherrington
Evidence of the Hand of Man is broader than you think.
There are very few places that remain where the soils have not eroded. Erosion = the depletion of soil organic content i.e. the compost. This is much broader, of course, than the agricultural landscape, industrial parks, or residential developments.
You have chosen a nit pik with the ice sheets, but you bring up an interesting example with the arid landscape of the outback.
Even there, the impacts are evident via teleconnections and species eradication. The desertification of western australia directly by soil disturbance parks blocking stationary highs reducing precipitation propagation inland. The same is experienced in USA with the drainage of the Great Valley. Without water there is no nutrient cycling into soils.
Perhaps most importantly, and practically invisible, is the eradication of species from the wildlands. The practical eradiation of Cassowary, Bandicoots, Potoroos, Lyrebirds, and Scrub Turkeys, etc etc etc in Australia has rendered nutrient cycling to a stand still in the wildlands.
The carbon nitrogen ratios from US national parks to the Outback, and to the interior of most continents in lands apparently untouched to the untrained eye, have gone way out of whack. The lack of nitrogen excretion by rodents, birds, and larger mammals has rendered decomposition and composting of available litter to nil. Soils are eroding, and most people appear to be unable, or unwilling, to comprehend. Without compost process, and development of beneficial fungi, bacteria, and protozoa in soils, the only option left is fire and erosion. The oxidation of over 50% of the earth’s land surface.
JCM,
Have you ever been to the outback?
Have you ever seen the vast areas where even a bandicoot would have trouble surviving? There is far, far less disturbance from the Hand of Man than you imagine. Also, changes in species numbers is sometimes due to people, but can also be natural. How you differentiate, or how you would even want to, eludes me. Geoff S
Changes can also increase the census of individual species. Take deer, wild turkey, quail, pheasant, and other game animals here in Kansas. More and more agriculture have *increased* the population of each of these by providing more food than can be found in the wild. Hunting of these animals prevent entire herd elimination from starvation by overpopulation and disease.
As Freeman Dyson said, your studies of the biosphere have to be holistic and consider the *entire* biosphere.
I’ll concede as a Canadian i’ve only spent two seasons in Aus, in QLD in the tomato sheds and another on butternut squash near Bowen. However the overall premise stands. Take a gander zooming in random places on google maps and estimate the amount of land surface disturbance. I do not think it’s much in question the amount of land surface altered. Minimum 40%, and up to 60% factoring in indirect wildlife abundance changes and their impact on soils. I’ll back down on the outback, but it was only meant to offer a perspective not often considered. cheers.
All you need to know about UHI:
Not that photo again. Where’s the real analysis? While I can readily believe that going from 77-86 (9 degrees) means a 10 degree change in asphalt temperature, how can you claim that from 86-87 (1 degree) means an 8 change in asphalt temperature?
I call BS.
Ric, have you done measurements at that location tracking air vs asphalt temperatures on a sunny day? Here in desert Las Vegas I don’t walk my dogs on asphalt or concrete surfaces mid-morning to late-evening during the period late spring to early fall.
Grassy (spotty grass notwithstanding) dog parks are great fun for them. The Pug Dogs I’ve had had to use the large dog areas because they were and are manly little men. Small foo-foo dogs can’t handle them because they grew up tussling with large, active dogs.
That’s not my point. Of course black asphalt (and even neutral concrete) heat up in the sun (and then heat the air above them). My gripe that I can’t believe a one degree change, err, let me turn that around, an eight degree change in asphalt temperature leads to only a one degree change in air temperature.
I suppose it could if the air column destabilizes at 87°F, but that would be extremely dependent on local conditions and the next day would like have a different atmospheric temperature profile. At any rate, whatever day you see that sign, it’s probably wrong.
Heck, in New Hampshire I minimized time spent on sunny asphalt. I could measure my dog’s discomfort level by how enthusiastically and how far she would go into local rivers. Legs only in May, all but ears in July.
Does it matter the exact numbers on the sign?
If the air temp is 87 and its pouring rain, do you think the pavement will be 143?
If the air temp is 87 and it’s nighttime, do you think the pavement
will be 143?
If the air temp is 87 and the sun is shining brightly — yeah, I can buy the pavement might be 143.
You are basically starting to summarize all of the things that cause measurement uncertainty. Measurement uncertainty isn’t just based on resolution or calibration. When an instrument is calibrated it is done so under exacting conditions. Barometric pressure, air velocity, humidity, response time, and other specific conditions. Unless your device is used under those exact same conditions when taking measurements then there will be additional uncertainty.
The “temperatures” being used for all this make the assumption that temperature is a good proxy for the amount of heat at a certain location. That is so far from being true it isn’t funny. Trying to “average” temperature differences from all over the globe ignores all these changing conditions and the metric that is derived simply can’t be proved to be meaningful. The absolute value of UAH may be questionable, but at least it is a consistent measurement over the whole globe using the same device at the same location. You can’t say that about thermometers on land or in the sea.
Just take your shoes off and walk bare foot on a hot summers day anywhere if the temperature is over 25C in the shade .
Walk on the grass verge , thats ok then walk on a concrete side walk , oh thats getting hotter .
Then step on to the black bitumen wow that burns so jump on to a white painted line on the bitumen ,that is cooler than the concrete path .
Don’t take my word for it ,you guys in the northern hemisphere just go out and do it tomorrow .
Just don’t blame me when you burn your feet .
What so many people do not realize is that the air temperature is measured in the shade ,or it should be under a Stevenson screen and over grass and well away from black top roads or hard surfaces .
Not in direct sunlight which will always be warmer than correctly used thermometers in shade .If you don’t believe me put a thermometer on bitumen and see for your self how hot it can get .
Put one under a tree close by .Tell us your results on a warm 28C in the shade day .