Guest Post by Willis Eschenbach
Let me start with a quick run through how mainstream climate scientists think the climate works, and then my hypothesis on how the climate works.
The central paradigm of modern climate science is that changes in the global temperature are a linear function of the “forcing”, the total energy input to the planetary surface. This is generally expressed as an equation:
∆T = λ ∆F
The delta “∆” means “change in”. The lambda “λ” is a constant called the “climate sensitivity”. “F” is the forcing, in watts per square meter. And “T” is the temperature. So the equation says:
The change in temperature ∆T is equal to the climate sensitivity λ times the change in forcing ∆F.
Me, I think that’s nonsense. If it were true, the global average temperature would go up and down like a yo-yo on steroids. But it doesn’t. Over the entire 20th century, the temperature increased by about 0.2%. Two-tenths of a percent. And this is despite monthly temperature variations at many locations varying by 30°C or more (~10%), so it cannot be from “thermal inertia” as many people claim.
My hypothesis is that this temperature stability is due to the thermoregulatory effect of a variety of different emergent phenomena. These include tropical cumulus cloud fields, thermally driven thunderstorms, dust devils, cyclones, and most relevant to this post … the El Nino phenomenon.
[UPDATE: What follows is a greatly simplified version of the circle of events of Nino Neutral/El Nino/La Nina and repeat. People wanting a detailed explanation can read Bob Tisdale’s 550 page book on the subject. Otherwise, here’s the TL;DR version.]
The El Nino phenomenon is a curious beast. When the Pacific Ocean gets hot off of the coast of Peru, this is called an “El Nino” condition. As it decays, it is succeeded by an increase in easterly trade winds. These winds blow the warm equatorial surface waters to the west, cooling the ocean surface. This is called a “La Nina” condition. Here is a graphic of a cross section of the ocean looking westward from 90° West, off of the coast of Peru.

Figure 1. 3-D views of the top 500 meters of the ocean, from 90° West (off the Peruvian coast) to 140°E (near the Asian mainland). Left graphic shows the El Nino condition, right graphic shows the La Nina condition. Colors indicate temperature.
In Figure 1, you can see how the wind literally scoops up the warm surface water and pushes it westward clear across the Pacific. Here are two images showing the changes in the sea level during the El Nino and La Nina alterations.


Figure 2. Changes in the sea surface elevation during El Nino (upper panel) and La Nina (lower panel)
Once the warm water arrives at the west Pacific islands and the Asian mainland, it strikes the land and divides in two, with part of the warm water heading towards the Arctic and the rest heading towards the Antarctic. Figure 3 shows the warmer tropical surface water being pushed polewards.

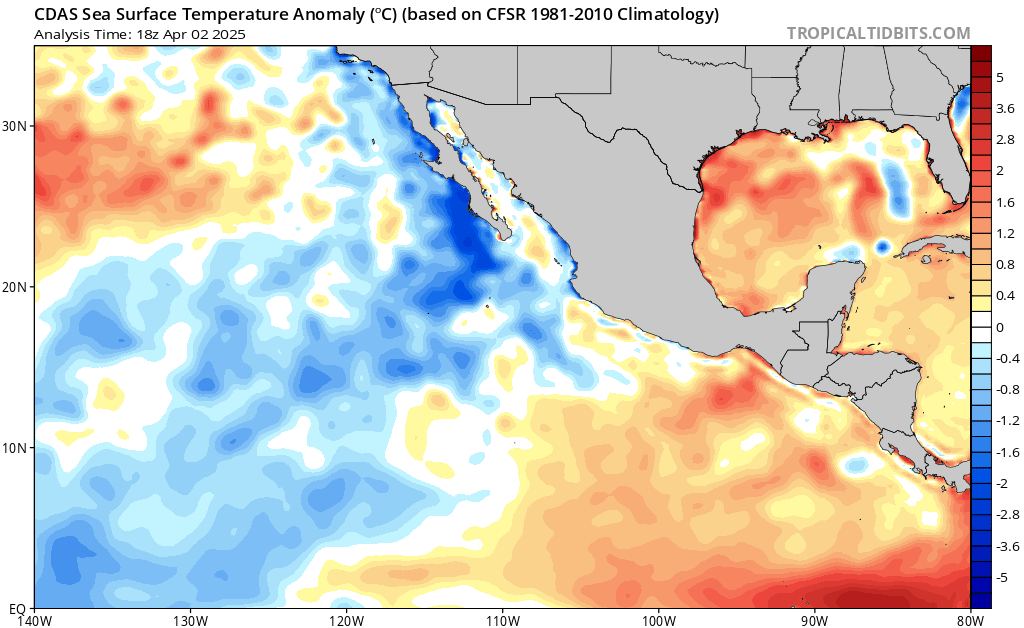
Figure 3. Sea surface temperature anomaly during the 1997-1998 La Nina.
The La Nina wind cool the equatorial Pacific, and thus the planet, in two ways.
First, as seen in Figure 3, it moves the warm water from the tropics toward the poles. There, because the air is dryer than in the moist tropics, more of the radiated heat from the warm water can escape to space.
And second, it exposes a large area of cooler sub-surface water (blue area in Figure 3) to the atmosphere. This cools the atmosphere.
So … if we accept my hypothesis that the El Nino/La Nina alteration is an emergent phenomenon that acts to cool the planet, an obvious question arises—if the earth is gradually warming, will the Pacific shift towards more El Nino conditions, more La Nina conditions, or remain unchanged?
Clearly, if my hypothesis is correct, it will shift towards more cooling La Nina conditions.
How can we measure this? Well, we have several indices that measure the state of the Pacific Ocean regarding El Nino.
The oldest of these is the Southern Ocean Index (SOI), which measures the difference in sea level pressure between Tahiti and Darwin, Australia. The change from El Nino to La Nina conditions affects the atmospheric pressure.
Next, we have the NINO34 Index. This is a measure of the sea surface temperature in the “NINO34” area, which goes from 5°N to 5°S and stretches across the Pacific from 120°W to 170°W. The Niño 3.4 anomalies basically represent the average equatorial sea surface temperatures of an area stretching across the Pacific from about the dateline to the South American coast.
Then there is the Oceanic Nino Index (ONI). It uses the same area as the NINO34 Index, but the ONI uses a 3-month running mean of temperatures.
Finally, there is the Multivariate ENSO Index (MEI). (ENSO is “El Nino Southern Oscillation”). Unlike the others, it is calculated from five different variables—sea level pressure (SLP), sea surface temperature (SST), zonal and meridional components of the surface wind, and outgoing longwave radiation (OLR)) over the tropical Pacific basin (30°S-30°N and 100°E-70°W). Because it requires modern data, it can only be calculated post-1979.
To show what is happening with El Nino, I’ve used a LOWESS smooth of the various indices. A LOWESS smooth shows the general trend of a given phenomenon. Here, for example, is the MEI Index along with the LOWESS smooth, and a straight line showing the trend of the index.

Figure 4. Raw Multivariate ENSO Index, LOWESS smooth, and straight trend line. Positive values are El Nino conditions, and negative values are La Nina conditions.
And here is the LOWESS smooth and the trend of all four of the El Nino indices described above. I’ve “standardized” the indexes, meaning I’ve set them all to have a mean (average) value of zero and a standard deviation of one.

Figure 5. LOWESS smooths of four El Nino indices, along with their straight-line trends. El Nino conditions are more positive, La Nina conditions are more negative.
You can see the peaks representing the big El Ninos around 1997-98 and 2015-16. Recall that according to my thermoregulatory hypothesis, the Pacific should be trending towards a more La Nina condition which is more negative.
And all four indices, in varying amounts, show this exact outcome—in response to the slow gradual warming since 1980, we have more La Nina conditions cooling the planet.
Q.E.D.
Here on the Pacific Coast of northern California where I live, La Nina conditions generally are accompanied by a reduction in rainfall. The last two years have been dry. We’ll see what this year brings, but the good news is that two days ago we got a full inch of rain, and the forest around my house is smiling.

Not only that, but more rain is forecast for the weekend. What’s not to like?
My best wishes to everyone,
w.
OTHER NEWS: I’m still suspended from Twitter. Seems like they must be prioritizing releasing the big accounts from durance vile, at least that’s how I’d do it.
If anyone wanted to send a tweet to @elonmusk advocating for my release, you could reference my post entitled “An Open Letter To @elonmusk” in which I discuss the issues of free speech and so-called “hate speech” … or if not, you just might want to read the post. These are issues of great importance to everyone both on and off Twitter, particularly since the European claim that we should regulate the undefinable category called “hate speech” seems to be spreading to the US.
MY USUAL REQUEST: I can defend my own words and am happy to do so. I cannot defend your understanding of my words. Accordingly, please quote the exact words you are discussing, so we can all be clear on the subject of your comment.
What is seen is not “scooping”, it is a lens of less dense warm water. You will note that sea level is higher on either side of the equator where it is warm yet the lower cooler water is depressed. If the water was the same temperature it would be flat as seen on the left hand graph.
Willis,
It might help get you unblocked on Twitter if you send a message to Catturd (@catturd2) — he seems to have some success with requests to get folks rescued. Don’t know if that will do any good, but you can try. You can send him a message here: https://ilovecatturd.com/pages/contact-us
P.S. I suspect we’re neighbors, and I’ve got 7.47 inches of rain so far this year…minimum normal year is about 30 inches in my book, so there’s a reasonable chance for that to happen. As you say, we’ll see.
Thanks, WX, sent a message to him.
I’m outside of Occidental in Sonoma County. If you’re nearby I’d love to buy you an adult beverage …
w.
Yeah, I’m in same area, we’re probably only a few miles apart. Is there some way I could send you my e-mail address privately?
Hang on, I might be able to get your email from the website. Don’t know if I can, never tried it, I respect peoples’ desire for anonymity …
…
… OK, found it. I’ve sent you an email.
w.
I just love these “discussions”.
Thank you Willis , Bob , Jim and others for a very entertaining Sunday afternoon.
Now that we’ve got the “definitions ” sorted , and the semantics out of the way, this is showing real promise .
Please don’t stop; it lightens up what would otherwise be just another day in the factory.
[SNIPPED]
Again, just another nasty personal attack. Come back when you want to discuss science like a decent human being.
I get it. You don’t like me. Can you move past that?
w.
[SNIPPED]
Just more garbage. Look, you made your point. You don’t think I’m fit to lick a real scientist’s boots.
Meanwhile, one of my studies was cited by the IPCC in its latest report … funny how that works.
w.
Really?
Which was that?
You consider IPCC real science?
Pathetic.
If you ever produced any real science, I’d welcome it.
I also have a peer-reviewed “Brief Communications Arising” published in Nature. My study showing climate is not causing any “sixth wave of extinctions” has garnered 132 citations in the scientific literature. My study falsifying the claim that Tuvalu is getting smaller because of sea level rise has gotten 28 citations.
But hey, you gotta be you.
w.
You’re talking to me?
Opposing view points are what science is all about.
Like I said, I love it.
I have no idea why you think it was a personal attack, on you or anybody.
As far as i know we’ve never met.
A faceless moderator snipped my entirely factual comment.
This site is worse than pre-Musk Twitter. I’m outa here.
Comments attributed to me but made by Willis?
Into what kind of Woke craziness has this site descended?
I’m well out of this anti scientific rat hole.
“. I’m outa here.”
Sorry to hear that.
It was my first comment in years ; no intention to offend.
Sorry I spoke.
It had nothing to do with you.
All the arrogant ignoramus Willis who censored my factual comment.
I have not censored a single “factual comment”. I have, however, snipped several ugly vile personal attacks. Nor did I do it anonymously—as always, I sign my words to make it clear they are mine, not yours.
w.
You’re outa here?
Thank goodness.
Have a wonderful life, and you’re welcome back any time you give up the endless ad hominem attacks and start discussing the science.
w.
I agree that Willis should not abuse his editing privileges to alter comments to his posts. Another editor should do that. Lack of neutrality has always been a problem in climate wars, but should not be a problem at WUWT
Thanks, Javier. The only thing I’ve deleted are a few comments which contained nothing but personal attacks on me. Not one scrap of science, whether I thought it was true or not. Here’s an example of one that I snipped, in its entirety:
And no, I’m not gonna sit here and let someone call me a liar and spew that kind of vile filth about me.
Nor am I gonna call someone else to take out the garbage. I did it myself and I signed my name to my words. I did this because I wanted it to be clear that it’s not WUWT doing it, it’s not Anthony or Charles, and it’s not a policy of the website.
It’s me, personally, emptying the trash.
Note that I didn’t alter a word of Jim Steele’s comments, because his vitriol directed at me also contained lots of scientific claims and arguments.
But an entire comment that’s nothing but someone childishly screaming false nasty allegations at me?
I don’t have to put up with that kind of abuse and I won’t.
Best regards,
w.
I just think these sorts of discussions are what real scientific discovery is made of when dealing with complex phenomena. Not a bunch of corrupt activists running around going “it’s settled” Thanks
thank you for the article and thanks to those that have alternate comments/opinions. I bet many (i.e. MOST) of us reader are non-scientific skeptics of man being able to do anything to effect the climate. Please keep up the dialog…without the degradation of others…what I read is there is a difference of belief/study as to what influences the climate of earth…but man created CO2 is not a factor. this dialog is important to us
Willis , You might remove the quotation marks around discussions and definitions ; I can’t think of any other reason, other than the Kiwi sense of humour.
So where is the evidence that La Nina cools the planet? Combining the data you present showing more La Nina conditions since 1980 with the rise in temperature during that time of about 0.5 C (0.13 degrees per decade according to UAH record) the obvious conclusion is that La Nina is responsible for heating the planet. There does not appear to be any evidence of a cooling effect.
ENSO is created by Australia and as such is an entirely man-made phenomenon.
Not dissimilar to the Azores High in the North Atlantic, which determines Europe’s weather and climate.
Both those things are created by what is in effect a continent-sized Urban Heat Island.
Sometimes called ‘Deserts’ and all deserts we currently see on this Earth are = Man Made.
Now it gets crazy because, despite ‘our’ fixation on Science, Urban Heat Islands are NOT = Islands of Heat.
They are Islands of Temperature. See the confusion of Heat (energy) with Temperature. Must try harder.
And ‘Heat Islands’ are place of high temperature because, very simply, because they are dry. They contain no water.
OK. Australia and ENSO
Australia, as created by Aboriginal Man, is a desert. It is dry so when the sun shines on it, it gets hot. High temps, NOT high energy.
It is not high energy because the high temp promotes vigorous vertical convection.
Hence, above Australia is a very powerful ‘chimney’ = a continent sized ‘thermal’ – exactly as glider-pilots seek out above newly ploughed farmer’s fields. Or Dust Devils
The solar energy falling on Australia is not stored there, it rises rapidly into the sky and cools. Dumping what energy it had into the Tropopause > Stratosphere > Outer Space.
But in doing so, the chimney needs to suck air into its base – and Australia does that from the surrounding ocean. (It is the ‘Fire-Storm Effect’ as seem during the bombing of London during WW2 – and has been reported on here a few times inside ‘natural’ wildfires. Things simply get crazy inside such events)
And so, the rising air over Australia pulls in its supply of cool air from all around and obviously, some will come off the Wester Pacific.
Hence the so-called Trade Winds. Bautifully shown in a Google satellite view of Autralia because the cool air off the ocean brings water – hence the nice green stripe down the Eastern (Pacific-facing) seaboard. And when that air comes ashore, as happens everywhere, it makes rain.
Such is the size of Australia nad the resultant strength of its ‘chimney’, the flow of air off the waestern Pacific brings warm water (solar heated, nothing else cam heat it)
If at particular times of the year the chimney is especially strong, it creates a La Nina which has effects all across the ocean.
If it is strong or perhaps somewhat more persistent than normal, it will create an enormous pile of warm water off the east soast of Australia.
What goes up must come down and that pile of water, propped up by the ‘fire-storm’ wind blowing onto Aus, has nothing else to do but collapse.
It is exactly the effect seen with volcanoes in pyroclastic flow, where the hot volcano builds a mushroom cloud, but if the volcanic energy supply falters, the mushroom collapses.
For Australia, such a faltering of energy flow will be caused by ‘winter’ – happens every year and is rather unavoidable.
If an especial big pile of water built up, that is when it will collapse, the warm water sloshes back eastwards from whence it came and sets off an El Nino.
Isn’t that exactly what we’re told, = when La Ninas tend to fizzle out and sometimes are replaced by El Nino
Getting there yet….
Because what Willis is telling us here is that Nina is coming to dominate – and if you followed the above, will see that Nina is caused by a strong chimney above Australia.
So if Nina is coming to the fore, that means that the chimney is strengthening and the only significant cause of that can be higher and more prolonged spells of high temperature over Australia.
And as high temps are exacerbated by dryness, that is what’s happening.
Increased Ninas mean Australia is drying out, is is becoming and even ‘harder’ desert than it already is.
We know (unless we really are = deniers) why that is:
Back to the satellite image and the green stripe down Australia’ east coast = where the rain falls.
On eroded and eroding soils, that rain will flow back into the ocean taking the soil nutrients with it.
And bingo, there it is = The Great Barrier Reef
ONe himongous living organism feeding and sustained by that exact Soil Ersosion.
Mmmm, there’s a tough one to call.
Falling straight out of the No Free Lunch paradigm, what would you prefer.
A green and clement Australia with no soil erosion, or the present burnt out cinder with high erosion BUT, with a Barrier Reef
You can not have both, they are mutually exclusive.
See now how it makes perfect sense to build a dam and flood the Murray Darling Basin?
Because doing that would allow what rain does come onto Australia’s east to flow further inland – causing more greening.
The lake would cause, as per The Northern Great Lakes and their Lake Effect Snow, the resultant Great Murray Lake will cause Lake Effect Rain
And in turn will cause cooling, toning down The Chimney, in turn toning down the entire ENSO
Simple isn’t it……………
No, Peta, it is not like that and it is not simple.
You really have to live in Australia, a place large enough to have numerous separate chimneys.
The air flow is not dominantly from surrounding oceans to the interior and up the chimney.
In Melbourne, where I now live, we have heatwaves nearly every year when hot winds blow from the hot centre out to the sea. They are hotter in coastal Melbourne, on average, than in coastal Sydney or in coastal Brisbane which are much closer to the Equator. This shows the dominant effect of air flow direction on local coastal temperatures during heatwaves. But then, heatwaves are but a small part of the action each year.
For decades we were taught that the rainy season on the east coast is caused by S-E trade winds, while the northern coast rain relies on the N-W monsoon that blows down from the Indo-Pacific warm pool implicated in El Nino talk. The west coast gets westerlies dominantly. It is easier to see Hadley cells, not chimneys, as dominating at least a big part of our continental circulation.
As for the newsy Great Barrier Reef getting nutrition from dirty rivers, scientists like Dr Peter Ridd have searched for sedimentation on the main reef, particularly from river deltas said to be loaded with sugar cane fertilizers, but he has found no significant such sediments. Not enough to form a hypothesis, if I am quoting him accurately, but enough to break one that blames farming for sugar. I trust you know a bit about sugar and its widespread farming on our narrow east coast farm strip. I helped start up the large urea plant in Brisbane about 1968, impetus for sugar cane.
Continuing with trendy urban myths, not a great deal is understood about the effect of natural and lit fires before settlement in 1788. The natives left next to no records and much described as traditional wisdom was invented by academic anthropologists wanting to spread noble savage concepts. It is unclear how much if any of our large central desert can be attributed to fire management. By comparison with continents with fertile centres, I suspect a geomorphology effect being a lack of N S mountain ranges in the west and centre, to help induce rainfall from the prevailing wet westerlies.
I am no expert in these matters, so do not rely on this opinion.
But do beware of interpretations of Australian Climate tailored to support global warming and climate change stories that are full of poor science. Like the Barrier Reef pseudo science loved by the United Nations. Geoff S
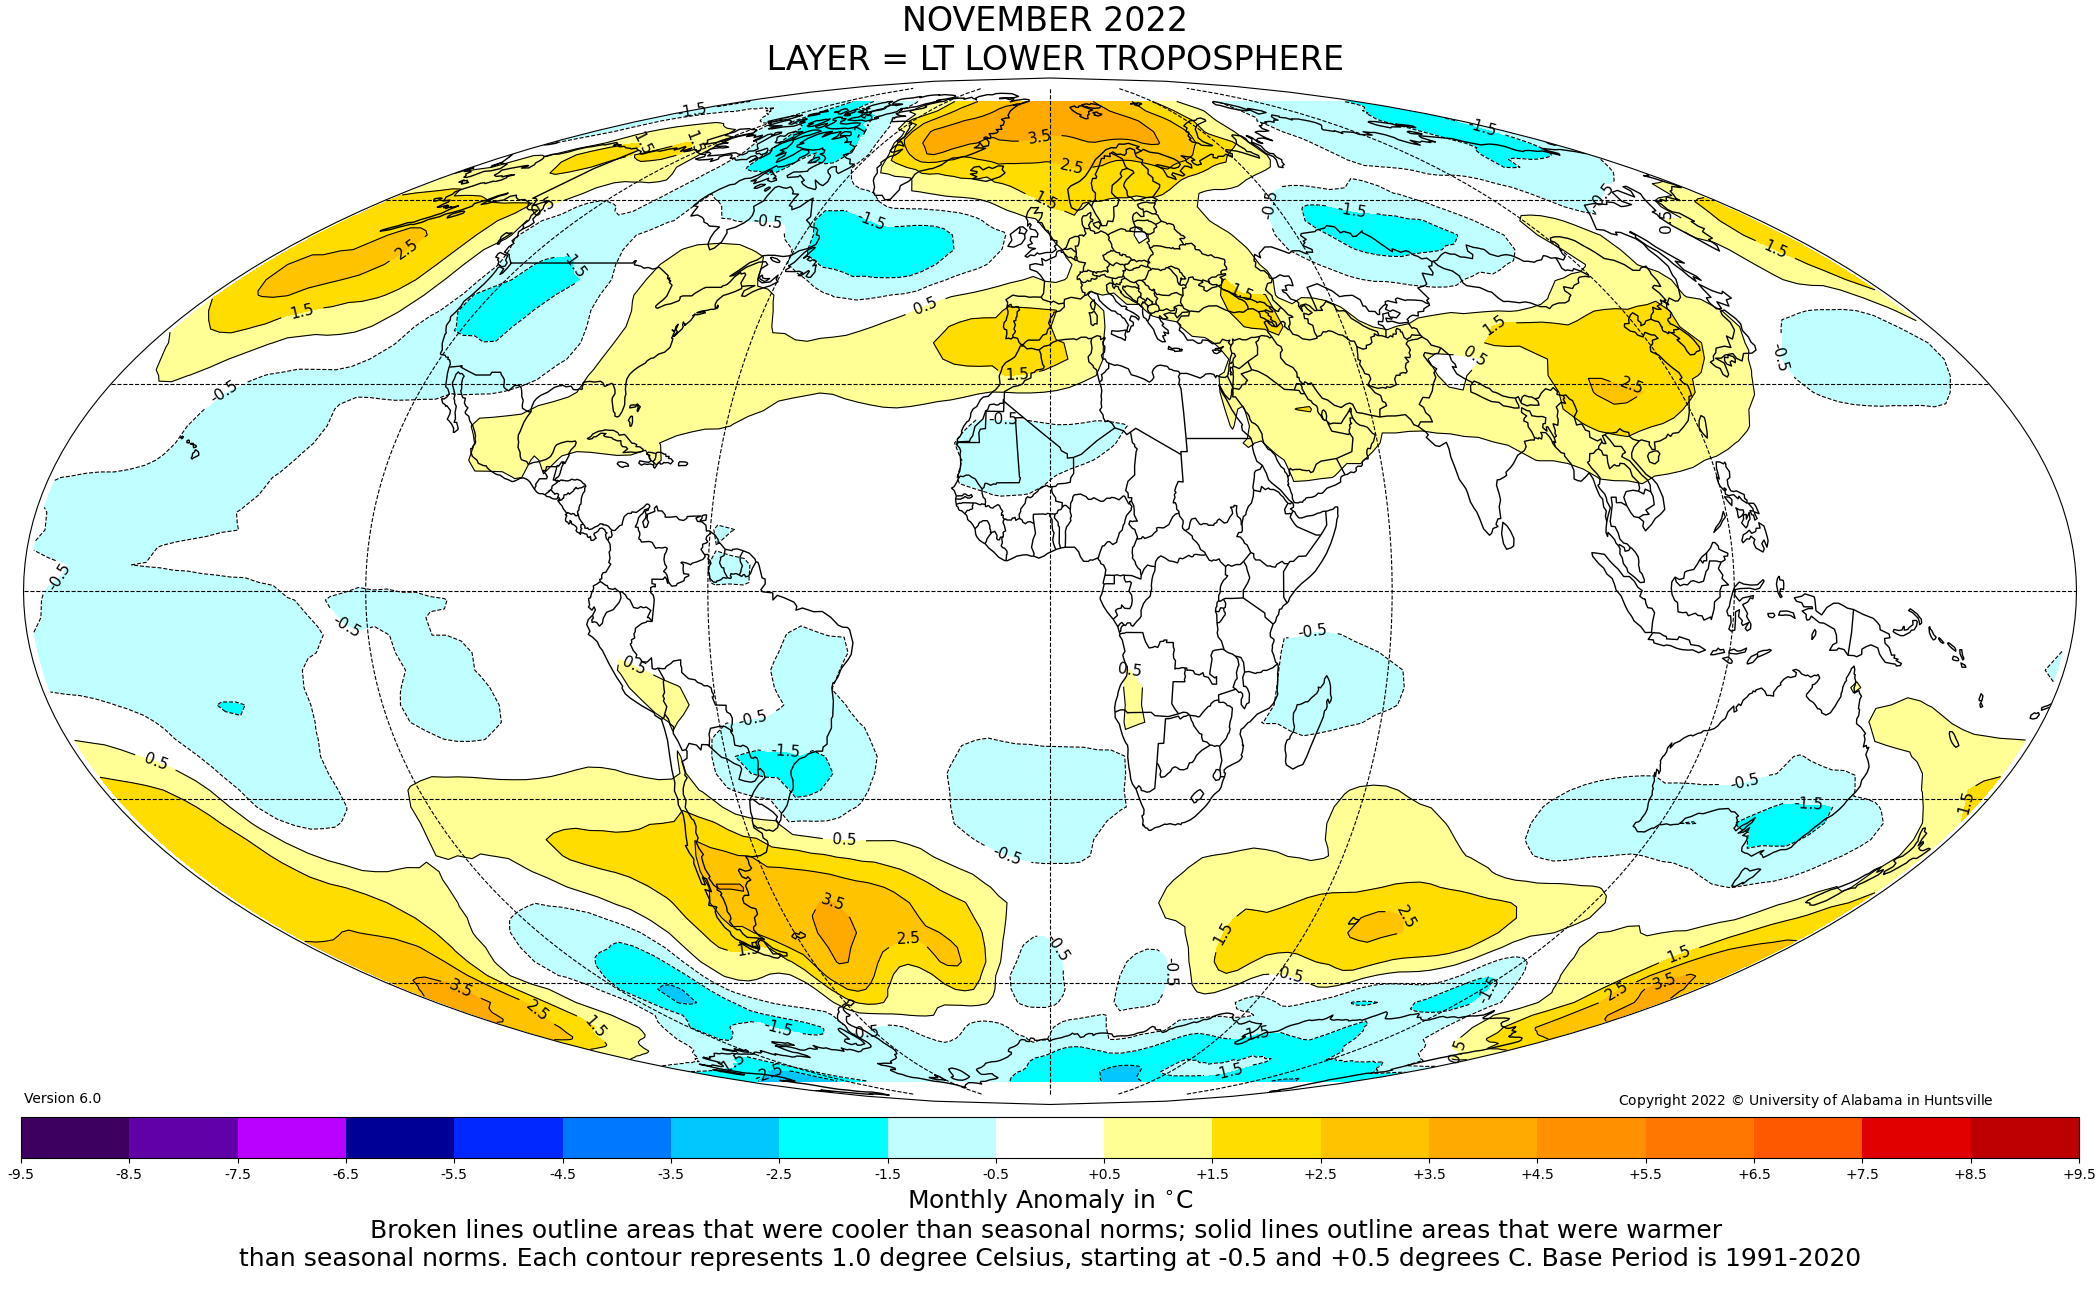
” Monthly climate statement for November 2022.
The Department of Environment and Science (DES) monitors sea surface temperature (SST) anomalies in key regions of the Pacific Ocean during the autumn, winter and spring and, based on this, provides objective forecasts of summer (November to March) precipitation. Based on the changing pattern of SST in the Pacific Ocean, the DES science department believes that the probability of exceeding the average summer (November to March) rainfall is higher than normal for most of Queensland.
The most closely monitored factor affecting rainfall in Queensland is the El Nino-Southern Oscillation (ENSO) phenomenon. Climatologists monitor several ENSO indicators, including the atmospheric Southern Oscillation Index (SOI) and SST anomalies in the central equatorial Pacific. Following last summer’s La Nina phenomenon, key ENSO indicators remain within the La Nina threshold. In particular, the latest three-month average SOI* was quite positive (+15.6 for the August-October period), and the corresponding three-month average SST anomaly in the Nino 3.4** region was cooler than average (-0.9°C).
It can be seen that the Nino 3.4 index was not very low, which means the average La Nina.
https://www.longpaddock.qld.gov.au/seasonal-climate-outlook/monthly-climate-statements/
“The latest values of various El Nino/La Nina indices indicate the La Nina (cold phase of the cycle) continues and is predicted to continue through the NH winter, though its demise is

forecast to occur late next NH spring. The impact of the colder-than-average tropical Pacific Ocean surface temperatures induces a complex response in the atmospheric temperatures
we report here, but in a very simple sense, cooler water will warm the atmosphere less than usual, causing it to be cooler than average (note the tropical atmospheric temperature in
Nov was -0.16 C).”
https://www.nsstc.uah.edu/climate/2022/november2022/GTR_202211Nov_1.pdf
La Nina will not end. Temperatures in the tropical northeast Pacific are already dropping.
I totally agree that La Nina cools the atmosphere and warm waters are transported towards the poles. Excellent article.
http://www.bom.gov.au/archive/oceanography/ocean_anals/IDYOC006/IDYOC006.202212.gif
Currently seeing subsurface cooling in the Pacific.
This coincides with a decline in global sea surface temperatures.

The UAH trend for the temperature of the lower troposphere over Australia has not been positive for the 10+ years since August 2012.
The ups and downs of ENSO seem to be self-cancelling by this broad.criterion.
But nobody here in Aust wants to talk about UAH.
I am getting tired of so much global discussion of near surface land temperatures and some SST in the El Nino talks. I’d be concentrating more on a search for the actual mechanism that causes an accumulation of heat around Indonesia from time to time. It is puculiar that heating there often seems to tie in with calendar months. Geoff S
Willis, why did you start your graphs in 1980?
1980 is a curious start year for your analysis, considering that the 1982/83 super El Nino follows shortly thereafter. One might think you cherrypicked the start year of 1980 to support your hypothesis. If you started the graphs in 1970, the trends will flatten, because of the dominance of La Ninas during that decade.
Regards,
Bob
Bob, I wanted to use the more modern of the indices, the MEI. It starts in 1979. In addition, that is a 43-year period, certainly long enough to qualify as “climate”.
Finally, the global surface air temperature rose fairly steadily during that time, so it gives a clear view of the response of the ENSO phenomenon to warming.
Thanks,
w.
Willis states, “Finally, the global surface air temperature rose fairly steadily during that time, so it gives a clear view of the response of the ENSO phenomenon to warming.”
And as I’ve shown and discussed numerous times, you’ve got that backwards, Willis. The warming is in part a response to ENSO.
Willis states, “Bob, I wanted to use the more modern of the indices, the MEI. It starts in 1979.”
The MEI shows the greatest negative trend, which better supports your hypothesis.
As I wrote above in an earlier comment above, And to Willis, so the MEI starts in 1979. As you like to write, SO WHAT. Exclude the MEI and start your graphs in 1970, so that they in include the La Nina dominant period of the early 1970s.
And as I stated and asked in my next comment after that, It is well known that there are multidecadal variations in El Nino/La Nina dominance. (See Figure 4-85 in my book Who Turned on the Heat linked above.) What happens to your hypothesis when El Ninos dominate again in the future?
I don’t think you want me to prepare a post that shows what happens if the other indices are started in 1970, Willis, but I’ll do it if you don’t publish a follow-up post to this one.
Enjoy the rest of your weekend.
Regards,
Bob
PS: Look at the ONI Index webpage. You can’t miss the La Nina domination in the early to mid 1970s. Adios negative trend.
https://origin.cpc.ncep.noaa.gov/products/analysis_monitoring/ensostuff/ONI_v5.php
So ONI is now going back to the 1970s (as is the climate).
Ireneusz Palmowski, as far back as I can remember, ONI has always gone back as far as 1950.
Regards,
Bob
Bob Tisdale December 4, 2022 1:29 pm
Thanks, Bob. You have indeed claimed that numerous times. I must have missed the part where you’ve “shown” it.
All four of the indices support my hypothesis.
I publish what I want, you publish what you want.
Best regards,
w.
Willis, in response to my comment that I’ve shown numerous times that ENSO contributes to the rise in global surface temperatures, you replied, “Thanks, Bob. You have indeed claimed that numerous times. I must have missed the part where you’ve ‘shown’ it.”
Curiously, Willis, you updated your post to include a link to my book Who Turned on the Heat, where it was clearly shown and discussed. Maybe you should read, examine, and try to comprehend that book that you link. Start at the beginning and work your way to the end. Here’s another link:
https://bobtisdale.files.wordpress.com/2016/05/v2-tisdale-who-turned-on-the-heat-free-edition.pdf
I’ve also shown and discussed the coupled ocean-atmosphere processes of ENSO and shown how they contribute to long term rise in surface temperatures, in numerous past posts here at WUWT for more than a decade. You must’ve missed them.
They, too, would definitely help you with your understandings of ENSO.
Regards,
Bob
Bob, I only linked to your post because you and others were complaining about my greatly simplified explanation. I figured you couldn’t complain about your own book like you’ve complained about most everything else.
Have I read your book? Nope. Do I plan to? Nope. Your claim is that the El Nino is what rules global temperature and is causing the globe to warm.
I find that claim far too laughable to investigate further.
In addition, my interactions with you have been generally frustrating, and I have no intention of getting into any debate about El Nino with you. There’s no cheese at the end of that maze.
Sadly,
w.
==============
[Q: “What’s the difference between a mainstream climate scientist running a maze, and a rat running a maze?”
A: “If you take the cheese out of the maze, the rat stops running.”]
Willis, your standard request at the end of this post begins, “I can defend my own words and am happy to do so. I cannot defend your understanding of my words. Accordingly, please quote the exact words you are discussing, so we can all be clear on the subject of your comment.” Yet you don’t provide me with that courtesy, Willis. That’s telling, Willis.
Willis, you stated in the comment above, “Your claim is that the El Nino is what rules global temperature and is causing the globe to warm.”
You must have trouble comprehending simple English, Willis, because I have never claimed “the El Nino rules global temperature…”. Please quote me chapter and verse where I have made that exact claim, Willis. Don’t bother to look, Willis. You won’t find it, Willis. You fabricated it, Willis. Not a good sign, Willis.
And regarding the remainder of that sentence, “…and is causing the globe to warm.”, you, Willis, must have trouble grasping complex processes, because I have clearly discussed and shown how strong El Nino events contribute to the rise in global surface temperatures.
Adios again, Willis. You are a waste of my time.
Regards,
Bob
PS: This morning, I thoroughly enjoyed preparing the ENSO index graphs with the 1970 start date, and then comparing them to graphs of the same data with your 1980 start date. I’ll present them simply and objectively in a post soon.
Bob Tisdale December 5, 2022 6:48 pm
Bob, the title of your damn book is
That says exactly what I said, viz:
I figured I didn’t need to quote your own book title to you, but you’re right, I should have done so. Mea maxima culpa.
As to the rest … pass.
As I said above, I have no intention of entering into a discussion of El Nino with you. There’s no cheese at the end of that maze, and I’m at least as smart as your average rat.
w.
Yawn! Wiilis replied, “Bob, the title of your damn book is
That says exactly what I said, viz:
Thank you for confirming what I said prior to that, for everyone who is reading the comments on this thread, Willis. Your statement, Willis, that I claim “that the El Nino is what rules global temperature and is causing the globe to warm” bears no relationship to the subtitle of my book “The Unsuspected Global Warming Culprit, El Nino Southern Oscillation”. Nowhere does my subtitle claim or imply that El Nino rules global temperature, Willis. Everyone reading this thread can plainly see that…except you, Willis.
You, Willis, continue to waste my time.
Bob
Culprit
rules
If you had said “one of the culprits” it would be different. “Culprit” is singular, not plural.
Time Gorman, you must be new here at WUWT. Well, at least, you’re new to me.
I’m not going discuss semantics or the eye-catching intent of book titles and their subtitles, but for you I will present a graph I prepared of for a post here at WUWT 10 years ago. It’s the sea surface temperature anomalies of the Atlantic, Indian, and West Pacific oceans from pole to pole that clearly show upward steps in response to the aftereffects of strong El Nino events:
figure-52.png (643×440) (wordpress.com)
Note the coordinates for the “Rest of the World”, 90S-90N, 80W-180. That’s everything but the East Pacific Ocean.
That graph was presented as Figure 5 for the WUWT post here:
Mythbusting Rahmstorf and Foster – Watts Up With That?
There a numerous other similar graphs in my above-linked book, Who Turned on the Heat?, along with data-based explanations for how those upward steps occur.
I doubt I’ll be back on this thread.
Regards,
Bob
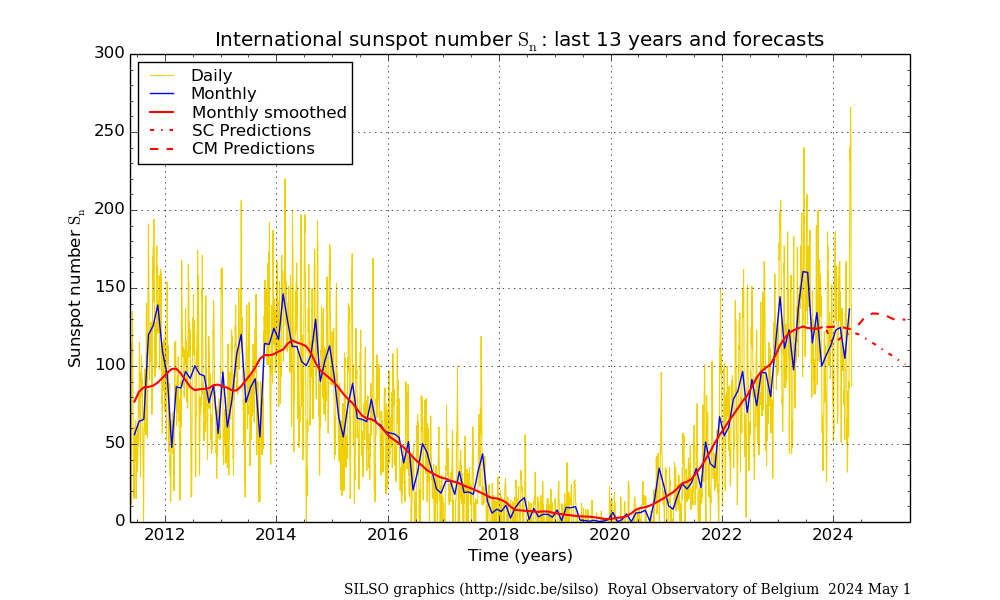
The graphic shows the dependence of SOI on the phase of the solar cycle. It can be seen that SOI increases as the solar cycle progresses and decreases after the solar maximum.
http://www.bom.gov.au/climate/current/soi.gif
SOI has been trending upward since 2020, the start of the 25th solar cycle.

Now the SOI is rising again as the strength of the solar wind has increased. This solar cycle may be low and have several similar spikes in activity.
https://www.longpaddock.qld.gov.au/soi/
Sorry, Ireneusz, but a longer look at the two datasets (SOI and sunspots) shows that the sunspots have an 11-year cycle, and the SOI cycle is only 9 years.
So in a short dataset you could easily be misled, but a longer dataset shows no relationship.
In the graphic below, you can see how they go into and out of phase with each other. In addition, there’s little relation between the amplitudes. If they were related we’d expect to see amplitudes changing in synchrony.
w.
However, you have to admit that you don’t know the cause of the prolonged La Niña. I do, however, see a connection between the average, long La Niña and the poorly developing solar cycle.
https://www.swpc.noaa.gov/products/solar-cycle-progression
With all due respect Palmowski.
As far as I know, NOBODY knows the cause of the prolonged La Niña. My analysis above shows clearly that the ENSO phenomenon has a different period and a different amplitude than the solar cycles. You can continue to believe there is a relationship, but the cycle analysis says no.
My best to you,
w.
Willis;
Temperatures always drop when the amount of SO2 aerosols in the atmosphere increases, as after a VEI4 or larger volcanic eruption.
The current La Nina, however, is being caused by increased Industrial SO2 aerosol emissions, primarily from China and India, and will continue until they reduce their emissions (unless Net-Zero reductions in SO2 aerosol emissions eventually offsets their emissions)..
Strictly speaking, the graph shows the dependence of SOI on the strength of the solar wind. When the strength of the solar wind decreases, the SOI decreases and the probability of EL Niño increases.

http://www.bom.gov.au/climate/current/soi.gif
This is why it is impossible to create an actual “linear” output from a CGM even though that is what they mostly show. Combining cyclical processes results in mixing products that are difficult to assume are stationary (i.e. a constant mean and/or variance). If they aren’t stationary then using typical regression analysis techniques can fool you big time. Short term data can appear to be stationary while long term data will reveal that it isn’t.
Willis
I have never quite grasped the distinction between what I have thought of as negative feedback and your description of emergent phenomena. It seems the effect of each is to maintain an equilibrium or a narrow range of deviation in a given state. Can you elaborate on that?
Sure. Negative feedback can only reduce the change in some phenomenon. For example, wind resistance is a negative feedback on the relationship between automobile speed and gas consumption. As you speed up, it slows you more and more. But it goes to zero when the car is standing still, and it can’t reverse the car’s direction.
An emergent phenomenon differs in a couple of ways. First, they’re generally threshold based. For example, consider thunderstorms. Once a temperature threshold is passed, suddenly they emerge all over the landscape. They are not applied gradually in proportion to the change in the underlying temperature.
In addition, thunderstorms can actually drive the temperature down below the temperature required for initiation. This “overshoot” is a requirement for thermoregulating a system with a lag in it.
You can see this, for example, in your thermostat. It comes on below the average temperature, but it doesn’t shut off the furnace until it’s above the average temperature.
w.
An emergent property of a system is a property that a complex system or collection of system parts has, but which individual parts do not possess.
Willis, thank you for your very realistic observations. The climate is not that complicated, although there are circulation anomalies that lead to unusual phenomena in the central Pacific.
I do accept Willis’ hypothesis “that the El Nino/La Nina alteration is an emergent phenomenon that acts to cool the planet,” but the sequel seems backwards:
“if the earth is gradually warming,” and “if my hypothesis is correct,” then ENSO “will shift towards more cooling La Nina conditions.”
No. It is El Ninos that cause cooling (that dump heat from our planet’s climate system).
Earlier in his post Willis had already described how El Ninos are the way the planet dumps a build-up of heat. The first step is that the oceans dump heat into the atmosphere via El Nino. Then the atmosphere transports the heat to the poles (described in detail by Javier Vinós and Andy May in their sun-climate “winter gatekeeper” posts), where the lack of water vapor allows the heat to radiate out into space.
This all fits with the proposed 4th law of thermodynamics: the law of maximum entropy, or of fastest route towards temperature equalization. Paper on this “4th law” here:
https://royalsocietypublishing.org/doi/10.1098/rsta.2019.0168
If this is what is going on then the more heat build up there is in the system the more El Ninos there should be and the fewer La Ninas. So I don’t understand why Willis is saying the opposite.
Also, if one looks at Willis’ graph of ENSO conditions since 1980, and divides it into a pre-2005 high solar-activity regime and a post-2005 low solar-activity regime, it looks like the downwards trend over the whole span is all taking place in the post 2005 era. (I choose 2005 because that is the year when Anthony noted that the 10.7 radio flux had dropped off a cliff and said “something happened.”)
Thus under the correct expectation—that it is planetary cooling that would cause an El Nino decrease and a La Nina increase—the trend of increasing La Ninas since 2005 suggests that low solar is coinciding with a decrease in total heat in the system. That is, once we figure ocean heat into our estimate of planetary temperature, the planet may well have been cooling since 2005.
Others have probably already said this. Sorry to be late to the party.
The cumulative MEI.v2 index is of interest as well. It’s in a negative trend since 1998, and before that we had a positive trend from 1976, and before that a negative trend.
Yes, I know that the starting date influences the level of the cumulative trend, so we shouldn’t pay attention to the level numbers. However, there can be no doubt that the trend is indeed negative since 25 years.
WUWT has gone off the rails.
I like the analogy of the bucket of hot/cold water (Jim Steele?). Pour it out on the floor. You have changed the surface temperature without a change in forcings.
This demonstrates the problem with using surface temperature as a proxy for climate. You can “prove” anything true once you accept 1 false thing to be true. Bertrand Russell.
I am glad you remember my analogy ferd. And thank you for the Russell thought. Is there an exact quote?
I don’t have the exact quote I heard it on a radio re-broadcast of a lecture he gave. It was 50 years ago I heard the broadcast but the lecture might have been recorded earlier. Russell used a math proof to show how his conjecture was trivially true. I was studying math and the broadcast stuck with me.
Thanks. I’ve read some of his works and he expreess the general idea that you stated.
I was hoping your concise summary of the truism was a direct quote “You can “prove” anything true once you accept 1 false thing to be true”
I might still use it, but attribute it to ferdberple instead.
When easterly winds are very strong La Niña is also strong (index Niño 3.4 about -1.5). Then a great deal of heat accumulates under the surface of the western Pacific. It is different , when the easterly winds are unstable. Then the surface temperature remains low, but the subsurface heat quickly disappears.

http://www.bom.gov.au/clim_data/IDCK000072/nino3_4.png
∆T = λ ∆F
The algae that have regulated earth’s temperature for billions of years say otherwise.
Evolution favored the survival of life that stabilized the climate while getting rid of life that destabilized climate.
This obvious answer explains why climate is stable. Algae changed the chemistry of the atmosphere and oceans allowing other lifeforms to develop 1 billion years later. Terraforming.
Algae continue to maintain the climate while we argue the number of angels that can dance on the head of a pin.
∆T = λ ∆F
What are the units on this equation?
Unless the units of measure balance, the equation is most certainly wrong.
T is in °C.
F is in W m-2
λ is in °C/W m-2
w.
So by definition anything that cannot be expressed as W m-2 cannot be a forcing.
Thus anything that changes temperature that cannot be expressed as W m-2 would be sufficient to disprove the forcing theory of climate science.
The obvious answer would be something that acts on a geometry other than a surface, such that the energy was disproportionate to the surface area.
This would lead to a violation of the conservation of energy.
The term “forcing” has always made little sense to me—in physics a force (also symbol F) is measured in Newtons.
This assumed equation is why the big fancy climate models reduce to a linear function of CO2 concentration after just a few iterations.
Yep. All the rest of the CGM stuff is nothing more than a noise generator laid over the y = mx linear function – then they cast that noise as being the CGM actually correctly handling all the various, interacting cyclical processes. Noise in – Noise out.
During La Nina, the ocean surface temperature rises in high latitudes and falls in the tropics. Overall, the temperature of the troposphere drops because the production of water vapor decreases (the largest amounts are produced in the tropics), which has a huge impact in winter on the temperature of the continents, in high and middle latitudes. This can increase the amount of snowfall.
November Temperatures (preliminary)
Global composite temp.: +0.17 C (+0.31°F) above the seasonal average
Northern Hemisphere: +0.21 C (+0.36 °F) above seasonal average
Southern Hemisphere: +0.12 C (+0.22 °F) above seasonal average
Tropics: -0.16 °C (-0.29°F) below seasonal average
October Temperatures (final)
Global composite temp.: +0.32 C (+0.58°F) above the seasonal average
Northern Hemisphere: +0.43 C (+0.77 °F) above seasonal average
Southern Hemisphere: +0.21 C (+0.38 °F) above seasonal average
Tropics: +0.04 °C (+0.07°F) above seasonal average
Bob Tisdale:
Re: Your post of Dec 3, 11:08 am
You wrote “…Not all El Nino events have a trailing La Nina event, and not all La Nina events are preceded by an El Nino”.
It appears that your (and that of everyone else on this thread) understanding of El Nino events is incorrect.
ALL El Ninas are caused simply by decreased levels of SO2 aerosols in the atmosphere, which causes temperatures to rise due to the cleaner, less polluted air.
For a volcanic-induced El Nino, the volcanic injection of SO2 aerosols into the stratosphere (by VEI4, or higher eruptions) initially results in the formation of a La Nina in 12 to 14 months after the date of the eruption (if the eruption did not occur during an El Nino).
Its aerosols eventually settle out, typically within 18-24 months, and usually results in the .
formation of an El Nino because of the less polluted air. Of the 50 El Ninos between 1850 and 2019, 7/50 were volcanic- induced
However, the majority (33/50) of the El Ninos were caused by reduced SO2 emissions from idled smelters, foundries, factories, etc. during American Business recessions. In those instances, the El Ninos were not receded by a La Nina, although many were ended by the La Nina from a following eruption.
2/50 El Ninos (1997-1998) and (2014-2016) were caused by global “Clean Air” efforts.
7/50 were caused by intervals of 4-11 years between eruptions, where there was enough time for all of the circulating volcanic aerosols to have fully settled out of the air.
Thus, far from being natural occurrences, 70% of the El Ninos since 1859 were caused by man’s actions. And only cooling,not warming, occurred due to La Ninas.
See “A Graphical Explanation of Climate Change” on Google Scholar..
BurlHenry, you wrote, “ALL El Ninas are caused simply by decreased levels of SO2 aerosols in the atmosphere…”
First, there’s no such thing as an El Nina. Thanks for confirming your expertise on this topic.
Second, the coupled ocean-atmosphere processes the initiate, drive, and end El Nino and La Nina events have been measured with instruments above and below the surface of the tropical Pacific and those measurements have been presented as data by Australia BOM and NOAA. SO2 does not enter the picture.
Regards,
Bob
Bob Tisdale:
Stupid Typo!
Of course I meant an El Nino
“SO2 does not’enter the picture”
As I said, your understanding of the cause of El Ninos is incorrect.
ALL La Ninas AND El Ninos are the result of changing levels of SO2 aerosols in the atmosphere..
I have proved this by the careful analysis of WoodForTrees graphs of average anomalous land/ocean global temperatures. See my reference.
However, your analysis of how these events behave, AFTER having been formed may be correct, but of what use is it, other than predicting what will happen?
Knowing what causes an event raises the possibility that a way can be devised to minimize or control it. And is clear that they have nothing to do with CO2.
.
Willis Eschenbach:
Your Fig. 3 is identified as showing the 1997-98 La Nina, and it clearly shows a cool La Nina band, but instead, 1997 98 were El Nino years..How can this be?
Your Fig. 4 does identify them correctly
The data shows that Nov 1997 was an El Niño and Nov 1998 was a La Niña that appears to be the case on Willis’s figs.
Phil:
The graph is labeled as 1997-1998 being a La Nina period, yet the La Nina did not show up until after mid 1998. Looks as if he is making up data.