From the Cliff Mass Weather Blog
Cliff Mass
he entire character of this winter has been characterized by a strong El Nino.
El Nino impacts have included low snowpack over Washington State, huge snowpack and heavy precipitation over California, and warm temperatures over the Upper Plains states.
However, El Nino’s days are numbered and its decline is proceeding rapidly right now.
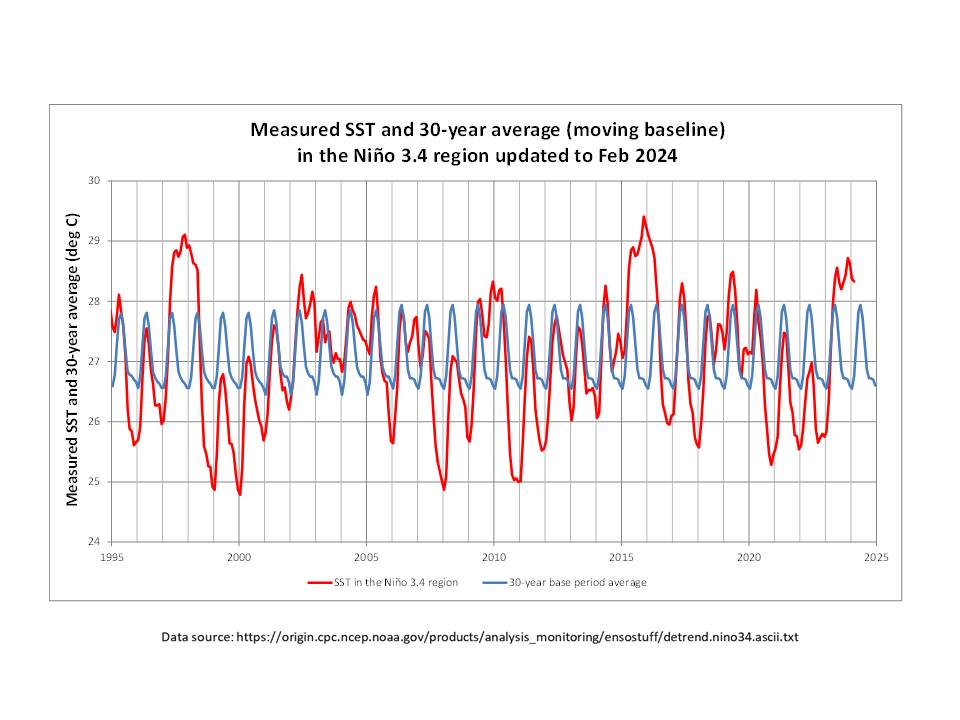
First, consider the critical measure of El Nino: the sea surface temperatures in the central tropical Pacific (the Nino 3.4 area). The warmth of this El Nino peaked in late November (about 2.1°C above normal) and is now declining fairly rapidly (currently at roughly 1.3°C above normal).

But the cooling is really more dramatic than that: a LOT of cooling has been happening beneath the surface!
To demonstrate this, take a look at subsurface temperatures (the difference from normal) for the lowest 300 m under the surface for a vertical cross-section across the Pacific (below).
On 8 January, there was a substantial warm layer extending about 100 m beneath the surface.

But look at the same cross-section on 27 February.
Wow–what a difference! The warm water has dramatically cooled, with only a thin veneer of warmth evident for much of the Pacific. Rapidly cooling has occurred beneath the surface and this cool water is about to spread to the surface.

If you really want to appreciate the profound cooling take a look at the amount of heat in the upper ocean for the western tropical Pacific (below, the difference from normal is being shown).
A very, very dramatic change has occurred. The heat content of the upper ocean peaked in late November and then plummeted. Declined so much that the water below the surface is now COOLER than normal.

El Nino fans will be further dismayed to learn that models are going for a continuous decline….so much so that they predict a La Nina next year!

So why should folks care about this major decline in El Nino here on the West Coast?
El Nino results in a trough of low pressure centered to our south and west, something evident in the upper-level maps (for 500 hPa, about 18,000 ft) for February hown below. The blue colors indicate lower-than-normal heights/pressures.

But with El Nino weakening, a major pattern change is possible, and the latest model forecast is for a major change, with a huge ridge (red color) over our region for March 13-20th.
FINALLY, we may experience some real springtime weather. Like highs in the mid-60s! I can’t wait. Tired of one frosty morning after another!

So does this lead to a cooler than normal summer or a cooler than normal winterL
The effects of either ENSO (el Nino or La Niña) depends entirely on location, as the sea surface temperature swings cause differences in pressure systems (troughs and ridges) that affect air circulation. And those effects vary with both latitude and longitude.
For instance here in Florida, seemingly far removed from the Pacific coast of North America, the current strong El Niño – which is a warming of east Pacific SST, the effect was to cause this past winter to be cooler than average as well as wetter than average. In California the air was relatively warm yet relatively moist with higher than average snowfall in the Sierra Nevada, while farther to the north the Pacific NW had drier than average conditions. A detailed discussion of how each of those effects are derived from an El Niño is too complex to explain in a comment response, but the effects don’t necessarily seem to follow from an El Niño.
I’m surprised to read about above average snowpack in the Sierra Nevada. Prior to the storm from the previous weekend all ski areas and sno-tel (central Sierra) sites were well below average. Most of the snow season has passed and all measurements are still below average season totals
Still showing most snowpack in CA at 85% of “average”. Not sure why he is calling it huge. Huge snowpack was last year.
Yes, depending on where.
Cliff,
A very interesting article and great graphics
El Niño Heat Source Area
https://www.windtaskforce.org/profiles/blogs/hunga-tonga-volcanic-eruption
.
EXCERPT
An about 9000-meter-deep plateau, located near Papua New Guinea and the Solomon Islands, has major periodic, volcanic activity, that influences the world’s weather. See Image 1A
The plateau covers about 150,000 square miles, which is a mere 0.23% of the Pacific Ocean’s 64,092,958 square miles.
That area is one of the most geologically active regions on Earth
It is home to the junction of five extremely active major fault systems, the second-largest, ocean-floor lava plateau on Earth,
It has hundreds of ocean floor volcanoes, and a large number of ocean-floor hydrothermal vents.
Plate Climatology Theory, states, fixed/non-moving, geological, deep ocean heat sources drive many weather patterns, and weather-related events, including impetus heat for El Niños. See URLs
https://www.plateclimatology.com/why-el-nios-originate-from-geologic-not-atmospheric-sources
https://climatechangedispatch.com/geologist-how-geologic-factors-generate-el-nino-and-la-nina-events/
.
El Niños
.
The Heat Source Area provides heat to water of local areas of the Pacific Ocean. That water rises and follows prevailing currents towards South America. That is the normal situation
.
About every 2 to 7 years, increased venting and eruptions take place, due to tectonic plate movements.
That heat warms the already warm water, and gives additional impetus to any El Niño (rated weak to very strong) development, whose paths and consequences are well known. See Image 1A
.
Sometimes, an under-water, volcanic eruption takes place in a nearby area, such as Hunga Tonga, that, in this case, added to the effects of a strong El Niño.
Their combined effects temporarily altered normal weather of large areas of the world for at least 12 to 18 months.
Stronger El Niños are factors regarding the weather. See Images 5, 6 and 7
As part of an El Niño pattern, a stream of warm water wells up from the Heat Source Area, departing from there, towards the Peruvian coast. The upwelling weakens the trade winds. With weakened trade winds come changes in air pressure and wind speeds, which push warm water toward the west coast of South America.
As a result of the warmer water, there is more water vapor, WV, and the atmospheric pressure in the eastern Pacific drops, because of increased WV See Image 11
At higher latitudes, these changes in the tropics allow the Pacific Jet Stream, a narrow current of air flowing from west to east, to be pushed south and spread further east.
The jet stream steers weather systems, thereby determining the weather patterns seen across a wide geographic range.
Image 1A shows strong El Niño effects peaking in late-summer/early-fall of 2023, which coincided with a lower-atmosphere temperature increase of about 0.3 C. See Image 7 and below Hunga Tonga section
https://ggweather.com/enso/oni.htm
Willem, on your website, you used this plot I made and posted here on Feb. 5 in response to a Ron Clutz comment, taking it out of context, and without attribution to me:
I said the UAWVC lagged El Niño before HT-HH erupted while leading before the 2023 Niño spike.
These two situations are mutually inconsistent, indicating HT-HH wasn’t a cause of the El Niño.
In other words it’s a spurious correlation, an exceptional circumstance that didn’t follow precedent.
I predicted the El Niño two years ago as a function of the 365d spotless days & 365d SN average:
Bob,
I revised the text and added attribution with your name.
The fast HT-HH was an entirely different event from the slow El Nino.
Some El Nino weather effects were increased by the HT-HH weather effects
Thank you Willem, but I still doubt the HT-HH ENSO hypothesis. Nothing personal.
The Aura MLS WV hovmöller plot also indicates prior heavier WV plumes happened after El Niño or during La Niña. There is no consistent pattern here that says HT-HH was the definitive cause of the 2023 El Niño, or that seismic activity actually translates into greater ocean heat content.
Interesting report from the Cliff Mass Weather Blog, but it is NOT good news. OK, the USA west coast will be better off, but the wine grapes for the next harvest, where I live, less than a year from now, will be a poorer quality. Think: El Niño is a good boy, but La Niña is a bad girl, sort of like “good girls go to Heavan and bad girls go everywhere else”.
Jim Steinman would have probably preferred it if you’d quoted his lyrics accurately! Y’know – just for all those lost boys and golden girls out there!
As a fair weather golfer in Oregon I’ll appreciate the warming. Now I can begin regaining the progress I made last summer only to lose it in the season of death winter.
Does the weakening El Nino mean that a snowless February in the Chicago area will be followed by a colder-than-normal spring?
Correlation does not mean causation, but the HT water vapor at the top of the stratosphere has dissipated over the tropics. The trend of cooling in the tropics will likely continue.
Graphics produced by IDL (nasa.gov)
Interesting graphic. The hole over the tropics appears to correlate with the El Nino. It appears as if it might be fading away along with the El Nino.
Yes, its complicated, that is the plot at the upper Stratosphere, I have been following it up. Even though the Stratosphere is frigid at all altitudes it warms with altitude, so a surge of water vapor from the stratosphere slowly rises over 2 – 3 years until it gets above the ozone layer and extreme UV breaks it into its atomic constituents. It does not precipitate out.
That makes a lot of sense and explains why the tropics would show the first reduction.
Thanks for the forecast, the El Nino winter in the N Rockies was mild and open.
Our snowpack is only 40% of average, not a good situation.
I don’t know exactly what you mean by N Rockies, but I do know that the snowpack for the Colorado River Basin is about 95% of average for this date. A search for northern Rockies on NRCS gave me Montana snowpack of about 70%. Not too bad.
You’re right about the 70%. I only plowed the driveway a few times,
I usually would do that many times in a average week, the latest storm last week boosted
some of the areas up but not all got much snow.
https://www.mtpr.org/montana-news/2024-03-07/snowpack-remains-below-normal-after-an-exceptionally-low-snow-year-in-montana
Ruh Roh! We are all doomed.
ENSO really dictates the weather across the globe. If the La Niña kicks in and sticks around, California will be glad they have a good snow pack to start. Plus the Atlantic hurricane patterns are changing this year and I’m not looking forward to battening down the hatches here in the southeast US.
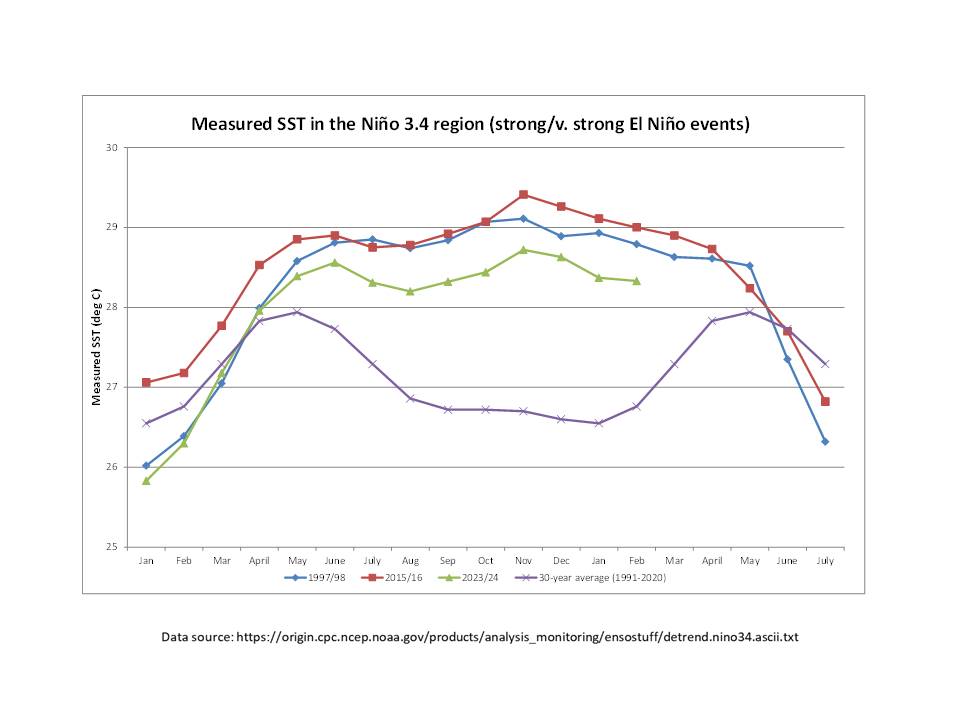
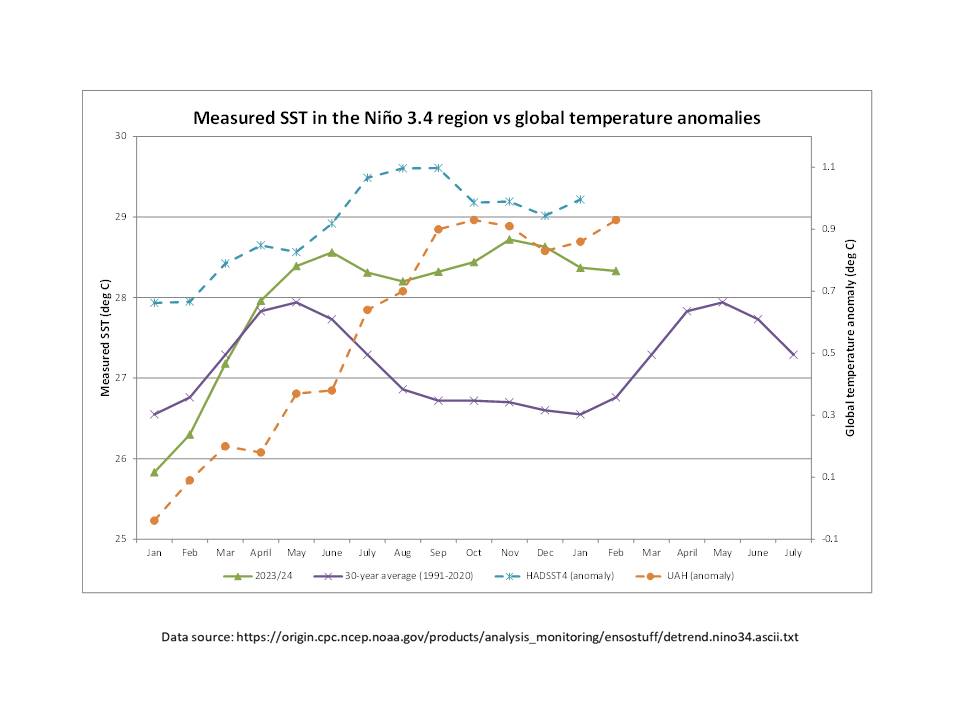
While the sea surface temperature (SST) changes are indeed dramatic, it is worth noting that there is nothing unusual in terms of SST rates of change or timing when compared to the two recent very strong El Niño events (1997-1998, 2015-2016), with the SST values being somewhat ‘flat-topped’ (actually double-humped, to be more precise) over the whole event (May to May, as highlighted by the peak of the average SST data). Even the moderate event (2009-2010) looks similar, though significantly less warm of course, while the current ‘strong’ El Niño fits in between from both an SST perspective and a (likely) May-May duration.
I would like to know where all the heat energy stored in the ENSO region goes when the flip occurs. I know colder water comes up from under it but does the warmer water being replaced get caught in a current and move to the poles or do the easterlies blow it to the western side of the Pacific (or both)?
The warm water is first pushed west by the trades. When it bumps up against Asia it is then pushed toward the poles, where the heat is discharged to space.
El Niño persists, although a steady weakening trend is evident in its oceanic indicators. Climate models indicate sea surface temperatures in the central tropical Pacific are expected to continue declining and are forecast to return to ENSO-neutral in the southern hemisphere autumn 2024.
http://www.bom.gov.au/climate/enso/
https://www.cfact.org/2024/03/05/seismic-update-on-rapid-drop-off-of-sst-forecasted/
Huge Indian Ocean cooling is possible by November; it would indeed give the seismic and global temperature correlation more credibility.
Due to waning solar activity, fairly high temperatures will persist in the tropical Pacific. East winds will weaken.
I think the BOM forecast is very likely.
Niño 3.4

A collapse of anything is very bad news
All bad news is caused by climate change
The only cure for climate change is fascism and mandatory EVs. And no more plastic bags and plastic straws.
And grass shirts and skirts for hula dancing
So, does the rate of change, have significance to possible weather trends? Such as, does a rapid change create stronger winds/rainfall/storms/heatwaves?
Another front with precipitation is approaching the west coast of the US.

Expect the Monckton pauses to resume later this year.
El Niño may well be on the way down. But the global surface temperature anomaly (TempLS) rose 0.163°C from Jan to Feb.
Here is the map (using GISS colors)
You might want to re-read the article again, Nick. Then, perhaps, get an adult to help you with the difficult bits such as, possibly, words with more than 4 letters in them?
Honestly, Nick, all joking aside but the article mentions a slight dip in sea surface temperatures and a dramatic decline in deeper water temperatures. Please point out where it mentioned any possible decline in air temperatures above the surface, because I may just have missed it myself.
The headline said “El Nino’s Collapse Has Begun”
The fact that February was considerably warmer than January is relevant to that.
We have just determined that Nick doesn’t understand El Ninos..
Nothing unexpected about that.
Nick only understands what he is paid to understand.
“ is relevant to that.”
Given the lag between ENSO and atmospheric temperatures…
… your comment is totally irrelevant… as usual.
The Global UAH LT anomaly values are tracking the sea surface temperature (SST) values in the Niño-3.4 region very closely (with the usual delay). The first SST peak for the current El Niño occurred in June 2023 and the Global UAH LT anomaly peaked exactly 4 months later in October. The second SST peak was in November, so we might go wild and predict that the second UAH peak will be in March. We could add +/- one month for natural variations, but let’s just wait and see.
All that URBAN surface warming and all the sites that are provably totally unfit for purpose..
…. and a meaningless base period for which ocean measurements were extremely sparse… and much of it “just made up”. Same with much of the land surface.
Show us where surface temperatures for, say, the middle of the African continent and the middle of South America were measured in the 1950s??
And of course if you look at raw US temperatures, you can understand why they use the coldest period as their reference, and not the 1930s/40s.
Also the coldest period in the Arctic and NH, after the much warmer 1930/40s
Also the coldest period in Australia after much warmer around 1900.
Also the coldest period in South Africa after a much warmer 1930s/40s
The whole chart is one big CON/SCAM..
… and I suspect you are well aware of that.. being as you posted it for just that purpose.
Thanks Nick.
This is not what I got.
I calculated 0.155074 C
How can we reconcile this significant difference?
Thing is, with the totally junk data that GISS work with….
.. and the manic adjustments they are continually making…
.. they can come up with basically any number they want.
The surface fabrications are TOTALLY MEANINGLESS.
Isn’t that the point of the energy leaving the water via the atmosphere?
I think we can expect another step increase and a partial drop and levelling out for a while. That seems to be the way warming has been playing out over the last several decades.
blob:https://wattsupwiththat.com/9f3b822d-735e-4fc8-bf54-cdf9b74aa126
These are the most recent snow totals and percentages of average for Tahoe and the central Sierra.
If La Nina becomes more dominant in the ensuing months, as many climatologists are predicting, we’ll just see a return to more normal conditions or even below them. So what’s the big deal? Aren’t these fluctuations part of the long-term weather/climate patterns anyway, and it’s merely a case of preparing for colder, snowier conditions for next winter.
They are fluctuations, or indicators of fluctuations, depending on your views. However, I’m not sure it’s exactly that simple as El Nino = warm weather and La Nina = cool weather; these are sea conditions and that affects ocean and air circulation patterns (ie – weather) in different ways. Just have to see what happens.
Plus there are lags from when something happens and the results from it.
what does the impact of this have on precipitation?
It depends on the area. If you could be more specific about where you are interested in you might get an answer.
Just two days ago, we ran a story here at Weatherzone with the headline “Colossal rainfall over the Nullarbor”, and again, extremely heavy rain has fallen over the Nullarbor Plain in Western Australia.
The heaviest falls continue to be recorded in southeastern WA in the area centred around Eyre weather station – on WA’s southern coast approximately 300 km east of the SA Border.
Since the deluge began late last week, the Eyre weather station, located at the Eyre Bird Observatory, has now seen:
11 mm in the 24 hours to 9 am Saturday
141.2 mm in the 24 hours to 9 am Sunday
43.8 mm in the 24 hours to 9 am Monday
129 mm in the 24 hours to 9 am Tuesday That makes a running total of 325 mm in the 96 hours ending at 9 am Tuesday, which has absolutely decimated their record for the heaviest rainfall in any single month, which was 203.8 mm in March 1912.
Incredibly, it also means that Eyre has exceeded its annual rainfall average within four days, having registered 325mm from this event so far. Its average annual rainfall is 315.9mm.
https://www.weatherzone.com.au/news/australias-largest-sheep-station-underwater/1847437?utm_source=facebook&utm_medium=referral&utm_campaign=20240312_news_australias-largest-sheep-station-underwater&fbclid=IwAR0tPcTSDf8S9RT9hCdskoavvWbHnK_nJLDGRqrBQoNmUod4xc3jInwS–A
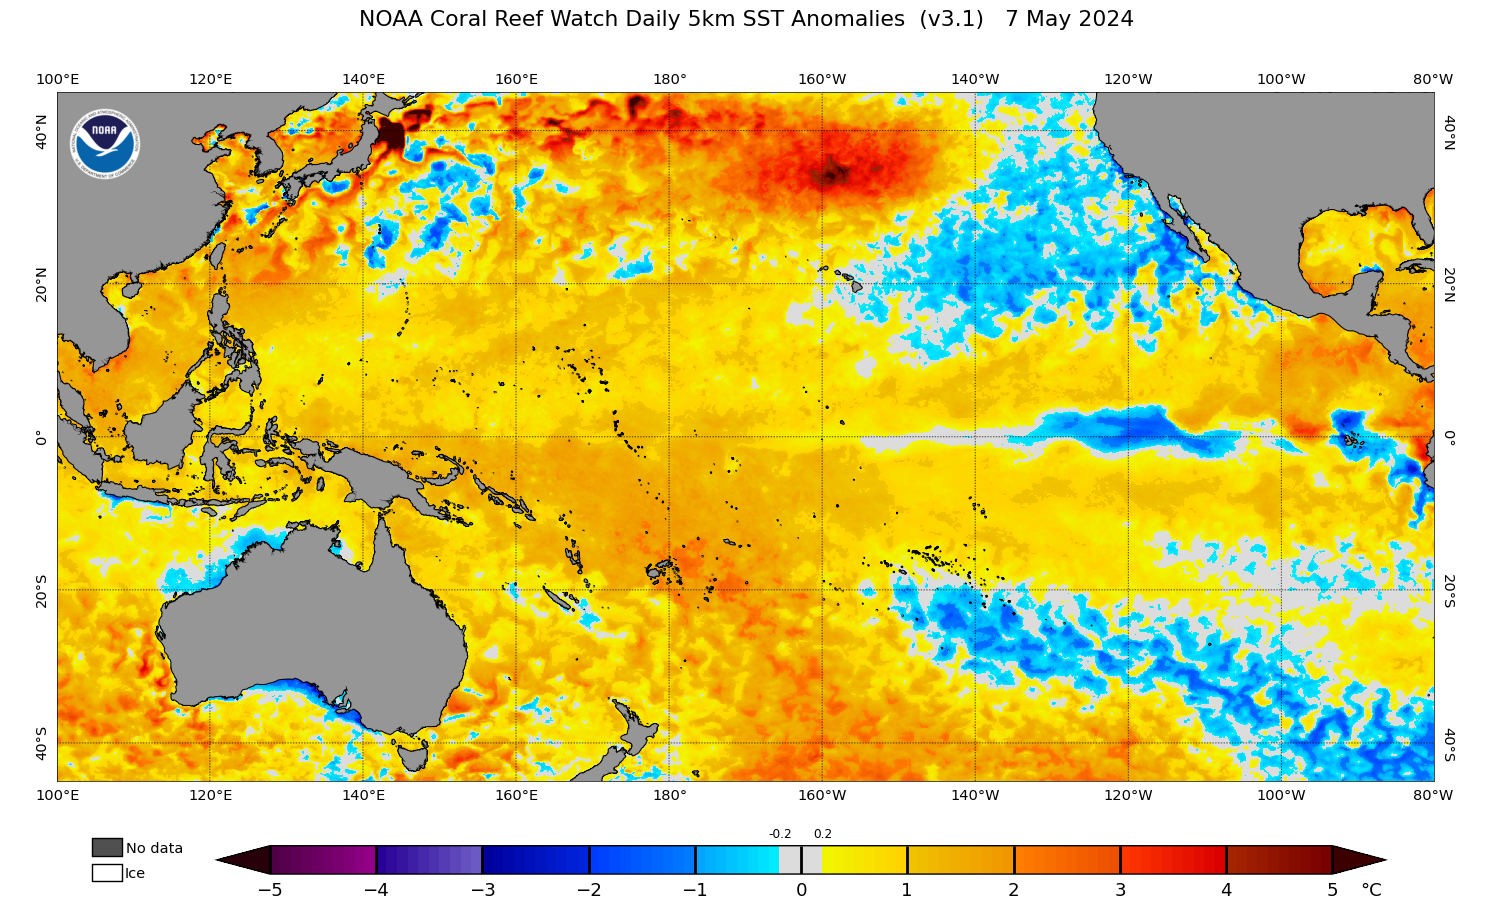
Re: ENSO Map – right hand margin of this page. Has anyone noticed the increasingly large black area of +5 C sea water that has been off Japan’s northeast Pacific Ocean coast for almost the last year? It behaves exactly like El Nino. It sends a stream of very warm water straight east across the Pacific to Seattle and Vancouver, Canada. Over the last year, the size of this “puddle” of hot water has grown from a black dot to an easily noticed black smudge the size of the Great Lakes in the USA. Do any of our resident experts have an explanation for what is going on there? Active undersea volcano? Huge field of thermal vents? North Korean nuclear sub in melt down?
Japan lies along the ‘Ring of fire’ a 24,900 mile long circum Pacific belt with over 450 active volcanoes both on land and under the ocean and frequent earthquakes. It follows the boundaries between several tectonic plates. 90% of the Earth’s earthquakes take place along it and 75% of the Earth’s volcanoes lie along it.
Rainfall in Western Australia is not over.

Maybe reach us on NSW east coast Friday or Saturday.
Great…. more 10″ grass to mow 🙁
I respectfully completely disagree. The 2023-24 El Niño is not strong, and the character of this winter has been mainly the result of another factor.
I am writing an article about this to be posted in Climate Etc. in a few days. Perhaps WUWT will want to repost it.
Looking forward to it!
A raspberry right back atcha from those of us living on the Mid-Atlantic coast.