This live and real-time radar stream is coming directly from the National Weather Service WSR-88D NEXRAD network and is provided as a free public service of The Heartland Institute and WUWT.
It features a 3D view of south Florida and it will constantly update with new radar data and storm track, as well as the position of Ian. As the storm progresses, the radar view may switch to different locations.
Periodically, and as the situation changes, different views may be displayed. You may share this feed freely on any social media!
My friends in Punta Gorda have foolishly chosen to remain in place at their home. Hoping for the best for them. They do live at a bit of elevation – on a bluff, so the storm surge will not get into their home, but the winds remain a major problem.
And thanks to Anthony for his live coverage.
No big deal. According to the contrarians here Ian is probably only a tropical storm and the extent of the damage will be uprooted trees and broken windows. You can tell them not to worry /s.
“No big deal. According to the contrarians here Ian is probably only a tropical storm and the extent of the damage will be uprooted trees and broken windows”
Some of us don’t make assumptions first, then cling to anything that we think confirms that assumption.
We look at ALL the empirical data………and I mean ALL as in intentionally trying to find data that might contradict where the data is leading us.
At some point, ALL the data will lead us to an authentic, scientific conclusion but even then, we keep an open mind for any conflicting data.
At least that’s what I do. How about you bdgwx?
That’s exactly what I do too.
BTW…ALL of the data unequivocally says that Ian was a hurricane.
I hope your friends are ok. KPGD (Punta Gorda) reported 123 mph before it stopped reporting around 4:10 pm. Let us know once you hear from them.
I’ve been travelling, so didn’t see this for a while. That 123mph was a gust, which would certainly have been a very nasty gust. But the maximum sustained wind in those data is 86mph, which is just a Category 1 hurricane, not a Category 4.
Why are you expecting KPGD to observe category 4 winds prior to 4:10pm or at all? Why are expecting the 86 mph sustained wind to represent the maximum wind in the first place?
Radar at 2.30pm Easter time shows the Ian (east eyewall) directly over Fort Myer. Sustained winds much weaker than hurricane force. Eye is off the coast due west, with western eyewall having maximum winds around 65 knots. Satellites show storm is weakening rapidly..
Patently False. Maximum winds on the KTBW radar are at least 135 kts (with isolated bins at 160 kts) as of the 18:52Z scan. Of course, radar, like all wind speed measurements, uses a model so you undoubtedly won’t accept that. So where are you seeing 65 kts at 26.6N, 82.5W anyway?
Where are you seeing observed wind speed on the KTBW radar? Doppler radio can only measure radial velocity, toward or away from the radar. So you must be looking at some kind of forecaster’s estimate.
Also, the “official” wind speed must be measured at 10 meter above the surface (roughly where most anemometers are mounted).
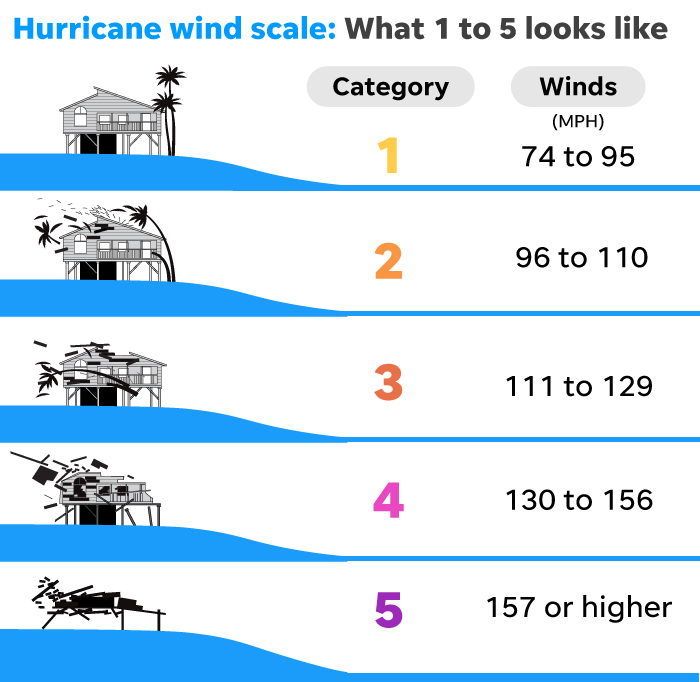
“The Saffir–Simpson hurricane wind scale is based on the highest wind speed averaged over a one-minute interval 10 m above the surface.”
I use GR2Analyst. RadarScope on iPhone or Android allows you to inspect the L2 bins as well. It is not a forecasters estimate. It is the actual observed wind velocity at the height of the beam. At 18:52Z near 26.6N, 82.5W the beam height was about 6600 ft. This corroborates the multiple SFMR surface measurement of 120 kts by AF307 and the visual observation of the storm surge. The data is incontrovertible. Ian’s winds are significantly higher than 64 kts. Like…by a lot. It defies credulity to think Ian isn’t even a hurricane.
| At 18:52Z near 26.6N, 82.5W the beam height was about 6600 ft.
Winds aloft are always much greater than surface winds, but these winds have no bearing on what’s happening at surface. Hurricane categories are based on observations at 10 meters!
| It is the actual observed wind velocity
No. It’s an estimation, not an actual measurement. Doppler radar only sees the radial speed. Objects moving perpendicular to the beam seem to have spd=0. True speed can only be modeled, using EAV and similar techniques. It may be accurate (or not) but it is not an observation.
http://unidata.github.io/awips2/cave/d2d-radar-tools/
Here is a current shot of Ian from windy.com show winds at 800mb (about 6400ft) traveling at 95kts. The surface speeds are much slower of course, less
https://www.windy.com/?800h,26.794,-81.922,7,m:erBadS3
But it’s not an observation, only an ESMWF model estimate. Proof? Take a look tat he same atmosphere, but now modeled by GFS. Now only 52kt.
https://www.windy.com/?gfs,800h,26.794,-81.922,7,m:erBadS3
Remember what the late, great George Box said: “All models are wrong, but some are useful”
So be careful when you label posts as “patently false”. It looks like you are the false prophet here.
I stand by what I said. I’ll take it further. Not only did the KTBW radar measure 135 kts at 18:52Z, it measured 170 kts with isolated bins up to 190 kts during the peak. I’ll take it even further still. Not only did the radar measure well over 65 kts at the beam height, but multiple measurements at the surface were well over 65 kts including SFMR, buoys, and ASOS stations. It is indisputable. Ian was not some mere tropical storm. It was a bona-fide hurricane and major hurricane at that. And any statement that Ian was only a tropical storm is patently false.
| KTBW radar … it measured 170 kts
| with isolated bins up to 190 kts during the peak.
Again, Doppler radars do not measure wind speed. Sounds like you are calling your radar tool EAV output “measurements”. No. They are Estimated Actual Velocity estimates.
| but multiple measurements at the surface were well over 65
| kts … including SRMR, buoys and ASOS stations
Are these sustained speeds, not gusts? Can you provide links? I am not denying that Ian could have made landfall as Cat 1, only that I have not seen any surface wind observations actually confirming this.
| It was a bona-fide hurricane and major hurricane
A hurricane is not considered a “major hurricane” unless it is Cat 3 or higher. The damage from Ian, so far, seems to be surge/flood related, not wind. Where are the pictures of buildings, trees and other objects smashed by Cat 4 (“almost 5”) winds? Color me skeptical. Please provide evidence of major surface winds.
Johanus said: “Again, Doppler radars do not measure wind speed.”
Yes they do. The products are widely available. WSR-88D velocity measurements are used in various applications including the detection of mesocyclones, downbursts, tornadoes, and even as inputs into numerical weather prediction models. You can download RadarScope on your own phone and see the L2 velocity products yourself. If you have GR2Analyst you can download the archived radar data files here and load them.
Johanus said: “Are these sustained speeds, not gusts?”
Yes. They are sustained.
Aircraft: Surface sustained wind measured 137 kts (157 mph) at 13:44Z and 14:26Z by NOAA2. Technically, that is category 5. The NHC declined to upgrade.
Buoy: BGCF1 and VENF1 both recorded hurricane winds and yet the eye wall did not intercept either of them.
ASOS: KPGD recorded sustained 74 kts wind before a 107 kts gust took the station out.
Johanus said: “A hurricane is not considered a “major hurricane” unless it is Cat 3 or higher.”
Yeah, I know. The NHC officially designed it a category 4. 4 is greater than 3. That means Ian was a major hurricane.
Johanus said: “The damage from Ian, so far, seems to be surge/flood related, not wind. Where are the pictures of buildings, trees and other objects smashed by Cat 4 (“almost 5”) winds? Color me skeptical. Please provide evidence of major surface winds.”
The Saffir-Simpson scale is not based on damage. It is based on measured wind speed. The measured surface wind speed at 13:44Z and 14:26Z were both 137 kts. That is technically a category 5.
BTW…the pictures and news this morning is heartbreaking.
re: “Again, Doppler radars do not measure wind speed.”
Wind-driven hydrometeors, or, anything else entrained in the ‘wind’ that can reflect or ‘backscatter’ RADAR RF energy is measured (observed would be a better word) for velocity. However, the output, ‘measured’ value is somewhat algorithmic (the product of processing via an algorithm in the WSR-88D RDA unit).
re: “No. It’s an estimation,”
Please cite in the WSR-88D documentation where this value is computed or ‘estimated’.
The point being made is that WSR-88D uses a model (algorithms, equations, heuristics, etc.) to produce a meaningful velocity. It is a true statement. But it is true for all wind measurements regardless of whether it is from a cup, vane, hot-wire, ultrasonic, acoustic, plate, SFRM, radar, interferometer, etc. They all use models to produce meaningful wind speed values. It is also true for nearly all measurements of any kind. You can’t measure something without having a measurement model. Sometimes the measurement model is simple, but more often than not it is complex like is the case for all wind speed, temperature, humidity, barometric pressure, etc. measurements common in meteorological applications.
re: “The point being made is that WSR-88D uses a model (algorithms, equations, heuristics, etc.)
Overly broad generalization, I don’t agree, and its still not a model. Maybe you’ve lost grasp of what is real, and what is synthesized, what is prognosticated, or extrapolated outside of known values on hand – Doppler Velocity IS a measured value, its not some ‘expected’, forecast or extrapolated value, however, given WHAT is measured (a variety of hydrometeors in the field of view of the RDA RADAR’s antenna) the MEASURED Doppler spectrum can be spread over a small range of spectrum centered about may be termed an average value, and something which does not appear on data plots is this measured spectrum spread, although it exists at least at the RDA (Radar Data Acquisition) level.
You can disagree all you want. But if you remove the model (algorithms, equations, heuristics) from the WSR-88D you aren’t getting a velocity. You aren’t getting anything from it. And that’s true for any wind speed measurement from any kind of instrument ranging from cup anemometer to stepped frequency microwave radiometers.
My point is that all measurements require a measurement model. So the contrarian position that an instrument that uses a model cannot make a measurement is patently false. WSR-88Ds take measurements. SFMRs take measurements. ASOS stations take measurements. Buoys take measurements. They all take measurements despite requiring a model (some so complex it requires hundreds or thousands of pages of source code) to do it.
Hurricane Ian has turned out to be an exceptional, major hurricane. Exceptional in the sense that its most devasting damage seemed to be rain/surge/flood relarted. I remember that Hurricane Andrew winds flattened Homestead Air Force Base in 1992.
My initial skepticism was based on the discrepancies between the ECMWF and GFS forecast models, and the initial lack of reliable ground-based surface wind observations.
I now accept that hurricane force surface winds were observed. But your link to the WC-130 wind data was pointing to “flight level” observations of wind speed, i.e. FL 200 or whatever, not valid for confirming hurricane surface winds. However these upper air observations can serve as raw data for making reliable estimates (more or less) of surface winds, which of course will be less than the flight-level measurements.
| My point is that all measurements require a measurement model.
I agree, that is true. The radar range model is so simple that a child can understand it. It works night and day, any where at any altitude. It just works, unless the equipment (or operator) is malfunctioning.
But Doppler wind speed estimation requires a much more complex model, and is subject to many restrictions on its use. For example, the estimates will contain errors if the winds are not horizontally linear or homogeneous over a sufficient area, or if vertical shear or vorticiity is present. But I think it can be useful tool for estimating wind speeds at synoptic scale, in the absence of conventional observations.
AF307 confirms the low surface level speeds. The activity is mainly at high altitudes.
Bingo, and the best way to make historical comparisons, plus storm surge, plus Simpson scale observable damage.
No. The best way to assess hurricane intensity is to measure the winds. Storm surge and damage assessments have their place, but are useless when the tropical cyclone is offshore.
You don’t seem to understand the difference between wind speed and gusts
I think sustained wind speeds are based on 1-minute averages. I think wind gusts are based on instantaneous measurements. I assume you disagree?
Ian is now about halfway on land (~1830Z) at Cape Coral, Fl.
If you’re watching real time on windy.com, you will see a green dot on the south wall of the hurricane,
https://www.windy.com/station/madis-TS755?radar,26.441,-82.105,8
That is MADIS TS755, an amateur weather station on Sanibel Island, with web page here:
https://www.pwsweather.com/station/mid/ts755.
He’s as close as you can get to the main action of this storm. Latest reading: WINDSPD=52 GUST=98, so tropical storm level (39-73mph), based on sustained wind, cat 2 (96-110mph) if gusts are counted.
I tried looking up the NDBC data for the nearby buoy station (FMRF1), but it hasn’t posted current data yet.
https://www.ndbc.noaa.gov/obs.shtml
| If you’re watching real time on windy.com …
To see these local weather stations, on windy.com, you must first click on a local name (e.g. “Sanibel”). Then a forecast will popup with an icon on the left margin for local weather stations. Click on that then you will see TS-755 as I have depicted in above.
WeatherUnderground has a video of a reporter standing in the eyewall winds on Ft. Myers (beach?). He was not being blown over, or anywhere close.
OMG doesn’t he know those are 200+mph winds? Hasn’t he talked to Duane or bdgwx about this? sarc
Gusts if short duration are not counted.
The Saffir-Simpson category criteria was based on surface observations averaged over 1 minute (i.e. “sustained”). That’s not what we’re hearing and reading on the web today.
The truth in journalism has become somewhat radicalized. I don’t blame the reporters, they report what they are told to, and they typically lack the technical knowledge to assess this deception. The upper media leadership tends to label a report as true only if it supports the activist narrative. Otherwise it is not reported. It’s Lysenkoism on an international scale.
No, blame the reporters. They want to talk it up to make it more exciting to get more views.
Even Fox, who are not out pushing a climate agenda, have Todd saying it has grown “exponentially” since this morning ( by which he means it got bigger ). Harris thinks a “chopper” flew into the eye of the storm and had to pull back because it was so intense. She seems to ignore what the eye refers to and that hurricane hunters are not “choppers”. The meteorologist in the studio did not bother correcting her.
I thought it was changed to one minute in 2019, from a longer period before?
I just downloaded the latest NDBC buoy data near Ian, including FMR1 up to an hour ago (2200Z).
https://www.ndbc.noaa.gov/radial_search.php?lat1=26.9&lon1=-82&uom=E&dist=150&ot=A&time=8
To save you picking through this data, here are the 20 highest wind speed and wind gust values in the last 8 hours. They are consistent with tropical storm level winds (39-73 mph). Station MADIS-TS755 (see my other earlier post) report was slightly stronger (52,98) because he was very close to the ocean when the storm wall went over his station.
What is the scale on the map you are showing? Does it show the wind speeds or rain amounts?
It is very strange that none of the NDBC buoys are showing wind speeds anywhere near what is being reported by the National Hurricane Center. If you go to AccuWeather, it’s hard to find wind gusts above 70 at any of the towns along the west coast of Florida. Maybe the difference is just altitude.
Surface levels buoy data confirmed by AF307 sonde drops near Ft. Meyers. The high wind speeds are measured at altitude.
AF307
That Sonde drop was 27 miles from Ft. Myer, due south of the eye center. The reort shows the wind estimate was 67 knots.
Earthnullschool shows around 60 knots at the same time a that point. The aircraft drop was into what looked to them as a stong point of the eyewall, ie. they selected what they guessed to be the stongest part of the storm in their flight path. Nullschool showed that stronger winds were to the west and northwest of the eye. The eastern half of the storm was clearly much weaker, confirmed by satellite radar imaging.
The online and network media freak show continues. Real time video clearly shows tropical storm force winds on land without exception. At about 4.20 Eastern time.
Yes, that confirms the Buoy data at the surface. The high speed winds are… were measured at altitude.
Why is that strange?
It’s strange if you want to believe that the wind speeds are 135 mph. The buoy data does not confirm anything more than a category 1 storm. If you look at the airport data posted at Punta Gorda, the wind speed max is in the 80s with much higher gusts.
Nelson said: “The buoy data does not confirm anything more than a category 1 storm.”
Which buoy did the western portion of the eye wall intercept?
Nelson said: “If you look at the airport data posted at Punta Gorda, the wind speed max is in the 80s with much higher gusts.”
Yep. Pretty impressive isn’t it. KPGD is well inland and experiencing easterly winds and yet still managed to report sustained 86 mph with a gust to 123 mph before the site stopped reporting. That is consistent with a major hurricane. Remember, maximum wind speeds occur well offshore out in the open waters. The winds over land slow down significantly due to friction.
Link?
I posted the picture above. You can download the data directly here if you want.
Venice buoy was close enough. https://www.ndbc.noaa.gov/station_page.php?station=venf1
Erast Van Doren said: “Venice buoy was close enough.”
No it wasn’t. It was close enough to confirm that Ian was at least a hurricane which several on here do not accept. But it was not close enough to measure the maximum wind in the eye wall since Ian passed south of it. What is interesting is that it still managed to record 75 kt winds despite missing the direct hit from Ian.
What happened to you trying to pass it off as a category 4 and almost a 5 and one of the top storms to ever hit the country. Now you are arguing that it might almost be a category 1.
I still accept that it was a high end category 4 at peak intensity.
I do not accept that it “might almost be a category 1”.
What I’m saying is that that VENF1 observation of 75 kts proves that it was at least a category 1 and debunks the claims being made here that it wasn’t even a hurricane. Furthermore, VENF1 was not even in the path of the eye and so it didn’t experience the maximum winds are yet it still observed hurricane force winds. Not only is that a testament to the intensity of the storm, but it also consistent with all of the other observations like the 137 kts in the wester eye wall at peak intensity. I don’t know how to make it anymore clear. Not only was Ian a hurricane it was a major hurricane. That is a fact supported by the data.
If Ian were a category 4 hurricane at landfall, we would see images of trees totally stripped bare with the roots and base of the trunk showing, and the trunks ripped off. Haven’t seen anything like that yet. We’ll see tomorrow. If you see any palm fronds remaining attached to trees with upright trunks, you’ll know that it was tropical force winds only. Please post any photos for Saffir Simpson scale estimates.
 ?width=660&height=644&fit=crop&format=pjpg&auto=webp
That’s why the narrative has been, “almost cat 5” the whole time. It was just ‘so close’ to blowing infrastructure completely away like Andrew did, will be the narrative afterwards. These criminals should be reinforcing the dangers from the real flooding instead of worrying about hyping the storm’s wind on paper.
The “cusp” h/t WaPo a la emanations from penumbras (twilight fringe) and other conflations of logical domains (e.g. cargo cult science).
Yep , a lot of live coverage I’ve seen has been a lot less dramatic than promised. No CNN reporters leaning into the wind while standing in a flooded ditch.
I just saw what appeared to be one of those office trailers one see for temporary office space at construction sites floating down the street in Ft. Meyer.
Odds are some of those near shore islands will have channels cut through them. Our family vacation house is on a channel near Port Charlotte. Sure not looking good. Hurricane shutters ain’t stopping that storm surge. Thankfully high tide passed before the wind has started driving the surge up Charlotte Harbor.
I think the storm surge is what will do a lot of the damage, especially bad on the coast. Fingers crossed for anybody caught in it.
But but.. earthquakes, gully cats, queen snakes… SMOG!
Watching the live stream as the eye moves to the center of the pan handle, we see it’s models all the way down.
Despite the track of the storm turning to the NE, the forecast is still doing its best to push it back onto the track the model was producing earlier in the day.
This is so reminiscent of climate models refusing to adapt to warming of the last 30y being about half that of the CMIP6 average and even doubling down with more extreme projections.
Traditionally, the Florida panhandle is the northwestern part of the state, ~ Pensacola to Tallahassee.
This headline will be hard to beat! Fort Myers is swallowed up by monstrous 18′ (eighteen foot) storm surge and 155 mph winds! https://www.dailymail.co.uk/news/article-11250413/Ian-strengthens-Category-1-hurricane-nears-Cuba-NHC.html
You tell me what’s going on look at the wind speed in Fort Meyer today. The storm surge must have been horrendous but wind. Just a windy day in North Dakota. Granted it inland a bit but the buoys out at sea aren’t that different. https://www.ndbc.noaa.gov/station_page.php?station=fmrf1, You can find this information at https://www.ndbc.noaa.gov/. Now as a surge and rain event it will not be much fun, I been in three eight rains storms in my life time and even with that everything stops for a while. My sister had a 20 inch rain event and ended with eight inch of water in their basement even though they are on a hill. These event are about as far from a ocean you can get. Its no fun to lose power in a rain event. Especially when you have a basement and a sub pump. It also disconcerting to have water half way up you drive way at the same time and it still raining. Floods are no fun.
How are you explaining this one away? There’s real, non-photoshopped video footage of sharks swimming in the streets of Florida and water receding because of tsunamis. Do you deniers think this is normal or good?
Stop promoting dumb Strawman attacks since it is a logical fallacy and dishonest.
Ian spawned a sharknado apparently.
Did you take your meds today?
What is there to “explain away”?
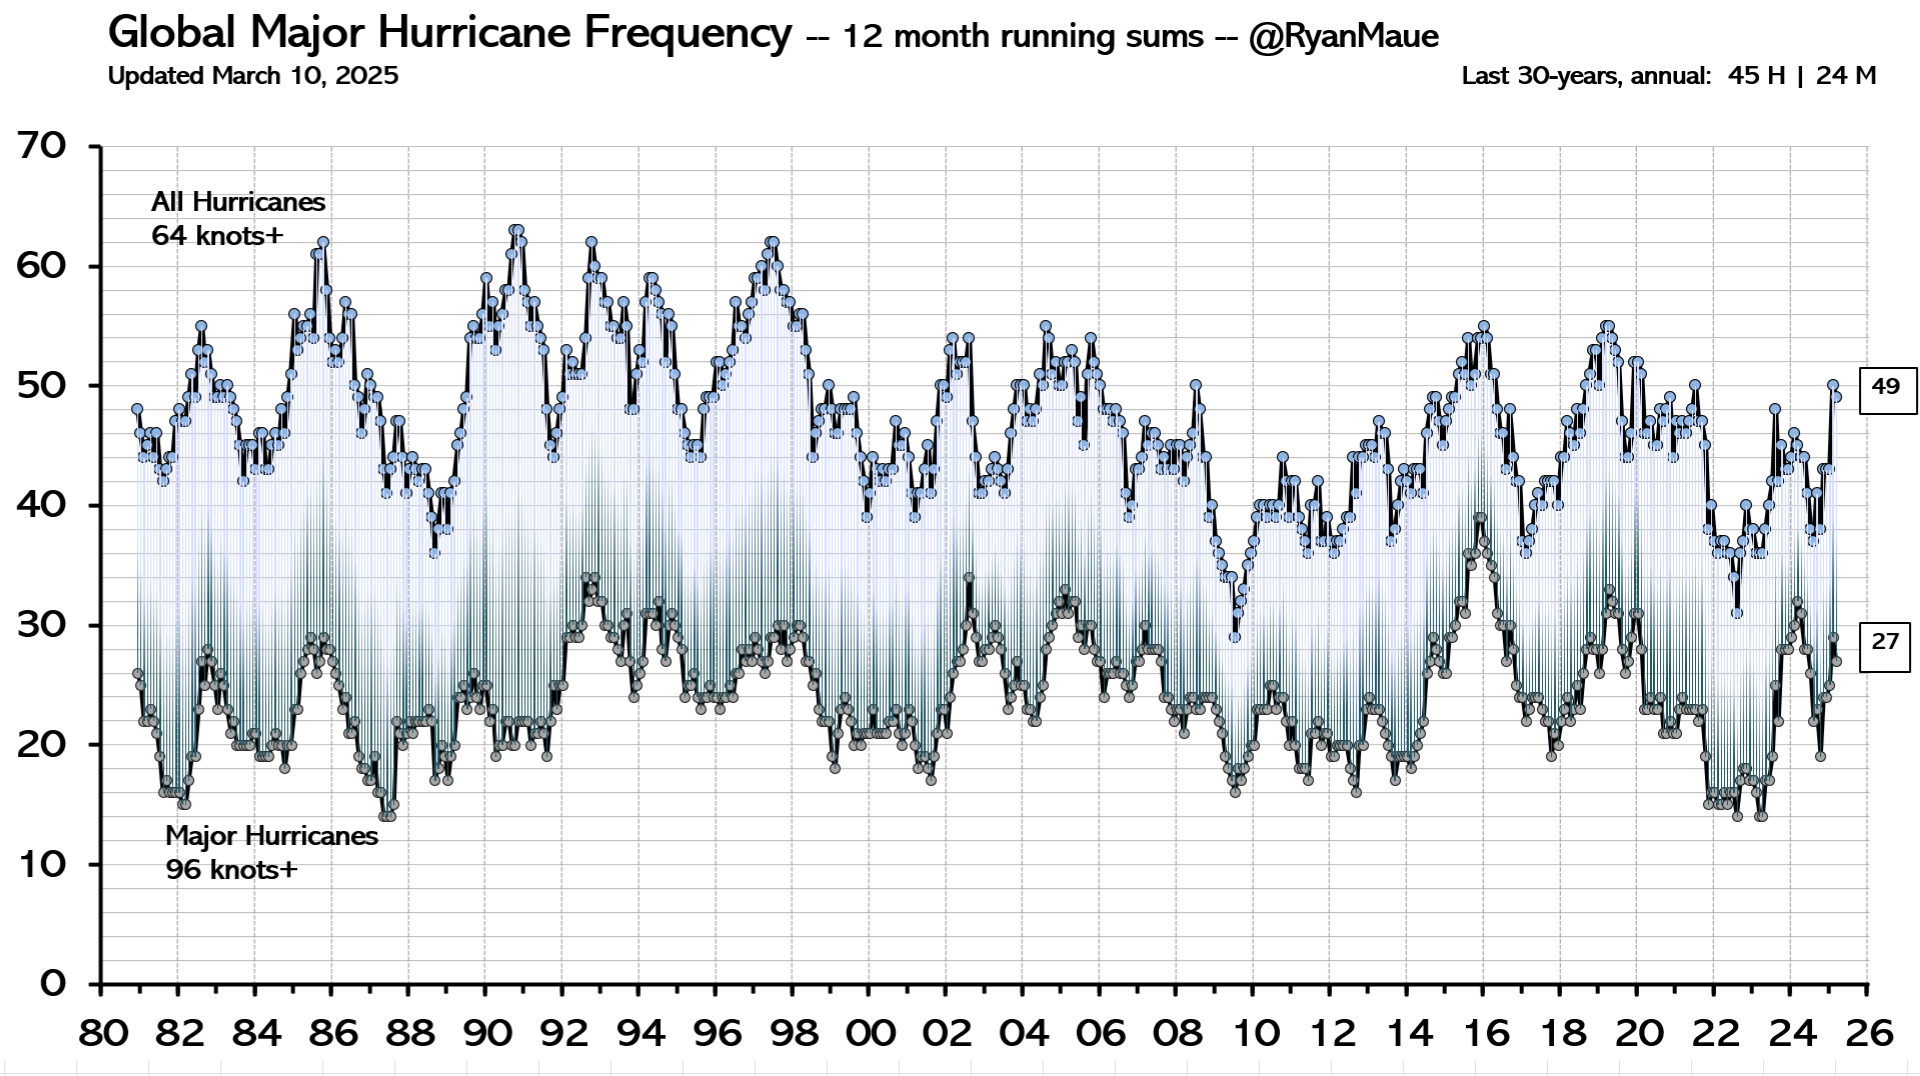
Global ACE is 81% of normal and:
Turn off the weather channel. You have obviously been watching more hurricane porn than you can handle.
“Do you deniers think this is normal or good?”
What are we supposed to be denying now, hurricanes or sharks? lol.
You’re so dumb.
Sharkicanes.
Are we not supposed to be den÷ING Florida?
PF does seem a little incoherent – IMHO.
Auto
Storms hitting the coast of the US are a perfectly normal and regular event. Tsunamis are the result of earthquakes and nothing to do with weather or the climate. Next time, do some research before you make a fool of yourself.
Sucks to be in Florida tonight, nothing good about the situation
But this is their reality.
Just as I have to accept polar high pressures in calgary winters with -40 for a week or two at a time.
It happens
Same thing has occurred in Florida for thousands of years wherever a hurricane makes landfall and will continue to do so.
I won’t make any mouth breathing comments like “don’t build in a flood plain” because people live there and love it, that’s why they are there and more go every year despite “climate emergency”.
But you have to accept the good with the bad, anything else is dishonest.
Like people who buy a house on a golf course then complain when golf balls hit their house.
Accept the reality of your situation and rebuild
Or leave.
I don’t blame people for buying in flood prone area that is otherwise desirable. I may question their judgement, but then I live in an earthquake prone area, so what do I know? I object to Federal relief funds that just put everything back as though there won’t be another one next year. (Maybe requiring the home to withstand a Cat 3 storm, and take only minor damage from a Cat 4? Obviously being impervious to a Cat 5 is ideal, but giant concrete blocks are expensive eyesores.)
Just checked current storm tracks:
Now that is what I call a “spagetti plot”. Like throw it against the wall and see what sticks !!
Models all the way down.
My forecast is that it will rain or go dark before the night’s out 😉
Another spot-on weather forecast, compliments of Greg. 👍 😉
The center of the cyclone is still over southeast Florida.

The shear front has moved far away into the Atlantic, so the cyclone remains over Florida.

A few more ‘wind markers’/a little more detail 10:14 AM EDT Thursday:
In case you haven’t noticed there is a stiff competition between the morons that do “news” commentary to see who can bring “climate change” up front and center as the cause of Ian hitting Florida. Current top three efforts I have seen are from:
Don Lemon
Joy Reid
Joy Behar
All climate experts of course.
I am confident more will enter into the competition and I await the sage advise and wisdom of Saint Greta of the Thunbergs.
We noticed.
As an update to my post yesterday, which many have criticized as being preposterous I add the following actual DATA. To recap I indicated the lies from the NHC continue, and the actual wind speeds are bumped up by 1 to 3 storm categories of late. They claimed it was 155 MPH sustained winds at landfall. But ground stations around there did not report anywhere near this value. Now see the image below, and you can peruse this data yourself at :
https://flightaware.com/live/flight/TEAL71/history/20220928/1553Z/KBIX/KBIX
This is the actual Hurricane Hunter, flying through Ian at about landfall. It is a C130, and it must use Va or Max Maneuvering speed flying in extreme turbulence. Va here is 240 MPH, which you can see in the ADS-B data from Flight Aware. (ADS-B is the transponder data from the aircraft, picked up by ground stations and also used for traffic collision avoidance and it transmits altitude, heading and position and derives ground speed from this data)
NOTE all speeds here are Ground Speed. Meaning actual airspeed of the plane, with the wind speed added or subtracted to/from the airspeed depending on the plane’s vs the wind’s relative heading.
Now in the image I have moved the plane to the position seen, which is the lowest groundspeed as the plane traversed through the eyewall. The plane was at heading 89 degrees and the wind was from approx 50-60 degrees. The ground speed here was 151 MPH and thus the reduction from their actual airspeed of 240 mph is 89 mph.
Now to back track, this is a combined head/cross wind, so to derive the actual wind speed we find it is between 110 and 120 MPH given the trigonometry here.
Period, no debate, these are the actual facts Jack! Oh and the plane was at 9,975 feet above sea level, so ground wind speed is lower! Here is the actual track log:
https://flightaware.com/live/flight/TEAL71/history/20220928/1553Z/KBIX/KBIX/tracklog
And the specific point is at 2:58:03
Now as additional reference, see this video:
https://www.youtube.com/watch?v=t_ulPiaF3Os&t=84s
Juan Browne is a 777 pilot, who flew C130’s in the military as well. Note he mentions they are flying at maneuvering speed (Va) which is the max airspeed to prevent damage to the airframe with abrupt control movements or turbulence. Va for the C130 is generally around 210 knots or 241.5 mph. The ADS-B data above shows they were using near 234 mph, but let’s use 240 for these purposes.
And to boot, watching the Weather Channel last night, they were indicating on tables on screen the max GUST recorded at eyewall landfall was 135 mph, and they also had 120 and 110 as max gusts nearby!!! So sustained wind, which is what the Saffir Simpson scale is based upon, is lower than max gusts!
I stand with my original claim – NHC is deliberately bumping up storm categories to unrealistic levels!
In closing, the storm was strong, and no doubt devastating to many individuals. I sympathize as I lived through the eyewall of Francis back in the early 2,000’s. The specifics of that storm was an expanding eye diameter, and slowed track, such that my house was in the 90-95 mph eyewall for freaking 22 hours! And it was not fun to say the least.
I do have a healthy respect for the potential energy of hurricanes. Which is why I like to do my own digging on the actual data, as I’ve learned not to trust the official narrative!
Hurricane winds are not maximized over land. They are maximized in the eye wall over open water. Ground stations are not expected to observe maximum winds in a hurricane. Furthermore, when the eye wall of a major hurricane goes over a ground station it often does not survive so you have no way of knowing the highest at that site anyway. This is true for KPGD which went offline after a 123 mph gust. If you want to know the maximum wind you have measure in the eye wall over open water using an instrument that survives. NOAA2 and AF301 both recorded 137 kts (157 mph) at the surface in the western eye wall.
That is a certain recipe to bias the present storms verses the past, falsely elevating the present.
BTW, what is the highest storm surge from Ian?
Are you saying Ian wasn’t a category 4 storm because NOAA and AF weren’t doing recon flights until the 1940’s?
I have seen reports they are already quietly downgrading the category
Where are you seeing that?
Max speed at the Venice buoy was 75 knots. Category 1.
https://www.ndbc.noaa.gov/station_page.php?station=venf1
And that buoy wasn’t even in the eye and yet it still recorded 75 kts which is well above the 64 kts threshold for a hurricane which some on here reject.
My girls at Daytona Beach decided to hunker down and ride it out. They still have phones service and electricity but the internet is down. Sending texts with pictures. Already 5″ of water running down their street and the worst part of the storm when they will getting the part of Ian that is feeding off the ocean again is yet to arrive.
Winds gusting to 70 mph. Enough to take out a big palm tree across the street from them. The palm blocks the nearest exit from their neighborhood but there is another.
Since Laura is the Dean of the online medical arts program of a university virtually all her work is done online from home. So the plan is that if they lose internet service for long they’ll pack up and come stay with us here in Indiana for a time.
From Joe Bastardi
https://pbs.twimg.com/media/Fdy7-nwWQAAQNei?format=jpg&name=small
Our family vacation home is on a channel off Charlotte Harbor near Port Charlotte. Here is some drone footage from the weather channel of that area. Sure doesn’t look good.
The Weather Channel on Twitter: “FIRST LOOK: Aerials in Port Charlotte, Florida, show severe structural damage and flooding in the wake of Hurricane #Ian: https://t.co/rHMEPjPhjM” / Twitter
I was on st martin watching Irma in 17 . The European model showed a direct hit days in advance . The American model showed it curving north of the island . I sailed south 3 days before it wrecked st martin with the US model still showing it going north of the island .
Levi has his Thursday video out. This storm will bring significant rain to basically all of SC, NC, and VA east of the Appalachians. Significant storm surge along almost all of the SC coast expected. So once again flooding threats both coastal and inland with flash floods. NHC shows it back to CAT I status by the time it reaches the SC coast despite cold dry air being sucked into the core of the storm now.
Tropical Tidbits
The hurricane came out into the Atlantic off the east coast of Florida. The visible eye of the tropical cyclone.

Though the forecast is to strengthen because it is going over warm water Levi is saying he doubts it will regain the classic eye structure because it is sucking in a lot of dry cold air now. We shal see! I mean it went right over Cuba with no degradation hardly noticeable and now comes off the coast with a discernible eye though obviously the north part of the storm is much more developed than the south.
Strangely there are very few tv pictures of this storm.