By Christopher Monckton of Brenchley
Amid all the fabricated panic about an imagined “climate emergency” caused by global warming, one fact will be found almost nowhere but here. As the totalitarians tighten their fell grip on all the news and internet media, any truth inconvenient enough to run counter to the ruthlessly-enforced Party Line is suppressed. Here, however, you will find the still, small voice of calm. Here is the truth. There has been no global warming – none at all – for 7 years 7 months. Yet, during that time, a significant fraction of the influence of humanity’s energetic industries and enterprises on the climate has occurred, without so much as a flicker of response from global mean surface temperature.

The revisionists are, of course, maintaining that long Pauses are exactly what one would expect even with an underlying warming trend. But they can only get away with that by saying that each Pause begins with a prominent el Niño Southern Oscillation warming in the tropical eastern Pacific, such as those which occurred in 2016 and, to a somewhat lesser extent, in 2020.
That, however, is an admission that, at least on the decadal scale, the natural variability of the climate is sufficient to mask the long-run trend. But it can only do that because the long-run warming trend is so very small. Here it is: just over half a Celsius degree per century:

“Aha!” they say, “But just look at the steepening of the trend from 1976 onward.” Well, yes, but did the CO2 concentration surge in the 1970s compared with previous decades? No: it continued to increase at much the same rate as before. It was another natural event – this time the Great Pacific Shift of 1976 – that coincided with, and inferentially had no small influence upon the more rapid increase in temperature over the 20 years to the late 1990s, when the trend leveled off to zero for almost 19 years, only to resume in the run-up to the Great El Niño of 2016, since when there has been no global warming at all.
As Willis Eschenbach has recently pointed out in one of his distinguished columns analysing the data, it is quite hard to detect any particular signal, whether natural or anthropogenic, once one describes that signal either as an absolute temperature (in which event the entire warming since 1850 amounts to an increase of less than 0.2% in global mean surface temperature) or as a trend plotted against the annual variability in regional temperature (in which event the trend is barely distinguishable from the noise). Willis rightly concludes that in a rational world this sort of common-sense perspective would apply.
My favorite example of a regional temperature record is the Central England record, which in fact encompasses almost all the English landmass, and has been kept since 1659. Here is that record since 1945:

Sure enough, the entire 1.1 C° warming trend since 1945 is not even a tenth of the annual variability. Global warming, then, is proving to be a non-event. There is simply not enough of it to justify the childish panic that has gripped those scientifically-illiterate politicians who, through craven fear of the unpersoning to which all of us who have dared to question the climate-Communist Party Line have been subjected, have failed to ask the rational questions that would at once expose the scam for the nonsense it is: immensely profitable to Messrs. Putin and Xi, whose agents of influence captured the environmental movement some decades ago, and just as immensely costly to the rest of us.
Now, one cannot expect anyone as cognitively challenged or as temperamentally totalitarian as Mr Biden, or anyone as scientifically challenged or as temperamentally totalitarian as Mr Johnson, to understand just what pseudo-scientific nonsense the climate-Communist case is. However, the White House has an army of advisors, and so – these days – does 10 Downing Street. When I was a policy wonk there in the Golden Age of Thatcher and Reagan and Pope John Paul II, there were just six of us in the Prime Minister’s policy unit. Now there are 43. Surely at least one of these effete drones can do an elementary macroeconomic analysis. Surely one of them can count how many beans make five. Hint: The answer is five.
Margaret Thatcher was sharp as a tack (but she was the exception). One method I used when explaining to the thicker sort of Minister (for he was the rule) what his proposed moonbeams-to-cucumbers policy would cost was to show how much an average family of four would have to pay for it.
So let us hold our noses and pretend that global warming will actually occur at the officially predicted midrange rate of 3 C° per century or per CO2 doubling (the two are about the same). Of course it won’t be anything like that much, but let us humor these nitwits.
IPeCaC’s current estimate is that every 4 units of radiative forcing will cause 3 degrees of eventual or equilibrium global warming. So each unit abated will abate three-quarters of a degree of warming that would otherwise have occurred. In the last three decades, between us we have all added just 1 unit of forcing in total, in more or less a straight line at one-thirtieth of a unit per year.
In the next 30 years, then, we should add another unit on business as usual. Therefore, if the whole world went from here to net-zero emissions by 2050 we should abate about half of that unit, and thus three-eighths of a degree of warming. With me so far, Minister? Here are some nice pretty counters, so that you can follow right along. If you pay attention, the Private Secretary will bring you some nice chocolate with your milk at teatime.
Trouble is, the whole world is not going to go to net zero by 2050. For the most striking feature common to the plethora of international treaties and agreements, accords and concordats and protocols about global warming is that every single one of them is directed solely at the West, using the flimsy pretext that our past sins of emission constitute a “historic climate debt”. Everyone else is exempt.
No, Minister, I’m not going to go into the strategic reasons why the Western economies have been made the sole targets of the climate treaties: you should have read the daily intelligence digest and attended the weekly briefings, but, like Mr Johnson and Mr Biden, you haven’t bothered.
Let’s play “Let’s Pretend”, Minister. Let’s pretend that the West accounts for as much as a third of all emissions, and that the West will actually reach net zero by 2050. No, of course it doesn’t and it won’t, Minister, but let’s pretend.
In that event, the warming abated by 2050, compared with what would have occurred on business as usual, will be just one-eighth of a degree. Yes, Minister, that’s right! One-eighth of a degree is one-third of three-eighths of a degree. Aren’t fractions exciting?
Now, Minister, let’s take Britain as an example of how much all this is going to cost. Britain emits about 1% of the world’s emissions each year. So our contribution to the West’s abatement of global warming would be 1% of three-eighths of a degree, or less than 1/250 degree. No, it isn’t a lot, Minister.
After correcting climatology’s elementary error of physics (they forgot the Sun was shining, Minister, and they added together the feedback responses from the Sun’s warmth and from warming by greenhouse gases and blamed them both on the greenhouse gases alone), the abatement of global warming by British net zero emissions would be not much more than a thousandth of a degree.
How much would that minuscule abatement cost us? That’s the right question, Minister. The Government’s climate change committee says £1 trillion (if you will believe it is as little as that, you will believe anything, as the Duke of Wellington used to say). The national grid corporation says £3 trillion. McKinsey, a leading consultancy firm, says £4 trillion, at a profoundly conservative estimate.
Let’s go with McKinsey’s figure. In that event, applying the UK abatement cost globally, abating the 3 degrees’ warming that IPCC predicts will occur over the 21st century would cost 3 times 1000 times £4 trillion. That’s £12 quadrillion, Minister.
Global annual GDP is £85 trillion, or £8.5 quadrillion over a century. Of course, were it not for the economic devastation caused by global net-zero emissions policies, GDP might be expected to grow over the century. But, as it is, the whole of global GDP, and then some, will have to be spent on emissions abatement. So nobody will be able to eat or do anything else. That’s how silly all this net-zero nonsense is.
There are 8 billion people in the world, or about 2 billion families of four. So the cost of global-warming abatement this century will be $6 million in total, or £60,000 a year, per family of four. In dollars, that’s $75,000 per year for each household, which comfortably exceeds the global mean annual household income.
Of course, none of that spending is in any way necessary because, after correcting climatology’s silly error of physics, there will not be enough global warming to do net harm. It will be net-beneficial.
So why are we doing any of this global-warming abatement? That, too, is the right question, Minister. It would be well worth your while to attend the intelligence briefings from now on. Then you’ll find out the answer. Well, all right, I’ll give you a clue: where do you think Mr Putin got enough billions over the decades to rebuild the Soviet armed forces that are now bogged down in Ukraine in pursuit of his special military massacre?
That’s right, Minister: sales of Siberian gas in ever larger quantities and at ever higher prices to nations that Putin’s agents of influence have persuaded to close down the competition from coal-fired power stations that used to generate electricity at not much more than quarter of the cost of gas. Did you really think that Greenpeace and Extinction Rebellion were genuine environmental groups? Don’t be silly, Minister.
And why do you think Mr Xi has spent so much time and effort buying up and controlling very nearly all the global output of lithium carbonate for electric buggies?
Now you’ve got it, Minister. The two most brutal Communist regimes in the world have been profiteering from Western governments’ woeful, wilful ignorance of elementary science and economics, and from Ministers’ fear of being unpersoned. Xi and Putin have been laughing all the way to the Moscow Narodny Bank.
Ought we to stop them by scrapping all this climate-emergency nonsense that they have so sedulously peddled, and by getting rid of the net-zero-emissions policies on both sides of the Atlantic?
Yes, Minister.
For Australia UAH lower troposphere, analysed by the Viscount Monckton method, shows no warming for 9 years 9 months.
One wonders about the physics of alleged CO2 heating, allowing big blobs of heat to selectively warm some regions while others cool. One is not suggesting that money changes hands.
Geoff S
The stratospheric polar vortex and Antarctic jet stream are already operating in Australia.

Ireneusz,
Thank you for the pretty pictures. I do not doubt that there are influences like polar vortices and jet stream distortions that can affect weather patterns. I have more of a problem linking them to CO2.
There is also the matter of the uncertainty in those temperature measurements that you show. Starting from first principles. with a lonely thermometer in a screen somewhere in this vast land before there were many educated people, one can calculate how far apart two temperature observations need to be to be statistically different. Assuming for the moment that normal distribution type statistics apply, I calculate that prior to 2000, the uncertainty as 2 sigma is about +/- 1.4 degrees C. It is a longer, more involved story as to how that uncertainty is diminished by the wishful thinking of people who actually believe that these maps represent something useful – something that could be reproduced, to look just the same, by another team of people working blind, with the same starting data. I await such an attempt to bring sanity into the mix.
If you changed the anomaly reference period from 1981-2010 to be 1991-2020, there would be a lot more blue, but what would that mean? Geoff S
During the winter season, the stratospheric polar vortex has a huge impact on temperatures in high and mid latitudes. The temperature of the stratosphere depends only on ozone production and ionizing radiation.
Well, does the temperature in Australia count towards the UAH average?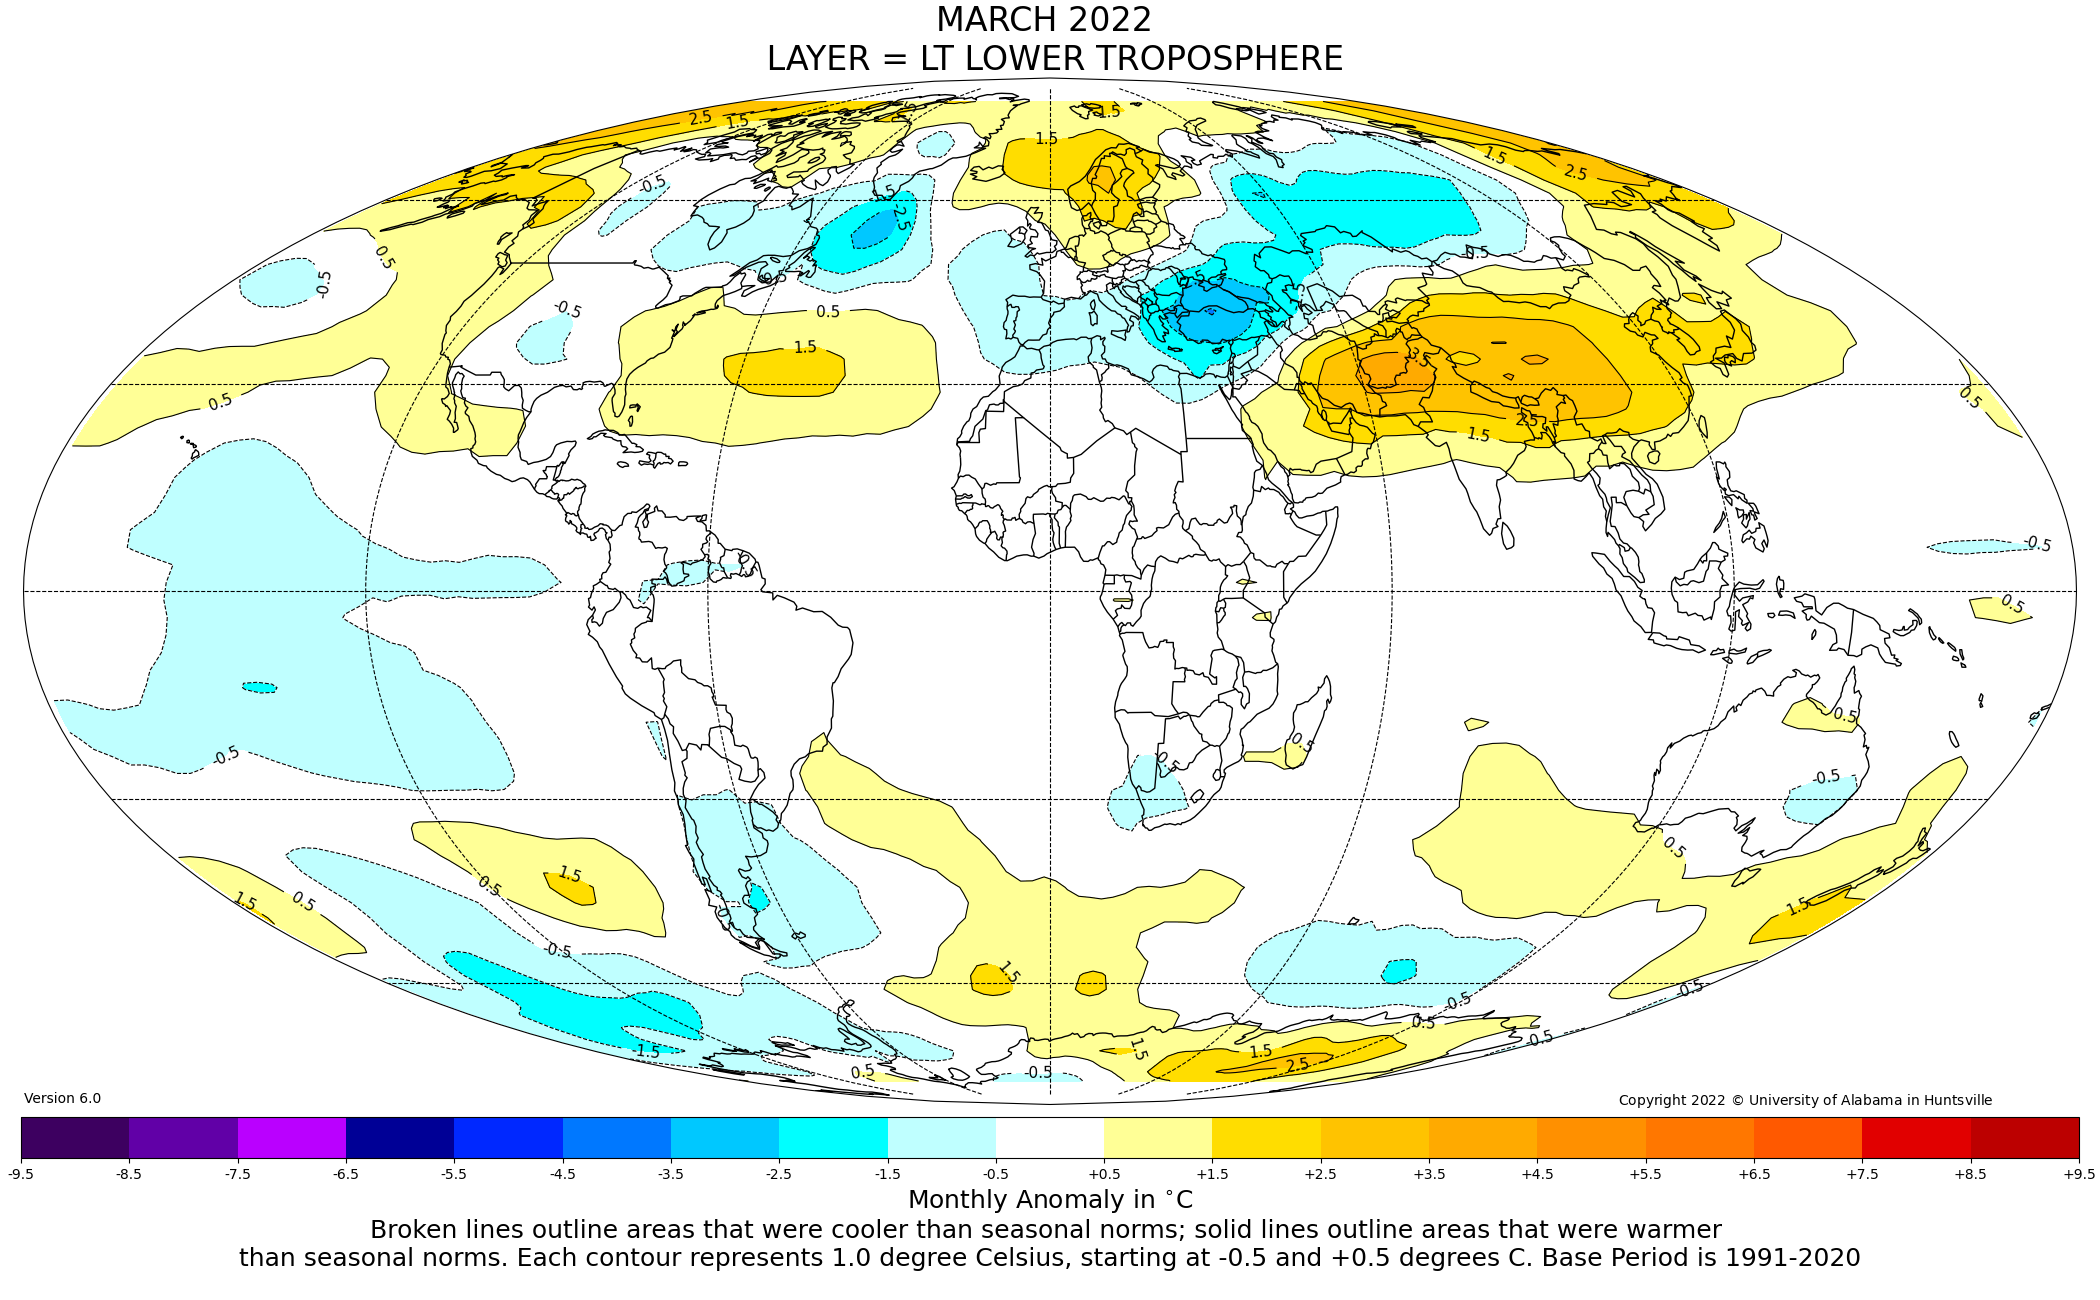
In March 2022, for example, it was 0.02.
The Outback must be having radiational cooling off the charts. Pretty interesting.
The last two years of Covid tyranny have illuminated how the climate war is not about the climate or about energy engineering, it’s all about Malthusian de-industrialisation and global depopulation, see https://metatron.substack.com/p/how-the-government-abuses-the-general?s=r.
Your periodic reminder that, contrary to Lord Monckton’s claim, the cause of modelers’ exaggerated predictions is not that “they forgot the sun is shining.”
Joe Born,
Then what is the cause of the woeful modelling exaggerated predictions? Being wrong by 100%, after spending a collective few tens of billions of dollars on modelling, is a horrible situation that should have absolutely disallowed the use of these crook results in any policy planning. Geoff S
My guess? Bad guesses (or “parameterizations,” as they’re euphemistically called).
So your interpretation is that they are wilful idiots, but not completely incompetent?
Monckton’s claims here, here, and here that predictions are exaggerated are dead wrong as I discuss here. His response to me was that emissions followed scenario A in the 1990 FAR which is also dead wrong. He goes silent after that. The fact is that IPCC FAR predictions from 30 years ago are actually pretty close and if anything may have actually underestimated the warming.
And, right on cue come the Pause Deniers. At this point, they seem to be in a phase where they can’t seem to decide whether the Pause doesn’t exist, or it does, but only because “the heat is hiding in the oceans”. Fun.
Soon, the length of the Pause may meet or even exceed the length of the Climate Liar’s noses.
I don’t think anyone has denied this pause; we’ve just questioned its relevance.
The suggestion being made by Lord M seems to be that we should attach some significance to a 91-month period that has a zero or negative trend. What he doesn’t mention is that the UAH data set currently has 431 overlapping 91-month periods, fully 114 of which, including this one, have a zero or negative trend.
Why should we believe that this current ‘pause’ will have any greater impact on the long term statistically significant warming trend in UAH than any of the 113 others did?
Indeed, the linear warming trend in UAH from Jan 1979 up to the month before this latest pause began, September 2014, was +0.11C per decade (green trendline in the chart). If you include the period of the latest pause, the full UAH trend is now +0.13C per decade (blue trendline). This period of pause is real, like all the others, but it has had the effect of increasing the overall warming rate in the UAH data set! (It’s because temperatures have generally remained at very high levels throughout this pause.)
The UAH data are free to download. Why not do that and check this for yourself?
The relevant question for which the satellite data is best suited relates to the mechanisms of change. There is little question that temperatures have changed in lower troposphere. This change is purported to be by a forcing from mid-upper troposphere imbalances. We can compare mid-troposphere to model simulations to assess the validity of this claim. Here we see there is very little predictive ability in the CMIP simulations. It calls into question the consensus claims.
If we are to be following the science, it is clear the science has departed from consensus concepts. In reality, natural tropospheric mechanisms have been disrupted by perturbation to terrestrial process. It is the surface where we should seek the ‘forcings’. Historically, vegetated systems well supplied with water brightened clouds by emitting hygroscopic bacteria for nucleation, and cooled the surface directly by latent heat flux. Land use change has disrupted these natural processes, and so climates have changed. If the intent is a return to climates of the past, the logical way is to return to landscapes of the past. However, this may be impractical. In any event, an accurate problem definition is useful when considering interventions.
The significance of the pause is *NOT* that the temperature isn’t going up, it is falsification of the belief that CO2 is the temperature control knob. CO2 over the past seven years has gone up but the temperature hasn’t. Why don’t you spend your time on figuring out why that is instead of whining about the pause not really being a pause?
We know why temperature hasn’t gone up over that period – it’s called ENSO. But when you say temperatures haven’t gone up, you mean if you ignore the fact that temperatures over that period were around 0.25°C than they had been in previous decade.
Here’s my graph showing the predictions for temperatures over the pause if CO2 had been the only factor.
”I don’t think anyone has denied this pause; ”
Yes MGC does, He is convinced the deep oceans are still warming while everything else is not. He is a magic enthusiast.
Sorry Mike, but you’ve already been shown the measurement data which demonstrates that the oceans are most certainly warming.
Anyone who pretends that the oceans are “not” still warming is just fooling themselves into believing something already shown to be false via direct measurement.
”Sorry Mike, but you’ve already been shown the measurement data which demonstrates that the oceans are most certainly warming.”
No I haven’t.
Cheng et al. 2022
Why do you keep referencing that?
Do you agree that there is a current pause or not?
If so, then there cannot be any warming of the oceans during the pause, regardless of the measurements. What is it about that don’t you understand?
I’m responding to your comment “No I haven’t.” It is a reference to measurements which show that the ocean is warming.
And I gave you a NASA link showing the SST has been cooling. And you *still* haven’t told us how the surface can be cooling while the deep ocean is warming. You’ve just thrown out some excuse about “mixing”.
You provided NASA data from 2006. That does not show “SST has been cooling” over the past 15 years, you mindless fool.
And you have provided – ABSOLUTELY NOTHING!
Are you saying that the ocean cooling has stopped? That we are not experiencing a La Nina?
Tell me again who is the fool?
MGC likes to look at graphs but does not like to use what is left of his brain to interpret it. A common problem with alarmists.
Yet another sorry spew of mindless gibberish from the WUWT cult crowd.
Tim claims “you have provided – ABSOLUTELY NOTHING”
Timmy Boy sadly continues to blatantly lie. I’ve provided a graph of the measured ocean heat content increase elsewhere in comments on this article.
But what else is new. This is what WUWT does to people. WUWT’s own incessant lying inveigles its brain washed sheeple into believing that outright lying is somehow an acceptable behavior.
The Monckton Pause is no less real than:
The overall trend of +0.13 C/decade lasting 520 starting in 1979/01.
The current 2x warming trend of +0.26 C/decade lasting 184 months starting in 2006/11.
The current peak warming trend of +0.34 C/decade lasting 135 months starting in 2011/02.
If we are to accept the 0 C/decade trend lasting 91 months then we have no choice but to accept all combinations of the trends including those I listed above.
Your handwavy whataboutism is duly noted.
If all trends are handwaving then the Monckton Pause must also be handwaving.
Nope. Nice try.
Would you mind providing an objective and repeatable test that can definitively adjudicate the “hand waving” nature of arbitrary trends and which shows that the Monckton Pause is not handwaving but the other 5e1198 of them are?
Yet another typical “Nuh Uh because I say so” from the WUWT cult crowd.
Two pauses in 14 years darn. I wanted to buy beach front property in Greenland and grow chardonnay.
Bogged down in a massacre?
Love your Climatology stuff Monky Baby, but, hey, stay out of world politics.
Idiot.
You would prefer “special military operation” then?
Moron.
CMoB,
I noticed you are still using version 4 of HadCRUT. That is the old version and is not updated anymore. The latest is version 5 and can be found here.
The “New Pause” with HadCRUT4 starts in February 2014 (and ends in December 2021).
The HadCRUT5 “Non-infilled” version, which replaces HadCRUT4, has a “New Pause” starting in March 2014 (and ends in February 2022).
Even the HadCRUT5 “Infilled / Analysis” version, which will replace the Cowtan & Way “kriged HAdCRUT4” dataset, has a “New Pause” that starts in July 2014 (and also ends in February 2022).
PS : Does anyone know why BEST still hasn’t been updated past December 2021 ?
Another good post from his Lordship. It challenges government on the credibility of climate alarmism and in particular, on the lack of serious warming. Of course, governments are deaf to this sort of stuff and cite that 197 countries signed up to the Glasgow Pact (whatever that is) after COP26.
I have my own favourite arguments, e.g. John Christy’s great graphs showing CMIP5 model projections compared with observation and the same again for CMIP6. If I need to attack the models further, there are good papers by Ross McKitrick and Pat Frank.
Politicians are not technically minded, as everyone knows, and so another approach is to point out that the IPCC is a political organisation, not a scientific one. The way it operates is well documented by the Canadian journalist, Donna Laframboise. If one looks into the history and the role of Maurice Strong, it becomes clear that the UN is using climate change as a vehicle for undermining capitalism, re-distributing wealth and gaining a greater role in global governance. The IPCC role is to collect evidence that CO2 emissions (mainly by Western, wealthy countries) has an impact on the rest. The wealth redistribution is, in fact, climate damage reparation.
The IPCC is therefore only concerned with man made CO2 and tends to ignore the fact that we have warmed up from the LIA. As far as I understand, it also chooses to ignore much of cloud effects, solar effects and the possibility of absorption band saturation. It is a powerful agency, and together with its sister agencies, the WMO and WCRP, it controls everything. (WCRP is in charge of the CMIP model program.)
This rather lengthy story has a point or perhaps a question. A great many people who present blogs on this site and do not accept the alarmist position, refer to the IPCC as a sort of definitive source of information. As I understand it, the IPCC effectively compiles a literature search which is then documented in a report. But during that process, information is selected or rejected until the resulting findings strike the right notes with the UN campaign. Nevertheless, the process covers a lot of gathered information and some of this is treated as reference material by all, including opponents who disagree with the IPCC.
Is this clumsy analysis sort of right? It could be at the heart of the problem that Chris Monckton is trying to address. How do you discredit the organisation that writes your science reference Bible?
Shrodinger’s Cat said: “I have my own favourite arguments, e.g. John Christy’s great graphs showing CMIP5 model projections compared with observation and the same again for CMIP6.”
Here is a graph of the CMIP5 prediction as compared to BEST, GISS, NOAA, HadCRUT, UAH, RSS, RATPAC, and ERA.
Make the argument as simple as possible and hope some come to their senses. Maybe in a few decades the truth will be undeniable. Let’s hope for some global cooling.
Let’s hope for some long overdue sanity.
It takes a great deal of solar energy for, during La Niña, warm water from the western Pacific to move eastward.
What confuses me is that I just did a Google search and found an older article from you that says the pause is 18 years long. So is the pause growing or SHRINKING?
Two separate pauses.
Pause is the new climate change ; )
Two pauses lasting a combined 25 years with an 11 month overlap, and during that time UAH shows temperatures have risen by 0.29°C.
Graph from:
https://skepticalscience.com/trend.php