By Christopher Monckton of Brenchley
The New Pause has lengthened by a further two months to 8 years 11 months. The least-squares linear-regression trend on the UAH monthly satellite global-temperature dataset for the lower troposphere shows no global warming at all from June 2014 to April 2023.

As usual, the start and end dates of the New Pause are not cherry-picked. The end date is the most recent month for which data are available; the start date is the farthest back one can reach and still find a zero trend. It is what it is.
For comparison, here is the entire dataset for 44 years 5 months since December 1978. It shows a long-run warming rate equivalent to 1.3 K/century, of which 0.3 K has already occurred since January 2021, leaving just 1 K to go (on the current trend) until 2100, by which time reserves of coal, oil and gas will be largely exhausted.

We are no longer in la Niña conditions. They ended in March 2023, when the temperature of the Niño-3.4 region of the equatorial eastern Pacific rose above –0.5 K:

One reason why el Niño-watchers predict that an new el Niño is on its way is the gradual westward extension of the warm pool in in the top 300 m of the tropical Pacific, the hallmark of el Niño, as NOAA’s image shows –

NOAA thinks there is a 62% chance of an el Niño developing. If it does develop, it will probably bring the latest Pause to an end. Nevertheless, these long Pauses are a visual demonstration of the now-undeniable fact that the rate of global warming predicted by IPCC in 1990 has proven to be greatly in excess of the subsequent outturn.

First, note that the 0.136 K/decade trend in the 400 months (exactly a third of a century) since 1990 is barely above the 0.133 K/decade trend since 1978. Notwithstanding business-as-usual increases in emissions, very little acceleration in the global-warming rate is evident.
In fact, IPCC’s midrange prediction in 1990 of 0.3 K/decade business-as-usual warming since that year exceeds the 0.136 K/decade real-world global warming rate observed since then by a startling 120%. Indeed, even the 0.2 K/decade lower bound of IPCC’s 1990 prediction exceeds observed reality by close to half. Yet policy is being made by scientifically-illiterate governments on the basis of the 0.5 K/decade upper-bound prediction, which exceeds observed reality by a shocking 268%.

Annual emissions are indeed tracking the business-as-usual Scenario A in IPCC (1990). The growth is almost double that which was predicted under Scenario B. It is now clear that IPCC’s conversion of emissions to forcings, and thus its predictions of global warming, had been grossly overwrought and that, therefore, the threatened “climate emergency” is absent.
Its very unusual very for large El Niños to develop only 8 years after another. I’m very interested to see what happens post 2024.
Yes, Super Los Niños are typically 15 to 17 years apart.
There is no reason not to have one follow another one a year apart.
In fact a Super El Nino is just that, two ordinary ones in quick succession
No, it isn’t. They have pronounced single peaks, as in February 2016.
A super El Nino is one in which ONI >= 2.0.
Yup. Defined by amplitude.
The probability of 2 large El Ninos developing 8 years apart is not unusual.
2 El Ninos in 8 years is almost guaranteed probability wise [but does not have to happen].
So if you start with a large El Nino there should be at least one, possibly 2, in the next 8 years.
Since an El Nino can be small, medium or large 33.333% of the time each the chances are about 67% that a second large El Nino will follow the first within 8 years.
Hope that helps settle your concern.
That helped my understanding of the subject. 🙂
Angtech:
La Ninas are primarily caused by the injection of reflective (dimming) SO2 aerosols into the stratosphere by VEI4 and > volcanic eruptions, although the current La Nina is the result of large industrial SO2 aerosol emissions from China and India, there being no recent large eruptions.
Most El Ninos are also volcanic-induced, caused by the settling out of the volcanic SO2 aerosols (fine droplets of sulfuric acid), which also coalesce some of the industrial SO2 aerosols in the atmosphere, on the way down, so that the atmosphere is cleaner than before, causing temperatures to rise and cause an El Nino.
Clean Air efforts to remove industrial SO2 air pollution has also resulted in temperature increases, most notably in 1997-98 and 2014-16.
The current departure from La Nina conditions can only be due to fewer SO2 aerosols in the atmosphere, either due to fewer emissions from China and India (unlikely), the settling out of volcanic aerosols from the 2020 Jan and Dec eruptions (probably), and to Net-Zero activities (also happening)
See “The Definitive Cause of La Nina and El Nino Events”
https://doi.org/10.30574/wjarr.2023.17.1.0124.
If the El Nina’s are caused by the industrial emissions, especially of coal burning China, India, etc., along with volcanic eruptions – then we’re headed for permanent El Nina conditions!🫨🤔
PCman999:
Correction: La Ninas, not El Ninas
On the surface, your conclusion appears to be correct, but things are more complex than that.
Even though industrial SO2 aerosol emissions from China and India remain high (tho emissions from China did drop a bit in April), there are still millions of tons of SO2 aerosols from other sources in the atmosphere, whose removal will continue to cause temperatures to rise.
AVERAGE Jan-Dec anomalous global temperatures during the 2015-16 El Nino (caused by decreased SO2 emissions, from China, at that time) rose to 0.923 Deg. C. (Hadcrut5), indicating how high temperatures could rise with a decrease of 23 million tons of industrial SO2 aerosols.
Industrial atmospheric SO2 levels in 2019 (which included China) were 72 million tons (an update through 2021 is expected later this year)
Temperatures in some areas of India/Pakistan/Asia last year reached 30 Deg. C. in some months even, though we were in a La Nina.
Although industrial SO2 aerosol emissions will continue, we will probably move out of La Nina temperatures later this year..
The strength and direction of the trade winds cause Los Ninos, Las Ninas and Las Nadas. What causes variation in the winds isn’t entirely clear, but the solar cycle, especially its UV component, is implicated.
https://www.sciencedaily.com/releases/2019/03/190328150946.htm
March 29, 2019
Source:
Aarhus University
Summary:
Researchers have found robust evidence for signatures of the 11-year sunspot cycle in the tropical Pacific. They analyzed historical time series of pressure, surface winds, and precipitation with focus on the Walker Circulation — a vast system of atmospheric flow in the tropical Pacific region that affects patterns of tropical rainfall. They have revealed that during periods of increased solar irradiance, the trade winds weaken and the Walker circulation shifts eastwards.
https://www.nsf.gov/news/news_summ.jsp?cntn_id=115207
Solar Cycle Linked to Global Climate
Earth-sun distance also affects ENSO:
https://news.berkeley.edu/2022/11/09/earth-sun-distance-dramatically-alters-seasons-in-equatorial-pacific-in-a-22000-year-cycle/
Although it wasn’t clear the context was of super El Ninos. Two super El Ninos within 8 years of each other is rare enough that it hasn’t occurred since at least 1950.
Large El Niños don’t seem to be required any more for new temperature records to be set. The warmest Sep, Nov, Dec (2019) and Jan (2020) in UAH all occurred as a result of the relatively mild 2018-2019 El Niño.
Those occurred because of a sudden stratospheric warming event https://www.drroyspencer.com/2019/10/record-antarctic-stratospheric-warming-causes-sept-2019-global-temperature-update-confusion/#comments. Those effects lingered along with the mild El Niño causing 2020 to be very warm for its first few months. That winter also happened to be the winter with the hugely positive Arctic Oscillation if I remember correctly. This phenomenon kept most of the northern hemisphere very warm while Alaska and the North Pole suffered an extremely cold winter, undoubtedly adding to the warm value.
Did you ever play Yahtzee?
I did
Statistics was invented to better understand things like games of chance and random events. Everyone should study some statistics in order not to fall victim to vagaries.
Right now I put the odds at around 50% for a negative AMO phase transition in 2025. Unlike the La Nina cooling influence, this would lead to decades of cooling. We had an El Nino in 1994-95 which was then followed by the last AMO transition. The 2023-24 El Nino might similarly be a lead in to the next transition.
It takes about 2 years for a full transition and some of the cooling effects take time to develop. It’s not going to be immediate.
“One reason why el Niño-watchers predict that an new el Niño is on its way is the gradual westward extension of the warm pool in in the top 300 m of the tropical Pacific, the hallmark of el Niño, as NOAA’s image shows.”
Do you mean eastward extension of the warm pool?
Yes, that is what he means as that is what’s happening. People are so conditioned to calling the western American continent “The West” that it becomes a noun. You can go to “The West” by traveling eastward, which is what the warm pool does.
The warm pool piles up in the WestPac under the usually prevailing trade winds from the east. As the trades weaken, warm water sloshes eastward into the CentPac. In El Nino classic, the winds slacken enough to let the warm water reach all the way across the EastPac to equatorial South America.
In Super Los Ninos, the trades can even reverse, blowing from west to east, further piling up warm water off Peru and Ecuador. Feliz Navidad! (For Peruvian farmers, not fishermen.)
It’s down to the solar cycle, especially its high energy UV component.
Coal will not be exhausted by AD 2100. Not even close.
Christopher, as you say, ‘it is what it is’ . That won’t stop the woke from claiming it is something that it isn’t, though. They do not bend to mere mathematic truth, or to real science. The Woke have an agenda above such trivia as the reality we are part of. The woke have the 24/7 voice of media generating mass hysteria for them. With that constant alarmism drowning out all other voices, even honest truth is being ignored. Who listens to real science when Greta or Al or fly me round the world John Kerry advises the media we are in a climate crisis. The woke/ESG movement have plenty more capitalist Virgin’s (sic) to throw down the maw of their volcanic socialist today, before we arrive at poverty and destruction in their imaginary utopia, which is actually a dystopian future. ‘You will own nothing and be happy’ …apparently, just like Greta, Al, John K and all the other WEF advocates.
Finally, on a more positive note. We are seeing some sanity beginning to emerge. The ever present impressionable young are starting to ask question. Often discretely because the peer pressures they live with, make out and out scepticism almost impossible.
Keep beating the drum of truth, ultimately that is the only strength we realists have but it ultimately beats everything else.
“The ever present impressionable young are starting to ask question.”
Their opportunities for economic success are diminishing, partly due to this climate bullshit wasting vast resources. Some are starting to see the connection- for those who don’t yet get it- they need to be told in blunt terms.
If it does it will probably be very weak. I for one can’t wait.
To be meaningful, a hypothesis has to be falsifiable. On its own, a “62% chance” is not falsifiable, so one would have to put a lot of such predictions together to evaluate them. Anyone know how NOAA is going on the full set of all ENSO predictions over time?
But, but, but there’s a 62% chance. Not 50-50 or 6 out of 10. They have it down to a 1% uncertainty. 97% of “scientists” agree. It’s a consensus man! Get on the bandwagon willya?
The full rate of warming in UAH up to immediately before this current pause (Dec 1978 – May 2014) is +0.11C per decade. That’s a total warming of +0.39C.
The full rate of warming in UAH up to the present (Dec 1978 – Apr 2023) is +0.13C per decade; a total warming of +0.59C.
During this latest pause global warming, as measured by UAH, has increased by +0.20C and the full rate of warming is faster now than it was before the pause started.
If this was a pause in global warming then let’s hope we don’t see an acceleration.
Random walk theory does not apply to ENSO because ENSO frequency is determined by climatic conditions. The chance of El Niño was close to zero during the Holocene Climate Optimum, and very very high between the Medieval Warm Period and the Little Ice Age.
Making unsupported assumptions and ignoring the evidence kill science.
Javier Vinós
“Random walk theory does not apply to ENSO because ENSO frequency is determined by climatic conditions ”
–
Javier says ignore probability when it does not suit his narrative?
Give me a break.
Random walk theory applies to probability situations Javier.
You know this.
Whether it is due to unspecified climate conditions [ name your causes not your observations] or to the three specific ones I pointed out it is acting akin to a random walk.
–
How do we know?
Because of the high unpredictability at the time of you when we would most like to know.
–
As for this
“The chance of El Niño was close to zero during the Holocene Climate Optimum,”
The Holocene is the name given to the last 11,700 years* of the Earth’s history — the time since the end of the last major glacial epoch, or “ice age.”
I guess it was zero because they did not have instruments to record ENSO measurements for most of the holocene.
As for proxies
“However, reported results of ENSO variability during the Holocene are controversial. ENSO reconstructions based on lacustrine sediments from southern Ecuador indicated a general increase of ENSO variance from the early to late Holocene and weak ENSO activity during the early Holocene9,12. Cobb et al.6 synthesized multiple ENSO reconstructions based on δ18O records from fossil corals and highlighted highly variable ENSO activity during the Holocene, which contradicts the results of previous studies. A later mollusk-based study of Peru3 also reported variable ENSO changes during the early Holocene, comparable with the late Holocene, and contradicted the hypothesis of limited ENSO variability before 5 ka.”
–
“The chance of El Niño very very high between the Medieval Warm Period and the Little Ice Age.”
–
Does not quite fit with comments like,
persistent “La Niña-like” mean state during the MCA
“During the first half of the LIA global ENSO records indicate dominance of La Niña-like conditions”.
Making unsupported assertions in an area where unreliable proxy estimates are your only evidence is not the sort of science you usually present.
–
Read what I wrote again.
Ignoring the personal attacks,
Random walk theory requires that each step is not determined by the previous ones, i.e., it is random. This requirement is not fulfilled by ENSO, since the warm-water volume pool is depleted with Niños and refilled with Niñas. There is a reason why you cannot have three Niños in a row, and the most you can have in a five-year period is three Niños, while you can have three Niñas in a row and up to four Niñas in a five-year period. Sorry, no random walk.
Moy et al. ENSO proxy has been confirmed in multiple instances, to name a few:
And you should definitely read the following study from the opposite side of the ocean, outside the equatorial zone, with several different proxies and the same conclusion:
Perner, K., Moros, M., De Deckker, P., Blanz, T., Wacker, L., Telford, R., Siegel, H., Schneider, R. and Jansen, E., 2018. Heat export from the tropics drives mid to late Holocene palaeoceanographic changes offshore southern Australia. Quaternary Science Reviews, 180, pp.96-110.
The problem is with the corals and might be due to the migration of the ITCZ.
Javier Vinós
Reply to angech
‘Ignoring the personal attacks,” Sorry.
Random walk theory requires that each step is not determined by the previous ones, i.e., it is random.
–
“Random walk theory suggests that changes are random. This means that temperatures/pressures move unpredictably, so that past temperatures cannot be used to accurately predict future temperatures. Random walk theory also implies that the ENSO readings are efficient and reflect all available information.”
–
That is my take which differs from yours.
–
“This requirement is not fulfilled by ENSO, since the warm-water volume pool is depleted with Niños and refilled with Niñas.”
Not a valid argument. If you cannot see why it is difficult to help.
Tossing a coin is similar to depletion and fillings, a needed act to get outcomes but not a rational of the outcome.
OK?
–
“There is a reason why you cannot have three Niños in a row, and the most you can have in a five-year period is three Niños”
This is not correct.
Straight out not correct.
Can you have Nino? in any year? Yes.
Can you have 2 in a row? Yes
Can you have 20 in a row Yes?
God plays dice with the universe.
–
” while you can have three Niñas in a row and up to four Niñas in a five-year period.”
–
That conflicts with your previous reasoning.
The definition of either event is akin to 5 months of temperatures above 0.8C Technically this means one could have 10 events of either in a row with 2 month gaps.
OK?
“Moy et al. ENSO proxy has been confirmed in multiple instances, to name a few:”
–
No proxies can be validated for the times that exist outside of recordable temperatures and pressures.
That is why they are called proxies.
They try to use known non ENSO data to correlate with known ENSO and non ENSO data.
Confirmation is impossible.
See Mann et al tree rings to understand why.
Or Gergis who ignored the proxies that were not suitable.
You left out that other studies, a lot of them do not agree with these studies.
Why is that?
I can find numerous references to studies contradicting each other with assumptions to past ENSO data.
You know that.
Points 12, 16, and 20 seem to be the strongest.
Rich, I appreciate your attempt at humor.
The numbering is not mine but appeared during pasting of the comments I wrote.
The strongest points of those with comments attached are 1, 4 and 14.
Basically it is like people following the sharemarket who adopt the same faulty techniques.
Exemplified by two comments.
Past performance is no guarantee of future outcomes and
the trend is your friend [until it is not].
Javier mistakes climate conditions as being drivers of ENSO like financial reports are drivers of share value.
Following the trends from past similar situations gives you a trend, a direction, but both current temperatures and depth temperatures and trade winds are responses to the real drivers.
Just like financial reports show where the company was in the recent past, not the Bud light advertising or the cryptocurrency management going on in real time.
–
This is why the SOI did a series of recent fluctuations in what the BOM can only forecast as a strong smooth dip.
Change can occur suddenly at any time in the real drivers of the climate, the daily sun output, the amount of clouds and where they are and to a much lesser extent winds and currents.
They are the real drivers, that is why the sudden reversals occur.
No, I don’t.
Javier tiene razon!
TheFinalNail writes “During this latest pause global warming, as measured by UAH, has increased by +0.20C and the full rate of warming is faster now than it was before the pause started.”
Lies and statistics. Use 2016 and there is no difference. None of it relates to climate which is much longer term and doesn’t include individual events in any meaningful way.
The method used to produce the ‘lies and statistics’ is linear regression: exactly the same method used by Lord M to produce his trends in the above post. I hope he’s not offended by your rhetoric!
I doubt he is. The lack of a trend over the last 9 years doesn’t mean anything for climate but it does for modelling.
CMIP says pauses like these should be expected. It also says that nearly 100% of the months should be within an extended pause like this if not at the end of the pause then at least the middle or beginning.
We were told that if any pause lasted longer than 15 years then the models were wrong. When a pause lasted over 18 years excuses turned up and models were forgiven.
Who told you that? Can you post a link so that we can see the context?
BTW…CMIP5 says that 5.0% of the months should be included in a trailing trend of 180 months that is <= 0 C/decade. UAH so far has 5.8%. That’s pretty good for being “wrong”.
I encourage you download the data from the KNMI Climate Explorer and verify this for yourself.
https://www.theguardian.com/environment/2014/feb/09/global-warming-pause-trade-winds-pacific-ocean-study
In the years leading up to this admission, “climate scientists” such as Matthew England were poo-pooing the observations of a “hiatus” (pause) in the rate of global warming.
Mugged by reality, we used to call such revelations.
That article says in no uncertain terms that the pause of that time is expected and that it could continue through the remainder of the decade.
My point was that prior to England’s “study”, he and cohorts were poo-pooing the existence of any sort of a “pause”.
(thereafter conveniently re-labeled as a “hiatus”)
Can you post a link to England “poo-pooing the existence of any sort of pause”?
Lots of links in this article
https://wattsupwiththat.com/2014/02/10/a-review-of-professor-matthew-englands-say-anything-past-failed-claims/
England was a very strident performer at lambasting “deniers” on Australian taxpayer funded ABC back before his “conversion” to acceptance of a “hiatus”.
(I think England is a closet acolyte of Groucho Marx –
“These are my principles. But if you don’t like them, I have others”)
Thanks. It appears the context here is that although there is a hiatus to the warming in the atmosphere the warming in the climate system as a whole continued.
One of the articles even explains that the current hiatus at the time isn’t unique.
And I still don’t see any reference here to the original challenge that a 15 year pause means that models are wrong.
https://wattsupwiththat.com/2014/09/10/quote-of-the-week-its-a-remarkable-document/
Thanks. The source is here. The quote is:
So pauses are lasting less than 10 years are expected to be common whereas those lasting 15 years are not expected to be common. That somewhat matches up with CMIP5 data I download. That is zero trends of 15 years are ruled out 95% of the time and would represent a discrepancy between expectation and observation should pauses of that length occur more than 5% of the time.
I have no problem calling the UAH TLT observed frequency of 6% (UAH) a discrepancy. But keep in mind that HadCRUT, NOAA, GISTEMP, and BEST and all show 0%. And even the UAH TTT [Zou et al. 2023] frequency was only 3% nevermind that neither UAH TLT nor TTT are what NOAA or modeling was describing.
Digging out old (so quite possibly wrong) memories:
The original question was along the lines of “how long a pause in temperature increases would rule out global warming”
Phil Jones said 10 or 12 years, then Tom Wigley amended it to the 15 year figure. It may have been based on the paper you referenced, or vice versa.
In any case, 15 years is outside the 95% CI, if statistical measures apply to model runs.
Isn’t that like saying “I’m right except when I’m wrong?”
I must be missing something here. It sounds like you’re saying that if model M predicts outcome X and X is observed to happen then M must be wrong.
No, it is more a matter that if Model M predicts outcome X, and X is only observed sometimes, then M has poor skill.
X is a probability density function. It is expected to only occur sometimes.
And the other times? A PF needs to cover all the possibilities. Since it supposed to add up to 1, then what is the probability of M?
I don’t mind if we see an acceleration in the beneficial milding of the climate. What exactly is it that the rusty nail is so worried about?
Not worried. Just pointing out that, contrary to the implication of ‘the pause’, the UAH data provides clear evidence of continued global warming.
Evidence for something that has not yet happened? Wishes or forebodings are not reality.
it ain’t warming here in Massachusetts
“evidence of continued global warming.” – that doesn’t seem to react to how much CO2 is being pumped into the air – why is the temp graph so flat after the 1998/99 El Nino – China and India were coming on strong as well as other developing nations but no constant temperature increase.
The graph is basically flat temp plateaus that get shifted by the occasional El Nino, not by constantly growing CO2 emissions.
ENSO, AMO, volcanic aerosols, and solar irradiance can explain most of the variation and post 1998/99 flatness.
I love how FN uses his mathematical ineptitude to try to make a point. ! 🙂
His only weapon.
No warming for nearly nine years
Only El Ninos to cause the warming.. So Not CO2
Alarmists are praying for another NON-CO2 El Nino to prove CO2 warming.. D’OH !!
You hit the nail on the head! Why so many climate alarmists miss this point is just beyond me. CO2 doesn’t cause El Nino’s, the sun does. When the sun hasn’t produced an El Nino there is no global warming. If CO2 was the cause of warming it would happen continually – no pause! If might happen at a slower rate when there is no El Nino but it would still happen if CO2 is the control knob.
Climate science needs to start looking at other causes than CO2. They have settled on the correlation between CO2 growth and temperature growth as being a causal relationship and will adjust mountains of data and violate all statistical rules in order to try and validate that assumed causal relationship.
“Why so many climate alarmists miss this point is just beyond me.”
You keep demonstrating that there a number of things that are beyond you, including the idea that more than one thign can affect global temperatures at the same time.
But not CO2.
But that’s just it –
the climate crisis cult (hereafter “The CCC”) casts the myriad climate influences as extras way into the background, while it promotes the (reticent) CO2 as the center-stage star.
But CO2 is really the “diversity hire” in the full cast of “The Climate Capers”.
Being the dominant player in the long term trend 1) does not mean it is the only contributor to the long term and 2) does not mean that it is the dominant player in the monthly, annual, and even decadal variation.
So why constantly boost its positioning to the front of the parade?
Why not call more sunlight-exposed roofs the dominant cause of non-sensible incremental warming?
Sunlight exposed roofs are not the dominant player in the long term warming trend.
If it isn’t the dominant player then why aren’t we focusing on the dominant players? What *are* the dominant players? Does anyone in climate science even have the smallest clue?
I hear tell it’s the Sun, Tim.
But they could just be vicious rumours, put out by “deniers”.
🙂
Not to mention that its cooled since 2015. We know that’s only 8 years, but it shouldn’t be cooling if CO2 was the control knob. Before the short term cooling, there’s two staircases, more consistent with something natural. There also shouldn’t be a 18 year pause.
I think the only way this ends is through the painful Net Zero or a cooling trend as Richard is betting on. I wouldn’t mind the cooling, and you guys grew up in a colder climate. It’s not optimal but it has to happen.
Short term cooling is not unexpected. And generally speaking the fact that variation exists is not inconsistent with CO2 being a control knob that also modulates the global temperature.
And betting on long term cooling when the planetary energy imbalance is positive is a fight against the 1st and 2nd laws of thermodynamics that you will lose eventually.
You do realize the 2nd law has more restrictions on heat than the first law, right? For instance, condensation is irreversible without work being applied! Heat flows from hot to cold. Meaning that as you go up the lapse rate, less and less heat flows downward.
What causes the ‘warm pool’ in Indonesia, which seems to have a depth of about 100 meters? About half-way across the Pacific, it starts to rise and reaches the surface off the coast of South America. What is the source of the heat energy? It doesn’t appear to be air temperatures, or solar heating. Might it possibly be geothermal warming?
https://scitechdaily.com/the-thumping-thermometer-of-yellowstone-unique-pool-reveals-secrets-of-hydrothermal-system/
Or an unknown ocean current? You got me. Is geothermal the same as volcanic heat?
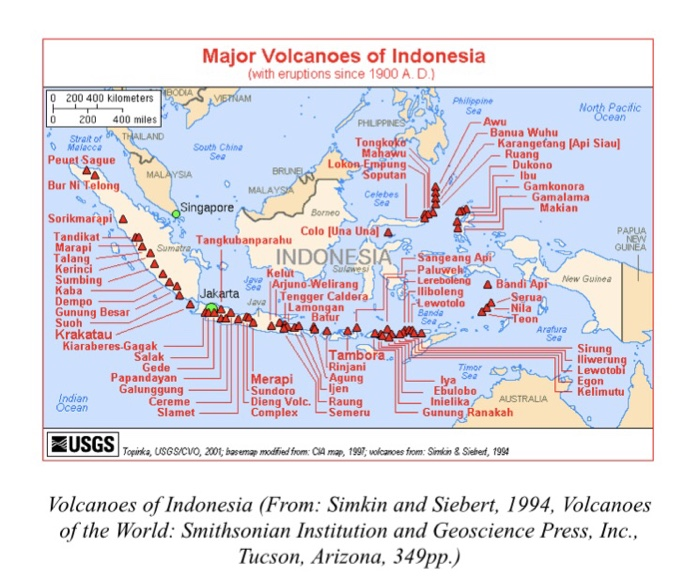
Yes and no. Geothermal is usually spoken of as the average gradient or increase in temperature with increasing depth. However, it’s unlikely that any ‘average’ place exists. There are hot spots that have been used for geothermal power generation. Typically, the hot spots are former volcanoes that are either dormant, or if extinct, still have residual heat at depth. Indonesia is well known for major volcanoes:
Tim Gorman:
“CO2 doesn’t cause El Ninos, the sun does”
Not quite true. The warmth of the sun is modulated by the amount of reflective SO2 aerosols circulating in the atmosphere. Increase them, as due to a volcanic eruption, or industrial activity, and temperatures decease. Decrease their concentration in the atmosphere, and El Ninos can form, either by the settling out of volcanic aerosols, or due to “Clean Air” efforts, etc.
See: ” The Definitive Cause of La Nina and El Nino events”
https://doi.org/10.30574/wjarr.2023.17.1.0124
While the last highlighted statement is technically correct a “better” (IMNSHO) overview is to look at how “the full rate of warming” in the UAH LT (V6) dataset, i.e. the trend from December 1978 to a given end-date, has changed over time.
That is provided in the image file attached to the end of this post.
We saw (past tense) an acceleration as the end-date shifted from September 2014 to November 2020, as the trend moved from ~0.11°C/decade to almost 0.14°C/decade.
Since November 2020 the “full rate of warming” trend has been de-celerating, and has now fallen to ~0.133°C.decade … yes, that’s only ~4%, but it’s still a reduction in “the full rate of warming”.
Here you ended your OP with the word “acceleration”, which isn’t a measure of the “global warming” but rather of the “rate of change of the trend in global warming”.
Look again at my graphic. Since November 2020 there has clearly been de-celeration.
Why would we see an acceleration in warming? We have more than doubled the amount of CO2 we put in the atmosphere over that period and haven’t seen any.
My worry is that if we become unable to continue doubling our CO2 contribution (exponentials are a bitch to keep), we might actually see significant cooling (gasp!).
Then, the people at the base of the Himalayas will get reduced water flow in the rivers because of reduced melting.
It is time somebody took the IPCC to an international court for spreading false information, Clintel?
Which international court? I would be very interested to know what treaty established such a court and does it only deal with spreading false information? Perhaps Dominion can sue Fox there and get another $800 million for spreading lies about the 2020 election.
Izaak, all the lies in the 2020 US election were told BEFORE the ballot was held.
Truths are still just starting to catch up now. Maybe they never will.
Should we also take them to court for their 2007 projection of +0.2C per decade for the next 2 decades?
UAH currently shows +0.24C warming since 2007. More IPCC falsehoods!
You’re sweeping a giant El Niño under the rug, and using it to say the warming has accelerated. Every time there’s a giant El Niño, there is a new baseline created. That graph is just 3 sets of stairs.
El Ninos is all the alarmists have.. they use them to show warming…
That proves they KNOW it isn’t CO2.!
The E in ENSO stands for ‘oscillation’. Over time, ENSO tends to sum to zero. That’s why I used the whole UAH data set. You’d have to ask Lord M why he only uses ~8 years.
El Niño-Southern Oscillation (ENSO)
The E stands for ediot.
Got me there. O.
We know why Lord M uses the current 8 year period. So do you. He explains it every time he makes this post.
And he never tells people that the expectation is that nearly 100% of months will exist somewhere within an extended pause like the current one.
I think he leaves that up to you.
ENSO does not sum to zero. That is an incorrect statement.
I does over the long term. For example, from 1979/01 to 2023/02 it is 0.
Am I also sweeping the recent triple-dip La Niña under the table?
Since 2007 ONI has average -0.2.
Final Nail
Ja. It is not only the actual numbers but also the fact that the current warming is not unprecedented in the past. I can show you the places here in the Cape where at some stage the water stood 30 meters higher than today. So who decided that 1,5 K must be ‘catastrophic’?
In fact, the IPCC is spreading ‘fake news’. Also, some, like myself, have calculated that more CO2 in the atmosphere cannot be the cause*. Taking into account the mechanism whereby warming by CO2 is supposed to work, how come are the NH waters warming 5 x faster than the SH waters?
https://www.woodfortrees.org/graph/hadsst3nh/from:2008/to:2023/trend/plot/hadsst3sh/from:2008/to:2023/trend
Sorry this comment should have come at the bottom of this thread.
*An evaluation of the greenhouse effect by carbon dioxide | Bread on the water
I wonder how you get it that a picture appears in the comment? Can someone here tell me?
Hit the Tip Jar bigtime Henry and see if that works.
If you include a link to a URL that ends in an image file, e.g. the string ends in something like “…/filename.png” or “…/filename.jpeg”, it will sometimes be “uploaded” automatically by the WUWT code for your browser at the point you edited the “a” HTML tag into your post.
NB : This is definitely not systematic ! My assumption is that there is a combination of a “whitelist” (for “trusted” sites) and/or a “blacklist” (for “known nefarious” sites) to prevent both “legal liability” and “avoid offending people’s sensibilities” issues.
When typing a comment you may have noticed a small “landscape painting” icon at the bottom-right of the editing box.
Clicking on this allows you to “upload” an image file from your local hard disk to the WUWT file server that will then be added to your post.
With a computer most people have a “screenshot” application that allows them to create such a file. With a smartphone (or tablet ?) they probably don’t …
NB : With my computer setup I can only “upload” one image file per post using this method, which is always “stuck onto” the end of the post. YMMV …
Another assumption on my part is that the short delay between hitting the “Post Comment” button and the post appearing to everyone will include the moderator(s) looking at your “visibly noticeable” image and checking it doesn’t violate the WUWT guidelines.
let me try

Thanks. It worked. …filename.png
Note how the NH oceans are warming 5 times faster than SH oceans.
One wonders why.
“One wonders why.”
Well, I dont’ know, but I saw a hysterical article yesterday claiming the oceans are over heating.
This scaremongering about ocean warming (not directed at you, Henry, but the alarmists among us) is an ongoing narrative from the climate alarmists.
Do a search on “ocean overheating” and just look at how many articles over the years have claimed the ocean is overheating, and yet the ocean has not overheated. These people are trying to make a mountain out of a mole hill. That’s alarmist climate science for you.
“When typing a comment you may have noticed a small “landscape painting” icon at the bottom-right of the editing box.
Clicking on this allows you to “upload” an image file from your local hard disk to the WUWT file server that will then be added to your post.”
Testing:
So the picture resides on the WP server.
You learn something new around here every day. 🙂
Tom
I get what you say. The warming is not at all terrible frightening. I am not laying awake about it! But you do understand that it is a bit dumb trying to make this into a global average of 0.35K (over the period 2008 to 2023)
Yup.
It won’t last forever, but reading stuff here and asking myself “Can I confirm (or refute) that ?” is probably at least slowing down the ossification of my brain … slightly …
It’s good to have confirmation from two independent sources that my conclusions about posting graphics here weren’t completely baseless.
Thx Mark.
I will try the method that Tom used tomorrow. It is a bit late here and it won’t work from my phone.
let me try
Wow. It worked! Solar polar field strengths are going up again.
8C this morning
How chilly do they think it should be?
The real heat can be found at the offices of the Grauniad….
“””Jewish Board of Deputies will meet executives from the Guardian as criticism mounts over ‘sickening’ anti-Semitic cartoon”””
https://www.dailymail.co.uk/news/article-12038575/Jewish-Board-Deputies-meet-Guardian-executives-criticism-mounts-anti-Semitic-cartoon.html
Toasty – temps got down to 4.2°C out on The Fen this morning. no wonder the farmers are depressed
Meanwhile, farmers in Holland have been utterly roasted and hung (kicked) out to dry.
https://www.telegraph.co.uk/world-news/2023/05/02/eu-approves-controversial-dutch-farm-buy-out-plan/
Read through that and you’ll discover that the real reason for buying out the farmers ## (ones near Nature Reserves especially) is because of a housing shortage in Hollandia and because the want to build solar farms
They actually want to expand housing and solar panels onto/into nature reserves and are using the junk science of Nitrogen emissions to do it
this is perfectly grotesque whats going on here and now – a true monster is on the loose
## Esp as seemingly Holland is The 2nd Largest Exporter of food into world/global markets/shops/consumers.
Quality food at that = saturated fat (dairy) pork and chicken
Didn’t we see what happened when Ukraine, exporting just 3% of the world’s wheat (toxic nutrient-free mush) supply ‘disappeared’
I’m not so sure that the problem is scientific illiteracy as much innumeracy. As scam artists, the policymakers depend on the majority of the public being innumerate.
To provide an off-topic example, our dear befuddled leader, Dementia Joe, is sending a whopping 1,500 soldiers to defend the southern border. If they were uniformly deployed along that border, there would be about 22 football fields between each soldier.
This “surge” reinforces the border patrol (which has over 60,000 agents), by less than 2.5%. It is a completely meaningless gesture designed to trick the innumerate public into thinking that “something is being done”.
Of course the 1,500 soldiers won’t be deployed uniformly across the nearly 2,000-mile border intercepting illegal immigrants. More likely they will be tasked with providing services to the undocumented Democrats, preparing them to be released into the country to begin collecting government benefits.
Whether it is illegal immigration or Climate Catastrophe, our criminal overlords depend on the innumeracy that they so carefully inculcate through our worthless public school system.
“Of course the 1,500 soldiers won’t be deployed uniformly across the nearly 2,000-mile border intercepting illegal immigrants. More likely they will be tasked with providing services to the undocumented Democrats, preparing them to be released into the country to begin collecting government benefits.”
These 1,500 troops will just be doing paperwork. Since there is going to be a surge of people in the near future, the Trafficer-in-Chief, Joe Biden, is sending in the troops to process the illegal aliens into the country faster. That’s his “solution” to the problem, get them moving quicker. He doesn’t want big crowds of people at the border. It’s not good optics. So he wants to move them out as soon as possible.
What should happen, and definitely should happen if a Republican is elected president in 2024, is the U.S. military should be sent to the Southern border to shut it down to illegal traffic. There is an invasion going on there, along with unprecedented criminal activity, which threatens every thing we value, and that calls for a drastic measure.
Put U.S. troops on the Southern border and finish the wall and that will send the proper message to those seeking to take advantage of radical Democrat lunacy.
That would be a campaign promise of mine, if I were running for president. I would shut that border down to illegal traffic come hell or highwater.
Looks that way Tom
https://babylonbee.com/news/biden-deploys-1500-troops-at-border-to-help-register-new-voters
And also this:
https://babylonbee.com/news/white-house-announces-illegal-immigration-has-decreased-90-percent-since-they-redefined-it
Apparently there was a drop of 90 percent among one small category of illegal immigrants, and the White House spokesperson attributed that 90 percent to a reduction in the total number of all illegal immigrants.
Deliberate, or a mistake? Who knows? I would go with deliberate, because I’m skeptical of radical Democrat motives.
It’s not illegal to apply for amnesty upon crossing the border. I take it you would erase the following from the Statue of Liberty:
“Give me your tired, your poor,
Your huddled masses yearning to breathe free,
The wretched refuse of your teeming shore.
Send these, the homeless, tempest-tost to me,
I lift my lamp beside the golden door!”
Here’s a good story about the poem.
https://www.theatlantic.com/entertainment/archive/2018/01/the-story-behind-the-poem-on-the-statue-of-liberty/550553/
The poem was written by one person. It doesn’t obligate the United States to do anything. It is asperational.
Here is a history of immigration laws. Sometimes they are restrictive, and sometimes they are not.
https://www.history.com/topics/immigration/immigration-united-states-timeline
Most of the illegal immigrants are coming to the United States for the economic benefits they will recieve, not because they are being directly oppressed by their governments.
If they are legitmately being oppressed, we should let them in, but that is a small number compared to what is going on now.
You might change your tune when illegals start camping on your doorstep. Have you seen the pictures of illegals wandering around the streets of El Paso lately?
Eventually, if the Trafficer-in-Chief, Joe Biden’s dereliction of duty isn’t changed, they will be camping on everyone’s doorstep.
How many millions of people do you think we can take in without drastically affecting the people living here detrimentally? Unlimited?
How many prisoners, and criminals and terrorists have come across the border in this free-for-all? You think we should continue doing this?
Joe Biden’s dereliction of duty with his refusal to control the southern border is an attack on the American people.
It ‘s time the American people fought back and demand that the U.S. Southern border be closed to all illegal activity, whatever that may take, including putting tens of thousands of U.S. troops along the border to prevent illegal entry and deter Mexican Criminal Cartels.
There is a typo here, it should be January 2001.
Truly amazing what a triple dip La Nina that no climate computer predicted can do.
To me, what is unusual this time is that both the Atlantic and the Pacific are warming up. Has this ever happened like this in our lifetimes?
Joe Bastardi has been pointing out how difficult that situation makes it for certain aspects of long range forecasting because of the lack of analogs for these conditions.
“Nevertheless, these long Pauses are a visual demonstration of the now-undeniable fact that the rate of global warming predicted by IPCC in 1990 has proven to be greatly in excess of the subsequent outturn.” [my emphasis]
I appreciate these updates from Monckton of Brenchley. It is indeed plain to the honest observer that the slowly rising concentration of CO2 does not overpower the natural operation of the climate system in respect to warming.
It is for a similar reason that I keep posting this link to the NOAA GOES East Band 16 images. It is a visual demonstration that even the direct static warming effect of increasing concentrations of CO2 cannot be isolated for reliable attribution of the warming trend observed in the entire timeline of the UAH satellite data. The radiance at 30C on the “brightness temperature” scale is 10 times the radiance at -90C (determined from the empirical equation and constants from the user manual.)
https://www.star.nesdis.noaa.gov/GOES/fulldisk_band.php?sat=G16&band=16&length=12
It is visually apparent that even a 1C direct static warming effect disappears in the observed scene of such highly variable emitter outputs. This is the same band of wavelengths at the edge of the “atmospheric window” from which a significant portion of the static warming effect of CO2 is computed.
The “forcing + feedback” framing of the climate issue is misleading and incomplete. This is not only because of the exaggerated feedback, as Monckton of Brenchley has consistently shown in his series of posts about the misapplication of control theory in climate analysis. It is also because the direct “forcing” itself, which I hold to be valid in the static case, is not capable of causing heat energy to accumulate on land and in the oceans to significant effect, once the dynamic operation of the atmosphere is properly considered.
Watch from space.
You’re not going to be able to isolate the CO2 effect using channel 16 easily. The main reason is because CO2 is a well-mixed gas so there’s not any variation in CO2 coincident with a homogenous temperature area to notice the difference. However, with a discerning eye you can exploit the limb effect to do this. If you find a cloud-free area of homogenous temperature starting at a limb and moving towards nadir you might be able to spot the difference. Right now in looking at GOES-16 channel 16 at 14:20Z on 5/3 I can see the CO2 effect looking north of Hawaii at the limb and observing how the ABI is receiving more radiation as we work our way towards nadir. The effect is subtle. Also, remember that channel 16 is only catching the fringe of CO2’s bending vibrational mode.
Thank you for reading my comment.
“You’re not going to be able to isolate the CO2 effect using channel 16 easily.”
It wasn’t a challenge. One can miss the larger point of my comment by looking for a tree, not appreciating what the forest is demonstrating over the entire scene.
‘It is for a similar reason that I keep posting this link to the NOAA GOES East Band 16 images.’
And thank you for doing so. It’s a good reminder of what Wijngaarden & Happer (2003) stated in their abstract:
“[R]adiation to space from Earth’s real atmosphere originates from both the surface and all altitudes in the troposphere.”
Clearly, this happens even in the wings of the much ‘dreaded’ 667 cm-1 band!
Thank you for your reply and for this reference. I see that it is 2023 instead of 2003 – must have been a typo. Looks like I have a lot of reading ahead of me from this link.
https://wvanwijngaarden.info.yorku.ca/publications/
Dibbell’s comments are valuable because he’s looking at the various sources of high entropy radiation outputs. one can actually visualize them.
The sun provides low entropy input (few highly energetic photons), and the Earth system then converts them to high entropy output (many less-energetic photons).
This conversion, from high temperature radiation inputs to equal but lower temperature outputs, is what it’s all about.
All internal dissipation process is involved – from fluid dynamics, to the water cycle, and even biospheric interactions.
Dibbell therefore allows us to think in terms of thermodynamics, not just earth system energy balance.
Recognizing that the open condensing atmosphere can never maintain a radiation imbalance, due to:
i) the practically limitless dissipation pathways;
ii) the simple fact that the atmosphere is free to mass flux in any direction;
iii) the critical feature that atmosphere is free to condense at any height; and
iv) the atmosphere is open at the top directly to space for radiation flux,
we know there can be no sustained radiative heat trapping of IR in atmosphere. The atmosphere is fully dynamic. Thermodynamics makes it so by gradients of all kinds – temperature, pressure, and moisture, etc.
The atmosphere has practically limitless degrees of freedom ‘forcing’ it to dissipate energy at the maximum possible rate. The greater the gradients, the more the dissipation.
The only practical constraints are mass density and buoyancy potential (phase change process). It is essentially only these processes which impose limits on dissipation (i.e. mass flux and phase changes).
The limits operate under the constraint of solar input magnitude i.e. maximum dissipation under strict constraints.
Therefore, we must recognize that this dissipation process in atmosphere must result in an equilibrium rate of evaporation, condensation, and turbulent flux.
The result is the requirement for atmospheric equilibrium cloud cover, and so the atmospheric equilibrium albedo as a consequence.
It is this equilibrium albedo which constrains the global atmospheric circulation (mass flux) in its maximum state. The atmosphere can never be observed to be radiatively ‘imbalanced’ and trapping heat as a residue of historical forcing. It is simply unphysical.
Additionally, there can be no sustained positive feedbacks from water cycle when it is the water cycle itself acting simultaneously as the primary dissipation mechanism in circulation.
I often wonder if any of these so-called “climate scientists” have ever so much as operated a large steam engine.
It’s called “physical science” for a reason. As opposed to “model science”.
Climate scientists are trained only to work with the products of models based on TOA energy balance concepts.
It is physicists who who must produce the models. It would be novel in climatology to work within the realm of thermodynamics – i.e. to employ the foundational principles and constraints. e.g. global steady-state mass flux in relation to forcing.
This requires diagnosing the conversion of energy from low entropy states (e.g. solar) to the dissipative heating (high entropy) states occurring at the surface and throughout the atmospheric column.
It should be obvious to anyone that comparing a theoretical global average blackbody Planck curve to the TOA spectra is absurd. Only a very small fraction of high entropy photons emitted originate from the surface. Most are produced by dissipation process within the turbulent condensing atmosphere.
Wikipedia has a couple of statements about the second law of thermodynamics. They are very appropriate. Primarily, that the 1st law, has no restriction on how energy flows or moves, backward or forward, it’s all the same. The 2nd law does place restrictions on heat flow, and by consequence, where energy ultimately ends up.
“””””The second law of thermodynamics is a physical law based on universal experience concerning heat and energy interconversions. One simple statement of the law is that heat always moves from hotter objects to colder objects (or “downhill”), unless energy in some form is supplied to reverse the direction of heat flow. “””””
“””””The second law of thermodynamics in other versions establishes the concept of entropy as a physical property of a thermodynamic system. It can be used to predict whether processes are forbidden despite obeying the requirement of conservation of energy as expressed in the first law of thermodynamics and provides necessary criteria for spontaneous processes.”””””
Hi Jim,
Yes, there is no thermal equilibrium in the fluid dynamic condensing system. Mass and energy is conserved, temperature is not. It is a non equilibrium steady state system.
The real atmosphere always requires an increase in entropy for any energy transfer or transformation. Without this physical mechanism there would be no mass flux, no evaporation, no cloud, no winds.
In practice, instead of an internal radiative forcing warming the surface, it is far more probable for mass flux and evaporation to result instead. This is an expression of 2nd law.
The steam engine reference is a good reminder that the power of energy transformations becomes visible and quantifiable. For example, a one-inch-per hour rate of rainfall in a convective cell implies conversion of about 17,600 W/m^2 of the latent energy of water vapor into motion and work against the surrounding atmosphere in the updraft. A 1 km^2 cell would imply a power level of nearly 18 GW.
I appreciate your replies in support of the implications of the direct observations.
The canonical example for “natural variability” in the Earth’s climate system is the ENSO/SOI cycle.
I’m lazy, and use the smaller (monthly) time-series datasets for UAH, ONI (as a proxy for ENSO) and the Mauna Loa CO2 data.
The “dominant” role of anthropogenic CO2 emissions, compared to any purported “natural variability” influences or correlations, can clearly be seen in the attached graph.
[ Now, where’s that “add sarcasm / irony / cynicism HTML tags” button disappeared to again … ]
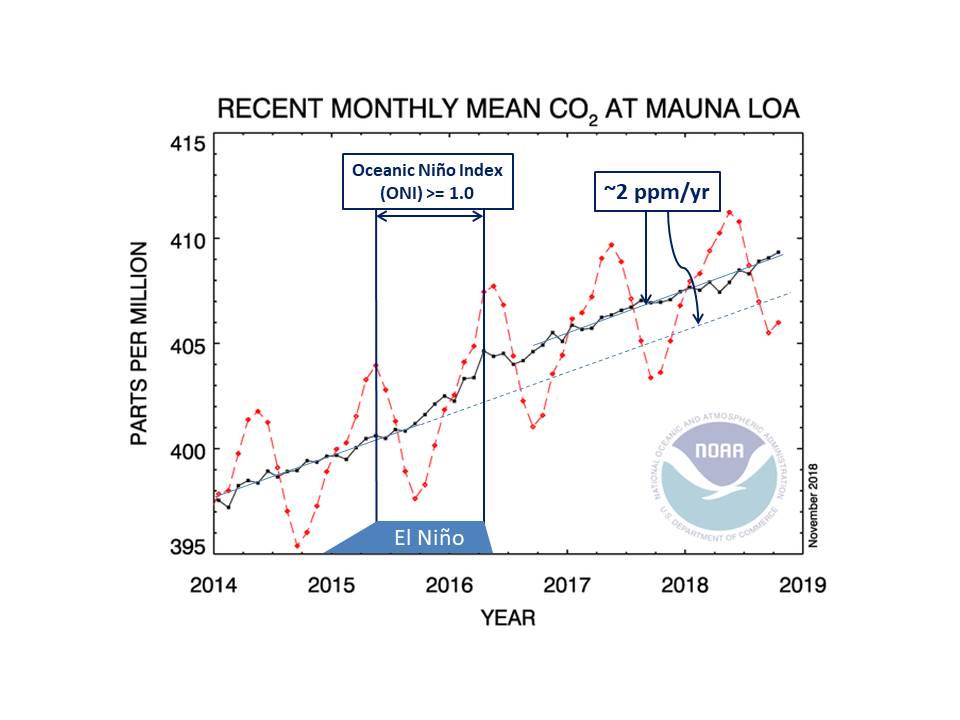
Nice graphical comparison. Yes, the relationship is remarkable, with a 4 month delay between ONI ‘seeing’ the sea surface temperature responding to ENSO and UAH seeing the consequential effect in the lower troposphere. One other graph you should look at if you haven’t as yet: plot atmospheric CO2 as the annual rate of change rather than absolute concentration. This is because ENSO is the primary (natural) driver of both atmospheric temperatures AND changes in atmospheric CO2 growth rate (other than major volcanic eruptions).
My first graph was initially done mainly to highlight how similar the overall shape / pattern of UAH is against an ENSO proxy, hence the vertical separation of the main curves.
Doing a simple 12-month “annual change” of CO2, rather than “the annual rate of change”, and plotting overlapping curves to highlight time shifts gave me the graph attached below.
Comments
1) I would personally qualify this graph as “a bit crowded / busy” … but all of the data on it can reasonably be labelled as “relevant” …
2) My “12-month CO2 deltas” are effectively given by the equation :
“Delta[X] = MLO[X] – MLO[X – 12 months]”
It could be argued that a “more accurate / better” method of calculating the “annual rates of change” would be to try and approximate the “slope / gradient” at the midpoint of each (12-month) interval instead.
This would change the spreadsheet equation to :
“Delta[X] = MLO[X + 6 months] – MLO[X – 6 months]”
This would shift the orange line in the graph 0.5 units to the left …
3) The last two actual “major volcanic eruption cooling dips”, El Chichon in 1982 and Pinatubo in 1991, occurred just before two theoretical “large El Nino warming spikes”.
This will complicate any “cause and effect” analyses.
Thank you for the response and comments.
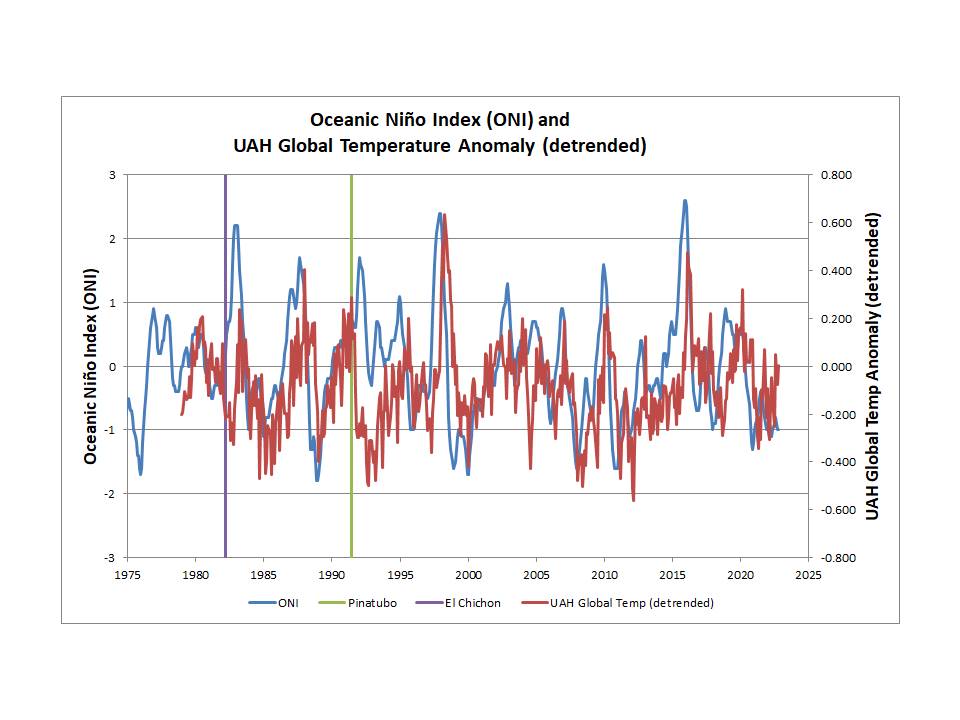
Comment 1
I agree that your graph is too busy; I would recommend limiting the CO2 growth rate plot to a comparison with ONI in one plot and with UAH in a separate plot. In the latter case, the lower CO2 growth rate associated with Pinatubo coincides with the lower temperatures seen in the UAH data.
Comment 2
I agree that I should have avoided saying “annual rate of change”. Sorry. My following sentence hopefully expressed it better where I referred to it as “changes in atmospheric CO2 growth rate”. The point is that the rate of growth varies as a consequence of the more significant ENSO events (and also Pinatubo). One particularly interesting point is the way the rate of growth changes, at least for the two most recent super El Niño events. Here is the effect of the 2015-2016 El Niño on atmospheric CO2 growth rate:
And here is the 1997-1998 El Niño:
https://www.woodfortrees.org/plot/esrl-co2/from:1995/to:2001
We have to be a bit careful with adjacent La Niña events (with lower than average growth rates) but this is not really a problem with 2015-2016 example. In both cases, however, the data show that there is a clear increase in rate of growth coinciding with El Niño (with a delay of a few months based on ONI), the initial change in rate is rather sudden, and then is more or less constant for the duration of the event. In the case of the 2015-2016 event, the rate of growth essentially doubled as a result of the El Niño from 2 ppm/yr to 4 ppm/yr, leading to an ENSO-driven increase in atmospheric content of approximately 2 ppm.
Comment 3
Except for the over-riding influence of Pinatubo, the ENSO process leads to local (SST) temperature changes as reflected by ONI which, subsequently, lead to global lower tropospheric temperature changes (UAH). Pinatubo certainly provides a “complication”, which requires an explanation. I am not convinced by the argument that increased photosynthesis resulting from diffuse sunlight is responsible for the lower CO2 growth rate. El Chichón is perhaps less of an issue as there is still a temperature peak in UAH some 4 months after the ONI peak:
” The New Pause Lengthens by Two Months To 8 Years 11 Months ”
Emergency!
The climate system is ill, it is not warming!
Unprecedent, catastrophic!
Someone must do something to heal it so that it starts heating again!
It’s only a pause if you assume the temperature will increase. It may well do so, but it should only be called a pause in retrospect.
“NOAA thinks there is a 62% chance of an el Niño developing. If it does develop, it will probably bring the latest Pause to an end.”
Why would that happen if there hasn’t been any warming for the last 9 years? The non-cherry picked pause coincidentally starts just before a very large El Niño. A similar or smaller El Niño should have no significant effect on the flat trend.
Personally, I doubt the “pause” will end any time soon, unless there is a really major El Niño.
For example if you just cut and paste temperatures from May 2015 onto the current temperatures, that is assuming next year will see an equivalent temperature to 2016, then by the end of 2024 the pause will have extended back to 2013.
If using the 3 digit file you can see that the pause is technically 106 months. And remember you have to download the whole dataset each month because the values in the past change on each update.
Clyde asked me to provide an update on my mid-April prediction. It was 0.08 ± 0.24 C. The 2023/04 value was reported as 0.18 C which is a difference of 0.10 C. That is a z-score of 0.8. Last month around mid-March I predicted 0.24 ± 0.24 C. The reported value was 0.20 C. That is a z-score of -0.3.
Thank you.
Typically, when one provides an uncertainty estimate, it is for purposes of constraining the precision of the measurement, and is usually a deviation in the next significant figure of the nominal value. It is assumed that the nominal value is otherwise accurate.
When the uncertainty is 3X the nominal value, it appears that the accuracy is low. A range of -0.16 to +0.32 (1 or 2 sigma?) when the typical anomaly range is +/-0.7 is not a particularly useful prediction, especially when what is of most interest is whether the anomaly will be positive or negative. It implies that a warming is twice as likely as a cooling. The Empirical Rule in statistics suggests that the two sigma standard deviation for recent anomalies should be about 1.4/4, or 0.35. That is, there is about a 98% probability that any future anomaly will be about 0.0 +/-0.4 deg C. However you managed to lower that to 0.24 (0.2), it is still not a useful prediction.
The uncertainty here expresses the range of possible values UAH will report.
Statements like “3X the nominal value” have little if any useful meaning. The reason is because these are anomalies. 0.08 ± 0.24 C is for the 1991-2020 baseline. On the 1981-2010 baseline it would be 0.20 ± 0.24 C making the uncertainty only 1.2X the value. Or if expressed in absolute terms it would 263.92 ± 0.24 K making the uncertainty only 0.0009X the value. All 3 values are expressions of the same thing just on different scales. Similarly, whether the anomaly is positive or negative has little if any useful meaning since it’s signness is dependent on the baseline.
No. I have not been able to lower the uncertainty. The problem is that the UAH measurements have a large random effect. That presents an insurmountable barrier to predicting what they are going to report.
Since December 2010, a period of 12 years and 5 months, the rate of warming has been over 0.28°C / decade.
The start and end dates of this period of accelerated warming are not cherry-picked. The end date is the most recent month for which data are available; the start date is the farthest back one can reach and still find a trend of more than 0.28°C / decade. It is what it is.
You’re getting into the spirit of it 🙂
Move it along, you rest of world people!
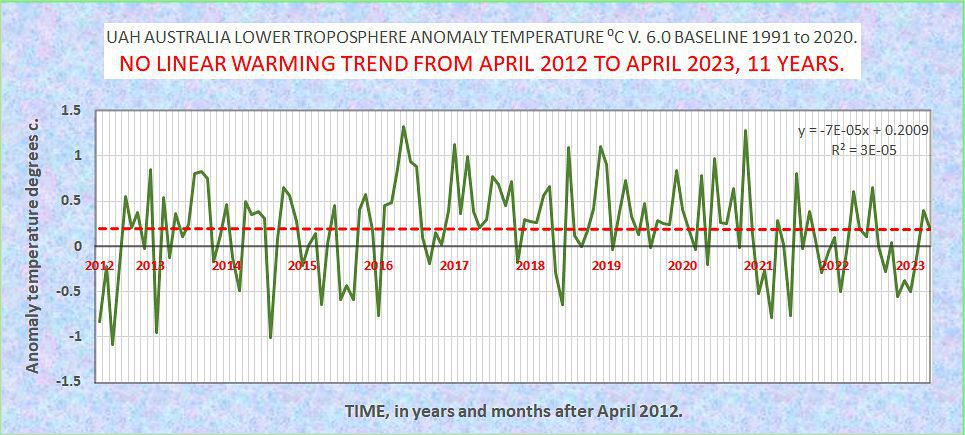
Australia’s lower trop UAH pause reached 12 years flat after April just ended.
Still looking for an explanation why global, all-pervasive CO2 is failing to heat my part of the world ever after I turned 70. Geoff S
CO2 is not the only thing modulating the temperature globally nevermind a domain that is only 1.5% of the whole spatially extends only 11 years.
Then why are we not “fighting climate change” by including those other things?
Postal rates correlate with the global average temperature. As they go up so does the GAT. Why aren’t we fighting to bring down postal rates?
‘…never mind a domain that is only 1.5% of the whole spatially…’
Seems reasonable then that they should cut back a smidge on the alarmism and see if maybe China’s shows any signs of cutting back on their emissions, no?
bdgwx,
Wrong. While Australia’s land might be 1.5% of total gloal area, we are measuring these UAH temperatures in the atmosphere, in which there are constanly moving winds.
The Australian land surface is not setting the whole of the UAH temperatures above us.The source of measured variations is much larger in area. Geoff S
You think my statement about CO2 not being the only thing that modulates temperature is wrong?
bdgwx,
No, it is not proven wrong, but it is mere common speculation.
It is more worthy to list the other influences with an estimate of the importance and magnitude of each over time.
Geoff S
It is not mere common speculation that CO2 is not the only thing that modulates the temperature. It is an indisputable fact.
You have hit on something I have been thinking. There are too many locations starting to show NO warming when examining local/regional temps for it to be a considered a fluke. I was reminded of statistical problems with spurious outcomes and the possibility of Simpson’s Paradox.
Both can occur with stratification differences in the data. Small subgroups can have one direction of a trend but when combined you get an opposite effect. It is one reason that climate science is desperate to maintain LONG records even if data torture is required. Yet it simply covers up lots of problems.
This is one reason I have been adamant about closing records and starting new ones when changes are made. I know this creates a lot of short records but it also eliminates some.
Long records can have lots of stratification issues that are not being addressed. Device drift, changes due to calibrations, device replacement, shelter changes, device moves, microclimate changes, etc.
Another large one is the direction of deltas of temperature changes due to seasons. Fall into winter temps decrease and spring into summer temps increase. These can result in spurious results and a Simpson’s Paradox outcome. Especially when the temp changes are not equal. Another is using calendar years instead of seasonal years.
I have never seen any of this addressed by any of the denizens here or in scientific papers. It is like all climate science is based on high school statistics at best.
Since the variances of temperature increases as it gets colder and decrease as they get warmer this can also lead to spurious results that can’t be recognized if you don’t propagate the variances correctly all the way through all the averaging that is done.
I don’t think there’s anything novel about the geographic variation of temperature change. That’s why ‘homogenization’ is such a crock. If one wants to know if location ‘x’ is warming or cooling, just look at the data for location ‘x’.
I think that an intellectually honest researcher would deal with this by expanding the uncertainty envelope/
This is more than just uncertainty. Simpsons Paradox can give totally incorrect answers. The only real way to test for it is to dig deep into the data to see what is occurring. It is entirely possible that local/regional temps could be showing no change while the multiple averages could be generating spurious trends that are not valid.
Jim,
Thank you for your comment.
I am meeting quite a similar situation with another project with land temperatrures in Australia. I have selected 50 weather stations that are as close as practical to “pristine” re the influence of the hand of man. Looking for a baseline picture of T without UHI. Quite hard, because even with UHI we have metrication, change of sensors, change of screens, etc. When I try to strip these out, I get 50 (noisy) stations that are consistent with zero T change over the last 100 years.
Simpson’s Paradox again?
Geoff S
I am no statistics expert. However I do understand that Simpson’s Paradox can occur when combining data streams.
I see an area of concern when combining seasons. I think bridge months could bias things in the wrong way. In the NH, February/March have temps increasing. October/November have decreasing temps. The attempt to average them together could show an increase where there is none.
It is one reason I am not going to concentrate on annual averages to begin with, along with only looking at Tmax and Tmin separately.
Geoff … Australian UAH anomalies have actually cooled 0.003C since March 2012.
Mar 2012 – Sep 2017 anomaly average = 0.189C
Oct 2017 – Apr 2023 anomaly average = 0.186C
ACORN 2.3 surface anomalies have cooled 0.012C since March 2012.
Mar 2012 – Sep 2017 anomaly average = 0.948C
Oct 2017 – Apr 2023 anomaly average = 0.936C
http://www.waclimate.net/australia-cooling.html
I agree that with cooling for 11 years and two months in Australia, it’s time the rest of the world caught up.
It remains curious that the BoM continues to claim that “Australia’s climate has warmed by around 1.47C over the period 1910-2021”. (http://www.bom.gov.au/climate/enso/ published a few weeks ago)
ACORN 2.3 annual mean temperature anomalies show 1910 at -0.49C and 2021 at 0.56C, which is 1.05C warming.
They at least had an homogenised mean temperature argument in 2016 (0.98C = 1.47C warming), 2017 (1.04C = 1.53C warming), 2018 (1.11C = 1.60C warming), 2019 (1.50C = 1.99C warming) and 2020 (1.13C = 1.62C warming).
The 2022 annual anomaly was 0.50C. So on an annual basis with the most recent rather than outdated anomalies, and with an anomaly baseline of 1961-90, Australia has warmed 0.99C since 1910.
I suppose from a rapidly warming crisis point of view it’s better to make dated and questionable claims about 1.47C than to tell Australians that their climate has been cooling for more than 11 years.
Here’s the pause in context.
And here’s all the pauses. The first two are my speculation on what Monckton could have said last century. The third and forth are Monckton’s stated periods.
The Pauses are:
December 1978 – November 1987 (9 Years)
November 1986 – November 1997 (11 Years 1 Month)
January 1997 – August 2015 (18 Years 8 Months)
June 2014 – April 2023 (8 years 11 Months)
(That’s based on data to date. The current pause will grow longer, and it’s quite likely the next pause has already begun.)
That’s a total of 47 years and 8 months of no warming, covering the entire 44 years and 5 months of the satellite era.
And what percent of the months are included at least somewhere in one of those pauses? It looks like 100% just eyeballing the graph.
All of them. I think 27 are included two simultaneous pauses.
Not all the pauses overlap by at least a year.
Wow, thats almost 48 years when the rising CO2 temperature control knob failed to do any work. Thanks for pointing that out.
And yet it moves.
And yet, it also stops moving.
Which is what you expect with natural variability superimposed on a log2(CO2) trend.
“bdgwx” has a comment saying : “If using the 3 digit file you can see that the pause is technically 106 months.”
Using the 3dp file to March 2023 and adding “April 2023 anomaly = +0.18°C” I get (just) positive trends for the periods “January 1997 to August 2015″ and “June 2014 to April 2023″.
For me the Feb-June 1997 to Aug-Dec 2015 “pauses” are all 18 years and seven months long, while the latest one is “only” 8 years and ten months long.
Attached is what another poster might call a “join the dots” alternative to your graphic.
Note to self : The colour scheme might need a bit more “adjusting” …
It looks better when enlarged, but the green and yellow hues definitely have lower contrast on my monitor.
The question is: Where is the expected acceleration in warming? This was a huge point in the First Assessment Report. Warming was going to accelerate if our emissions continued accelerating.
Between 1979 and now the rate of increase in atmospheric CO2 has gone from 1 ppm/year to 2.5 ppm/year. That is 2.5 times!!!!!
Where is the corresponding warming acceleration that is due to me for my contribution to that? I am being ripped.
“Between 1979 and now the rate of increase in atmospheric CO2 has gone from 1 ppm/year to 2.5 ppm/year. That is 2.5 times!!!!!“
Here’s the annual Atmospheric CO2 levels since 1979. It’s accelerating, but not that noticeably.
The rate of increase has not changed by a factor of 2.5. It goes from around 2.3 ppm/year, to 3.5 ppm/year. About a 50% increase.
Here’s the graph
And here’s the graph of annual UAH anomalies, with the CO2 levels overlaid in red.
Why does it fit so well when it is generally accepted that the temperature increase follows the logarithm of the CO2, not the measured CO2 concentration?
Over this range it makes very little difference if you use a linear scale or a logarithmic. In either case the rise is close to a straight line.
A classic case of Simpsons Paradox where subgroups differ remarkably from the overall trend.
What subgroups have you identified? What confounding factor changed in the UAH data in each of those arbitrary lines?
By the same logic you can just as easily claim Simposn’s so-called Paradox causes an underestimate in the rate of warming.
Can you not see the green lines? Those are subgroups. Your interpretation has other subgroupings. Those are initial indicators of a possible problem.
BTW, here is what I said earlier:
“””””Simpsons Paradox can give totally incorrect answers.”””””
I’m not going to educate you here on this problem. If you think it isn’t a problem, that’s your choice. Just recognize that as station after station shows no warming, maybe something is amiss.
Read this for more info.
https://statisticsbyjim.com/basics/simpsons-paradox/
Yes, I can see the green lines. I was describing them when I said “arbitrary lines”. What I’m asking for is any evidence that this has anything to do with Simpson’s Paradox.
You can draw similar lines on any similar time series, with spikes and troughs. All it shows is that cherry-picking start and end dates can give you a misleading sense of the actual trend.
Simpson’s paradox would mean that each line represented an actual subgroup of the data, something where the temperature varies due to some confounding factor.
If for instance you could show that each of your groups correspond to different satellites, and explain why each successive satellite was bound to show a much larger anomaly throughout it’s run, and explain why Dr Spencer completely failed to take that difference into account, then you might just be on to something. Until then I’ll assume it’s far more likely that global temperatures tend to cool after each spike.
They don’t have to have a confounding variable other than time! Look up the famous baseball example about batting averages.
As I said, if you want to disprove it as a problem, feel free. You appear not to have read my post mentioning seasonal differences and their varying signs. To say nothing about mixing northern and southern hemispheres with opposite seasons.
Remember, so called small, small anomalies are teased out of temperatures recorded with much less resolution than the anomalies. It wouldn’t take much to overstate both values and signs.
“They don’t have to have a confounding variable other than time!”
Do you ever read your own sources?
…
I’d say in the case of batting averages it’s more down to chance, and cherry picking specific examples where the samples are of different sizes. But in the case of a trend over equal lengths of data it’s difficult to see how that could happen.
“As I said, if you want to disprove it as a problem, feel free.”
It’s your claim. It’s yours to prove.
“You appear not to have read my post mentioning seasonal differences and their varying signs”
what have seasonal differences got to do with your claim. Your trends are using all the monthly data, no grouping by seasons. And it’s difficult to imagine seasonal effects having a big impact when we are dealing with anomalies.
“To say nothing about mixing northern and southern hemispheres with opposite seasons.”
All the data’s available. If you think all seasons or hemispheres are cooling whilst global annual anomalies are warming, why not show it?
Nope, not mine to disprove. Just like you wanting people to disprove CO2 and CAGW, it’s up to you to disprove my assertions.
I already made my assertions that more and more no temp growth stations are showing up. How does that happen? It can easily be something in the anomaly analysis like the Simpsons Paradox.
It up to you to prove otherwise. Maybe finding some stations with 3+ degrees of warming would help!
“Nope, not mine to disprove.”
Then I’ll give your assertions the respect they deserve.
“I already made my assertions that more and more no temp growth stations are showing up. How does that happen?”
Maybe if you provided some analysis rather than just making assertions it would be possible to answer. How many zero trends have you found? Are they all over the same period, or are you just cherry-picking the start dates? Are you checking for possible systematic bias?
“It can easily be something in the anomaly analysis like the Simpsons Paradox.”
Something you are are unwilling to prove, or offer any evidence. So far you have claimed the Simpson Paradox, might have caused a warming trend both in surface and satellite data. That’s a pretty big coincidence. Yet your only evidence is that “Can you prove that it didn’t happen?”.
“Maybe finding some stations with 3+ degrees of warming would help!”
What has this got to do with UAH data or Simpson’s Paradox?
For this 3+ nonsense, what exactly do you want, and what do you think it will prove? Are you talking about total warming, over any given period, or a specific warming rate?
For this 3+ challenge, would you prefer adjusted or unadjusted data.
Looking through he unadjusted GHCN data I can find lots of data that shows spuriously large amounts of data, >30°C, but generally that’s data that’s in obvious need of adjusting.
One reasonable candidate for what you are asking is Tokyo, with a rise of 3.3° since 1876. (But you’ll just say it’s entirely due to UHI).
Alexandrov Gaysky in Russia. 3.3°C warming since 1929
How about this article from WUWT?
https://wattsupwiththat.com/2022/11/07/tokyo-mean-october-mean-temperature-has-been-falling-for-decades/
Here are some graphs for you. They kind of illustrate why your trend is so severe.
And more shifting of the goal posts. You asked for examples of stations with more than 3°C of warming. I gave you a couple, but now you think that cherry picking a specific month and starting point means there was no warming.
Here’s the graph of just October, using the raw JMA data.
Since 1876 the rate of warming for October has been 0.25°C / decade. For a total of 3.6°C warming. Note that after 2014 the station was moved to a cooler area.
And here’s the annual average temperature using JMA data rather than the GHCN data. It actually increases the warming rate slightly to 0.24°C, for a total of 3.5°C warming.
Funny you got this, yet the article I posted shows this:
“””””Tokyo’s rural island of Hachijojima is located some 287 km out in the Pacific, thus making it rather free of massive urban heat island effects. The island saw an October, 2022, mean temperature of 20.9°C:”””””
“””There was no warming, until that is NASA tampered with the data to produce a “warming” trend. NASA’s trend starts to look like forgery and fakery.”
“””””Yet, when you compare Hachijojima JMA annual temperature data to that from NASA unadjusted and then its homogenized data going all the way back to 1950, readers can get a good idea where all the “warming” is really coming from:”””””
See the image.
Maybe you should write an article debunking the author and the results he obtained.
How much further do you want to drag these goal posts? Your supposed to be explaining why you think Simpson’s Paradox is responsible for the warming seen in the satellite data. But for some reason would sooner talk about stations with over 3°C warming, and then want to ignore the stations that do show that much warming and talk about whether you believe the data you are using to claim that some stations are showing no warming.
If you just looked at the data I think there’s a good reason to be suspicious of the raw Hachijojima data, just as there is for the Tokyo data.
https://www.data.jma.go.jp/obd/stats/etrn/view/monthly_s3_en.php?block_no=47678&view=1
See that red line around 2003?
Here’s the graph of the JMA annual data. There’s quite a sharp drop after the change.
The overall trend is 0.044°C / decade.
Up to 2003 the trend is 0.069°C / decade.
After 2003 the trend is 0.37°C / decade.
Incidentally, if you use the adjusted data for Tokyo, the warming drops from 3.6°C to 2.0°C. So as I said, you really need to say if you want the data adjusted or not.
“If you think all seasons or hemispheres are cooling whilst global annual anomalies are warming, why not show it?”
If it’s any help, here are tthe trends broken down by month.
And here’s the trends for Northern and Southern Hemispheres.
Argh. I made a stupid mistake in the above graph, that resulted in adding 1ppm to each year’s gain.
The corrected values are as Javier Vinós said, from about 1.3 to 2.5 ppm.
The corrected graph is.
You’ve got to be kidding, right?
NOAA has been giving the CO2 rate of growth for a very long time. It has gone from +1 ppm/year to +2.5 ppm/year.
Why is warming not accelerating?
Not kidding, but I was using a different method than NOAA. I was comparing the average CO2 levels over the year with the previous year’s average. NOAA are comparing the End of December with the start of January for each year.
Regardless, it makes no difference to the actual slope. CO” levels are a gentle curve, not a massive acceleration. And I wouldn’t expect to see a significant acceleration in temperatures on the basis of the acceleration in CO2, especially when you consider all the confounding factors such as ENSO.
My best estimate is that UAH is showing some signs of acceleration, but it’s far too early to suggest this is any more meaningful than the claimed multiple pauses.
Keep in mind that CO2 is not the only factor that modulates the planetary imbalance and ultimately the global temperature in the troposphere. Aerosols both anthropogenic and natural are offsetting forcing agents. CFC reduction is also an offsetting forcing agent.
Sorry, you are correct. I had a typo in my calculations for the annual change that added 1ppm to each value.
Doesn’t affect the main point though. The acceleration has so far only a minimal effect on the rise of atmospheric CO2 and I wouldn’t expect it to cause a significant change in the rate of warming at this stage.
And here’s Monckton’s “7 years’ Global Cooling“, he was talking about in 2009.
[he used an average of 4 data sets, and said the cooling was equivalent to 2°C / century. Using just UAH version 6, it’s equivalent to 3.4°C / century.]
You really are getting into the spirit of it now.
Maybe for CMoB’s next article he can join the dots to show a bunny rabbit.
Oh, bugger. I can see one leaping on the right side of the picture now.
It’s being chased down by a leopard.
That’s one context. Here’s a better one.
https://woodfortrees.org/graph/uah6/from:1997/to/plot/uah6/from:1997/to:2014.5/trend/plot/uah6/from:2016.08/to/trend/plot/uah6/from:2014.5/to:2016.08/trend
What is shows is there’s only been actual warming for about 1.5 years in the last 26 years which also just happens to coincide with a change in the PDO from cold to warm.
“NOAA thinks there is a 62% chance of an el Niño developing. If it does develop, it will probably bring the latest Pause to an end”.
No doubt Monckton’s assistant has warned him that the ‘pause’ is about to end shortly.
That’s okay. Monckton can just start a new one at a higher level and keep the posts coming.