By Christopher Monckton of Brenchley
The new Pause has lengthened by another month. On the UAH satellite monthly global mean lower-troposphere temperature dataset, seven and a half years have passed since there was any trend in global warming at all. As always, if anyone has seen this surely not uninteresting fact mentioned in the Marxstream news media, let us know in comments. One of the best-kept secrets in what passes for “journalism” these days is that global temperature has not been rising steadily (or, since October 2014, at all). It has been rising in occasional spurts in response to natural events such as the great Pacific shift of 1976 and the subsequent strong el Niño events, rather than at the somewhat steadier rate that one might expect if our continuing – and continuous – sins of emission were the primary culprit.

To forestall the usual whingeing about “cherry-picking” from the climate-fanatical trolls, here is the entire HadCRUT4 record of monthly global mean surface temperature anomalies for the 172 years 1850-2021. The trend is a not particularly catastrophic half a degree per century equivalent. Oo-er! Stap me vitals!

The HadCRUT4 dataset, now at last updated to the end of 2021, shows no global warming for almost eight years:

The significance of these long Pauses should not be underestimated. IPCC (1990, p. xxiv) confidently predicted 1.8 K global mean anthropogenic warming from 1850-2030. Of this, 0.5 K (HadCRUT5: Morice et al. 2021) had occurred by 1990, so that the projection was equivalent to 1.3 K over the four decades 1991-2030, or 0.34 K decade–1. However, observed warming from January 1991 to December 2021 as the mean of the monthly UAH lower-troposphere and HadCRUT4 surface monthly global mean surface temperature anomalies, was 0.5 K, or 0.18 K decade–1. Even if all warming since 1990 was anthropogenic (which it was not), IPCC’s finger-in-the-air prediction has proven to be almost twice outturn.
Meanwhile, soi-disant “leaders” on both sides of the Atlantic, having half-wittedly committed themselves to the Party Line on climate so sedulously peddled for so long by the Desinformatsiya directorate of the KGB (now FSB) and by the many Chinese agents of influence (such as the “Confucius Institutes” at many Western universities), dare not lose face. They cannot bring themselves to admit that they have been wrong, that they have been fooled, and that they have needlessly and expensively ended the free market in energy supply. They cannot brin themselves to change their catastrophic and unaffordable energy policies, even in the face of the fact that it was their eagerness to suppress competition from coal-fired power-stations in the name of Saving The Planet that was the chief source of funding for Vlad the Invader’s special military massacre in Ukraine.
On this side of the pond, Boris Johnson – than whom no previous prime minister has ever known less about science and mathematics – is about to publish an “energy strategy” that is widely expected to remove the now-formidable zoning constraints that have, for a few blissful years, prevented the installation of almost all new onshore unreliables.
I am now in Scotland on a walking holiday, but it is a lot less of a holiday than once it was. For every hillside is infested with whomping windmills – 14th-century technology to address a 21st-century non-problem. Birds, bees and bats by the billion are being blended or batted out of the sky. Yet few politicians dare to challenge the climate-Communist Party Line for fear of being unpersoned by savage, organized and persistent reputational assaults.
For instance, in a further attempt to damage my own reputation (for our research is more than somewhat challenging to the Party Line, and there are increasing signs of panic in the ranks of the ungodly), some wretched climate fanatic has asked the overpaid, under-responsible numbskulls at the office of the Clerk of the Parliaments, the senior bureaucrat at the House of Lords, to order me to stop using my well-kent logo, the portcullis (a generic heraldic charge) surmounted by the coronet vicecomital, a hat to which I and just 28 other Viscounts are entitled. I ran up this design on my architectural drawing program, I have been using it for well over a decade, and I shall continue to use it:

The House of Lords uses a badly-drawn, puke-red, 2-dimensional representation of the portcullis, with chains droopily pendent rather than triumphantly volant, and surmounted not by my coronet vicecomital, distinguished by the nine visible pearls, but by the Crown Royal. As the cuisses-de-cuir will discover to their dismay when they consult Garter King of Arms before shooting their mouths off again in their eagerness to advance climate Communism, a coronet vicecomital and a Crown Royal are clean different things. I have never used the latter, for I am not really royal. I am merely the Queen’s seventh cousin twice removed (“Kindly remove him a third time”).
The dusty dolts will also discover from Garter (who will, no doubt, much enjoy this nonsense, just as I do) that no one else has registered my device and that, therefore, I am fully entitled to use it. How lucky you are, across the pond, that your wise Constitution altogether prohibits titles of nobility. That is one more thing the bureaucrats in your country can’t try to mess up and use against us as they try to do here.
The gnomes of Westminster are also proposing to consult the Lord Chamberpot, whose original job, before Thos. Crapper Esq. came along, was to empty the night soil from the Royal porcelain each morning. For they do not like me to call myself a member of the House of Lords (which I am, for the letters patent granted by Her Majesty to my late beloved grandfather have not been withdrawn or repealed by the special Act of Parliament that would be necessary). Indeed, I was in the House only the other day, giving a briefing to a group of my peers, one of whom even voted for me in a by-election for a vacant hereditary seat.
By vice of the House of Lords Act 1999, passed by a Communist administration, nearly all hereditary peers have no seat or vote. But we remain members of the House until hundreds of individual special Acts are passed, to annul our letters patent. And that won’t happen anytime soon.
It is time to start building coal-fired power stations again. That would cut electricity bills by five-sixths. It is also time to reject electric buggies. Otherwise we shall make exactly the same mistake we made in shutting down the coal-fired power stations that generated electricity at less than half the unit cost of Siberian gas. As things now stand, we shall ban production of all internal-combustion engines and replace them with electric buggies very nearly all of which, throughout the world, will utterly depend upon lithium carbonate whose production is owned or controlled by Communist China. Enjoy your personal transport while it lasts. Even if you can afford to run the present one, you won’t be able to afford a new one.
This strategic double-whammy – replacing our own coal with Kremlin gas and our own petroleum with Peking lithium carbonate – is a self-inflicted and, if not reversed, potentially fatal wound to the economies as well as to the freedoms of the West.
It will make no difference to global temperature. Even if all the nations bound by the Paris discords actually achieved net-zero emissions by 2050, as Mr Johnson fatuously proposes, the global warming abated would be little more than a twentieth of a degree, for most countries are not bound by it. The cost to the free world – and the profit to Communism – would be in the quadrillions. Is that really what we want to achieve?
Well, no, we don’t. The global warming scam was based on an elementary mistake. Consider the position in 1850. Climatologists forgot the Sun was shining. They took the whole 24 K feedback response up to that year and attributed all of it to the 8 K direct warming by preindustrial noncondensing greenhouse gases. Therefore, they imagined that because the 32 K sum of these two values was four times the 8 K reference sensitivity to the preindustrial gases the 1 K direct warming by doubled CO2 today would become, at midrange, about 4 K (CMIP6: Zelinka et al. 2020).
They had forgotten the feedback response to the 255 K emission temperature that would obtain at the surface if, at the outset, there were no greenhouse gases in the air at all. They had misallocated it to, and miscounted it as part of, the actually tiny feedback response to the 8 K direct warming by the preindustrial noncondensing greenhouse gases. At any given moment – such as 1850 – any feedback processes then subsisting must perforce respond equally to each degree of the entire (255 + 8) K reference temperature and hence proportionately to each component therein.
For 1850, the system-gain factor, by which one multiplies a direct warming (or reference sensitivity) to allow for feedback response and derive final warming (or equilibrium sensitivity) is not, as Hansen (1984), Schlesinger (1988) or Lacis (2010, 2013) absurdly imagined, 32 / 8 = 4. Instead, it is (255 + 32) / (255 + 8) < 1.1. Their error is as elementary as that.
The feedback-loop schematic below represents not only a linear feedback system (such as climatology imagines the climate to be, for CMIP6 models’ midrange prediction implies a midrange system-gain factor today identical to, or even somewhat less than, that of 1850). It also serves to represent a potentially non-linear system at a particular moment of interest, here 1850. Note that the simplified feedback formulism shown in the diagram gives outputs identical to the more complex formulism in the textbooks, if based on identical inputs. But the simpler formulism is a lot easier to understand than the original formulism developed by Black (1934) and codified by Bode (1945).

The 255 K emission temperature erroneously neglected by climatology in its derivation of feedback response and hence of equilibrium doubled-CO2 sensitivity (ECS) is shown in gold. Dark blue values are common to the erroneous and corrected methods. Erroneous values consequent upon forgetting that the Sun is shining and thus neglecting the feedback response to the 255 K emission temperature are italicized in red. Corrected values, in green, are below the italicized erroneous values.
Since reference doubled-CO2 sensitivity (RCS) is about 1 K, ECS is approximately equal to the system-gain factor. For 1850 – and for today, if, as is very likely, climatology is at least right in taking the system-gain factor as invariant in the industrial era – the 4 K predicted midrange ECS in the CMIP6 models is about 4 times the corrected 1.1 K ECS.
If the system-gain factor were to be just 1% greater today than it was in 1850, then ECS would exceed the value implicit in the data for the climate in 1850 by 250%, because that 1% change must be applied not only to reference sensitivities but also to emission temperature itself. Yet global warming is not even occurring at the rate originally predicted on the basis of climatology’s error. It is occurring at little more than half that rate – and that is before making any allowance for the fact that not all warming in recent decades was anthropogenic.
Accordingly, the absurdly elevated feedback fractions imagined by climatology based on diagnoses from the outputs of the wretched climate models cannot possibly be correct. Which means, in turn, that the climate models themselves cannot possibly be correct. For if the feedbacks diagnosed from their crazy outputs were correct then ECS would be somewhere between 450 and 600 K, and it just isn’t.
Our paper explaining these inconvenient truths has been languishing at a leading journal, marked on its author tracking system as “With Editor”, for well over a year. While I am in Scotland, I am hoping to consult a very senior police contact about the numerous fraudulent aspects of the climate scam in general, and about the misconduct of the journals in particular.
If a journal says it will usually give a response within x days but no response is forthcoming even after 5x days, and if that journal says it brings the latest science to its readers and generally represents itself as publishing properly-peer-reviewed science, and if its editor is sitting on our paper because he cannot refute its argument but is not willing to publish it because he has previously gone on record as saying that we skeptics have no credible arguments against the Party Line, then that is fraud by false representation. We have had enough of it. For it is – as the late Nils-Axel Mörner used to say, the largest fraud in human history.
The tens of thousands of gallant Ukrainians slaughtered by the brutal advance of clapped-out Communism would perhaps still be alive today if we had been able to prevent the climate fraud that has, in no small measure, paid for Vlad’s reconstruction and expansion of his armed forces. For that reason, I suspect we may well now get a fair hearing from the police and, in due course, from the intelligence services of the West.
For our own nations’ protection, as well as for that of the myriad past, present and potential future victims of Russian and Chinese Communism, the most murderous form of government the world has known, we can no longer tolerate this nonsense from which the Marxists so mightily profiteer. Our politicians are too thick and too frit to stop it, but the police, the intelligence services and eventually the courts can – and will.
Send in the clowns, they’re needed PDQ.
Don’t worry. They’re here.
“Don’t worry. They’re here…”
“Our mission is simple: shut down any climate debate, present pal-reviewed voodoo science and explain the techniques of slagging opponents off”
https://skepticalscience.com/
Indeed they are.
It’s definitely a Pavlovian response – the bell rings and up he pops!
Dripping saliva, ears perked and all.
I often read posts at WATTS to enhance my vocabulary. “Slagging”, in Britain not a good description of treatment of women, but less offensive is the “ing” part is added. I used to think the French-Canadian drillers were the best at swearing, then I met an OZZIE and changed my mind. Now I’m thing the Brits are in the competition. By the way, Lord Monckton, good of you to keep the pause going. Thanks.
Yes, you are.
Thank you for affirmatively responding to the roll call.
Making my entrance with my usual flair.
A bad stench is always noticeable.
It’s called lack of self awareness
10 years ago:
“Psst – Bellman, we’re the International Communist Conspiracy, and we’ll handsomely reward you to disrupt all those dangerous Lord Monckton posts.”
“But won’t that take a lot of work, sweating over R, just to produce ugly graphs that disprove all his nonsense.”
“Nah, just paraphrase a couple of Sondheim lyrics. That should do the trick.”
Mr. Bellman: Ridiculous! Everyone knows the International Communist Conspiracy considered Sondheim a Trotskyite! But the part where you agree to half-ass the “R” was believable.
You’re supposed to amuse and not bore us.
https://www.tropicaltidbits.com/analysis/ocean/
“Cooling to come?
Likely but that too is a reason to tax, tax, tax. Pay no attention to the taxman behind the curtain.
This post could, possibly, potentially, might, may, is likely to… cause a meltdown of 6 or 7 on the griff scale. (1 griff = 10 Wadhams)
“seven and a half years have passed since there was any trend in global warming at all. As always, if anyone has seen this surely not uninteresting fact mentioned in the Marxstream news media, let us know in comments.”
Has anyone seen the Easter Bunny?
No one has, yet. The date of his appearance each year is determined by a rather mysterious formula no one can ever remember, called the Computus Eastermius Bunnius equation, involving the sun, moon and stars, near as I can tell. It’s almost as difficult as figuring out what factors are driving the climate.
It could be that he is the idiot for lots of villages and is therefore a very busy man. He also needs time to read The Guardian to keep his ignorance up to date.
Sorry, but this is not the end of winter weather in the US.
The 10-day forecast for Kansas is for the temp to be above freezing. Think we’ve had our Last Spring Frost. Time to start the early veggies – peas, lettuce, radishes, etc.
Yes, under glass.
Yep and as the cold and warm continues to flip flop, it is looking like the conditions are set for the worst tornado season we have seen for sometime.
This season at this time is already above average.
The US has not had a really bad tornado year since 2011.
And so be ready for the climate clowns to come out in force declaring climate change is the cause. Never mind that seven of the last 10 seasons have been below average and never mind that in that time the proportion of “violent” tornadoes (EF-3+) has continued to decline. Weather records and history that has not been tampered with has to be ignored.
Kansas State University show all kinds of veggies suitable for April planting. From beets to collards and peas, from carrots to cauliflower to lettuce and onions. I’ve lost a few plants over the years to cold mornings but far more have survived to give good crops. I’ll stick with KSU, thank you.
Tubers are an exception and always have been.
Looks like a tornado generator weather.
Lord Monckton persists in undercutting his case with the theory that “They forgot the sun was shining.” As I’ve demonstrated, his theory is based on an apples-to-oranges comparison.
He is using your theory.
CO2 is a control knob… 😉
If you were really interested in what my view is, you’d look here
Joe you say:”…fact that the projected carbon-dioxide increase’s temperature effect …”
I read this as you agree that CO2 can and does cause temperature increases of some amount.
No evidence of this.
Hungry for clicks?
How about succinctly making your point. Perhaps maybe that will convince me to click on your substack.
Hey people — pregnant or otherwise — I think that Joe’s link is worth a read. Not all of us, who wear the badge of skeptic proudly, necessarily agree with everyone else. The one thing we seem to share in common is a disagreement with the alarmists.
How many of you who down-voted Joe took the time to read either of his links?
I read it, and I didn’t downvote it.
His May 12, 2021 post is a valid opinion.
It is good Joe, but you didn’t address in particular to the post here which weakens your message a bit.
What, specifically, in his post don’t you think my post answered? How, exactly, do you think he’s proved that “climatology” neglected the sun?
The problem is that what he says about his theory is just word salad; nothing hangs together logically. If you can tell me with rigor why you think he’s proved anything, for example, by saying, “If the system-gain factor were to be just 1% greater today than it was in 1850, then ECS would exceed the value implicit in the data for the climate in 1850 by 250%,” then I’ll explain to you why he hasn’t. It may help you to refer to the discussion accompanying my post’s Fig. 7.
I welcome a clear, well-formed question. But I can’t guess what’s in your mind.
Nice summary of Dr. Steven Koonins recent remarks Joe. Dr. Koonin has been sitting down with various podcasters over the last few months and I’ve listened to each interview that I could find. He’s able to read, understand and distill the technical literature in a way the layman can digest it and in that explanation it’s very clear that politics and not science is the driving force behind “climate”.
Thanks for the kind words, and I agree with you about Dr. Koonin.
Last year former Indiana governor and current Purdue University president Mitch Daniels called Dr. Koonin’s book perhaps the most-important book of the year, and I’m inclined to agree. Although Dr. Koonin has been denied many platforms, I was pleased to see that he made it onto The Joe Rogan Experience.
I find your “demonstration” to be well reasoned. I also follow the gist of Monckton’s argument but I don’t comprehend all of the assumptions and possible errors around these. There is something about the feed-back loop that bothers me in that reality exhibits non-linear and chaotic features very frequently.
I look forward to hearing about the outcome of the review of his paper. What seems to be happening with its review is quite strange, but what isn’t these days?
“Scissor” says there are “possible errors” in our analysis of climatology’s control-theoretic error. What errors?
Mr Born’s obscurantist “demonstration” is entirely irrelevant to our analysis, for it is predicated on the assumption that we take the system-gain factor as constant. However, we assume no such thing. as the head posting makes explicit.
I was referring to measurement errors around assumptions. I wonder specifically what impact these have on the results of your analysis. Perhaps your submitted paper provides an analysis of error that covers this.
I catch the gist of your argument but I’m getting lost is some of the detail. I would say much the same about Mr. Born’s analysis but I found his reasoning to be relatively easier to follow.
I gathered from him that your feedback loop is represented by a linear amplifier. You address this above by saying that the feed-back system also represents a potentially non-linear system at a particular moment of interest and in your reply above re: you do not take the system-gain factor as constant.
This is perhaps the essence of the disagreement between you and him.
I hope that your paper soon sees the light of day.
He contends that he doesn’t require linear proportionality, but his low-ECS conclusion follows from feedback theory only if near linearity is what he assumes. As I showed, a high ECS value perfectly consistent with feedback theory so long as the system isn’t constrained to linearity.
In other words, Lord Monckton has gotten himself (and many of his followers) all mixed up.
Mr Born continues to conduct his analysis without reference to the actual climate. All he is really saying is that the system gain factor need not be constant. If he would only read the head posting, he would see that we do not take the system gain factor as constant. It is, however, necessarily very near to constant. Otherwise, ECS would be hundreds of degrees.
(Corrected your first name) SUNMOD
Here Lord Monckton slips up by departing from his usual gobbledygook and making a clear statement—one that my post’s Figs. 5 and 7 clearly rebut.
Recall that his “system gain factor” is the ratio that the equilibrium temperature bears to what its value would be without feedback. Although the function illustrated in my post’s Figs. 5 and 7 exhibits an ECS of only four degrees rather than “hundreds of degrees,” its “system gain factor” is indeed “very near to constant”: at what Lord Monckton called the “263.5 K total reference temperature in 2020,” that function’s “system gain factor” is (289.0 K ÷ 263.5 K =) 1.097, which is only about 1% greater than its (285.0 K ÷ 262.5 K =) 1.086 “system gain factor” at the 262.5 K pre-industrial “reference” temperature.
So any reader capable of performing arithmetic should be able see that his above-quoted assertion is clearly wrong.
The function of Figs. 5 and 7 also illustrates the innumeracy of his statement above that “If the system-gain factor were to be just 1% greater today than it was in 1850, then ECS would exceed the value implicit in the data for the climate in 1850 by 250%.” Instead, the 2020 ECS value exceeds the 1850 ECS value by less than 2%.
And that’s just one hypothetical function. Suppose that the equilibrium temperatures were 283 K, 287 K, and 291 K for respective “reference” temperatures 262 K, 263 K, and 264 K. Then a 1% increase in “system gain function” would result in no ECS increase whatsoever.
Again, Lord Monckton rarely makes so clear a statement. Usually he dupes his many fanboys by trafficking in ambiguities and obscurities. As I pointed out in another post, though, he similarly slipped up and said something clear in what he called “the end of the global warming scam in a single slide.” That enabled me to show that his theory merely amounts to bad extrapolation.
Mr Born should really get around to reading the head posting. The system-gain factor – the ratio of equilibrium to reference temperatures – is necessarily very, very close to constant because otherwise ECS would be hundreds of degrees. The reason is that any increase in the system-gain factor must act not only on reference sensitivity but also on the far larger emission temperature.
Since the medium-term rate of global warming is half of what was originally predicted and a third of what is currently predicted, we may take climatology’s assumption that the system-gain factor is near-constant with temperature as correct. Mr Born persists in divorcing his arguments from the real climate, thereby leading himself into error.
Have you ever read any of Willis Eschenbach’s discussions about
emergent phenomena, his thermostat hypothesis or the LaNina/ElNino
heat pump? You may find them interesting.
https://wattsupwiththat.com/category/emergent-climate-phenomena-2/
https://wattsupwiththat.com/2009/06/14/the-thermostat-hypothesis/
https://wattsupwiththat.com/2018/07/16/the-la-nina-pump/
Yes, I find Mr. Eschenbach’s thermostat theory fairly persuasive, at least in general terms. That is, it seems quite plausible that tropical-ocean temperatures are almost completely insensitive to the greenhouse-gas concentration.
I forgot this one:
https://wattsupwiththat.com/2013/02/07/emergent-climate-phenomena/
Mr Born should, perhaps, read the head posting. There, he will find the clear evidence that Hansen, Schlesinger, Lacis et hoc genus omne had neglected to take account of the feedback response to emission temperature in 1850, thereby effectively adding it to, and miscounting it as part of, the feedback response to direct warming by (i.e., to reference sensitivity to) preindustrial noncondensing greenhouse gases. They forgot the Sun was shining, and that its heat, as represented by emission temperature, would itself account for almost all the feedback response in 1850.
In the head posting (which is worth a read) Mr Born will find clear and explicit evidence that we make no assumption to the effect that the feedback fraction, and hence the system-gain factor, is constant. Instead, we show that even a 1% increase in the system-gain factor today compared with 1850 would engender a 250% increase in ECS.
Mr Born simply cannot be brought to understand that our reason for concluding that the values of the principal climate-relevant temperature feedbacks cannot be anything like as elevated, or their intervals so broad, as climatology has long but misguidedly imagined is that global temperature is not increasing at anything like the originally-predicted medium-term rate (and still less at anything like the currently-predicted rate). The system-gain factor – the ratio of equilibrium to reference sensitivity – is, therefore, necessarily very nearly constant in the industrial era.
It follows that climatology’s assumption of the possibility of exaggerated nonlinearity is contradicted not only by control theory – which Mr Born continues to treat in isolation from the real climate – but also by the failure of global temperatures to rise at anything like the predicted rate. Climatology has indeed made a very large error in forgetting that the Sun is shining.
I began reading Lacis (2010) but could hardly get past its first page where a big deal was made about CO2 being a non-condensing gas while water is. For example, they said, “CO2 is a well-mixed gas that does not condense or precipitate from the atmosphere. Water vapor and clouds, on the other hand, are highly active components of the climate system that respond rapidly to changes in temperature and air pressure by evaporating, condensing, and precipitating. This identifies water vapor and clouds as the fast feedback processes in the climate system.”
I would counter that to at least some extent, CO2 acts as a condensing gas as it is effectively washed out by rain. Now, it may not be significant, but it happens.
Haven’t gotten to the sunshine part yet.
https://pubs.giss.nasa.gov/docs/2010/2010_Lacis_la09300d.pdf
What my post actually said was that “although Lord Monckton has long conceded as he must that the climate system is nonlinear, he argues that it can’t be nonlinear enough to matter.”
Look, I’m not going to repeat that whole post. If you read my post with an open mind and the wit to understand analytic geometry, you’ll see that Lord Moncton has been peddling gobbledygook. But if reading it would tax your attention span too greatly, just consider his central claim:
Think about that. Wouldn’t it be more likely—in fact, isn’t it a a near certainty—that they did indeed remember the feedback at 255K but merely figured that it wouldn’t be very great up to that point, because there wouldn’t yet be much water vapor? Lord Monckton manages to infer that they forgot sunshine only by postulating that feedback is linearly proportional to temperature:
Since he has hopelessly mixed up mathematical concepts, I wrote a whole post to clarify things. If you got math, you’ll profit by reading it.
And what’s the relevance of his claim about a 250% ECS increase? Be honest. Does that make any sense to you? Work it out for yourself.
Now you guys are switching to water vapor?
I can’t keep this settled science straight 😔
Apparently not.
Ultimately, the arguments for positive feedback have long been based principally on evaporation rates, which depend on temperature, which depend on sunshine. So it’s unlikely that it escaped their attention that the sun was shining. Alarmists make a lot of mistakes, but there’s no evidence that ignoring solar radiation has been among them.
Yet again, Mr Born betrays his ignorance not only of control theory but also of climatology. Let him read Hansen (1984), or Schlesinger (1988) or Lacis et al. (2010, 2013). In each of these, he will see that, based on the quite well-constrained data for 1850, the conclusion is drawn that because the natural greenhouse effect was 32 K and reference sensitivity to the preindustrial noncondensing greenhouse gases was 8 K the system-gain factor (the ratio of the 32 K final warming to the 8 K direct warming) must be 4.
In reality, however, the system-gain factor was not 32 / 8 = 4. It was (255 + 32) / (255 + 8), or 1.095. Climatologists – the error seems universal – had simply not realized that at any particular moment, such as 1850, the feedback processes then subsisting must perforce respond equally to each degree of the reference temperature then obtaining, and thus proportionately to each of the components therein. Therefore, nearly all of the 24 K feedback response in 1850 was feedback response not to greenhouse gases, as climatologists had hitherto imagined, but to the fact that the Sun is shining – a fact that climatologists had overlooked in making their erroneous assumption that all feedback response in 1850 was feedback response to greenhouse-gas reference sensitivity.
JB -> “that they did indeed remember the feedback at 255K but merely figured that it wouldn’t be very great up to that point, because there wouldn’t yet be much water vapor? ”
Are you saying that average humidity has increased substantially along with CO2? Maybe you shouldn’t get too carried away.
No. Perhaps you should have read my post. I understand that this is all a little subtle. But do try to comprehend what my post actually said:
No. High ECS estimates arose from the system-gain factor 4 incorrectly derived by climatologists studying the temperature equilibrium in 1850 (there was to be no warming trend thereafter for 80 years). They imagined that, since the natural greenhouse effect was 32 K, of which only 8 K was direct warming by preindustrial noncondensing greenhouse gases and 24 K was feedback response, the system-gain factor must be 32 / 8, or 4. Sir John Houghton explained that to me when I wrote to him in 2006 to ask him why he imagined that feedback response and hence ECS were so large.
The corrected system-gain factor for 1850 is not 32 / 8 = 4. It is (255 + 32) / (255 + 8) = 1.095 or thereby.
Mr Born here perpetrates one of his many elementary errors of control theory, a subject in which he has no qualifications or experience, whereas we have the benefit of the wisdom of a more than usually competent professor of control theory, as well as three control engineers. If only Mr Born were not so desperate to find fault where none exists, he would realize that, as a matter of common sense, if our paper had contained any of the elementary errors he so fancifully conjures up, it would have been thrown back at us more than a year ago, rather than languishing in the editorial management system.
He imagines, as does official climatology, that in 1850 the feedback response to emission temperature would be negligible but that the feedback response to the 30-times-smaller reference sensitivity to preindustrial noncondensing greenhouse gases would be enormous. In reality, however, at any given moment the feedback processes then subsisting must perforce respond equally to each degree of reference temperature (the sum of emission temperature and all perturbations) and, therefore, proportionately to each component in reference temperature.
Not for the first time, Mr Born makes the elementary control-theoretic error of assuming that a system in which at a given moment the feedback processes then subsisting respond with equal vigor to each degree of reference temperature and, therefore, proportionately to each component therein must be a linear system. Ex definitione, however, that is not the case: for we are considering the system only at a particular moment, at which variance with time is not at issue.
Like it or not, feedback processes are inanimate. At any particular moment, such as 1850, they cannot pick and choose between one degree of the reference temperature then obtaining and another. They must – and do – respond equally to each degree of that temperature. Since 29/30ths of reference temperature in 1850 was the emission temperature that would prevail near the surface if there were no greenhouse gases in the air at the outset, 29/30ths of the feedback response in 1850 was feedback response not to reference sensitivity but to emission temperature itself.
That is why the head posting (which Mr Born should perhaps read) makes it clear that the system diagram embodying the simplified feedback formulism is not only relevant to a system in which the system-gain factor is invariant. It is also a representation of an actually or potentially nonlinear system at a particular moment of interest. In 1850, the relevant quantities are quite well constrained. They are set out clearly in the system diagram.
Finally, Mr Born – who seems more than somewhat desperate as he realizes that the climate scam to the furtherance of which he has pointlessly devoted so much of his dotage is collapsing under the weight of climatology’s absurd control-theoretic error – perpetrates yet another elementary howler. He cannot understand how a mere 1% increase in the system-gain factor today compared with 1850 could possibly engender a 250% increase in ECS. He invites the reader to work it out for himself. So let us do just that. The system-gain factor in 1850 was 1.095 (not the 4 fancifully imagined by climatologists). If that system-gain factor were to rise by just 1%, not only reference sensitivity but also emission temperature would be increased, from which the conclusion follows.
It is precisely for that reason that the system-gain factor must be very close to invariant: for otherwise ECS might be in the hundreds of degrees. Indeed, if one were to assume that the absurdly elevated midrange estimates of the various temperature feedbacks imagined by IPCC were correct, after correction of climatology’s control-theoretic error ECS would be somewhere between 450 and 600 K. That is why it is so important that Mr Born should cease to do pointless calculations independent of the real climate. In the real world, powerful constraints limit the magnitude of the system-gain factor, which does not and cannot change much under anything like modern conditions.
Of course, precisely because a 1% increase in the system-gain factor would raise ECS from the 1.1 K derivable from the data for 1850 to more than 4 K today (approximately a 250% increase), one cannot altogether rule out the high sensitivities predicted by official climatology. However, those high sensitivities – for which the original pretext was the large feedback response in 1850, all of which climatology attributes to the greenhouse gases and none of which it attributes to the fact that the Sun is shining – cease to be a near-certainty once the error is corrected. They become one possibility – and, on the evidence, a not particularly likely one. The certainty of apocalypse vanishes away. And if, as is likely, there is really no difference between the system gain factor in 1850 and today, ECS will be little more than 1 K. And that will be both harmless and net-beneficial.
Where the f**k is your evidence for feedbacks and the ECS, Brench?
You are just a sophist like Al Gore.
The sun heats the planet; the planet heats the atmosphere. END OF!
The furtively pseudonymous Leitmotif, that sheds more intemperately-expressed heat than light and would be very much better off not wasting its time here, is strikingly unaware of the evidence for feedback in the climate.
Just as the estimable Willis Eschenbach has a rule that those who cite him must cite and address his ipsissima verba rather than pejoratively paraphrasing him, so I have Monckton’s Rule: before commenting on the head posting, read it first and then think.
In the head posting, it is patiently and clearly explained that observed equilibrium temperature in 1850 was 287 K or thereby; that the emission temperature that would have obtained – and would obtain today – in the absence of any greenhouse gases in the air was 255 K or thereby; and that the difference between these two, the natural greenhouse effect, was 32 K.
That 32 K was the equilibrium sensitivity to the 8 K direct warming forced by the naturally-occurring, preindustrial noncondensing greenhouse gases. Therefore, equilibrium sensitivities exist.
The entire difference between 8 K and 32 K is feedback response. But to what did these feedback processes – chiefly from more water vapor in warmer air – respond? Official climatology says the 24 K feedback response was responding entirely to the 8 K reference sensitivity to (i.e., the direct warming by) the preindustrial noncondensing greenhouse gases. The implication is that the feedback response to the 30-times-larger 255 K emission temperature was zero.
It is, therefore, clear from the data for 1850 that feedback response exists.
Tropics -0.08 and the Arctic +0.74 C in March. This is kind of funny when we remember the SSW in March at high latitudes. As recently as February the anomaly in the Arctic was -0.31 C.
YEAR MO GLOBE NHEM. SHEM. TROPIC USA48 ARCTIC AUST
2022 02 -0.01 0.01 -0.02 -0.24 -0.05 -0.31 -0.50
2022 03 0.15 0.27 0.02 -0.08 0.21 0.74 0.02
Thank you Lord Mockton!
Your skill and word selection is always a joy to read–and the subject is, as you say “ the largest fraud in human history.”
As a retired electric utility engineer, the basic fact that existing/paid for generation was shut down BEFORE equivalent reliable replacements were in place is evidence enough that this massive fraud is real!
Keep fighting for all of us.
Here here
Hear hear
Thank you
Pizza! Pizza!
Honk honk
Where, where?
Mr Furst is very kind. My team will keep working until either someone comes up with a convincing refutation of our conclusion that the global warming panic arose from an elementary error of physics or our paper is published for all to see.
the global warming panic arose from an elementary error of physics
Yeah, right, Brench. So nothing to to do with the corrupt IPCC that was formed in 1988 by UNEP and the WMO?
The prime objective of the IPCC was to scare the cr@p out of us so we would cleave to the UN to solve our existential problems instead of going through the ballot box.
Is there anybody here who thinks we are not only being undermined by climate change alarmists but also by climate change lukewarmists who see this as an opportunity to win the middle ground between alarmists and “deniers”?
The GHE hypothesis is without evidence. The ECS assertion is without evidence. The global mean temperature is meaningless. The term “climate change” is meaningless – what climate are we talking about?
You all know that atmospheric CO2 is only 0.042% of the atmosphere.
You all know that the human contribution is only 3% of that 0.042%.
You all know that 92% of the earth’s emission spectrum is transparent to the CO2 15 micron absorption band.
You all know that a CO2 molecule does not have a net dipole moment and uses its vibrational modes..
You all know that Hoyt Hottel 1954 made it clear CO2 does nothing.
until it gets “hot”.
But the real problem is a pseudo-acceptance of junk science for political reasons rather than cutting that junk science off at its roots.
Richard Feynman – “It doesn’t matter how beautiful your theory is, it doesn’t matter how smart you are. If it doesn’t agree with experiment, it’s wrong.”
Where did WUWT go wrong?
I think Leitmotif is correct. Global Warming/Climate change theory is like CO2 in that it is only .042% science and the rest is politics/religion and therefore unrefutable by even the best science and sciencetific arguement.
Leitmotif asks where WUWT went wrong. Well, it didn’t go wrong. It has long been the most visited climate-change website.
The fact is that climatology has indeed made an elementary error of physics – an error so elementary, and so embarrassing, that the learned journal to which we submitted our paper dare not send the paper back to us, because it is in substance sound, but dare not publish it because that would tip the gravy-train into the gulch.
Leitmotif imagines that CO2 and other greenhouse gases have a negligible effect on temperature. In that event, he must explain why it was that in 1850 the global mean surface temperature exceeded the 255 K emission temperature by as much as 32 K. Where did that 32 K come from? The answer is that 8 K of it came from direct warming by CO2 and other preindustrial noncondensing greenhouse gases, and 24 K came from temperature feedback, chiefly in the form of more water vapor (a greenhouse gas) in warmer air.
This science is still not correct and so far nobody has had it right yet.
The emission temperature of 255 K doesn’t include the oceans.
How can 8 K come from C02 etc. and 24 K come from temperature feedback but nothing come from the oceans?
The oceans energy dwarfs the atmospheres and yet none of these calculations are taking any of it into account.
These values are very likely a fraction of what is being suggested when oceans are taken into account.
Some people may have doubts with there not been enough information here.
Firstly using the Stefan–Boltzmann law if the Earth is treated like the moon with the same albedo (~0.1) this gives around 272k with no atmosphere. This is virtually the same as the moon, but of course the moon doesn’t have an ocean. This provides why the 255k doesn’t include any influence from a ocean.
Secondly the difference between ocean and land temepratures are considerably different in absolute values. Therefore showing energy content is sourced from warming below the surface significantly more than the atmosphere. This energy release from the ocean provides this energy difference between the atmopshere over land and ocean.
If the planet was to change 100% either land or ocean, global temperature would changed by several degrees at least. This indicates that to get to global temperatures around the current 288k it is not just the atmospheric gases and feedback responsible for this.
Finally, some may doubt the energy between the ocean and atmosphere. The figures are for the atmosphere 5×10(21)j/k and the ocean 5.6×10(24)j/k. This represents 1120 times more energy in the ocean than the atmosphere.
The planets laspe rate is caused by the surface heating the atmosphere where short wave radiaiton from the sun that is not reflected is virtually all absorbsed at the surface with little in the atmosphere itself. This warms the surface considerably more than the atmsophere. If the TOA absorbed the most shortwave radiation energy decreasing downward, then the laspe rate would be in reverse to what it is now.
Leitmotif imagines that CO2 and other greenhouse gases have a negligible effect on temperature.
No I don’t. I assert they cannot raise the surface temperature,
You are such a sophist, Brench. And dangerous too because you keep the lukewarmist stance alive and kicking.
Where is your evidence? Where is your data?
If you don’t have any you have nothing.
Monckton’s Rule: before commenting on the head posting, read it first and then think.
Since emission temperature is 255 K or thereby, and that temperature would obtain in the entire absence of greenhouse gases in the air, and since the observed global mean surface temperature in 1850, before we had anything to do with it, was 287 K or thereby, the 32 K difference – the natural greenhouse effect – was driven by greenhouse gases, chiefly the condensing greenhouse gas, water vapor, by way of temperature feedback response.
It is, therefore, not legitimate to argue that greenhouse gases cannot raise global temperature. They can. They do. But not by anything like as much as official climatology so profitably imagines.
Sycophancy is alive and kicking.
Don’t whine.
Don’t be a son of sophistry, Brench.
Don’t whine. Those who have nothing useful or scientifically tenable to contribute should, as the scholars of ancient Greece used to say, “keep holy silence”.
Ja. Ja. Winter is coming.
https://breadonthewater.co.za/2022/03/08/who-or-what-turned-up-the-heat/
Or not?
Sofar we are lucky. But incoming solar is still going down.
Equatorial Pacific and Atlantic surface temperatures are now below average (1981-2010).
I for one, tend to ignore your frequent posts because they are off topic for the thread and break the flow of dialogue. Also, I don’t understand what your predictions are based on. How about writing an article that lays out your assumptions and conjectures, with supporting facts or citations? Do you have a summary of how accurate your past predictions have been, including false positives and false negatives?
I’m less impressed by colorful pictures than I am by justified predictions. If I want pretty pictures I can go to YouTube and look at the NASA animations.
Even some basic information about interpreting them would be helpful, I certainly don’t understand what I am looking at in the graphics.
It happens.
Mr. Spencer: My complaint is, Mr. Palmowski is gonna give us the weather, but he never ever gives us a report on traffic!
I’d like to know whether his predictions are any better than the climate models.
La Niña is doing well.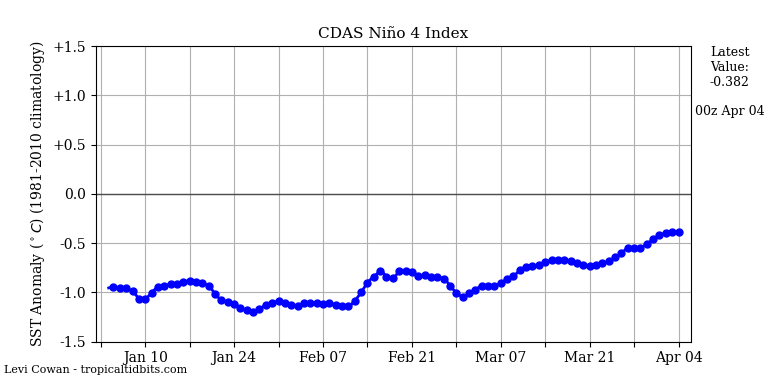
http://www.bom.gov.au/archive/oceanography/ocean_anals/IDYOC007/IDYOC007.202204.gif
The PDO shift occurred in 1977. Well do I recall its effects in Oregon. While it happened during the winter of 1976-77, December 21-31 remained under the old regime. The shift occurred in January and February.
There was snow in December but not in January and February. It was the most severe snow drought in at least the prior century.
John, I was working for the Federal Bonneville Power Administration (BPA) as a senior engineer at the time. Shortly afterwards I moved to Western Area Power Administration’s (WAPA) Sacramento [CA] Area Office as Director of System Planning and Resources. One of my primary duties was to participate in renegotiation of the contract with Pacific Gas and Electric (PG&E) because we had “busted” the existing contract for guaranteed power deliveries from the hydroelectric system. That was a direct result of the PDO shift-related drought. Droughts are now “unprecedented?”
As a side-note, PG&E was not paying the previously-negotiated price during the negotiations and the taxpayers were losing significant monies every month as a result. There was no sense of urgency on the part of WAPA higherups because it wasn’t costing them anything. In fact, the negotiations were still ongoing when I left a few years later, a perfect example of government’s feckless treatment of their responsibilities. Not long after that I left the lucrative Federal employment in disgust. Best thing I ever did.
Good on you!
Yes, the lack of snow pack should have made the writing on the wall obvious.
I was also there at the time and can attest to John’s observations.
The closest our dryland wheat ranch ever came to a crop failure was in 1977.
The lack of snow was made worse by extreme cold (cloudless nights!), threatning to kill the uncovered wheatlings. But they’d gone dormant in time, so survived. Enough spring rain fell for us to survive as well. Dad never bought crop insurance.
November and December snow were low, but not outside the normal range, which varies greatly in those months.
The UN will have to rattle the bones harder for a super El Nino to return. In the meantime, it’s all downhill in the oceans, the sky, and the Climate Crusades.
NOAA SST-NorthAtlantic GlobalMonthlyTempSince1979 With37monthRunningAverage.gif (880×481) (climate4you.com)
PDO MonthlyIndexSince1979 With37monthRunningAverage.gif (880×475) (climate4you.com)
bfly.gif (2150×1280) (nasa.gov)
How Popular Is Joe Biden? | FiveThirtyEight
I follow Rasmussen because it tracks actual voters’ opinions.
Does Rasmussen have Joe at 25?
How voters have regret?
On April Fool Day, Rasmussen had: Biden at 40% approval and 58% disapproval, 21% strongly approve with 48% strongly disapprove = -27 Presidential Approval Index. Comparing President Trump (3/31/18) 47% approval vs President Biden (3/31/22) 42% approval is not a happy comparison. Biden’s approval rating went south of Trump’s last December (12/22 vs 12/17) and has stayed there. The poll has a sampling error of +/- 2.5% with a 95% confidence interval.
If about 50% of voting Americans disapprove of you strongly after you have been in office a little over a year, your party is in trouble in the midterms and you shouldn’t plan on running in the next election even if you are cognitively up to it, nor should anybody associated with you. Anyway, you should expect that the other party will stifle any of your (handlers’) programs beginning 1/3/23. Disappointment and heartache are on the way.
Does the downvoter assert Rasmussen doesn’t survey actual voters? Or just doesn’t like Rasmussen because he doesn’t over-sample Democrats?
“IPCC (1990, p. xxiv) confidently predicted 1.8 K global mean anthropogenic warming from 1850-2030. Of this, 0.5 K (HadCRUT5: Morice et al. 2021) had occurred by 1990, so that the projection was equivalent to 1.3 K over the four decades 1991-2030, or 0.34 K decade–1.”
I never understand why you need to overstate this just to add a few extra hundredths of difference.
You could have a reasonable argument to simply say that the 30 year old IPCC report predicted there might be around 1C waming by 2025, and it seems unlikly that will be correct. But instead you keep making these easily debunked exagerations, just to make it look slightly worse than it was.
You say their prediction was “confident”. In fact the emphasis the large uncertainties
You ignore their own stated rate of rise of around 0.3C / decade, with an uncertainty range of 0.2 – 0.5C / decade.
You say they predicted 1.8C of warming by 2030 over the 1850 value. But in fact that’s over the pre-industrial value which they define as 1750-1800.
You keep insisting that when they predicted 1.8C over-preindustrial temperatures that they meant there had only been 0.5C since then, so where actually predicting 1.3C over the next 40 years, yet it’s clear from their graphs and statements that the models are showing 1990 as around 1C warmer then pre-industrial.
You ignore their clear statement that
It seems you know the data well. It would be great if you developed a post for this site on this subject, expounding on the arguments and data you present here. It would be helpful to me and, I presume, others.
bellcurveman likes to whine, a lot.
“Because of other factors which influence climate, we would not expect the rise to be a steady one”
Then why do they always assume that the rise *will* be a steady one?
Well if you look at NOAA and NASAs “adjusted data” it is obvious that they are doing their best to make the temperature record follow the steady rise in atmospheric CO2.
A much simpler more accurate excuse to explain why temperatures do NOT follow CO₂ atmosphere concentration(s), is “We don’t know”!
Instead, there are continual bafflegab attempts to disguise their assumed brilliance that fails to predict climate anything anywhere near accurately.
Do you even read the drivel that you promote, Bellend?
You do realize that CO2 concentration is essentially uniform across the world so if you assume (incorrectly, as you know) that CO2 is the sole control knob all of the regional variability averages out? Yet climate models have no idea what caused many previous periods of global warming and cooling when CO2 was constant so they CLEARLY don’t account for all climate factors. Climate modelers believe their models even though the actual temperature history tells them that they shouldn’t. You shouldn’t believe their predictions and uncertainty ranges either.
Officially, CO2 is supposed to be “well mixed. However, lately, NASA seems to be making a point of how it varies across the globe with time and latitude.
https://scitechdaily.com/nasa-makes-first-of-its-kind-detection-of-reduced-human-co2-emissions/
See especially the embedded animation here:
https://scitechdaily.com/nasas-new-global-view-of-co2-critical-step-for-carbon-cycle-science/
Both the publication and the animation say the range on the spatial variability of CO2 is only 5%. And that’s the range (max-min). The standard deviation is far lower than that. If that’s not well-mixed then I don’t know what is.
Not sure what you are looking at. The first animation talks about a 3% to 13% drop in overall CO2 due to covid, not a 5% variation around the globe. The second animation shows CO2 concentration varying from 300 ppm to 400 ppm in many locations – a 30% variation over time and space, very much not a linear growth pattern at all. In the second link it is noted that the SH is very different from the NH as is shown by the animation. Yet the climate scientists and their models continue to predict *average global temperatures* as if there were no differences in the hemispheres let alone even the smaller regions. If you watch the second animation the CO2 concentration north and south of the Mason-Dixon line are quite different. If CO2 is the temperature driver then the temperature growth from Sothern CA, to New Mexico to Texas, Alabama, and Georgie plus Mexico should be very different from that of the northern states of the US plus Canada.
Yet all we hear from the climate scientists and their models is that the globe is going to turn into a cinder, all the animals are going to die, all the crops are going to fail, and humankind is going to die from starvation and heat stroke.
The model of CO2 however, shows we should all be migrating to Australia, South Africa, and the southern part of South America where the CO2 concentration is not nearly as high as it is north of there.
TG said: “The first animation talks about a 3% to 13% drop in overall CO2 due to covid”.
That’s not what the article says. It says and I quote.
Notice that it does NOT say overall CO2 (in units of ppm) but emissions (in units of GtCO2 or ppm/yr). Overall CO2 did NOT drop by 3 to 13% from 410 ppm to 398 – 357 ppm.
Furthermore, Weir et al. 2021 figure 1 clearly shows the spatial range as 406 to 420.
TG said: “The second animation shows CO2 concentration varying from 300 ppm to 400 ppm in many locations”
The scale on the animation is 390 to 408 ppm.
What in Pete’s name do you think this verbiage is saying?
YOU SAID: “Both the publication and the animation say the range on the spatial variability of CO2 is only 5%”
That is not at all what the quoted verbiage says. It doesn’t mention spatial variability at all!
Spatial variability is *NOT* the same thing as *emmisions” variability!
5% spatial variability *IS* significant. The variation is time and space dependent. When the mix is 5% down then more heat will be lost to space – unless you assume water vapor absorbs what CO2 doesn’t. If you make that assumption then it follows that the amount of CO2 in the atmosphere is irrelevant. Water vapor is the controlling factor.
TG said: “What in Pete’s name do you think this verbiage is saying?”
It is saying the emissions decreased by 3 to 13%. That is emissions. I have underlined and boldened emissions to drive home the point. Emissions are not the same thing as the amount of CO2 in the atmosphere nor the spatial variability of it.
TG said: “YOU SAID: “Both the publication and the animation say the range on the spatial variability of CO2 is only 5%”
Yep. And I stand behind what I said. The range on the spatial variability of CO2 is only 5%. I said nothing about the amount of CO2 in the atmosphere nor the human emissions. CO2 is a well-mixed gas and the links CS posted above are consistent with that conclusion.
TG said: “That is not at all what the quoted verbiage says. It doesn’t mention spatial variability at all!”
That’s right. It doesn’t. That verbiage that you picked from that article has nothing to do with my post. I think you are attempting to deflect and divert the conversation away from the fact that CO2 is a well-mixed gas.
TG said: “Spatial variability is *NOT* the same thing as *emmisions” variability!”
No offense, duh. I want you to repeat this over and over and burn it into your brain. That way hopefully on your next post won’t try bring up emissions when we are talking about spatial variability.
I want you to read the publication being discussed. I want you to then tell the WUWT audience what that publication says in regard to the spatial variability of CO2.
You are in no position to make demands, you silly person.
“ The scale on the animation is 390 to 408 ppm.”
Holy sh1t what a range
I’m not sure I’m following your comment. Am I supposed to be gobsmacked by the 390 to 408 ppm range as well?
An average will always have less variance than the original data from which the average was derived.
What happens in any given place mostly depends on what winds are blowing which way.
Bellman rather foolishly references the IPCC statement “Because of other factors which influence climate, we would not expect the rise to be a steady one”
Yet he totally ignores the IPCC’s own latest* CMIP5 report that shows their ensemble of 25-plus separate climate models predicts an average rise rate of 0.44 °C/decade, which can be compared to factual (i.e. measured) average rise rate of just 0.16 °C/decade. (Ref: Figure 2 at https://wattsupwiththat.com/2022/03/11/climate-model-democracy/ )
The assertion of an ensemble average rise rate does not permit a parallel claim of “we would not expect the rise to be a steady one”.
Does the IPCC believe their use of ensemble modeling is valid or not?
*note: AFAIK, CMIP6 is undergoing “progressive release” at time of this post, with data from all climate models that are to be compared not fully in yet.
I downloaded the CMIP5 data from the KNMI Explorer. I get an average warming rate of +0.23 C/decade from 1979-2021. This is compared to the average of UAH, RSS, HadCRUT, BEST, GISTEMP, NOAA, ERA, and RATPAC of +0.19 C/decade.
“Yet he totally ignores the IPCC’s own latest* CMIP5 report that shows their ensemble of 25-plus separate climate models predicts an average rise rate of 0.44 °C/decade, which can be compared to factual (i.e. measured) average rise rate of just 0.16 °C/decade.”
I’m quoting the ancient 1990 IPCC report. You know, the one Monckton was talking about. The only one he ever mentions now.
The IPCC AR5’s actual short term projection is:
SPM 2.2 Projected changes in the climate system
https://www.ipcc.ch/site/assets/uploads/2018/02/AR5_SYR_FINAL_SPM.pdf
This is based on surface data not satellite, but using UAH the average for 1986-2005 was -0.11 °C. So far the average since 2016 has been +0.25 °C. That’s obviously only based on 6 years, time will tell if the next 14 years see an increase or decrease.
“The assertion of an ensemble average rise rate does not permit a parallel claim of “we would not expect the rise to be a steady one”.”
No idea what you are on about here. Who’s asserted what? Averaging multiple models will smooth out variations in the rise.
Bellman, you stated/asked:
“No idea what you are on about here. Who’s asserted what? Averaging multiple models will smooth out variations in the rise.”
As I stated in my above post: “Ref: Figure 2 at https://wattsupwiththat.com/2022/03/11/climate-model-democracy/ ”
Take notice of the upper left corner box of that figure that has this:
“Model Trend Average: +0.44 °C/decade
Observational Trend Average: +0.16 °C/decade“
Furthermore, the title description for this figure states this:
“Ross McKitrick and John Christy compare the models to the observations statistically, and find the difference is statistically significant. The data is from their 2018 paper (McKitrick & Christy, 2018), the plot is from John Christy.”
I hope this is sufficient to give you an idea.
Not answering my question. You say someone’s making an assertion that excludes an unsteady rise. Yet the graph shows a whole host of model projections, none of which shows a steady rise.
You seem to be claiming that because the average of all these different models smooths out to a steady rise, that somehow means the IPCC are asserting the rise will be steady.
No, I never said “someone’s making an assertion . . .”
You specifically asked: “Who’s asserted what?”
I replied with:
“Ross McKitrick and John Christy compare the models to the observations statistically, and find the difference is statistically significant. The data is from their 2018 paper (McKitrick & Christy, 2018), the plot is from John Christy.”
What more needs be said?
“No, I never said “someone’s making an assertion . . .””
You said “The assertion of an ensemble average rise rate does not permit a parallel claim of “we would not expect the rise to be a steady one”.”
If you don’t mean someone asserted that there was an average rise rate being predicted by the IPCC models, thus meaning they were wrong to claim that they didn’t expect a steady rise, what did you mean?
Look up the meaning of the word “rhetorical”.
Now could you just try to explain what you meant? Why do you think it’s foolish to say that the temperature rise will not be steady.
Your post started with:
Hmmm . . . got a reference/link for the dictionary or source that gives that definition of “rhetorical”?
I thought not.
“I thought not.”
https://www.merriam-webster.com/thesaurus/rhetorical
Synonyms for rhetorical
Hmmm . . . I see that you give a link to Webster’s on-line thesaurus but not their dictionary, which is readily available at https://www.merriam-webster.com/dictionary/rhetorical .
I have attached a screen grab that shows how their on-line dictionary defines “rhetorical”, which is quite different and for which I point to their definition 1(b) as being applicable to my meaning and my use in the above comments.
As to Webster’s on-line thesaurus‘s list of synonyms (same as those given in their dictionary), which you accurately summarize, I don’t find any of those to be “mostly meaningless” as Webster’s thesaurus (and thesaurus only) asserts.
Thus, the Webster’s on-line thesaurus definition of rhetorical is both inconsistent with their on-line dictionary as well as being internally inconsistent.
Kinda like CO2 is the control knob for temperature so we have to destroy our reliable electric generation to fix something.
Oh wait, CO2 is only one factor in the temperature rise. But we must still kill fossil fuels because of CO2!
Oh wait, tomorrow it will be CH4 that needs to be removed from human’s toolkit of current survival methods.
Oh wait, …
You asked for a definition, I gave you one. You said I was making it up so I gave you a link. Now you discover that words can have more than one meaning, and start insisting I use your definition.
Does any of this have a point? I wasn’t sure why you asked for the definition in the first place. Wasn’t sure if you were claiming to be rhetorical or accusing me of being it. This is all a distraction from your claim I was foolish to quote the IPCC saying the rise would not be steady.
“. . . and start insisting I use your definition.”
Got any evidence to go with that?
I just pointed out the Merriam-Webster on-line dictionary has a serious difference in definition the word “rhetorical” compared to the Merriam-Webster on-line thesaurus.
The fact that revealing that difference gored your bull (pardon the pun) is something you’ll have have to deal with yourself.
I stand by my posted comments.
https://wattsupwiththat.com/2022/04/03/the-new-pause-lengthens-now-7-years-6-months/#comment-3491912
“The fact that revealing that difference gored your bull (pardon the pun) is something you’ll have have to deal with yourself.”
Pun?
As I said before, I’ve no idea what point you think you are trying to make. A questioned what you meant by the average proving a steady rise, and you asked me to look up the definition for rhetorical. I wasn’t sure if you were claiming to using rhetoric or where accusing me of it.
“As I said before, I’ve no idea what point you think you are trying to make.”
That statement alone speaks volumes.
Note your Webster’s dictionary has as second definition
And here’s their definition of grandiloquent
I will note the reference to a second definition . . . however, I obviously need to remind you that in my post above on April 4, 2022 11:30 pm I specifically stated: “. . . and for which I point to their definition 1(b) as being applicable to my meaning and my use in the above comments.”
Yet another failed attempt at deflection on your part.
Because an average without an associated variance or standard deviation tells you nothing about the dispersal of the data around the mean. The dispersal of the data around the mean of an ensemble is hidden. The average mean itself hides that information. Consequently, a steady rise of temperature would not be expected. It should VARY AROUND THE MEAN if it is realistic.
The mean could be 50 calculated from 51 to 49 or from 0 to 100. Who knows without a standard deviation?
Statistics isn’t a game to try and find some numbers that show what you want. Statistics are designed to provide an informative description of data. If you don’t want to provide the entire panoply of information like skewness, kurtosis, standard deviation, etc. Then simply quoting a mean is nothing more than doing what the old adage says about figures.
Nothing’s hidden. It’s shown in the graphs. My question was why Gordon A. Dressler wants to look at the average to claim that we should expect any rise to be steady.
You seem to be agreeing with me – you don’t expect the rise to be steady.
Of course something is being hidden. If I see an average without a standard deviation or variance, I immediately know that something has been hidden. Looking at an ensemble, you have no idea how many runs of each component has been averaged together to even achieve that one projection. How many times do we see a simple graph that only shows the ensemble average and not the entire group of components? Can you find the total standard deviation or variance of the data that went into any RCP projection?
You need to take this up with Gordon A. Dressler and his sources.
You are the one questioning what an average shows or doesn’t show.
You need to address the points I raised.
What are the standard deviation, variance, kurtosis, or skewness quoted with an ensemble average?
Averages MUST have these or they are worthless. Dispersion of the data and it’s shape is important in judging what the average tells you.
Good, so Gordon A. Dressler’s argument is worthless, as I was saying. The 1990 IPCC was right to say the warming would not be a steady rise.
I’m really not sure if you are following this argument. You need to go back to the start and work down. I’ve not said anything about the ensemble mean except it doesn’t prove that the rise will be steady.
If the ensemble mean (which *is* a steady rise) doesn’t prove the rise will be steady then of what use is it?
It is the best estimate of the expectation of the value. It’s the same concept used with the operational weather forecasting models GEFS, EPS, and the like. The ensemble mean has more objective skill in predicting the value at a specific point in time than any one member alone. It cannot be used to assess the variability of that value. For that task you need to use a different technique. Just because you decided to drive a screw with a hammer doesn’t mean the hammer is useless. It means you chose the wrong tool for the task. It’s the same with the ensemble mean. It is the wrong tool for the task of quantifying variability.
Actually, it isn’t. An average is supposed to give an expectation of the next value. But the comparison of the ensemble mean with actual observations show the two are diverging so the ensemble average fails to give a valid expectation of the next value.
Is that why forecasted hurricane tracks can show landfall ranging from South Florida to the Carolina’s? Is that why they couldn’t even get the track of Katrina correct an hour before landfall? Those kinds of results don’t provide much confidence in their expectation of values.
Except they do *NOT* show any more objective skill at any point in time.
I ask again – then what is the use of the ensemble mean?
TG said: “Is that why forecasted hurricane tracks can show landfall ranging from South Florida to the Carolina’s?”
No. The ensemble mean is not used to form the uncertainty envelop. The ensemble spread is used for that. Again…you have to use the right tool for the job.
TG said: “Is that why they couldn’t even get the track of Katrina correct an hour before landfall?”
You can view the forecast verification here. The 12 hour forecast error for Katrina was 24.5 nm. That is slightly better than the 2005 season average of 35 nm.
TG said: “Except they do *NOT* show any more objective skill at any point in time.”
Oh but they do! Here is the most recent 2020 report. Notice that the ensemble forecasts are superior to individual forecasts for both track and intensity forecasts.
TG said: “I ask again – then what is the use of the ensemble mean?”
It’s still the same answer. To provide the best expectation of a value. If you can think you can do better than the TVCA or HCCA ensemble mean in forecasting cyclone tracks and intensities then prove it. Publish your results.
“Oh but they do! Here is the most recent 2020 report.”
The many wrongs make a right fantasy of consensus climatology.
Every member of the ensemble has a large uncertainty bound. The uncertainty bound of the mean is the root-mean-square of the uncertainties of the individual projections.
The uncertainty of the ensemble mean is so large that its correspondence with any measured temperature trend is indistinguishable from happenstance.
The projections are physically meaningless because the underlying physics is known to be wrong or incomplete or both. Incidental data tracking provides no assurance of physical accuracy.
It’s amazing how this standard fact of scientific thinking consistently escapes the ken of CO₂ aficionados.
They must be uniquely vulnerable to a neural disease state that’s both acquired and permanent, because repeated exposure to scientific rationality provides no cure.
It is very much like the old, old Wacky Plank** saying:
“Don’t confuse me with facts, my mind is made up!”
**early forerunners of the electronic meme
Pat, let me make sure I’m understanding your point. You’re saying all of the NHC tropical cyclone forecasting models are “physically meaningless because the underlying physics is known to be wrong or incomplete or both.”? Is this correct?
Let’s understand what you’re saying, bdgwx.
Are you saying those cyclone forecast models are able to forecast without multiple daily data updates?
PF said: “Are you saying those cyclone forecast models are able to forecast without multiple daily data updates?”
Absolutely not. In fact, I’m saying the opposite. They take as input observations representing the initial conditions. That’s what models do. They take inputs and process them using a set of rules, heuristics, algorithms, and equations representing the way reality works and produce outputs.
I’m also saying that the ensemble mean of a bunch of models is superior to individual models in regard to forecasting skill for both track and intensity. Tim Gorman challenged that by using an example in the domain of tropical cyclone forecast. I debunked his challenge by showing that TVCA and HCCA are, indeed, superior to individual models like HWRF, HMON, GFSO, UKM, ECMWF, CTX, etc.
“I’m also saying that the ensemble mean of a bunch of models is superior to individual models in regard to forecasting skill for both track and intensity. Tim Gorman challenged that by using an example in the domain of tropical cyclone forecast. I debunked his challenge by showing that TVCA and HCCA are, indeed, superior to individual models like HWRF, HMON, GFSO, UKM, ECMWF, CTX, etc.”
If the mean of the ensembles is more accurate than the individual models themselves then that either has to be pure luck or the individual models are truly accurate by themselves. An average of wrong models simply can’t give an accurate result in any other manner. Yet you are claiming that the individual models are *not* accurate by themselves. That only leaves pure luck as the operating factor.
It’s why neither the models or the ensemble means could predict the landfall of Katrina accurately even an hour before landfall.
Pat Frank said: “The uncertainty bound of the mean is the root-mean-square of the uncertainties of the individual projections.”
Patently False! Read Bevington section 3 and 4. Pay particular attention to equation 3.14, 4.10 through 4.14. Also refer to Taylor and the GUM which say the same thing. You can confirm this with the NIST uncertainty calculator as well.
No they don’t. Do you know why. Because the underlying requirements for those are not being met. You need to do more than just cherry pick equations.
Here is a challenge. Pick just one of the equations you mentioned, then list each and every requirement discussed in the book and describe how they are met. Then describe how the assumptions in the product you are using as an example meet those requirements.
3.14. U and V are uncorrelated and x is the function f(U, …, V). If U and V have correlation then the more general form 3.13 must used. Note that even with correlation of r(U, V) = 1 the uncertainty on f(U, V) = (U+V)/2 is not root-sum square. The NIST uncertainty calculated I linked to will handle both the correlated and uncorrelated case equally so you can confirm that in neither case the uncertainty of f(U,V) is root sum squared.
You didn’t do as asked. For Bevington 4.10 to 4.14 the restrictions are:
Bevington says: “Each of the data points contributes to the determination of the mean u
and therefore each data point contributes some uncertainty to the determination of the final results.<ol><li>A histogram of the data points would follow the Gaussian shape, peaking at u and exhibiting a width corresponding to the standard deviation σ.
In the introduction to Chapter 3, it is specified that the measurements must be of the same thing with only “instrumental” (i.e. random) error.
Bevington goes on in Chapter 3 to specify that your U and V must have a functional relationship to x. He says:
“The uncertainty in the resulting value for x can be found by considering the spread of the values x resulting from combining the individual measurements u_i , v_i, … into individual results x_i.
You don’t seem to have met any of the requirements.
TG said: “Pick just one of the equations you mentioned”
I picked 3.14.
“The ensemble mean has more objective skill in predicting the value at a specific point in time than any one member alone.”
You must be joking here. That’s like saying I’ll blindfold you and give you a bow and arrow then spin you around until you’re so dizzy you have no idea which way you are facing. Then you can start shooting arrows and expect the average shot to find the bullseye.
If you do happen to hit the bullseye, you’ll never know it plus it will be dumb luck. God only knows how many arrows it would take.
You can’t average wrong answers and hope that the average will give you the right answer. It is no more complicated than that.
It’s like expecting a group of monkeys at typewriters to recreate The Illiad and the Odyssey. Yeah, probability says it can happen, but I wouldn’t wait around for it to occur either.
JG said: “You must be joking here. That’s like saying I’ll blindfold you and give you a bow and arrow then spin you around until you’re so dizzy you have no idea which way you are facing. Then you can start shooting arrows and expect the average shot to find the bullseye.”
I’m not joking. I’m very serious. And it’s not like that at all. GCMs do not make predictions without inputs.
“I’m not joking. I’m very serious. And it’s not like that at all. GCMs do not make predictions without inputs.”
You *have* to be joking. CGM’s do not use past temperatures as input. They have initial conditions as inputs and from there they use their parameterized constants and their differential equations to predict future temperatures. At least that is what the “climate scientists” claim.
And that is exactly what Jim is describing. Give you a bow and arrow plus a randomized, unknown direction as inputs and let you predict where the target is.
TG said: “CGM’s do not use past temperatures as input.”
Strawman. I didn’t say GCM’s use past temperatures. I said they don’t make predictions without inputs.
TG said: “And that is exactly what Jim is describing. Give you a bow and arrow plus a randomized, unknown direction as inputs and let you predict where the target is.”
Tropical cyclone track and intensity forecasts don’t work like that. They don’t randomly shot arrows towards a target. They input observations as initial conditions and then use a model to forecast the track and intensity. There are many different models used thus many different forecasts. Those forecasts are neither random nor done without inputs like what is being implied.
In other words they are data tracking devices projecting the future from the past. They have to be continually updated with new tracking data in order to project a new track. That’s no different than predicting the future of a stock by projecting past performance! I
And the hurricane tracking models aren’t even as accurate as many stock tracking models are!
And *you* think they are based solely on physics?
“No. The ensemble mean is not used to form the uncertainty envelop. The ensemble spread is used for that. Again…you have to use the right tool for the job.”
That’s my entire point. If the ensemble has a mean and that mean doesn’t accurately predict the actual path then of what use is the ensemble mean?
“You can view the forecast verification here. The 12 hour forecast error for Katrina was 24.5 nm. That is slightly better than the 2005 season average of 35 nm.”
They couldn’t get the landfall point correct an hour before it hit land? And you call that accurate?
“Notice that the ensemble forecasts are superior to individual forecasts for both track and intensity forecasts.”
An inaccurate forecast is an inaccurate forecast. It doesn’t matter if it is more accurate than others if it can’t even tell an hour before landfall where that landfall will occur!
“To provide the best expectation of a value.”
“That’s like saying you expect the next card in blackjack to be one of 52 cards!
It’s not a useful expectation!
TG said: “That’s my entire point. If the ensemble has a mean and that mean doesn’t accurately predict the actual path then of what use is the ensemble mean?”
It’s still the same answer as last time. It is the best expectation of the value. If you ask again I’ll give you the same answer again.
TG said: “They couldn’t get the landfall point correct an hour before it hit land? And you call that accurate?”
Strawman. I never said it was accurate especially with the implication that it was perfect. I said the error on the 12 hour forecast was 24.5 nm and that it is slightly better than the typical error at that lead time.
TG said: “An inaccurate forecast is an inaccurate forecast. It doesn’t matter if it is more accurate than others if it can’t even tell an hour before landfall where that landfall will occur!”
Can you define “inaccurate” and “accurate” objectively?
Can you provide a link to a tropical cyclone forecasting model that performs better than the TVCA or HCCA models?
Do you form conclusions and base decisions using the least or more accurate model?
“You can’t average wrong answers and hope that the average will give you the right answer.”
Amazing that such an obvious thought escapes so many, isn’t it. 🙂
You know, if at least some of the “projections” were below observations, you might make an argument about their veracity. As it is, there just isn’t anyway one can, with a straight face, say that an average will give a correct answer.
And yet the ensemble mean from TVCA and HCCA consistently outperform individual models in tropical cyclone track and intensity skill.
I have a challenge for you Pat. Post a link to your model that forecasts tropical cyclone tracks and intensities and lets see which one is better…your model or TVCA.
The challenge, bdgwz, is for you to figure out that updating engineering models to readjust observation-tracking is no measure of physical accuracy.
I’ll bet he doesn’t have a clue about how much use is made of satellite tracking and high altitude plane information to adjust the forecasted track and computer programs.
I’m not the one challenging models here. I accept that the models NHC uses does a far better job than I ever could. I find it difficult just assessing the location of the MSLP min in realtime to within 50 nm especially when there is no eye. There’s no way I could forecast the track to within 31 nm, 60 nm, 96 nm, 140 nm, and 224 nm for 24, 48, 72, 96, and 120 hour lead times respectively like what the TVCA ensemble mean does.
Do you have a better model or not? Do you even have an alternative model?
It’s not up to us to come up with a better model. All we need to do is point out the problems with the existing ones!
So you want the NHC to abandon models that make useful forecasts because they aren’t perfect?
No, but you also need to admit that the models are constantly updated with new path info from satellite and high altitude observations. One reason for preparing to evacuate from, say, Florida to North Carolina or even further north is because using the models only, that is as accurate as they can be. Don’t gauge the accuracy of models based on the last 25 miles to shore, do it when the storms are out to sea 500 miles.
Again, I’m not the one challenging the models, their limitations, or how they work. I’m just trying to explain to you the purpose of the ensemble mean. You challenged it in regards to tropical cyclone forecasts. I provided the actual skill of TVCA as compared to various individual models and showed you that the ensemble mean has better skill. That is the value of the ensemble mean. Do you want the NHC to stop using TVCA?
They are basically data tracking models projecting future performance from past performance, just like stock predication software. “Past performance is no guarantee of future results”!
TG said: “They are basically data tracking models projecting future performance from past performance, just like stock predication software.”
Do you really think that’s how they work or are you frustrated and making off-the-cuff comments that you don’t actually believe?
Settled science in 1990?
““Because of other factors which influence climate, we would not expect the rise to be a steady one””
Yes, expect a cooling trend for several years to come, because the other and only major factor is the Sun.
CO2 has nothing to do with it.
If the Sun is the only major factor then why did the Earth experience secular cooling for millions of years while the Sun continued to brightened? Why wasn’t the Earth in a perpetual snowball state in the past?
EXACTLY!
“The Sun is becoming increasingly hotter (or more luminous) with time. However, the rate of change is so slight we won’t notice anything even over many millennia, let alone a single human lifetime. . . . Astronomers estimate that the Sun’s luminosity will increase by about 6% every billion years.”
(ref: https://usm.maine.edu/planet/sun-getting-hotter-if-so-why-will-earth-eventually-become-too-hot-life )
So, in the last million years (which encompasses about ten glacial/interglacial cycles), the Sun’s luminosity has increased by about 6%/1000 = 0.006%, horror of horrors!
For comparison, the Sun’s luminosity varies by about 0.1% over a typical 11-year sunspot cycle, or about 17 times as much as the overall net luminosity increase occurring over that one million years.
By the way I notice that UAH has been warming at a rate of 0.34 °C / decade since November 2010, a period of 12 years and 5 months.
This period was determined using the Monckton non-cherrypicking technique of starting at the present and looking back to find the earliest date which would give me a trend greater than 0.34 °C / decade.
You just aren’t getting your CO2 hockey stick
You make clear you don’t understand how and WHY he made his chart……..
I think I’ve made it clear over the years that I do know how the chart is made. I’ve reproduced them and predicted where the new pause date will be once the UAH data is published, before Monckton’s posts.
I’ve explained in excruciating detail how to determine the exact start date for the pause, and explained why other people don’t understand how it works.
If you disagree with my interpretation of what Monckton means when he says
tell me what it does mean, and show how you would get a different result.
Bellman does not know the data well, or at all. He is paid to peddle the climate Communist party line that has funded Vlad’s war. IPCC indeed predicted 1.8 K warming by 2030 compared with 1850 (there was practically no trend from 1750-1850). And the trend from 1850-1990 was indeed about 0.5 K (HadCRUT4), so IPCC were indeed predicting 1.3 K over 40 years, or 0.34 K/decade, of which little more than half is occurring, even on the generous assumption that all the warming of recent decades was anthropogenic.
And I do not expect the rise in global warming to be monotonic. However, it is striking that the great Pacific shift of 1976 and the two or three very large el Ninos since then appear to have had a more noticeable and decisive influence on global temperature than our sins of emission.
It would really be best if Bellman and other climate Communists realized that their misconduct has contributed materially to the enrichment of Russia and consequently to the expansion of its military forces, now being deployed to massacre women and children in Ukraine. Time to back off and be honest.
“He is paid to peddle the climate Communist party line that has funded Vlad’s war.”
A grossly offensive ad hominem. I’d ask you again on what evidence you make that claim, but as we both know you have none as it’s not true.
I’ll leave it to others to draw their own conclusions as to what your incessant repetition of lie says about you and your arguments.
A c/p he clicks in every month. With the same lack of proof, or even any indication of it.
Channeling Joe McCarthy with his [In my hands, I hold this list of communists….].
blob checks in, hooray!
Mr. Carlo: bigoilbrandon has been very busy shutting down U.S. production, takes up alotta his “commenting” time.
righto—its a tough job but someone’s got to do it!
“…so IPCC were indeed predicting 1.3 K over 40 years, or 0.34 K/decade…”
And yet they failed to state that anywhere in the publication, instead stating a prediction of around 1°C by 2025.
Why do you think they did that? You keep insisting that this 1st report was made up to alarm people into taking action, yet you also insist they deliberately downplayed how much warming they were expecting. So why hide the 0.34K / decade warming rate in way that even you only noticed a few years ago? How was that meant to scare people into bringing about a new world order?
CMoB said: “IPCC indeed predicted 1.8 K warming by 2030 compared with 1850 (there was practically no trend from 1750-1850).”
Here is what IPCC FAR pg. xxiv actually says.
I posted the predictions from scenarios business-as-usual (A), B, C, and D down below. You can see for yourself that the IPCC did not predict 1.8 K of warming above the pre-industrial temperature by 2030 for the emission scenario that humans choose. Instead they predicted about 0.6 C from 1990 to 2020 of which about 0.6 C was observed.
Europe will wait a long time for a real spring, due to the polar vortex pattern in the lower stratosphere. Interestingly, an increase in the strength of the solar wind will cause this pattern to perpetuate.

Like Napoleon and Hitler, Putin’s retreat will be a cold one.
Where is he retreating?
Derg, how does one misunderstand “will be.”
I see that I now need to update a comment I made just two days ago under a separate article https://wattsupwiththat.com/2022/04/01/co2-emissions-are-at-an-all-time-high-un-admits-they-are-losing/ .
I do believe it bears repeating, with the noted updates:
Just
four weeks agotoday, Christopher Monckton posted an article on WUWT with the title The Pause Lengthens Again: No Global Warming for 7 Years56 Months . . .Moreover, Lord Monckton has this very apropos statement:
“The entire UAH record since December 1978 shows warming at 0.134 K decade–1, near-identical to the 0.138 K decade–1 since 1990, indicating very little of the acceleration that would occur if the ever-increasing global CO2 concentration and consequent anthropogenic forcing were exercising more than a small, harmless and net-beneficial effect.” . . .
To be as clear as I can about this: NONE of the IPCC-supported climate models predicted the 7+ year pause in global warming that Earth has been experiencing.
And yes, I agree completely with Lord Monckton’s comment about this simple data-based climate fact being “one of the best-kept secrets in what passes for ‘journalism’ these days”.
It will be fascinating to see how the IPCC addresses (errr, more likely just overlooks) this fact in its next Assessment Report (AR7).
“To be as clear as I can about this: NONE of the IPCC-supported climate models predicted the 7+ year pause in global warming that Earth has been experiencing.”
+1
It’s useful to look at the temperature data separated by the PDO switch in 2014.
https://woodfortrees.org/plot/uah6/from:1997/to/plot/uah6/from:1997/to:2014/trend/plot/uah6/from:2015/to/trend
Both pauses stand out clearly. The only warming over the past 25 years occurred during the year the PDO switched from cool to warm mode.
Do you recall how NOAA and NASA, along with RSS, quickly and easily eliminated the long recorded pause in temperature increases just in time for the Paris meet?
Gordon A. Dessler: “To be as clear as I can about this: NONE of the IPCC-supported climate models predicted the 7+ year pause in global warming that Earth has been experiencing.”
I downloaded the CMIP5 data from KNMI. Between 1979 and 2021 the members predicted that about 20% of the months would be included in a Monkton Pause lasting 7 years and 5 months. UAH showed about 25% such months. It’s not a perfect prediction, but it’s pretty good and decisively shows that IPCC-supported models predict lengthy pauses like the current one.
Ummm . . . 20 to 25% “of the months being included in a Monckton Pause lasting 7 years and 5 months” is NOT the same as stating that any of the CMIP5 models (as compared to data from either KNMI or UAH) predicted there would be 7 years and 5 months of consecutive zero change.
Yes, it’s nothing at all like a perfect prediction . . . or even a “pretty good” one when examined carefully and objectively.
Maybe I wasn’t clear. I used the EXACT same analysis technique on all of the CMIP5 members that CMoB used for UAH. My statement is of a *consecutive* zero change 7yr 5mon period. Don’t take my word for it. I encourage you and everyone else to download the data and prove this for your self.
Maybe I wasn’t clear enough. I am looking for any one of the CMIP5 members (i.e., climate models) to have predicted that the most recent 7 year 6 month period—from October 1, 2014 thru end-March 2022—would have essentially unchanging global-average tropical middle troposphere temperatures for that specific interval and only for that specific interval.
Such is not seen in the individual graphs of CMIP5 predictions (up to year 2019) as plotted in Figure 2 of https://wattsupwiththat.com/2022/03/11/climate-model-democracy/
I’d have to go back through and check. But even if a single member did that wouldn’t be useful since all the others didn’t. Remember CMIP5 models are not skillful enough to predict specific variations. They are only able to predict that variations like ENSO swings and the Monckton pauses are expected. They just aren’t useful in telling us exactly when they will occur. Part of that is due to the limitations in modeling and part is due to them being ran for a specific scenario that may differ significantly from the scenario that actually played out.
Hmmm . . . given all the caveats you list for the CMIP5 models, do you not find it disturbingly strange that the IPCC invests so much time and effort into them, and puts out so much propaganda based on them?
I’m no more or less disturbed with resources spent on CMIP5 than I am for resources spent researching the standard model of physics which we know is not perfect either. I can say the same thing for most other models in the various disciplines of science as well.
Seriously, you are equating the importance of CMIP-x modeling with the importance of understanding the physics that explains the universe and all that is in it?
Seriously???
Yes, this is what he does. He has posted this drivel previously. He also has some odd and esoteric ideas about heat transfer.
The 0LOT, 1LOT, 2LOT, 3LOT, Planck’s Law, Wein’s Displacement Law, Stefan-Boltzmann Law, Kirchhoff’s Law of Radiation, etc. are not odd and esoteric nor are they my ideas. I do refer to them quite frequently though.
I’m not making a comparison based on importance. I’m making a comparison based on effort and imperfection because you asked if me if the caveats (imperfections) of CMIP5 relative to the resources (effort) put into it is disturbing. All I am doing is defending the consistency of my position here by pointing out that I am not disturbed by the effort put into any model developed by science and which we know are not perfect either. This includes CMIP5, the standard model, and countless other imperfect models of reality. In fact, I’ll go one further and say that I support the development of all of these models and wish humanity would allocate more resources to the effort; not less. I am very passionate about the pursuit of science.
Nine years and 8 months of no global warming for Australia, 116 months.
http://www.geoffstuff.com/uah_australia_to_april_2022.jpg
Ten years and elven months for the USA, according to the Climate Reference Network, which is a network of state-of-the-art weather sensors located in pristine locations around the 48 stages and Alaska and Hawaii.
So, are comments with more than one link being blocked?
(When there are three or more links in a comment it goes to the moderator bin awaiting moderator action for approval there are none of yours in the bin at all) SUNMOD
Here is part 1.
NOAA SST-NorthAtlantic GlobalMonthlyTempSince1979 With37monthRunningAverage.gif (880×481) (climate4you.com)
I think the trigger is three. As in, “Three strikes you’re out!”
Here is part 2.
PDO MonthlyIndexSince1979 With37monthRunningAverage.gif (880×475) (climate4you.com)
Here is part 3.
bfly.gif (2150×1280) (nasa.gov)
Here is part 4.
How Popular Is Joe Biden? | FiveThirtyEight
The original comment reflected on the UN need to rattle the bones harder to overcome the declines in the oceans, the sky, and the Climate Crusades.
But then again, you repeat yourself.
Reference your post above at April 3, 2022 7:45 am.
There is benefit to be had in the virtue of patience.
The “break” will last.
To what extent, if anyone knows, are these pauses governed by the intermittent El Nino spikes?
As I showed above, the pauses are separated by the PDO switch in 2014. Both pauses were/are slow cooling periods. The +AMO keeps the PDO effect minimal. That is likely to change when the AMO finally goes negative in a few years.
Another question I have about the El Ninos is whether its long term effect on the earth’s heat balance is neutral; seems like it should be.
ENSO is simply tropical Pacific SST, for some arbitrary longitudes. Similar indices can be defined for other oceans (Atlantic, Indian) and longitudes. They will all show similar oscillatory patterns and trends, which should correlate with the global and other regional SST. It’s just that the variability and trends are stronger closer to the poles, and weaker closer to the equator.
So, various ENSO indices do correlate with the global temperature indices.
“Global temperature trends from 1901 to 2017” looks like recovery from the ‘Little Ice Age’.
Nor should it be overlooked that Holocene temperatures are declining long term.
“Global temperature trends from 1988 to 2017” looks like NOAA infilled, adjusted, using temperatures from up to 1,200km away as reference, homogenized, smoothed and biased to reinforce their climate agenda.
The 1998 and 2015/16 El Nino were particularly strong and were not balanced by strong La Nina.
The current continuing La Nina is starting to balance things out, and we should see the temperature gradually drop as they continue to be the more dominant index over the next several years.
I was in Iceland recently on a tour. The glaciers there are really retreating,esp. the “tongue” glaciers that ooze out of the main glacier mass. Global warming of course is to blame. I went to the website for the icelandic MET.
I just graphed date from weather stations in Reykjavik, the capitol, and Hael, a rural inland area. Hael seems to have stopped recording 10 years ago, but that doesn’t change the interpretation.
Things are getting bad. It is as hot there now as it was in 1940.
Major bummer for those guys. Maybe they can all move to North Greenland.
We flew back from Iceland to D.C. across the southern tip of Iceland. It was completely ice and snow, March 7th. I can’t attach a jpg on this comment, apparently, but it had zero terrain not covered by ice or know. Rivers frozen. Icebergs all over the eastern coast.
As bad as 1940?
Climate scientists will need some adjusting as we can’t approach things that happened that far in the past.
Hasn’t griff been assuring us that history began in 1979?
It must be noted that the HadCRUT4 data itself should be suspected. Many remember that the Depression heat waves in the ’30s resulted in thermometer readings that were not exceeded until at least the 90s, and maybe not at all. They were certainly higher than those in the ’40s as shown in the chart. The difference must be in the ‘homogenization’ of the data, which certainly makes it suspect in my opinion. If I can’t believe some of the data, I can’t believe any of it.
Here is what the global average temperature looks like with both raw (blue) and adjusted (red) timeseries included. [1].
What a load of horse shit
He never tires of showing off this gar-bage.
Hockey stick away
As Pat said…A load of horseshit.
Look at the 1958 to 2001 period with actual lower trop measurements instead of the highly corrupted crap you keep posting.
During that time, co2 increased by around 50ppm
That’s HadAT2 which can be downloaded here. From 1979/01 to 2012/12 the warming trend from UAH is +0.113 C/decade and from HadAT2 is +0.157 C/decade. It might be interesting to know that RSS is +0.194 C/decade. Technically RSS is a better match to HadAT2 than UAH at least according to the data you present here. That warming rate is HIGHER than the warming rate shown in the graph I posted so I’m not sure what point you are trying to make here.
”I’m not sure what point you are trying to make here.”
That it does not show 2001 as being <> 0.3 C higher that 1960 as yours does. In other words, there is no hockey stick rise. It’s made up.
Mike said: “That it does not show 2001 as being <> 0.3 C higher that 1960 as yours does.”
Yes, it does. Taking the 850mb height (the closest to the surface available).
1960: -0.1 C
2001: +0.3 C
That is a difference of +0.4 C.
BTW…here is the link. I forgot to include it above.
Hey, thanks for the graph, bdgwx!
It clearly shows a decline/”hiatus” in global average temperature trend from about 1942 to about 1978, a continuous interval of some 36 years which is long enough to meet NOAA’s and NASA’s definition of “climate”.
I await your reason for why atmospheric CO2 decided to just stop being the “control knob” (aka predominate forcing) for global warming during this time. Maybe it just got tired?
One thing we do know for sure . . . this interval convinced a lot of scientists at the time that Earth was facing hundreds of years of future global cooling, perhaps even a coming “ice age”.
GD said: “I await your reason for why atmospheric CO2 decided to just stop being the “control knob””
The abundance of evidence does not suggest that CO2 is the control knob. It is only a control knob. There are many factors that modulate the global average temperature. CO2 is but one among many. CO2 has never stopped being a control knob.
GD said: “Maybe it just got tired?”
Hardly. The laws of physics don’t work like that. What happens is that different factors have different magnitudes that change through time. It just so happens that aerosol forcing increased significantly from 1945 to 1980. The increase was so significant that the negative forcing actually more than offset the increase in positive forcing from CO2.
GD said: “One thing we do know for sure . . . this interval convinced a lot of scientists at the time that Earth was facing hundreds of years of future global cooling, perhaps even a coming “ice age”.”
Yeah, there were certainly some scientists like Reid Bryson who thought aerosol forcing would continue to dominate over GHG forcing. But I don’t know if I would consider it to a lot of scientists [1].
So you are a sceptic about all the unreliable unrenewable energy being installed to limit CO2? Why is climate science not searching for the dominant factor is temperature increase? Maybe CO2 is considered the main control knob?
Global cooling was the meme-du-jour from the early 1970’s through the early ’80s.
For a real laugh, the “climate change” craziness at that time even went so far as to produce the alarmist video In Search of the Coming Ice Age (1978), featuring Leonard Nimoy, the actor then well-known for having played the role of Mr. Spock in the original TV series Star Trek.
For real hoot, you can revisit that 22 minute-long video at this link:
https://www.youtube.com/watch?v=7tAYXQPWdC0
Funny thing is that video talks about a lot of scientists.
Is Leonard Nimoy’s in search of series regarded as an authoritative science program?
From the list of episodes it seems like a typical 70s TV scientific woo. In search of UFOs, Atlantis, Ancient Astronauts etc.
I guess you completely missed the fact that Nimoy was referring to the work and stated conclusions of scientists (including their published papers) of his time.
But your comment invites me to ask you, in turn: “Is the PBS NOVA series on TV/on-line regarded as an authoritative science program? After all, NOVA presented a program on
UFOsUnidentified Aerial Phenomena (see: https://www.youtube.com/watch?v=HQoKcK1hvF4 ).🙂
No idea, never seen NOVA. My general opinion of most TV science programs isn’t very good.
I’m sure they did talk to experts, just as they would for all the other programs. But did they talk to any scientist who disagreed we were heading for an ice age? Did they mention those who believed we were more likely to see warming due to growing greenhouse gasses?
Now watched it, and not impressed. Lots of some scientists say something could happen at some unspecified period in the future. Only concrete figure give is when they talk about the drop in temperature in one location and say if it continued at that rate we could see an ice age within the next 200 years.
All this is juxtaposed with scenes from the cold winter in the USA and talk about what would happen if we had an ice age, all with lots of sinister sci-fi music. But nowhere is there a scientist making any real prediction. The closest is one talking about ice ages being caused by changes in earths orbit, who says that this means we may already be heading into the next ice age, but again with no time frame mentioned.
The few seconds of Stephen Schneider at the end seem reveling. First he says we should be cautious about doing anything to stop an ice age as the cure may be worse than the problem. Then he finishes up talking about the danger climate change (no mention of warming or cooling).
Looking at the time line of Schneider, 4 years before this program he’d retracted his previous paper predicting cooling. I think by the time of this program he was warning both about the dangers of warming and cooling.
“. . . all with lots of sinister sci-fi music.”
I’m still ROTFLMAO over that comment!
Did Spock present his research for publication and peer review?
In case you missed this obvious fact, “Spock” was a paid actor/narrator for the referenced video clip.
There is no reason whatsoever to assert that he was a “climate scientist” or needed to have have authored “research publications”—let alone those being peer reviewed—in order to be hired for such service.
Your attempt at deflection/ad hominem attack is, consequently, a big FAIL.
My point is that I do not get my science from paid actors and the media. I get my science from peer reviewed published research.
And I’m not the one who brought up Spock in this conversation. That was you.
And I’ve never resorted to ad-hominem attacks or personal attacks of any kind.
Yet you post: “And I’ve never resorted to ad-hominem attacks or personal attacks of any kind.” just a day after posting “Did Spock present his research for publication and peer review?”
A rose by any other name . . .
I’m not the one that brought Spock into the discussion. And I’m certainly not attacking him. I like Leonard Nimoy and I especially the character he plays in Star Trek. I’m a Star Trek fan myself. I’ve watched it my whole life. But I’m not going to get my science from him.
“But I’m not going to get my science from him (Spock)”
Good idea – that definitely wouldn’t be logical Captain…
You posted: “There are many factors that modulate the global average temperature. CO2 is but one among many.”
Really? Then why the absolute paranoia by the UN-IPCC, the current US President, and so very many bureaucrats (AOC, Nancy Pelosi, John Kerry, Elizabeth Warren, and Bernie Sanders to mention just a few) to limit mankind’s emissions of CO2 by limiting the use of fossil fuels?
Oh, and if anyone actually believes the reason that global warming ceased from 1942 thru 1978 was due to aerosol emissions from humans, they should publish a paper on this ASAP, for it will certainly be in the top runners for a Noble Prize . . . offering all of mankind, as it were, the most straightforward solution to ending global warming while still allowing the use of fossil fuels.
I have no idea why people are paranoid. I’m just saying the evidence unequivocally says that far more than just CO2 modulates the UAH TLT temperature.
They did publish their findings regarding aerosols. That’s how we know aerosols are a significant factor. It’s nothing new or shocking. It has been known for decades. And yes, we can mitigate global warming by pumping more aerosols into the atmosphere.
If you truly believe that, then you must also admit that the IPCC and other organizations that promote an existential risk with only rising CO2 levels are full of balogna.
You must also explain how much of a factor that CO2 is. You keep arguing that those of us who show that temperatures have been maladjusted to show that CO2 levels are causing the rise in temperature have it wrong.
You can’t support both sides. It is one or the other. Either CO2 is causing an existential threat to mankind in the form of higher temperatures or it is not. Your choice?
Can you tell me the report, section, and page number where the IPCC says “CO2 is causing an existential threat to mankind”?
The scenarios used in the IPCC report are based mostly on all GHGs other than CO2 going down (e.g. NO2, SO2, and CO) going *down* in the future. CO2 is the only one shown as going up. Conclusion, the IPCC sees CO2 as the control knob and that is what gets fed into the climate models.
See: Rafaj P, Rao S, Klimont Z, Kolp P, Schöpp W (2010) Emissions of air pollutants implied by global long-term energy scenarios, IIASA Interim Report, IR-10-019. IIASA, Laxenburg, 32
“Example results are provided for the “middle-of-the-road” B2 baseline scenario. Under the B2 scenario global emissions of sulfur, nitrogen oxides and carbon monoxide decline continuously between 2000 and 2100, “
Which report, section, and page from the IPCC are you looking at?
I looked at Rafaj et al. 2010. I don’t see anywhere that CO2 is described as “an existential threat to mankind”.
Where do you think the following references obtained their information?
https://www.sciencedirect.com/science/article/pii/B9780128229286000058
https://yaleclimateconnections.org/2021/11/emergency-crisis-existential-threat-the-evolving-lingo-of-climate-change/
https://www.defense.gov/News/News-Stories/Article/Article/2582051/defense-secretary-calls-climate-change-an-existential-threat/
The first reference is from Kumar, Nagar, and Anand.
The second reference is from Bob Henson.
The third reference is from Lloyd Austin.
I’ll ask the question again…which report, section, and page from the IPCC are you looking at?
Since bdgwx asked:
The IPCC clearly associates increasing global warming (aka “climate change”) with increasing atmospheric CO2 concentration, and in turn they clearly warn that “climate change” is leading to an ever increasing rise in global sea level.
So, in the IPCC’s Climate Change 2022, Impacts, Adaptation and Vulnerability: Summary for Policymakers on Page 17, Paragraph B.4.5, there are these verbatim statements (my underlining emphasis added):
“Climate change risks to cities, settlements and key infrastructure will rise rapidly in the mid- and long-term with further global warming, especially in places already exposed to high temperatures, along coastlines, or with high vulnerabilities (high confidence). . . . Sea level rise poses an existential threat for some Small Islands and some low-lying
coasts (medium confidence).”
Similarly, in the IPCC’s October 2021 WGII Sixth Assessment Report, Technical Summary, Final Draft there is this verbatim statement on Page TS-68, Paragraph TS.D.7.1 (my underlining emphasis added):
“As the scale and pace of sea-level rise accelerates beyond 2050, long-term adjustments may in some locations be beyond the limits of current adaptation options, and for some species and some locations could be an existential risk within the 21st century (medium confidence).”
Finally, in the IPCC’s AR6 WGII Final Draft Full Report titled Climate Change 2022 Impacts, Adaptation and Vulnerability (3676 pages long including its own Summary for Policymakers) there are these verbatim statements (my underlining emphasis added):
Page 4-128, Paragraph 4.7.4 Limits to Adaptation and Loss and Damage: “Taking action towards adaptation critically determines the outcomes and impacts of climate change processes across space and time. Where efforts to reduce risk do not effectively occur, losses and damages occur as a consequence of climate change, some of which can have irreversible and existential effects . . .”
Page 8-47, Paragraph 8.3.4.2 Non-economic (e.g., mobility, wellbeing): “Climate change loss and damage presents an existential threat to some (Boyd et al., 2017).
Page 9-17, Paragraph 9.1.6 Loss and Damage from Climate Change: “Assessment of impacts, vulnerability, risks and adaptation highlights climate change is leading to irreversible and existential impacts across Africa which breach current and projected adaptation limits (Table 9.1)”
Page 14-77, Paragraph 14.6.3 Cumulative risk, tipping points, thresholds and limits: “Under low mitigation scenarios, compounding risks and higher carbon emission scenarios increase the potential that amplifying feedback loops and fatal synergies across sectors could lead to existential threats to the socio-ecological systems of North America (medium confidence).”
Page 17-33, subparagraph titled “The existential dimension”:
“There has been less and often implicit discussion on the existential dimension of climate-related risk as pertaining to L&D (medium confidence).McNamara and Jackson (2019) infer an existential dimension from notions of inevitability and irreversibility associated with migration and relocation of communities (Eckersley, 2015; Mayer, 2017; McNamara et al., 2018), socio-cultural impacts linked to glacial retreat (Jurt et al., 2015), as well as adverse psychological and intersubjective effects (Herington, 2017; Adams et al., 2021). Many SIDS in their NDCs refer to sea level rise in particular posing existential threats, and call for enhanced international support for L&D (Thomas and Benjamin, 2017).”
Page CCP2-25, under paragraph FAQ CCP2.1: “For open coasts, settlements on low-lying small island states and the Arctic are especially vulnerable to climate change, and sea level rise impacts in particular, well before 2100. While the economic risks may not compare to the scale of those faced in coastal megacities with high per capita GDP, the existential risks to some nations and an array of distinctive livelihoods, cultural heritage, and ways-of-life in these settlements are great, even with modest sea level rise.”
BTW, for anyone wanting to verify the veracity of my above-quoted text extracts, the first two documents noted above are available as no-cost PDF downloads at https://www.ipcc.ch/report/ar6/wg2/
and the last document, the full AR6 report, is available as a no-cost PDF download at https://report.ipcc.ch/ar6wg2/pdf/IPCC_AR6_WGII_FinalDraft_FullReport.pdf
Do the above meet bdgwx’s request to show where the IPCC states specifically “CO2 is causing an existential threat to mankind”? Obviously, no, not directly. Can they be taken en masse by any reasoning person to meet the intent of that statement? Yes, with specific reference to report, section, and page number, as requested.
That’s my point. The IPCC does not say that humanity is going to cease to exist. There’s already enough alarmism to go around so why exaggerate? Why not just say the IPCC says sea level rise is an existential threat to low lying islands, nations, cultures, socio-economic systems, etc instead of extrapolating out to humanity will cease to exist?
“The IPCC does not say that humanity is going to cease to exist.”
Hey, everybody, let’s jump on the bdgwx merry-go-round and just forget about what the word “existential” means. Gotta cycle back to that starting point, don’t ya know!
Can you show me where the IPCC thinks humanity will cease to exist before 2100?
I showed you this.
https://yaleclimateconnections.org/2021/11/emergency-crisis-existential-threat-the-evolving-lingo-of-climate-change/
The IPCC is an organization within the United Nations. From the IPCC’s web page:
https://www.ipcc.ch/about/
If the United Nations Secretary General uses the term “existential threat”, then that is also the IPCC speaking through him.
Show us where the IPCC has spoken out against the use of the term “existential threat”. In today’s world of instant communications, if you don’t speak out against using that term, then you are tacitly approving it use.
That quote is from Bob Henson; not the IPCC.
You need to increase your reading skills a bit.
From: https://news.un.org/en/story/2018/09/1018852
From: https://sdg.iisd.org/news/un-secretary-general-urges-leadership-to-face-direct-existential-threat-of-climate-change/
Jim Gorman,
Excellent post!
Quite easily, thanks for asking, AGAIN.
Please start by consulting my extensive post above dated April 6, 2022 2:05 pm wherein I provided specific quotes for IPCC publications, per you earlier posted request for such.
Note that I posted the following verbatim extract from the IPCC’s AR6 WGII Final Draft Full Report titled Climate Change 2022 Impacts, Adaptation and Vulnerability, Page 4-128, Paragraph 4.7.4 Limits to Adaptation and Loss and Damage (my underlining emphasis added):
“Taking action towards adaptation critically determines the outcomes and impacts of climate change processes across space and time. Where efforts to reduce risk do not effectively occur, losses and damages occur as a consequence of climate change, some of which can have irreversible and existential effects . . .”
Now, the IPCC has long maintained the world is NOT making effective efforts to reduce risk of “climate change”. In addition, this specific statement extracted from the noted IPCC report does not limit itself to any one region of Earth or to any specific time. One can thus logically conclude the IPCC is stating that climate change represents an existential threat to humanity over some unspecified time in the future.
And, sorry, I will not entertain debate over your recent modification of your original posted request (April 6, 2022 7:19 am to Jim Gorman):
“Can you tell me the report, section, and page number where the IPCC says ‘CO2 is causing an existential threat to mankind’ “?
to now be limited to “before 2100”. Where did that come from?
QED
That is not a logical conclusion. Just because low lying islands, cultures, nations, etc. may cease to exists does not mean that humans will cease to exist. That kind of extrapolation is alarmist.
That is not a logical conclusion . . . please show me an example of where humans (aka humanity) exists over time outside of “nations”, notwistanding the fact that national boundaries may be in dispute.
“Why not just say the IPCC says sea level rise is an existential threat to low lying islands, nations, cultures, socio-economic systems, etc instead of extrapolating out to humanity will cease to exist?”
Because the verbatim extracts from IPCC reports that I summarized in my above post state that existential threats (to humanity) exists:
— from “climate change”, which is not limited to sea level rise
— “across Africa”, the preponderance of area of which would not be affected by sea level rise
— “to the socio-ecological systems of North America“, the preponderance of which would not be affected by sea level rise
— for “the Arctic”, which I take to mean all land, floating sea ice, and open ocean water within the Arctic Circle, much of which would not be affected by sea level rise.
Gordon Dressler said: “Because the verbatim extracts from IPCC reports that I summarized in my above post state that existential threats (to humanity) exists:”
Where does the IPCC say that humans will cease to exist?
I’m not asking about existential threats to islands, cultures, nations, etc. I’m asking about the existential threat to humanity itself.
Due to the word games you insist on playing, it’s hopeless.
From the transcript of a speech by the Secretary General at; https://www.un.org/press/en/2022/sgsm21115.doc.htm
“Insufficient action on the existential climate threat. ”
Please note it does not say just in a few places.
Love it! Would politicians and media be hyping “existential” risk if the IPCC didn’t support it?
Publishing “findings regarding aerosols” is far different from proving aerosols were the factor overriding the claim that CO2 is the predominate “control knob” controlling global warming (as advanced by the IPCC and others).
Beyond this, AFAIK, no reputable scientist has published, at any time within the last seven years, an article or scientific paper asserting that anthropogenic emissions of aerosols has been the cause for the 7 years 6 months, currently on-going, pause in global warming, as documented by Christopher Monkton in his article above.
During these last 7 years 6 month, there is no question that there have been significant increases in global anthropogenic greenhouse gases, as clearly illustrated in the graph presented at
https://wattsupwiththat.com/2022/04/06/reality-cannot-penetrate-into-the-fantasy-world-of-climate-campaigners/ .
So, since we can effectively rule out anthropogenic emissions of aerosols as the cause of the current pause in global warming, there must be another, yet-to-be-defined “control knob” that can override the asserted CO2 “control knob”.
Either that, or any claim that CO2 is the “control knob” (i.e., the predominate forcing factor) determining global warming is just a blivet*.
*Specifically, I refer here to the very first definition for “blivet” as given at this website: https://encyclopedia2.thefreedictionary.com/blivet
GD said: “there must be another, yet-to-be-defined “control knob” that can override the asserted CO2 “control knob”.”
That’s what I’m trying to say. There are lots of control knobs that can more than offset the CO2 control knob especially on the shorter monthly and yearly timescales. This is why there is a lot of variation on those timescales with many ups, downs, and pauses even though the long term trend is upward.
How about offering us a more complete listing of those “control knobs” that you assert can override CO2 as forcing factors for global warming?
So far the list is:
— aerosols (well, at least for 1942 thru 1978)
Not override. Offset. The existence of another factor does not turn off the others. ENSO would be another huge factor that can easily more than offset CO2 forcing on the UAH TLT layer on monthly and yearly timescales. Even at 1 C per W/m2 the CO2 forcing contributes only 0.003 C/month. El Nino and La Nina alone can contribute more than +0.5 C and -0.5 C respectively. That easily dwarfs the CO2 contribution on monthly time scales.
Then why isn’t the IPCC and the rest of the climate clique focusing on those other control knobs? They would seem to be more important than CO2. And why does the IPCC scenarios say that so many of these “other factors” are decreasing and will continue to decrease? Is their decrease not going to continue overriding CO2 impacts if they are doing such an override today?
Excellent questions . . . but don’t expect answers from bdgwx.
I’m still waiting for his listing of all control knobs he asserts can
overrideoffset the predominate CO2 control knob as asserted by the UN-IPCC, the current US President, and so very many bureaucrats (AOC, Nancy Pelosi, John Kerry, Elizabeth Warren, and Bernie Sanders, to mention just a few).So far, he has only offered up the ENSO as an
overridingoffsetting control knob, but without providing any data that shows either phase of a ENSO correlates with dips or pauses in global warming since 1980.The problem with the ENSO
overrideoffset is:“El Niño and La Niña are opposite phases of a natural climate pattern across the tropical Pacific Ocean that swings back and forth every 3-7 years on average. Together, they are called ENSO (pronounced “en-so”), which is short for El Niño-Southern Oscillation”
(ref: https://www.climate.gov/news-features/understanding-climate/el-ni%C3%B1o-and-la-ni%C3%B1a-frequently-asked-questions ; my bold emphasis added)
So is it the El Niño phase or the La Niña phase that
overrodeoffset global warming for the last 7 years 6 months? . . . or was it instead an all together different, yet-to-declared-by-bdgwx “control knob”?Inquiring minds would like to know.
GD said: “So far, he has only offered up the ENSO as an
overridingoffsetting control knob”I’m certainly not knowledge enough to provide a complete list. I can only offer up those that I know. They would include all latent fluxes, sensible fluxes, and radiation fluxes. Each of those have numerous process that work on monthly timescales. Examples might include advective process, convective process, Rossby waves, ENSO phases, PDO phases, AMO phases, NAO phases, tropical cyclone activity, dust, wildfire activity, volcanic activity, biosphere activity, and the list goes on and on.
GD said: ” but without providing any data that shows either phase of a ENSO”
You can see the ENSO phases via the MEI or ONI which you can correlate with UAH TLT.
GD said: “So is it the El Niño phase or the La Niña phase that
overrodeoffset global warming for the last 7 years 6 months?”They both modulate UAH TLT. El Nino increases the heat flux from the ocean to the atmosphere. La Nina decreases the heat flux from the ocean to the atmosphere.
You are dancing around the main issue. Does the IPCC and climate scientists coalesce around the fact that CO2 is the control knob for temperature growth and the need for eliminating human emissions of CO2?
You are trying to fence sit. We are at the tipping point where you must choose because of the existential risk to Western economies from net zero.
Do you believe the IPCC and climate science consensus concerning CO2 emissions or not ?
JG said: “You are dancing around the main issue. Does the IPCC and climate scientists coalesce around the fact that CO2 is the control knob for temperature growth and the need for eliminating human emissions of CO2?”
No. They say it is a control knob. They do also say that post WWII it is the control knob with the highest positive forcing while aerosols have the highest negative forcing on a decadal timescale.
JG said: “Do you believe the IPCC and climate science consensus concerning CO2 emissions or not?”
As of right now…yes.
Here’s what the global air temperature looked like as GISS temporal-connections adjusted past temperatures.
“It must be noted that the HadCRUT4 data itself should be suspected.”
Yes, that definitely should be noted every time it is used.
HadCRUT4 is science fiction.
Comparing something to HadCRUT4 or any of the other bogus, bastardized computer-generated “temperature” records is a waste of time and money.
If the temperature chart doesn’t show the Early Twentieth Century to be just as warm as it is today, then it is a bogus, bastardized, computer-generated, instrument-era Hockey Stick chart. They are worthless to good climate science. They are worth a lot to climate change charlatans.
People need to be reminded that they are looking at a lie.
Still, a few more years before the climate establishment starts to get worried.
Oh I’m sorry, did I say worried? I meant “relieved, because they’re literally not just pretending about the threat posed by global warming, and hold their own credibility and employability as but trinkets next to the very welfare of the race of man.”
As the temperature activist Andy Skuce once remarked to me, it’s not as if anyone sane wants The Science™ to be true! My droll ingratitude to him for vouchsafing such wisdom is something I’ll regret til the day [The Science™ comes true and] I die.
Brad, how dare you! I’ve been assured by people, including David Appell and Willard, that the CliSciFi establishment is noble and adheres to the highest scientific standards.
Where have you been?
The solar wind magnetic field in the 25th solar cycle is still weaker than in the previous cycles.
This morning I received an email titled “Against despare” from the New York Times expressing hope …
I would include a link but it came in as an email with no specific NYT link … this may be close enough.
https://www.nytimes.com/2022/04/03/briefing/climate-optimism-ukraine-week-ahead.html?searchResultPosition=2
As quoted by you from the NYT email:
“ ‘Fear is useful to wake us up and make us pay attention,’ Katharine Hayhoe, a climate scientist at Texas Tech University, told me.”
Which naturally demands this reply:
“The whole aim of practical politics is to keep the populace alarmed (and hence clamorous to be led to safety) by menacing it with an endless series of hobgoblins, all of them imaginary.”
—H.L. Mencken
When you start to see things like maybe we are on right path because change may be moderating, you are only seeing the start of CYA. The “true believers” will never state this. Only the ones in climate science that are in it for the money will want to protect their ability to obtain money grants in the future. They are the ones who will be “on the fence” so they can always claim they just moderate in their view of science.