
In his annual State of the Climate report, Ole Humlum, emeritus professor at the University of Oslo, examined detailed patterns in temperature changes in the atmosphere and oceans together with trends in climate impacts. Many of these show no significant trends and suggest that poorly understood natural cycles are involved.
And while the report finds gentle warming, there is no evidence of dramatic changes, with snow cover stable, sea ice levels recovering, and no change in storm activity.
By: Admin – Climate Depot
April 18, 2022 8:35 AM
A systematic review of climate trends and observational data by an eminent climate scientist has found no evidence to support the claim of a climate crisis.

In his annual State of the Climate report, Ole Humlum, emeritus professor at the University of Oslo, examined detailed patterns in temperature changes in the atmosphere and oceans together with trends in climate impacts. Many of these show no significant trends and suggest that poorly understood natural cycles are involved.
And while the report finds gentle warming, there is no evidence of dramatic changes, with snow cover stable, sea ice levels recovering, and no change in storm activity.
Professor Humlum said:
“A year ago, I warned that there was great risk in using computer modelling and immature science to make extraordinary claims. The empirical observations I have reviewed show very gentle warming and no evidence of a climate crisis.”
GWPF director, Dr Benny Peiser said:
“It’s extraordinary that anyone should think there is a climate crisis. Year after year our annual assessment of climate trends document just how little has been changing in the last 30 years. The habitual climate alarmism is mainly driven by scientists’ computer modelling rather than observational evidence.”
Ole Humlum: State of the Climate 2021 (pdf)
Excerpts:
Sea level
Global sea level is monitored by satellite altimetry and by direct measurement using tide gauges. While the satellite record suggests a global sea-level rise of about 3.3mm per year or more, data from tide gauges all over the world suggest a stable rise of 1–2mm per year. The tide gauges indicate no recent acceleration (or
deceleration) of sea-level rise. The marked difference (a ratio of about 1:2) between the two datasets has no universally accepted explanation, but it is known that the satellite observations face complications in areas near the coast (see, for example, Vignudelli et al. 2019). Whatever the truth, the tide-gauge data are more relevant for local coastal planning purposes.
Sea ice
In 2021, global sea-ice cover remained well below the average for the satellite era, but is now increasing. At the end of 2016, it reached a marked minimum, at least partly caused by the operation of two different natural variation patterns, affecting sea ice in the Northern and the Southern Hemisphere, respectively. These
variations had simultaneous minima in 2016. The trend towards stable or higher ice extent at both poles probably began in 2018, and has since strengthened. The marked Antarctic 2016 sea-ice reduction was the result of unusual wind conditions.
Snow cover
Variations in global snow cover are mainly caused by changes in the Northern Hemisphere, where all the major land areas are located. Southern Hemisphere snow is mainly found in the Antarctic, and cover is therefore relatively stable. The Northern Hemisphere average snow cover has been stable since the onset of satellite observations, although local and regional interannual variations may be large. Since 1979, Northern Hemisphere snow cover in autumn has been slightly increasing, the mid-winter cover is basically stable, and the spring cover is slightly decreasing. In 2021, the Northern Hemisphere seasonal snow cover was close to the 1972–2020 average.
Storms and hurricanes
The most recent data on global tropical storm and hurricane accumulated cyclone energy (ACE) is well within the range observed since 1970. In fact, the ACE data is highly variable over time, with a significant 3.6-year variation, but without any clear trend towards higher or lower values. The number of hurricanes making landfall in the continental United States remains within the range for the entire observation period since 1851.
#
““It’s extraordinary that anyone should think there is a climate crisis. Year after year our annual assessment of climate trends document just how little has been changing in the last 30 years. The habitual climate alarmism is mainly driven by scientists’ computer modelling rather than observational evidence.”
I suggest bearing in mind that correlation is not causation, professor.
The following comment explains just how out of touch with reality climate modelers are :-
“People underestimate the power of models. Observational evidence is not very useful” – John Mitchell, Chief Research Scientist British MET – the man should be fired – how unscientific can you get ! He is saying that the models are right and the observed data is wrong – this kind of addle brained thinking is endemic in the warmist camp. Since when in science did “observed data” become “not very useful” and trumped by model generated data – I get angry at even having to write this.
If the Met Bureau tells you its sunny outside and you find it’s actually pouring with rain – then you are clearly mistaken.
Observational evidence is not very useful to promote hysteria and steal money is what he meant.
Yes, I suggest it is borderline ludicrous to think that multitudes of people are actually alarmed by those models. (And, suspect relatively few promoting “climate alarmism” are either.)
My friend Joe D’Aleo, a world-class meteorologist in terms of his correct predictive track record, said to me a few years ago:
“These people (climate alarmist modelers) live in a virtual world. They think their models are more accurate than observed reality!”
My observations:
Viewed from the standpoint of the Scientific Method, I suggest that this bizarre dismissal of observed realty in favor of (typically inaccurate) climate computer models is a form of mental illness termed “psychosis, a loss of contact with reality” – call it “Climate Modelers’ Syndrome”.
This bizarre Climate Modelers’ Syndrome is surprisingly commonplace. As with all other such very-scary Global Warming (CAGW) and Climate Change fantasies, being popular does not make it correct – it is false.
“This bizarre Climate Modelers’ Syndrome is surprisingly commonplace. As with all other such very-scary Global Warming (CAGW) and Climate Change fantasies, being popular does not make it correct – it is false.”
What I have noticed is that those models are not currently being (publicly) stressed by the alarmists trying to keep the alarmism going. They are being stressed by their opponents (like on this site). They have become a liability, it seems to me, and for very good reasons.
Now, what is going through the minds of alarmist scientists I cannot know. Maybe they are still very much alarmed by what those models show, but unless the models themselves are being used to stoke alarmism beyond those scientist’s minds, I don’t see how they could be “driving” alarmism. (The causal link is broken, so to speak.)
What I see out of the alarmism stokers now is endless focusing on extreme weather events, fires, record breaking high temps, melting ice somewhere, etc., and claims (made or implied) that these are indicators that we need to “take climate action” right away quick, and that those who suggest otherwise are blind to what we can all “see” happening.
He knows . . . trust me . . . he knows!
Along the lines of the usual fallacious reasoning of all lefty warmistas– the post hoc ergo propter hoc belief: Tuesday follows Monday, therefore Monday caused Tuesday.
Respectfully, what is your point, Mr. Larson? Professor Humlum, the only professor you might plausibly be addressing, clearly understands the concept you suggest he bear in mind (See Humlum’s numerous publications, including this one). Thus, ???
The AGW gang has been bellowing (essentially) “Correlation! Correlation! Correlation! After, therefore, because of!” for DECADES, now.
Professor Humlum is one of the many science realists asserting: “Correlation is not causation.”
My point is that it does not seem particularly logical, to me, to assume that “habitual climate alarmism is mainly driven by scientists’ computer modelling rather than observational evidence.”
“The AGW gang has been bellowing (essentially) “Correlation! Correlation! Correlation! After, therefore, because of!” for DECADES, now.”
I think you have pointed out a far more likely causal mechanism there ; )
Oh. I kinda see the two mechanisms as logically linked.
Well, anyway, thank you for responding (a relatively rare thing around here 🙂 ).
Take care, out there in the ethersphere.
Your ally for data-driven science,
Janice
🙂
“Oh. I kinda see the two mechanisms as logically linked.”
(I believe most people here do, that’s why I pulled the correlation is not causation alarm ; )
Is severe weather also “logically linked”? Wild fires? Migration? Sea level rise? ?
After all, there’s been bellowing (essentially) “Correlation! Correlation! Correlation! After, therefore, because of!” for decades about those potential causal mechanisms.
I saw something rather interesting recently.
There was an article here about Mr. Mann, and his being “triggered” by Fox News playing on a monitor in the exercise area at some hotel.
I also saw videos on a couple of YouTube channels about the same incident. Neither of those posters seemed to recognize him at all. He was just spoken of as some “woke” professor, beclowning himself on the interwebs.
I scanned the comments and saw no one say word one about him being anyone notable. Just some now typical nutty self-important college professor, getting ridiculously bent out of shape for no good reason.
This is nonsense from a political activist climate denialist. Isn’t it?
Griff, but what do you think about the scientific observations he presents?
Please don’t feed the trolls.
I suggest griff is effectively revealing his level of dishonesty (or spectacular gullibility) when he speaks of a scientist (or anyone at all) denying climate. Why would you ask someone so dishonest (or spectacularly gullible ; ) what he thinks about anything? Why would you expect him to give a reasonable response?
I live in Australia, the land of severe droughts, often followed by bushfires and flooding rains. Late 2019 into 2020 bushfires following a long dry drought and then floods.
By February 2022 more floods and now in late April still a lot of rain and some flooding.
As with past history since colonisation in January, 1788.
And with the last major change of climate to drier from around 130,000 years ago with rainforests replaced with eucalypts that tolerate dry conditions today and only 3 per cent of rainforest remaining.
And of course since the Little Ice Age recovery a gradual warming again underway.
Situation normal for this climate zone.
I live on the Mid Coast NSW coastal plain and between a tidal lake with many islands and some rivers flowing into the lake, and the ocean. The original landholding covered a much larger area and was purchased in the late 1800s.
There has been little difference in highest tides level to present day.
Even wise aboriginal planners say you need to burn the bush! 😮
https://wattsupwiththat.com/2020/01/13/the-bush-needs-to-burn-climate-obsessed-greens-ignoring-indigenous-wisdom/
Absolutely. Eucalyptus forests drop litter at a rate of 8 tonnes/hectare every year, but only 29% of this decomposes annually. So there is a rapid buildup of forest litter to a point where once a bushfire starts, it’s impossible to stop. Australia needs to cool burn more than 10% of its forests every year, but the two main states, NSW and Victoria, burn less than 2% annually.
The Southern Snowy Mountains high country (high for Australia) was used by early colonial settlers for cattle grazing after they found grasslands perfect for summer grazing.
The grasslands were maintained by Indigenous seasonal burning, areas burnt in a patch by patch fashion every couple of years resulting in major bushfires being almost eliminated by the controlled and much cooler bushfires that enable wildlife to escape from and encouraging the growth of new grasses.
The settlers followed the Indigenous tradition and burnt areas as they left before winter.
In recent times grazing has been banned and a lack of land maintenance has resulted in thickening bushland and even blackberry bushes tangling with long grass and weeds, perfect fuel for wild fires my friends who ride Horses in the Victoria high country tell me, and they are Cattlemen’s Association members and Country Fire Authority volunteers.
Are you a Holocaust denier?
Is that how the game is played 🤔
Haha, the name caller is all upset coz he got called names. Too funny.
No, griff, it is a paper by someone who has looked at the records and reported what he found. Read the whole paper.
“This is nonsense from a political activist climate denialist. Isn’t it?” <—This is nonsense from a political activist climate denialist. Isn’t it?
Are you just lazy brat? If so, I’m very disappointed in you. Why can’t you do better than ad hominem and produce some facts. Sometimes you manage to say true things, get with it!
No, Griff mate.
Unless you are able to refute a single sentence of the report
No? Thought not
No, this is an antidote to it.
Talking about nonsense, why is it that Warmistas still cling to the CAGW theory even after its
signature tropopausal warming can’t be found anywhere, including Trenberth’s lame dog-ate-my-
homework deep ocean excuse he used to explain the Pause? 😮 😮 😮
If there were deep ocean warming, that could explain the increase in atmospheric CO2. One way or the other, deep ocean warming is a problem for the alarmists.
Yes! Griff, you have summed yourself up to a ‘T’!
So says the natural climate variability denier, griff.
Have you switched to living on renewable power only yet griff? Doubtful seeing as how you’re communicating on a low wind day before the sun was fully operational even now barely a third of electricity is from unreliables
Well Griff, as far as I can tell it is very accurate. What facts do you disagree with? Any that you fail to dispute, I will assume you admit as true.
Nothing of note to report in Adelaide South Australia after the geology of Hallett Cove showed a SLR of 130M between 15000 and 6-7000 years ago when Spencer and St Vincent Gulfs were formed. Must have been a 3M drop after that as the stranded shingle dunes at Fitzgerald Bay north of Whyalla show too. Dams are full and so is the Murray Darling so the desal plant built for the last drought is still in mothballs waiting for the next one to occur. What about around your joint griff?
Been hoping that the white elephant rusting hulk desal plant here in SE Queensland might get washed away in the flooding … no luck. Us taxpayers are footing a horrendous bill for its standby upkeep.
“This is nonsense from a political activist climate denialist.”
Great title for your post, griff.
…. and as usual.. zero content.
We all know that you are a deep “climate denier”, denying natural variability and the recovery from the LIA
It’s like this griff. Oz is a big continent in the Southern Hemisphere bounded by different oceans so it gets lots of different weather like so-
Australia’s east coast to be hammered with FOUR months worth of rain (msn.com)
Like the weather man says it’s La Nina that’s dumping a lot of water on East coast residents at present but we only made the connection with that and El Nino in the 1960s-
La Niña Fact Sheet (nasa.gov)
None of those climastrologists you’re so fond of with all their fancy computers can tell us when they’re coming or how influential they’ll be so whaddya reckon with their constant dooming forecasts for a century?
Since you asked the question, griff, the answer is no.
You could have repudiated something, no?
Yes if you are referring to your own comments but it was unnecessary to state it.
Griff so which of the data sets that Professor Humlum cited are incorrect?
Permanent Service for Mean Sea Level: http://www.psmsl.org/.
Sea level from satellites: https://sealevel.colorado.edu/data/2020rel1-global-mean-sea-level-seasonal-signals-retained.
Ocean temperatures from Argo floats: http://www.argo.ucsd.edu/.
Rutgers University Global Snow Laboratory: http://climate.rutgers.edu/snowcover/index.php.
Maue ACE data: climatlas.com/tropical/.
Hurricane Research Division, NOAA: http://www.aoml.noaa.gov/hrd/tcfaq/E23.html.
National Ice Center (NIC). http://www.natice.noaa.gov/pub/ims/ims_gif/DATA/cursnow.gif. National Snow and Ice Data Center (NSIDC): http://nsidc.org/data/seaice_index/index.html.
AMO, Earth System Research Laboratory, NOAA, USA: https://www.esrl.noaa.gov/psd/data/ timeseries/AMO/.
Atlantic Oceanographic and Meteorological Laboratory, Hurricane Research Division: http://www. aoml.noaa.gov/hrd/tcfaq/E11.html.
Calling the professor a name while ignoring the factual data presented makes you petulant child.
DaveinCalgary,
This is not directly a response to you, just a general comment and this was a convenient place to put it.
I’m at a loss to understand why so many people respond to Griff’s childish, infantile drive-byes. He comes by, makes a ridiculous comment and disappears, then everyone wastes time by giving him all the attention this sad, little creature craves.
Many of the responses are well thought out, logical, factual and well written and take some time to develop. You’ll never get a thoughtful response from Griff.
You can’t have an intelligent, rational, objective discussion with an irrational, emotionally driven ideologue.
Says the political activist doomsday fear-mongering end of the world catastrophist.
Why aren’t you out scaring the daylights out of some children, or gluing yourself to a roadway somewhere?
Are you proud of being a text book internet troll?
Why don’t you ever reply to comments directed at your ”arguments”?
Why are you so willing to demonstrate your feeble, blindly biased, nonsensical thought process?
Do you actually believe you have any power of persuasion?
What part of the term “troll” don’t you understand? 🙂
“Why don’t you ever reply to comments directed at your ”arguments”?”
I suggest it’s because he is merely inserting some terms that will be recognized by “normies” who happen to come upon an article/discussion like this one, and are trying to make sense of it. They have been conditioned relentlessly for years to react to such terms as “climate denier” in a very negative way. It means kook to them, to their reactive mind. Like “flat earther” of “conspiracy theorist”.
His intent is to cause a long chain of responses such as occurred here, which serves as validation to that conditioning. People taking it seriously, even returning the accusation, establishes in their reactive mind, that they have correctly understood that it is a meaningful and significant term, a real position the “kooks” actually hold, (when push comes to shove, so to speak). The point of the contention they’ve been hearing about, the hold-up to “tackling climate change” and such.
To many here, I surmise, a very different reaction occurs. Their minds reactively “fill in” the unspoken details that make it something other than a totally ridiculous question. They “hear” something more like “Critical thinking skeptic of the catastrophic climate change alarmists agenda driven pseudo science”. But the hapless visitor “hears” no such thing.
I suggest “feeding the troll”, by simply responding to what griff actually wrote. Don’t allow your reactive mind to fill in those details for him, before responding.
If you ask something like; “Do you really think someone who studies climate thinks there’s no such thing as climate?” :What’s griff going to say that could salvage his bizzaro-land question?
I say, feed the troll, something he will not like the taste of ; )
Maybe someone can let me know if the BBC or its printed partner the Guardian bring this climate report into public awareness. I only ask because I never listen or watch the BBC or bother reading the opinion pieces presented as news, by the Guardian.
Good news/accurate observation never gets promoted by the Climate Alarmists.
Just posting a global temperature anomalies graph alone can cause one to get hysterical cuz it
lacks perspective. This is why absolute global temperature graphs in both °C & °K with the base @ur momisugly
0° should also be included. The first would give perspective on global temps relative to what people
experience daily. The second would give perspective to techies who are aware of thermodynamics.
Perspective lets people interpret information for what it really says. Without that, we can advocate
a lot of stupid & nasty things.
About 10 yrs ago. I saw a graph with a red line displaying the global temperature anomalies from
just 1978-1997. I realized it would’ve been quite normal to be very alarmed if that is all I knew about
global temperatures as most people are only shown anomalies. Even though the graph I have
attached only shows temperature anomalies, having historical perspective shows me that this high
warming rate has happened twice before since 1850 & is NOT a reason to sound like Chicken Little.
Having a longer time period can also help gain perspective.
I can’t find any graphs of global temperatures in either °C & °K with a baseline of 0°. If any of you
have them, please post them as they are real eyeopeners as to the difference of absolute Ts vs
anomalies. Thanks.
In spite of all the worldly changes over that period, temperature stability is remarkable, especially if looked at from a fuller temperature range as you suggest.
Again mentioned in Australia recently that climate hoax based renewable, unreliable and intermittent, energy subsidies, direct for profit of shareholders, additional to any legal tax deductions for expenses incurred in producing taxable income or fuel tax rebate for diesel used for off-road applications, exceeds A$7 billion a year.
It would be interesting to add that cost to the now much higher than before renewable energy gained a small share of supply electricity accounts paid by all consumers.
I plot UAH sat. data frequently. I have no use for NASA or NOAA data as they have demonstrably been hacked beyond all recognition. To the point, the run up from ~1900 to ~1935 has been flattened *and* the great cooling from ~1940 to ~1975 has been eliminated. The rewrite of the 20th century climate history was done in stages from 1988 to about 2010. The constant editing of the past continues to this day. So much for NASA and NOAA.
Back to the UAH data set. Dr, Spencer is a bit bashful to put a firm absolute temperature on the UAH data because it measures something rather different to the surface temp. He did at one point suggest that maybe something like ~15 degrees might be OK.
I can make up a chart of UAH data scaled such that the Y axis starts at 0.0 deg C. and the UAH 0.0 anomaly is reset to 15.0 deg. C., with the Y axis running up to 17.0 deg. C. or so.
Then I can post the graph here and you can download it.
Reply here if this is suitable for your needs and I will start in on it.
I was only thinking of an already published graph as I know I’ve seen them before. A graph
of global Ts over the last 600My in °K is ~ a straight line. One in °C/°F over the past 150
yrs does rise a bit. The effect is to show it’s not as big as anomalies make it seem.
Unfortunately, you’re right about NASA & NOAA. If it’s not too hard to do, post it for
everyone to see & I can copy it from there. It would be interesting to see. Thanks!
OK, give me a bit of time. I will post when ready.
Here you go.
Click to embiggen, open in a new tab, then in your browser file->save as…
Easy.
+1,000,000
It has that “yawn, boring” straight-line effect!!! 🙂 🙂 🙂
Yes it does.
Not a whole lot to look at.
Plan B:
Graph the Y-axis from -0.50 to + 0.25.
At this scale, the Super el-nino of 1998 zooms right off the top of the plot. Then temps keep rising and go off the top just before the end.
Scare the stuffings out of them.
I like plan B better.
Unfortunately, somebody might take you seriously & panic. It’s really
amazing how important perspective is in doing good analysis.
Thanks again! 🙂
If you study the graph above in OMW’s post you will see that the three temperature jumps are 65 years apart. That is the AMO cycle in action. NOT CO2!!!
The other thing people need to see is the temperature “record” presented in full degrees, not TENTHS of a degree that most of the “instrument record” could not even record. When you see the full degree expression of the record, it is instantly apparent that there is absolutely nothing to panic about.
Here is one for the US, which is the only large continent sized land area that has good records going back over a century:
I think this one may be global:
This is the global representation of yearly average temperature as if it were displayed on a backyard thermometer.
In other words, you hardly notice anything different, which is exactly what happens when you stick your head out the door everyday and look.
Yes, exactly.
https://www.reddit.com/r/dataisugly/comments/hnl2li/an_interesting_way_to_show_global_mean_surface/
And
https://elonionbloggle.blogspot.com/2021/07/june-2021-uah-satellite-global-average.html
Ignore the use of Kelvin degrees (°) used in this one. They symbolism is not considered appropriate.
“Sea ice levels recovering”
–
–
The reads like it’s a good thing. I’d prefer more ice to melt. Warmer is better.
Living conditions in warmer conditions are better than in colder conditions in my opinion, and far less likely to cause deaths.
Yes, warmer is better. However, some global cooling (or no significant warming for at least ~30 years) is the only thing that can expose and falsify the silly and very destructive and wasteful (c)agw hypothesis.
Well, once they can’t hide the reversal of trend with their “adjustments” any more, they’ll just roll out that “warming causes cooling” canard.
I remember back in the late 1960s and early 1970s. A common occurrence was whales hanging out in open stretches of water known as a polynya for too long. Sea ice would form around them for miles around, effectively trapping them with no path back to open water and their feeding grounds.
Remember “Save The Whales”, this was the heyday of Saving Whales.
Anyway the trapped whales became a “cause celeb” even with national news shows giving nightly updates.
There would be much cheering from the public when a US Coast Guard icebreaker crashed it’s way through the ice to the trapped whales. The icebreaker would turn and make it’s way back to open water. Happily enough, the whales seemed to understand the situation perfectly well. They would allow the icebreaker to get a discrete distance ahead then follow it back out to open water. Without a doubt, the USCG made the most out of all the favorable publicity.
According to the whales, more ice is not better.
https://youtu.be/5UMCCSiDuHc
Oh, man, Edim. That was SO COOL. Sure hope EVERYONE WATCHES THAT.
(A cautionary tale against hubris, also — man alive, the rescue “boss” hung up on them; then, refused to accept their help for HOURS….. perhaps, but-for that delay, “Bone” would have lived” 🙁 )
True story behind “The Big Miracle”
Aha. The need to dump renewable energy has filtered through academia…Narrative
“Not as bad as we feared…ok for fossil a bit longer…and nuclear of course”…
They have probably started to realise that if they get rid of fossil fuels, their offices will have no air-conditioning in summer and no heating in winter. 🙂
Ole Humlum: State of the Climate 2021 (pdf)
An excellent report.
Atmospheric CO2 changes lag temperature changes at all measured time scales. (MacRae 2008). Humlum et al (2013) confirmed this conclusion. Kuo et al (1990) made similar observations in the journal Nature.
IF CO2 is a significant driver of global temperature, CO2 changes would LEAD temperature changes but they do NOT – CO2 changes LAG temperature changes.
For decades, alarmists have ignored that reality and wasted trillions of dollars and millions of lives with their false climate crisis.
Climate Sensitivity to CO2 is very small, so there is NO real fossil-fuel-caused climate crisis. The only measurable impact of increasing atmospheric CO2 concentrations is improved crop yields – hugely beneficial to feed the world.
The proof is in my 2008 paper – the close correlation of the rate-of-change dCO2/dt vs Lower Tropospheric air temperature:
The lag of atmospheric CO2 changes after atmospheric temperature changes is ~9 months, as confirmed by Humlum Figure 20. That observation disproves the alleged Global Warming crisis, which ASSUMES that increasing CO2 drives dangerous warming. “The future cannot cause the past.”
Global Cooling is happening now, as we correctly predicted in 2002 – another disproof of the false global warming climate crisis.
Cheap abundant reliable energy is the lifeblood of humanity. The failure of intermittent wind power generation caused the disastrous electrical energy shortfall in Britain and Germany in recent years.
All this is happening just as we predicted 20 years ago, in 2002 publications.
Keep it up until people listen, Allan.
YouTube Warmista Potholer54 is still trying to convince his dwindling band of fans that this fact does not disprove the entire CAGW hypothesis.
Posted this comment by excerpt and link at a forum will see what the Warmists/alarmists’ reactions will be.
Thank you.
Link please Tommy? Should be amusing.
What will they call me – their latest incarnation of the anti-Christ?
“A disaster of Biblical proportions… Old Testament… Real Wrath of God type stuff… Fire and brimstone coming down from the skies… Rivers and seas boiling… Forty years of darkness, earthquakes, volcanoes… The dead rising from the grave…
Human sacrifice, dogs and cats living together, Mass Hysteria!”
Ghostbusters Orig Movie scene-Old Testament type stuff…dogs & cats living together, mass hysteria! – YouTube
Agreed Alan, observations are king the least adulterated the better, it’s been hard getting any sensible climate data out of the BoM in Australia, particularly ground temperatures when their ACORN datasets keep changing the parameters of historical measurements to suit the CAGW mindset.
The latest UAH data for Australia showing only gentle modern warming and recent cooling since 2016, there is no comparison with the homogenised BOM data, shame on them!
Sorry I could not download the file here, this graph tells a real story.
The file is at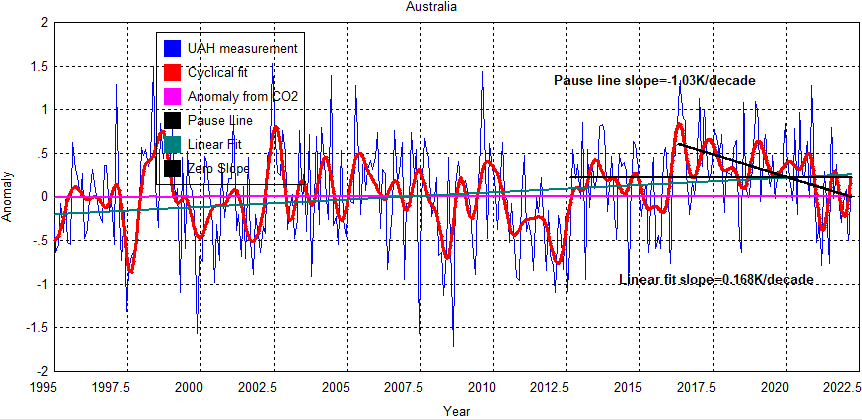
Technically, temperatures have been falling according to the UAH Satellites since May 2016.
Agreed Bob – UAH is the “Gold Standard”, and John Christy and Roy Spencer are the best. I use UAH LT whenever I analyse post-1979 data.
I agree that the world is getting colder, some say since 2016 but that relies on the latest big El Nino peak, so I prefer 2020. Year 2020 agrees with our 2002 prediction of global cooling, but both 2016 and 2020 agree with my 2013 update:
I published on September 1, 2002:
3. “If [as we believe] solar activity is the main driver of surface temperature rather than CO2, we should begin the next cooling period by 2020 to 2030.”
I updated my global cooling prediction in 2013:
3a. “I suggest global cooling starts by 2020 or sooner. Bundle up.”
My friend Cap Allon has been posting increasing evidence of global cooling for several years at Electroverse.net. His latest posts are listed below:
APRIL NOR’EASTER DROPS MORE THAN A FOOT OF SNOW AS RECORD-FLURRIES AND FREEZES THREATEN NORTH AMERICA’S CROPS
April 20, 2022 Cap Allon
The COLD TIMES are returning, the HARVESTS are failing — PREPARE.
IS BIRD FLU THE NEXT ‘SCAPEGOAT’ FOR THE COLLAPSE?; RECORD COLD GRIPS CANADIAN PRAIRIES; + MANAM ERUPTS TO 45,000 FEET
April 19, 2022 Cap Allon
EVERY global event is now advancing ‘their’ shift to Totalitarianism. Resist.
ANTARCTICA NEARS LOW TEMPERATURE RECORD FOR APRIL; EASTER FELT LIKE WINTER ACROSS MUCH OF NORTH AMERICA; SOUTH AMERICA’S FRIGID MARCH; + THREAT OF X-FLARES THIS WEEK
April 18, 2022 Cap Allon
Active sunspot complex ‘AR2993-94’ released an X-flare (on April 17), but this “may be just the beginning,” writes Dr Tony Phillips.
LITTLE ICE AGE; “A LONG COLD WINTER” FORECAST FOR ARGENTINA AS FOOD AND ENERGY SHORTAGES MOUNT; + U.S. CONTINUES TO FELL COLD RECORDS
April 15, 2022 Cap Allon
Prior to this week, a half-inch was Wenatchee’s snowfall record for the month of April, but on Thursday alone, NWS meteorologists tallied 7-10 inches in town, with 16 inches settling just south of town.
RECORD COLD HITS DENVER, LAKE TAHOE, SEATTLE AND ELSEWHERE; MINNESOTA’S “EPIC” WATERFALLS AFTER HISTORIC WINTER SNOW; + UKRAINE’S BELOW-AVERAGE MARCH
April 14, 2022 Cap Allon
Corn extended its gains toward $8 a bushel. Food shortages are on the horizon, globally. Mitigate the risk by taking your family’s food security back, by growing your own…
My friend and co-author, top meteorologist Joe D’Aleo and I are concerned about food shortages this year. We were concerned even before the war in Ukraine started, which will just make it worse.
I published on 1June2019:
Situation Analysis:
There was a huge crop failure across the Great Plains of North America in 2019, as we documented in a paper published on 27Oct2019:
THE REAL CLIMATE CRISIS IS NOT GLOBAL WARMING, IT IS COOLING, AND IT MAY HAVE ALREADY STARTED
By Allan MacRae and Joseph D’Aleo, October 27, 2019
All of our global climate-and-energy policies are 100% wrong – false and fraudulent – wolves stampeding the sheep for political and financial gain. In my opinion, all this needless carnage is being deliberately caused by woke traitors like Biden, Trudeau, Johnson, Macron, Merkel, Morrison, Ardern, etc. who are under the toxic influence of Klaus Schwab and the WEF and other totalitarians who seek control of the world’s population.
Cold Nino34 SST’s continue to dominate cold weather.
RECORD SNOW SWEEPS PRINCE GEORGE; NORTHERN PLAINS AND ROCKIES SET FOR SECOND BLIZZARD IN 10 DAYS; + GLOBAL FOOD PRICES AT RECORD HIGHS, CRIPPLING SHORTAGES EXPECTED BY HARVEST TIME
April 22, 2022 Cap Allon
This is a controlled demolition of civilization. Before a ‘Great Reset’ you need a Great Depression. They want to break us. Resist!
QUEBEC’S LONGEST-STREAK BELOW 20C, AS RECORD SNOWFALL SWEEPS MONTREAL; FRESH SNOW BURIES SERBIAN MOUNTAINS; + EUROPE BRACES FOR EXTREME ARCTIC OUTBREAK IN MAY
April 21, 2022 Cap Allon
Brace/prepare for hyperinflation, food shortages and civil unrest in the very near future: Exit the system and grow your own
The forecast is for a very cold week of 1-8May2022 in Western Europe including green-energy sabotaged Britain and Germany.Told you so 20 years ago.
EUROPE BRACES FOR EXTREME ARCTIC OUTBREAK IN MAYLooking at the latest GFS run (shown below), much of Europe, particularly Western and Central regions, can expect a return to wintry conditions in the coming days and weeks, even as the calendar flips to May.
From the very root of Global warming Theory, is nicer warmer calmer weather not to be exepcted?
The Theory says that The Atmosphere is going to ‘trap heat’ and thus be at higher than previous temperature.
Fine, OK, Good.
Climate Science then falls flat on its face when it says that this temperature increase will cause wilder weather.
No it won’t because absolute temperature does not cause weather – weather is caused by temperature difference.
It is the difference in temps between Earth’s surface (the actual dirt, soil, rocks, water and plants) and somewhere anywhere at either greater latitude or greater altitude
The temp difference cause convection. AKA: Weather
But the surface is always warmer than anywhere above it (Lapse Rate) so the reduced temp difference must/will can only result in less convection
i.e. Calmer and more settled weather
yes yes yes I know…
I too remember, as a child, seeing Carl Sagan on TV informing the world that hurricanes are caused by elevated ocean temperatures.
But he never stated ‘elevated relative to what‘
He studiously avoided mention ‘temperature difference‘
Did he himself even know?
Sagan made Hanson look like a rank amateur and Sagan was the forerunner of newscaster/reporters standing in ditches while breathlessly reporting on ‘flooding’
And simple minded gullible people swallowed that ‘lie by omission’ (and the camera tricks) and still do to this very day – while labouring under the delusion that they understand the quantum mechanics (QM) of the 2nd Law.
(As per Tyndall. But you must forgive him, QM hadn’t been invented then. It was in fact people trying to understand an obvious flaw in Tyndall’s experiment that helped QM on its way)
The obvious flaw being = The Ultraviolet Catastrophe
This was not any radiation accident, it was the pre-existing theories that were ‘catastrophes’ and just as the GHGE is a modern day catastrophe
Yup – and to underscore this, much of the “average” increase in “global temperature” has been night time LOW temperatures being a little higher, not daytime HIGH temperatures getting higher. Which is one MORE way temperature differentials are reduced, not increased, by “global warming” whatever the cause.
AKA, it’s GOOD news when the climate is getting warmer. AKA why every previous warm climate period during the current epoch, the Holocene, was called a CLIMATE OPTIMUM.
Agree, cyclone energy is caused by differentials, not absolutes – like a battery.
https://wattsupwiththat.com/2019/02/18/hurricanes-climate-change-detection/#comment-2632756
Years ago I plotted the data from this 2005 NOAA report.
There was a decline in Category 4 and Category 5 hurricane intensity from ~1930 to 2004 (end of data for this 2005 report).
I have found Chris Landsea’s work to be credible.
Regards, Allan
http://www.nhc.noaa.gov/pdf/NWS-TPC-4.pdf
NOAA Technical Memorandum NWS TPC-4
THE DEADLIEST, COSTLIEST, AND MOST INTENSE UNITED
STATES TROPICAL CYCLONES FROM 1851 TO 2004 (AND
OTHER FREQUENTLY REQUESTED HURRICANE FACTS)
Updated August 2005
Eric S. Blake, TPC Miami
Edward N. Rappaport, TPC Miami
Jerry D. Jarrell, TPC Miami (retired)
Christopher W. Landsea, HRD Miami
Tropical Prediction Center
National Hurricane Center
Miami, Florida
The USCRN for the time of its existence, now going on 17 years, supports his conclusions, at least as far as the continental USA is concerned.
https://www.ncdc.noaa.gov/temp-and-precip/national-temperature-index/time-series/anom-tmax/12/4
“No Change”
Isn’t what the establishment wants to hear. They want to hear more of this…
“Antarctic sea ice falls to lowest level since measurements began in 1979”
https://www.theguardian.com/world/2022/feb/23/antarctic-sea-ice-falls-to-lowest-level-since-measurements-began-in-1979
Yes indeed, it’s far worse than they thought – and that’s what they want to hear.
Of course, let’s continue to use 1979 as the starting point for measuring sea ice, 1979 being the high point for sea ice in the 20th century. Every season afterwards pales in comparison. Cherry pick the start date to guarantee you get your point across. Why not use 2012 as your starting point and measure artic sea ice every year after compared to 2012. Come on Alarmists, wanna play?
Those who are honest will take the summary statement and examine it closely:
“A year ago, I warned that there was great risk in using computer modelling and immature science to make extraordinary claims. The empirical observations I have reviewed show very gentle warming and no evidence of a climate crisis.”
Alarmists with blinkers will ignore this statement and keep calling Prof Humlum “a climate change denialist.” This is dishonest slander.
Facts have no affect on the headlines:
Record low Antarctic sea ice extent could signal shift AFP
“Record low” compared to what?
Yes, the whole “on record” canard – aka a period so short (i.e., the period during which we have actually monitored the “weather”) to be completely meaningless in “climate” terms.
And when “records” exist that make the latest fill-in-the-blank weather “event” seem not so special, then they substitute something along the lines of “in the last fill-in-the-blank years” to cherry-pick the start point to exclude “inconvenient” history.
In every situation and in every context, the warmistas and doomsday alarmists hide inconvenient facts or just plain make stuff up, cherry pick events and stats, refuse to consider contradictory information, change the subject, and substitute logical fallacies and ad hominem insults for logic and reason and truthful discourse.
In short, they do the opposite of what people do who have facts and the truth on their side.
We just passed the warmest part of the year down there.
Why play whack a mole with isolated stats of local conditions at one particular time?
There is no trend in sea ice for the globe, and in the part of the world that was where the panic mongerers were pointing at in decades past, sea ice is not declining but is in fact close to the long term averages, having recovered from some low ice years.
There is always some place with a record cold night, or record warm day, or record lack of snow or ice, or a dry spell, or a flood, or a storm…
This is exactly why the official alarmist narrative had to change to “climate change” from “global warming”.
Because by calling all weather events evidence of a climate crisis, and repeating such ridiculous assertions all the time, every day, the impression can be created that bad things are occurring continually.
It is a big planet, and every kind of weather is going on every day, in some place or another.
But overall, nothing, absolutely nothing, is occurring that is outside of historical norms.
Just about every place has regular weather nearly every day, and a few days a year of very unpleasant conditions.
Just like always.
Note that claims of “record low Antarctic sea ice” exclude any information prior to 1980, which is well known to be the lowest global temperature over the past 100 years or so.
It was the tail end of several decades of global cooling, even as CO2 was increasing rapidly.
It is absurd to suggest that “record low since 1980” is anything akin to “lowest ever”.
We do have sea ice records and satellite pictures from long before 1980 though. These have been mysterious edited from the climate mafia’s records sometime after the first IPCC report in 1990.
Why would that be? Because those records from the 1960s and 1970s show far lower sea ice than now, as well as huge variability from year to year, demonstrating how rapidly huge amounts of thick ice ca form…amounts that take decades of melting to melt away again.
Sea ice in the prior years:
“Why would that be? Because those records from the 1960s and 1970s show far lower sea ice than now,”
Actually they don’t, the lowest amount shown there is ~5.8 million sq km whereas typical minima in extent in recent years are ~4, the lowest having been 3.18. As of today the extent is the 8th lowest for the date over the satellite period, all but one of those have been the last 7 years.
Now wait just one moment! . . . how many politicians, including President Joe Biden, have solemnly promised to “follow the science on climate change™ “?
Consequently, all of the AGW/CAGW climate alarmists must now being burning the midnight oil to promptly discredit Ole Humlum’s State of the Climate 2021 report.
After all, they need to keep each of the following memes alive:
— climate change is a current crises
— climate change is an immediate emergency
— climate change is a pending catastrophe
— climate change is a current existential threat
— we only have “x” years left before the “tipping point of no return” (note: you are free to replace “x” by any number between 0 and 9)
ROTFLMAO.
We only have “X” years left before we must inflate our economies to pay the bills we created by spending money that DOES NOT EXIST.
How we do that is immaterial as long as we do it somehow and fast. Real wealth traditionally came out of the ground, but now it comes out of the air too.
Thank you for all the valuable work. I would like to involve an interesting aspect that is not mentioned in the context and that is that the climate from a technical perspective is most likely to turn down for a long time and the average for 30 years will soon turn down and be declining in the coming years if nothing exceptional happens. It is based on studies of UAH data and of wave propagation according to Elliott’s theories and the Fibonacci series of numbers. The analyzes are written in Swedish, but I think you can understand most of the message via the pictures or translation via, for example, Google.
KR / A. Nyrén, Analyst, Sweden
https://alvarnyren.wixsite.com/aidtrade/post/mina-klimatmodeller-21
Satellite data shows has been no net warming for 20 years!

See The Solar Activity – Global Cooling Trackers – March . 2022https://climatesense-norpag.blogspot.com/
”
1. The Solar Activity – Global Temperature Correlation.
https://blogger.googleusercontent.com/img/a/AVvXsEjbSnv27PK5uV7c0Ma7QRapv7GTZzY9Vj-edBzo4-PGCqMgI436-pZKAJyNWKAArON6oLdvaOa6-XZI7JWxkNUFXA9TLmu09PGbHcanacgzHZPDhmPT51T1alwqM8mTTdnFpygOMjn3TnfMNORzad001xsTOwbtHMtDXinlXYjVTxI-rJXnWXv6iAz8tw=w655-h519
Fig.1.Correlation of the last 5 Oulu neutron count Schwab cycles and trends with the Hadsst3 temperature trends and the 300 mb Specific Humidity. (28,29) see References in parentheses ( ) at https://climatesense-norpag.blogspot.com/2021/08/c02-solar-activity-and-temperature.html
The Millennial Solar Activity Turning Point and Activity Peak was reached in 1991. Earth passed the peak of a natural Millennial temperature cycle in the first decade of the 21st century and will generally cool until 2680 – 2700.
Because of the thermal inertia of the oceans the correlative UAH 6.0 satellite Temperature Lower Troposphere anomaly was seen at 2003/12 (one Schwab cycle delay) and was + 0.26C.(34) The temperature anomaly at 2022/03 was +0.15 C (34).There has now been no net global warming for the last 20 years. The Oulu Cosmic Ray count shows the decrease in solar activity since the 1991/92 Millennial Solar Activity Turning Point and peak There is a significant secular drop to a lower solar activity base level post 2007+/- and a new solar activity minimum late in 2009.The MSATP at 1991 correlates with the MTTP at 2003/4 with a 12/13 +/- year delay. In Figure 1(5) short term temperature spikes are colored orange and are closely correlated to El Ninos. The had sst3gl temperature anomaly at 2037 is forecast to be + 0.05.
2. Arctic Sea Ice.
Arctic sea ice reached its maximum extent for the year, at 14.88 million square kilometers (5.75 million square miles) on February 25. The 2022 maximum was the tenth lowest in the 44-year record.
Fig.2 Arctic Sea Extent (NSIDC)
Arctic sea ice extent on 04/09/22 (Lt Blue) was the twelfth lowest on record, greater than the 2011 t0 2022 average and a little above to the 2005 amount.
3.Arctic Sea ice volume.
Average Arctic sea ice volume in March 2022 was 21,700 km3. This value is the 6th lowest on record for March, about 2,200 km^3 above the record set in 2017. See Data at: http://psc.apl.uw.edu/research/projects/arctic-sea-ice-volume-anomaly/#:~:text=February%202022%20Monthly%20Update,mean%20value%20for%201979%2D2021.
4.Sea Level
Fig. 3 Sea Level https://climate.nasa.gov/vital-signs/sea-level/It can now be plausibly conjectured that a Millennial sea level peak will follow the Millennial solar activity peak at 1991/92 . This may occur at a delay if one half of the fundamental 60 year cycle i.e at 2021/22. Fairbridge and Sanders 1987 (18).The rate of increase in sea level from 1990 – present was 3.4 millimeters/year. The net rate of increase from Sept 13th 2019 to Jan. 03 2022 in Figure 3 was 2.3mm/year. If sea level begins to fall by end 2022 the conjecture will be strengthened.
5. Solar Activity Driver and Near term Temperatures
An indicator of temperatures for 5 – 6 months ahead is provided by the SOI graph
https://blogger.googleusercontent.com/img/a/AVvXsEgAwpPhzbg85eEaslbEXe6iYwNB7Y3TxXd4x7PPRrSq2cVyMqvSDlNGLj7kxwDD91F9h5wijQsUXDcd0ol3EUD3ySwvPIPklfSdEy2qXCx_9SLA4dT-r7-Du6DDwFsQhs8LUnMTWPxDrQSwXAdqaLBjsMhgXOPWd5Io-Nkt5QOj5lqnpcMmqOY4NQSS7Q=w387-h271
Fig.4 30 Day moving SOISustained positive values of the SOI above +7 typically indicate La Niña (cooling) while sustained negative values below −7 typically indicate El Niño.(warming) Values between +7 and −7 generally indicate neutral conditions. Values at Feb.13 2022 indicate possible cooler than normal NH summer temperatures until June/July 2022. http://www.bom.gov.au/climate/enso/#tabs=Pacific-Ocean&pacific=SOI
Could be shaping up for a third successive La Nina:
Another, Third Planet-Cooling La Niña? Dr. Ryan Maue Sees Strong Chance Of This Occurrence (notrickszone.com)
so hard to see any return of gorebull wurming for the next year or so
Oh, no, this can’t be! It’s a crisis! ‘They’ said so! A coming ice age, a world-wide famine, global warming, peak oil, rising sea levels, sinking islands (or islands upending), more and more hurricanes, increasingly violent hurricanes, more and worse tornadoes, beaches washing away, the American Southwest becoming so hot it’s unlivable, the American North becoming so cold it’s unlivable, more and worse wildfires, and on and on and on. And when these are debunked, ‘cancel them!’ Refuse to publish anything that goes against what we need to get and keep power! And, by all means, make sure to publicize the insane ravings of an autistic teenager. Makes sense to me…
A Century Of Unprecedented Man-Made Global Warming | Real Climate Science
Global temperatures are right at the 1979-2000 average and Antarctica is more than two degrees below average.
Shock horror coral spawning is threatening an old bommie off the west coast of Oz-
Death fears for ancient WA coral formation (msn.com)
For once they don’t definitively point the finger at global warming.
Do check the video interview with the young lady from Farmers for Climate Action and all I’d say to that young whippersnapper worried about climate dooming is think about the lesson of Goyder dearie-
Goyder’s Line – Wikipedia
Do you really think you can successfully crop every year one side of that dotted line and not the other my dear?
It’s a big continent full of lizards and snakes and the rain only comes from the surrounding oceans-
Queensland road sign advising no phone signal for 630km shocks internet | news.com.au — Australia’s leading news site
No internet shocks people?
A perfect example of how few Australians travel to our remote inland and coastal remote areas, the majority live on the coastal plains East and South.
Even with an external antenna fitted to my 4WD I experience many zero mobile phone signal areas when travelling, satellite phone recommended or HF Radio.
They’d be rolling in their graves at the vapours of the touch screen generations-
Official Tom Kruse Website | Home