By Allan MacRae and Joseph D’Aleo, October 2019
Introduction – Catastrophic Anthropogenic Global Warming – A Failed Hypothesis
The Catastrophic Anthropogenic Global Warming (“CAGW”, aka “Global Warming”, “Climate Change”, “Climate Crisis”, “Climate Emergency”) scare is a failed hypothesis and the greatest scientific fraud in history. Global warming alarmism has been promoted by political extremists and believed in by their gullible acolytes for decades, even though there is no credible evidence that catastrophic global warming exists in reality, and ample evidence that the CAGW hypothesis has been falsified.
The failed CAGW hypothesis assumes that increasing atmospheric CO2 from fossil fuel combustion drives dangerous runaway global warming. The alleged evidence for this fraud is climate computer models that greatly over-predict current observed warming, typically by 300 to 500%. These climate models deliberately employ excessively high assumed values of climate sensitivity to CO2, and are designed to create false alarm.
Global warming has slowed since the mid-1990’s, so the climate alarmists alleged that increased atmospheric CO2 from combustion of fossil fuels will cause wilder, more chaotic weather. There is ample evidence that this allegation is also false. Weather has actually become less chaotic.
The Mann hockey stick (MBH98 etc.), the Climategate emails, historical temperature data revisions and the thuggish tactics of the climate extremists provide ample evidence of fraud.
Credible Evidence That CO2-Driven Global Warming/Climate Change Alarmism Is A False Crisis
Atmospheric CO2 concentrations have been much higher in geologic time, and runaway global warming has never occurred in the billions of years of Earth history. Global temperatures have been much warmer and also much colder over geologic time. Earth is now in a glacial period, when mile-thick ice sheets cover much of the planet for about 100,000 years, interrupted by interglacials that last about 10,000 years. Earth is now in a warm interglacial, but the last glaciation ended only about 10,000 years ago, so Earth is due for another glaciation.
Temperatures were much higher during the Medieval Warm Period circa 900-1300 AD, and then humanity experienced the Little Ice Age circa 1300-1850 which caused enormous suffering and the deaths of millions.
The USA has some of the best surface temperature data in the world. The hottest USA surface temperature records occurred in the 1930’s, before fossil fuel combustion accelerated circa 1940.

Fossil fuel combustion accelerated strongly at the start of World War II, and global temperatures COOLED significantly from 1940 to 1977. That one observation is sufficient to disprove the CAGW hypothesis – global temperatures do NOT rise catastrophically due to increasing atmospheric CO2.
Even if it is assumed that ALL the observed global warming is ascribed to increasing atmospheric CO2, the following two studies calculated that the MAXIMUM climate sensitivity to a hypothetical doubling of atmospheric CO2 is only about 1 degree C, which is too low to cause dangerous global warming.
Christy and McNider (2017) analysed UAH Lower Troposphere data since 1979.
Lewis and Curry (2018) analysed HadCRUT4v5 Surface Temperature data since 1850.
That 1C/doubling is not an average, it is a MAXIMUM climate sensitivity, since some or most of the observed warming could be due to natural causes. Repeating, climate computer models used by the IPCC and other global warming alarmists employ climate sensitivity values 3-to-5-times higher than 1C/doubling, in order to create false fears of dangerous global warming.
It is highly probable, based on the evidence, that solar activity, not atmospheric CO2, is the primary driver of Earth’s temperature. In astrophysicist Willie Soon’s recent video, he shows the Sun-Climate relationship and provides his conclusions. There is strong correlation between the Daily High Temperatures and the Solar Total Irradiance (54:51 of the video):
… in the USA (55:02),

Canada (55:16),

and Mexico (55:20).

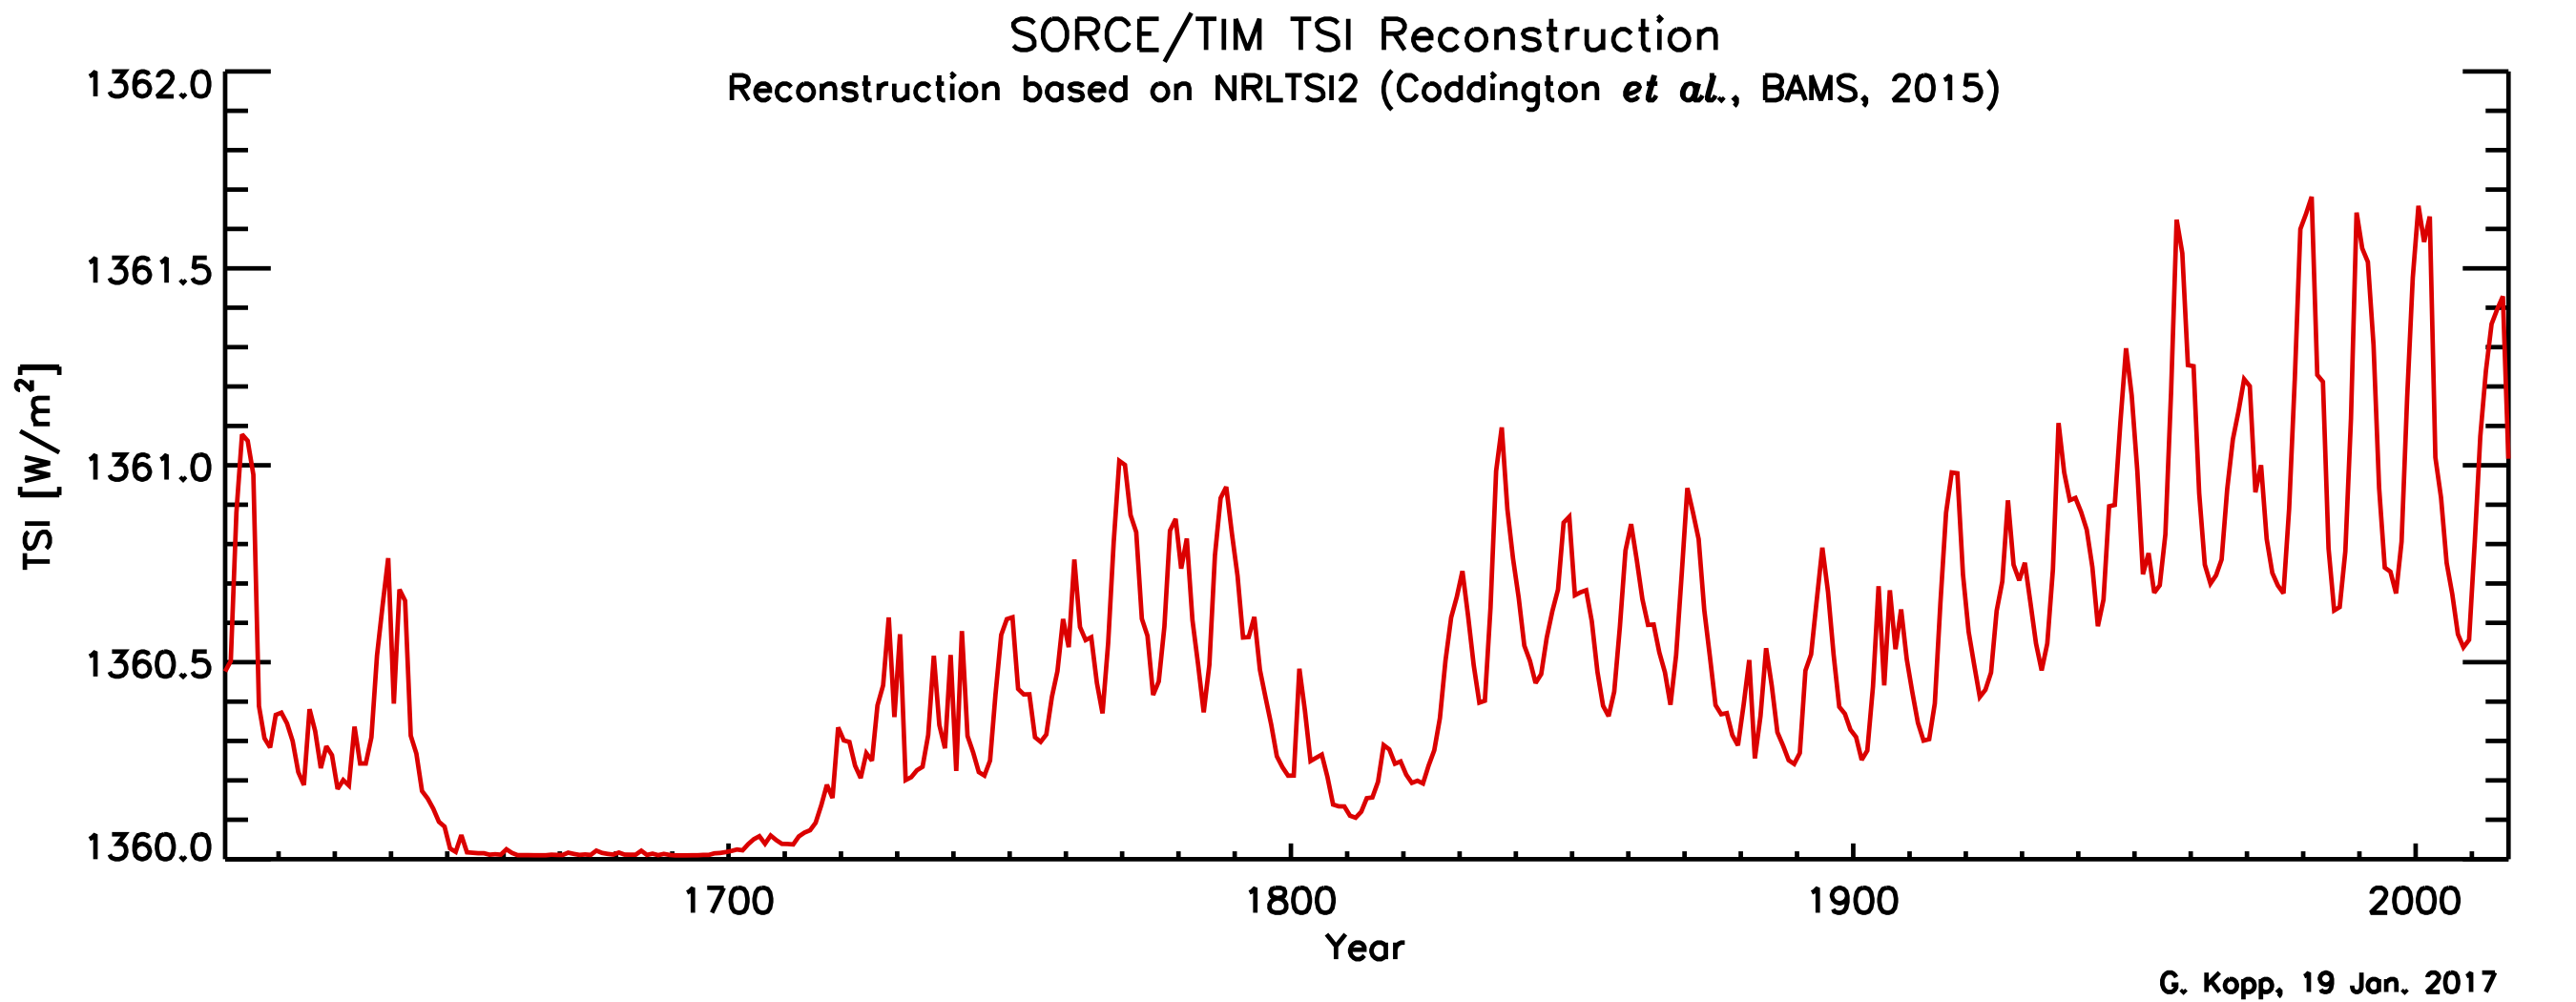
Solar Total Irradiance is now close to 1360 W/m2, similar to the lows of very cold periods circa 1700 and 1800. Atmospheric temperatures should be cooling in the near future – maybe they already are.

http://woodfortrees.org/plot/pmod/offset:-1360/scale:1 Note: Offset = -1360 means 0 = 1360.
We do know that the Sun is at the end Solar Cycle 24 (SC24), the weakest since the Dalton Minimum (circa 1800+), and SC25 is also expected to be weak. We also know that both the Dalton Minimum and the Maunder Minimum (~1650 to ~1700) were very cold periods that caused great human suffering.

http://lasp.colorado.edu/home/sorce/files/2011/09/TIM_TSI_Reconstruction-1.png
Global temperature is certainly NOT primarily driven by increasing atmospheric CO2, because CO2 changes LAG global temperature changes in time, both in the ice core proxy record and also in the modern data record. The Vostok ice core record shows a lag of CO2 after temperature of ~~800 years.

In January 2008, Allan MacRae made the following major observations in this paper.
Reference: “Carbon Dioxide Is Not The Primary Cause Of Global Warming”, January 2008
http://icecap.us/images/uploads/CO2vsTMacRae.pdf
a. The velocity of changes of atmospheric CO2 [dCO2/dt] varies ~contemporaneously with changes in global temperature.
b. Therefore the integral of dCO2/dt, changes in atmospheric CO2, lag changes in global atmospheric temperature by ~9 months.
The very close relationship of dCO2/dt (red) vs global temperature (blue) is clearly apparent. Major volcanoes (some VEI5 and most VEI6 events) disrupt the relationship.

Integrating the dCO2/dt data gives changes in CO2, which lag changes in temperature by ~9 months.
The above figures employ Mauna Loa (mlo) CO2 data. Similar results were observed using global CO2 data, as in MacRae 2008. The impact of major volcanoes is apparent.
The 12-month delta in CO2 is used to allow for the “seasonal sawtooth” in the Keeling Curve.
The ~9-month lag of atmospheric CO2 changes (red) after temperature changes (blue) is apparent.

In January 2013, a similar observation was made by Humlum, Stordahl and Solheim – that atmospheric CO2 changes lag global sea surface and air temperature changes by 9-12 months.
Reference: “The phase relation between atmospheric carbon dioxide and global temperature”
https://www.sciencedirect.com/science/article/pii/S0921818112001658
a. Changes in global atmospheric CO2 are lagging 11–12 months behind changes in global sea surface temperature.
b. Changes in global atmospheric CO2 are lagging 9.5–10 months behind changes in global air surface temperature.
c. Changes in global atmospheric CO2 are lagging about 9 months behind changes in global lower troposphere temperature.
“The phase relation between atmospheric carbon dioxide and global temperature”, January 2013

Our Predictive Track Record Is Excellent; The IPCC and Acolytes Have Been Consistently Wrong.
The ability to predict is probably the best objective measure of scientific competence. The IPCC and its global warming alarmists have consistently failed – every one of their scary global warming/climate change predictions has failed to happen.
“Climate science does not support the theory of catastrophic human-made global warming – the alleged warming crisis does not exist.”
“The ultimate agenda of pro-Kyoto advocates is to eliminate fossil fuels, but this would result in a catastrophic shortfall in global energy supply – the wasteful, inefficient energy solutions proposed by Kyoto advocates simply cannot replace fossil fuels.”
Both these above statements are demonstrably correct to date. Despite accelerating combustion of fossil fuels, especially since 1940, and increases in in atmospheric CO2 measured since 1958, the world has experienced only hugely beneficial increases in crop yields and mild, beneficial global warming.
Despite the decades-long campaign to eliminate them, fossil fuels have retained their 85% share of global primary energy, and the rest is mostly nuclear and hydro. Despite tens of trillions of dollars in squandered subsidies, green energy still comprises only 4% of global primary energy. Due to intermittency, grid-connected green energy schemes do not even significantly reduce CO2 emissions, since they require almost 100% spinning-reserve, typically fossil fueled, to fill-in when the wind does not blow or the sun does not shine.
CO2 Concentration is Far Too Low; Earth Is Colder-Than-Optimum for Humanity and the Environment
The radical greens could not be more wrong. Contrary to green propaganda, atmospheric CO2 is far too low, and Earth is colder-than-optimum for humanity and the environment.
Atmospheric CO2 concentration is not too high – it is far too low for optimal plant and crop growth, and far too low for the continued survival of terrestrial life on Earth. CO2 reduction and sequestration schemes are not just wrong; they are costly, destructive and imbecilic.
Cold weather kills about 20 times as many people as warm and hot weather. Excess Winter Deaths in the USA average about 100,000 per year – equivalent to two 9-11’s per week for 17 weeks EVERY YEAR.
Excess Winter Deaths are calculated as the difference between deaths in the four winter months (December to March in the Northern Hemisphere) less half the deaths in the eight non-winter months.
Excess Winter Deaths occur worldwide, even in warm countries like Thailand and Brazil. An approximate-low estimate of Excess Winter Deaths is 2 million souls per year worldwide.
More than 50,000 Excess Winter Deaths occurred in England and Wales during the winter of 2017-18 – an Excess Winter Death rate about THREE TIMES the per-capita average in the USA and Canada. Proportionally, that is about 35,000 more deaths in the UK than the average rates of the USA and Canada. Excessively high energy costs in the UK due to false global warming/anti-fracking hysteria are a major part of the cause of these Excess Winter Deaths – driven by global warming alarmists and their corrupted minions in governments and institutions.
Predictions of Imminent Global Cooling, Starting Anytime Soon
“Over the past one thousand years, global temperatures exhibited strong correlation with variations in the sun’s activity. This warming and cooling was certainly not caused by manmade variations in atmospheric CO2, because fossil fuel use was insignificant until the 20th century.
Temperatures in the 20th century also correlate poorly with atmospheric CO2 levels, which increased throughout the century. However, much of the observed warming in the 20th century occurred before 1940, there was cooling from 1940 to 1977 and more warming after 1977. Since 80 per cent of manmade CO2 was produced after 1940, why did much of the warming occur before that time? Also, why did the cooling occur between 1940 and 1977 while CO2 levels were increasing? Again, these warming and cooling trends correlate well with variations in solar activity.
Only since 1977 does warming correlate with increased CO2, but solar activity also increased during this period. This warming has only been measured at the earth’s surface, and satellites have measured little or no warming at altitudes of 1.5 to eight kilometres. This pattern is inconsistent with CO2 being the primary driver for warming. If solar activity is the main driver of surface temperature rather than CO2, we should begin the next cooling period by 2020 to 2030.”
For the past ~five years, MacRae has written that global cooling would start closer to 2020. This global cooling will start sporadically, at different locations in the world. Similar predictions of global cooling are included in the Appendix.
It is notable that planting of crops has occurred one month later-than-usual in North-central growing areas of North America in both 2018 and 2019. In 2019, there were many more record U.S. all-time daily low temperatures than record highs for the last 30 days, 365 days and year-to-date. These events may just be weather, not climate, or they could be the early indicators of global cooling.
The U.S. Department of Agriculture publishes a weekly crop report:
Crop Progress NASS Weekly, Mondays
https://usda.library.cornell.edu/concern/publications/8336h188j
The October 21, 2019 report is here: https://downloads.usda.library.cornell.edu/usda-esmis/files/8336h188j/qr46rf238/fx71b191j/prog4319.pdf


The North-central 2019 harvest was hit hard by wet, cold weather. Meteorologist Joe D’Aleo explains:
The growing season in North America has been especially challenging.
| Crop Challenges 2019
· Greatly delayed or aborted planting ° 19 million acres did not get planted. ° Late cold, snow, rain and flooded fields. · Shallow roots caused by excess rain · Soil Compaction · Mid to late summer dryness and heat to the South and East. · North-central growing areas saw excessive rainfall AND not enough sun or Growing Degree Days · Early snows in Northwest growing areas · Half the corn and soybean crop was not mature enough to harvest until mid-October · The soybeans and corn still in the field are delaying the planting of winter wheat |

The cold weather that developed early in the year persisted through the summer into the fall in the North-central region, which helped move warmth into the Southeast. Heavy rains fell along the contrast zone between the extremes.

With the cold, the Growing Degree Days were well below normal in North-central growing areas, and above in the Southeast.

See the heavy rains in the central Corn Belt early in the growing season, shifting Northwest late.

Corn and soybeans progress on average trailed well behind the normal.

Corn maturity as of October 20th 2019 was most behind in the Dakotas Southeast to the Great Lakes and Ohio Valley. Note the much better conditions in the South.

Newman’s analysis of 1980 showed the ideal growing areas of the Corn Belt would shift North with warming and South with cooling by approximately 144 kilometers per 1°C. The current corn growing area is shaded.

Newman, J. E. (1980). Climate change impacts on the growing season of the
North American Corn Belt. Biometeorology, 7 (2), 128-142.
The 2019 soybean harvest also trailed the 5-year average by 18% though the leaf drop was just 3% behind average.

Even where the first freezing temperatures came on time, the delays meant losses of corn not reaching black layer maturity and soybeans that had not dropped their leaves.

Very early snows arrived with the early cold in the North-central region affecting corn, soybeans, spring wheat and small grains, there and in parts of the Canadian Prairies.

The yield estimate on October 10th marks the first season in 6 years below the trend line.

Production estimates are down slightly but are expected to decline further after the effects of the early cold and snows are considered.

The soybean yield also is below trend line for the first year in 6 years. Projected soybean production is down more than corn production.


More areas will see below freezing temperatures and even snow before November.


Summary and Conclusions
It is notable that crop planting has occurred one month later-than-usual in the North-central growing areas of North America in both 2018 and 2019. While warm summer weather saved the 2018 crop, in 2019 the Northern corn and soybean harvests were devastated by a cold summer and early cold weather. In 2019, there were many more record U.S. all-time daily low temperatures than record highs. These events may just be weather, not climate, or they could be the early indicators of global cooling.
Appendix – Other Predictions of Global Cooling, In Chronological Order Since 2003:
In 2003, Dr. Theodor Landscheidt wrote a paper predicting serious global cooling:
“Analysis of the sun’s varying activity in the last two millennia indicates that contrary to the IPCC’s speculation about man-made global warming as high as 5.8° C within the next hundred years, a long period of cool climate with its coldest phase around 2030 is to be expected.”
In 2005, Piers Corbyn predicted cooling by 2040.
On the 2nd February 2005, he gave this presentation to the Institute of Physics Energy Management Group. It contained the following statement:
“In the next 5 or 10 years warming is likely to be maintained as a transpolar shift occurs. This will be followed by the magnetic pole moving away from the geographic pole, a decrease in solar activity, a Southward shift in the Gulf Stream and considerable world cooling by 2040 AD.”
In 2006, NASA predicted that
“Solar Cycle 25, peaking around the year 2022, could be one of the weakest in centuries”.
Khabibullo Abdusamatov and colleagues at the Russian Academy of Science stated in 2006:
“Global cooling could develop on Earth in 50 years and have serious consequences before it is replaced by a period of warming in the early 22nd century…
On the basis of our [solar emission] research, we developed a scenario of a global cooling of the Earth’s climate by the middle of this century and the beginning of a regular 200-year-long cycle of the climate’s global warming at the start of the 22nd century.”
Khabibullo Abdusamatov said he and his colleagues concluded that a period of global cooling similar to one seen in the late 17th century – when canals froze in the Netherlands and people had to leave their dwellings in Greenland – could start in 2012-2015 and reach its peak in 2055-2060.
He said he believed the future climate change would have very serious consequences and that authorities should start preparing for them today because “climate cooling is connected with changing temperatures, especially for Northern countries.
Nigel Weiss, University of Cambridge, stated in 2006:
“If you look back into the sun’s past, you find that we live in a period of abnormally high solar activity. Periods of high solar activity do not last long, perhaps 50 to 100 years, then you get a crash. It’s a boom-bust system, and I would expect a crash soon.”
Leif Svalgaard, Stanford University, stated in 2006:
“Sunspot numbers are well on the way down in the next decade. Sunspot numbers will be extremely small, and when the sun crashes, it crashes hard. The upcoming sunspot crash could cause the Earth to cool.”
In 2007, Lin Zhen-Shan and Sun Xian wrote in “Multi-scale analysis of global temperature changes and trend of a drop in temperature in the next 20 years”:
“… Signs also show a drop in temperature in China on century scale in the next 20 years. (4) The dominant contribution of CO2 concentration to global temperature variation is the trend. However, its influence weight on global temperature variation accounts for no more than 40.19%, smaller than those of the natural climate changes on the rest four timescales. Despite the increasing trend in atmospheric CO2 concentration, the patterns of 20-year and 60-year oscillation of global temperature are all in falling. Therefore, if CO2 concentration remains constant at present, the CO2 greenhouse effect will be deficient in counterchecking the natural cooling of global climate in the following 20 years. Even though the CO2 greenhouse effect on global climate change is unsuspicious, it could have been excessively exaggerated. It is high time to re-consider the trend of global climate changes.”
“Global temperature is certainly NOT primarily driven by increasing atmospheric CO2, because CO2 changes LAG global temperature changes in time, both in the ice core proxy record and also in the modern data record”
The Humlum etal 2013 paper does claim that but the correlation they use is spurious. Pls see
https://tambonthongchai.com/2019/09/04/correlation-analysis-co2-lags-temp/
Chaamful nonsense!
See the figure just after this sentence:
“The very close relationship of dCO2/dt (red) vs global temperature (blue) is clearly apparent. Major volcanoes (some VEI5 and most VEI6 events) disrupt the relationship.
,,, Integrating the dCO2/dt data gives changes in CO2, which lag changes in temperature by ~9 months.”
This is certainly not spurious correlation.
http://www.woodfortrees.org/plot/esrl-co2/from:1979/mean:12/derivative/plot/uah6/from:1979/scale:0.22/offset:0.14
Proof that this is not “spurious correlation.”
You guys really sometimes make me wonder.
There is some yearly variation in temperature (the SH is different from the NH and an oblique orbit, etc) and CO2 (more vegetation of the NH spring than the SH spring). They’ll have to correlate. This proves very little on anything, though.
The correlation does not prove causation. In fact when dealing with a correlation between two variables, the correlation does not indicate which variable is dependent, and which is independent.
Would it be correct to say that LACK of correlation DISPROVES a hypothesis?
Karl –
“In fact when dealing with a correlation between two variables, the correlation does not indicate which variable is dependent, and which is independent.”
It would be absurd to posit that the rate of change of CO2 is driving temperatures. If that were the case, CO2 could be pumped to arbitrarily high levels, and temperatures would fall back to the initial condition as soon as the pumping stopped, regardless of final concentration.
The rate of change relationship clearly establishes that it is the temperature driving CO2, and not the reverse.
The “relationship” you speak of is a correlation, and nothing more. Correlation does not prove causation which you think is the case. CO2 in fact could be driving temperature as the AGW hypothesis states, with radiative physics the underlying explanation.
You state: ” it is the temperature driving CO2″ which of course the chart does not show. Your claim might hold water if you said ” it is the temperature anomaly driving the rate of change of CO2.” But even that is not shown by the chart because it’s comparing a monthly anomaly with a time-averaged quantity. Apples and oranges.
“Karl October 30, 2019 at 1:05 pm
The “relationship” you speak of is a correlation, and nothing more. Correlation does not prove causation which you think is the case. CO2 in fact could be driving temperature as the AGW hypothesis states, with radiative physics the underlying explanation.”
__________________________________
Karl jette des bougies fumigènes:
Karl throws smoke candles.
When CO2 LAGS temperatures it’s not done with “correlation” –
it’s about causation.
And because CO2 LAGS the causation can only be “temperatures”.
The bougies fumigènes won’t help Karl: 1st he’s to answere CAUSATION!
I am not sure that TSI is the real correlation, ie not on it’s own.
There are too many other things going on like UV changes, Solar Wind and Cosmic Radiation that are all intertwined with TSI.
I think Solar Output would be more correct.
AC – can you provide a data source for “Solar Output” please?
https://science.nasa.gov/science-news/science-at-nasa/2013/08jan_sunclimate
Thank you AC – but the only measure I see in your reference is to TSI.
That is not “proof”, it is a visual demonstration, though I think the claim is basically sound.
There is a short term correlation of dCO2 and SST:
https://climategrog.wordpress.com/dco2-hadsst-ersst/
There is also an underlying , long term rise is sCO2 which may also be related to the long term rise in SST but with a different scaling. It remains to be demonstrated that these two arbitrary scalings are physically meaningful and provide a complete explanation of the dCO2 SST relationship.
None of this fiddling with graphs and arbitrary scaling is “proof” of anything.
Greg wrote:
“None of this fiddling with graphs and arbitrary scaling is “proof” of anything.”
Semantic nonsense Greg. As you may know, we actually cannot “prove” a hypothesis, we can only falsify it (Popper), but the subject relationship “dCO2/dt vs temperature” is strong supporting evidence in favour of my hypo, and all the evidence to date refutes the alarmist CAGW hypo.
That graph is not “proof.”
..
First, dCO2/dt removes the trend.
..
Second the relationship is NOT between dCO2/dt and temperature, it is between dCO2/dt and an anomaly
The trend in dCO2/dt and in temperature anomaly match when one scales the variation to match.
Tell all of us with inquiring minds how you “scale” a time series variable with a monthly value with another time series variable that is a sliding 12-month average?
That graph does not show which variable is dependent and which one is independent.
More nonsense from Karl, who wrote:
“That graph does not show which variable is dependent and which one is independent.
Temperature changes lead, CO2 change lag- the future cannot cause the past.
You posted: “CO2, which lag changes in temperature by ~9 months.”
..
All that means is that CO2 LEADS by 3 months on an annual basis.
..
Again, the chart does not show which variable is independent.
“Cooling… It May Have Already Started”
There is a (Caps) sarc warning missing from this post.
“All that means is that CO2 LEADS by 3 months on an annual basis.”
No. It is not symmetric year to year. If you lag it 9 months, you’ll get good correlation with high SNR frequency components. If you lead it by 3 months, not so good.
It’s not really a time lag, but a phase lag, and the phase lag is 90 degrees. That is why the CO2 rate of change matches the temperature anomaly. For a linear, minimum phase system, a constant lag from input to output of 90 deg implies the input is the derivative of the output.
The time lag of 9 months is simply the lag of observed frequency components. Apparently, Allan is focusing on strong components with a frequency of about 1/3 years^-1. That means a time lag of phase in radians/radial frequency = (pi/2)/(2*pi/3) = 3/4 years = 9 months. If you look at other frequency components, you will get different time lags, but the phase lag is always 90 deg.
You are dead wrong Bartemis. There is an “annual” signal clearly visible here: http://www.woodfortrees.org/plot/esrl-co2/from:2015
..
That is a sine wave superimposed on a rising trend. This is the reason why dCO2/dt obscures reality.
What is even worse is the doing a 12-sample average in the chart. (mean:12)
So, any/all of your talk about “phase relationships” is invalid when aligning a monthly time series with another time series that has a 12-month running average, and all trend information removed.
Bartemis, when you compare apples to oranges, at least your are comparing two fruits. With Mr. Macrae’s chart he’s comparing apples to cinder blocks.
Allan,
In discussing warming and temperature most people on both sides of the argument never mention pressure. Anyone with any knowledge of physics knows that pressure and temperature have a proportional relationship as shown with the gas laws. There is no such thing as average temperature anymore than any other sort of weather and just to look at pressure systems at this link earth.nullschool.net/#current/wind/isobaric/1000hPa/orthographic=-243.87,8.27,333
should convince anyone that it is wrong to consider any silly notion of average weather. With 55 years in aviation and a long airline career I know there is no average weather including temperature. Here is another little gem on the BOM in Australia joannenova.com.au/2019/10/the-australian-bureau-of-met-hides-50-years-of-very-hot-days/
95% OF THE ARTICLE IS EXCELLENT — better than most articles here … but I have a big issue with climate predictions, in general.
They are so often wrong — about 100% of the time — that they are a waste of time to write about, and to read.
We have over 100 years of adding man made CO2 to the atmosphere, decent near-global weather satellite temperature data since 1979, and rough temperature data from 1940 to 1979 (I don’t trust surface data before 1940).
My only complaint about the climate in Michigan, where I live, is: WHERE IS THE GLOBAL WARMING we’ve been promised ?
2019 has been our coldest year since I moved here in 1977, and I want to file a complaint with someone!
DO COOLING TRENDS MEAN ANYTHING ?
There was a mild cooling trend from 1940 to 1975 ( which may be “adjusted” away before the ink on this comment dries, by those smarmy government bureaucrats! ).
So, what did that 35-year slight cooling trend mean for the long term global average temperature trend ?
Apparently, not much — it was followed by a faster warming rate after 1940, than before 1940.
.
.
I’ve been reading climate science articles and studies, as a hobby, since 1997.
The most important thing I learned was that climate change physics is not thoroughly understood, so it is impossible to build a real climate model, or to make real climate predictions.
The so-called “models” are just the opinions of the people who programmed them, falsified over many decades, by the inaccurate predictions.
WITHOUT a thorough understanding of climate change physics, climate predictions are just guesses.
And they are meaningless even if the guess turns out to be right … because a correct prediction made without sufficient knowledge , is just a lucky guess.
By the way:
I favor more CO2 in the atmosphere, to ‘green’ our planet, if added from burning fossil fuels USING modern pollution controls.
The “coming climate crisis” is the biggest science fraud in history.
There could be a climate crisis in the future, such as a much colder climate after Holocene inter-glacial ends … but currently, no human has the knowledge and ability to predict the future climate.
No human even has the ability to predict whether the climate will be warmer, or cooler, in 100 years.
Uunfortuneately, that lack of climate change physics knowledge does not stop all the wild guess predictions, and climate change scaremongering.
So here we are, living in the best climate for humans and animals since the late 1600s, but it’s very difficult to enjoy our wonderful climate, because so many smarmy leftists are constantly bellowing about a “coming climate crisis”, that they do not have the ability to predict !
You and I are very similar. I too have been reading climate articles and studies for many years as a hobby. I have come to the same conclusion as you. Prediction is impossible with our current data sets and understanding of atmospheric physics.
I could have written this myself..
The cross-correlation diagram that Prof Murry Salby exhibits in his presentation shows :
– a positive correlation between T and CO2 with a lag of some 10 months (right part of the diagram),
– conversely the left part of the diagram shows no correlation between CO2 and T (or a weak negative correlation with a lag of some 16 months).
https://youtu.be/2ROw_cDKwc0?t=561
Therefore, according to this data analysis, the “Atmospheric CO2 concentration increase causes global T increase in the lower troposphere” hypothesis is inconsistent with actual physical Earth’s data analysis and any theory trying to explain this assumption can’t be anything but wrong of incomplete.
Furthermore, if any assumption could be done based on this data analysis, is that CO2 seems to act – if anything – as a negative feedback with respect to global temperature variations.
Many actual scientists found comparable results (CO2 has a cooling effect on the atmosphere) decades ago. See for example :
– Manabe & Möller 1961 : On the radiative equilibrium and heat balance of the atmosphere. (See paragraph “Heat budget” and discussion of the results).
https://journals.ametsoc.org/doi/abs/10.1175/1520-0493%281961%29089%3C0503%3AOTREAH%3E2.0.CO%3B2
– Kondratyev – 1969 : radiation in the atmosphere.
Plass’, Goody, Möller, Manabe, etc. all agreed at the time that CO2 has a cooling effect except in the tropical tropopause aera, where some disagreed (Goody, Plass’, see the paper above) :
– we now know that this “hot spot”, that the IPCC claimed decades ago that it would be an evidence of the CO2 warming effect, actually, does not exists.
chaamjal et al.,
CO2 changes do lag temperature.
This has been known since 1990 when Kuo et al. published their seminal analysis; ref.
Kuo C, Lindberg C & Thomson DJ, “Coherence established between atmospheric carbon dioxide and global temperature”, Nature, volume 343, pages709–714, 22 February 1990
Their paper can be obtained from https://www.nature.com/articles/343709a0.
Its Abstract says,
“The hypothesis that the increase in atmospheric carbon dioxide is related to observable changes in the climate is tested using modern methods of time-series analysis. The results confirm that average global temperature is increasing, and that temperature and atmospheric carbon dioxide are significantly correlated over the past thirty years. Changes in carbon dioxide content lag those in temperature by five months.”
Subsequently, several other studies have confirmed the work of Kuo et al, and determined that the length of the lag varies with distance from the equator.
Humlum et al, published a nonsense paper attempting to refute this body of observational evidence, but other than several refutations
( e.g. see https://www.sciencedirect.com/science/article/pii/S0921818113000908 )
it has been generally ignored.
Richard
Everybody,
Aaaargh! I made a typo,. and thus wrote the opposite of what I intended.
Chaamjal had claimed that because Humlum et al. (2013) was wrong there was no evidence of the lag of CO2 changes behind Temperature Changes.
My reply explained there is a body of evidence accrued over decades in support of the finding of Kuo et al. (1990) that CO2 changes lag behind Temperature Changes. And I wrote,
“Humlum et al, published a nonsense paper attempting to refute this body of observational evidence, but other than several refutations
( e.g. see https://www.sciencedirect.com/science/article/pii/S0921818113000908 )
it has been generally ignored.”
I intended to write,
“Humlum et al, published a nonsense paper attempting to support this body of observational evidence, but other than several refutations
( e.g. see https://www.sciencedirect.com/science/article/pii/S0921818113000908 )
it has been generally ignored.
Sorry!
Richard
Richard S Courtney – October 28, 2019 at 2:14 am
I can agree with the above, ….. but not this, to wit:
Especially when MacRae and D’Aleo claim it is a 9 month lag, to wit:
Excerpted comments: By Allan MacRae and Joseph D’Aleo, October 2019
The above is highly interesting because of the claims, to wit:
A. how can one claim a very close relationship between CO2 and global near-surface air temperatures when said temperatures are little more than guesstimates.
B. when the 12 month delta portrayed by the KC graph is nothing more than a plotted visual “seasonal sawtooth” representation of the temperature producing bi-yearly or 6 month cycling of atmospheric CO2 ppm.
C. how is it possible for CO2 to lag temperature by 6 months, …… or by 9-months ….. when the KC graph proves that CO2 lags seasonal temperature changes by a couple or 3 weeks to a month or so.
And likewise whenever volcanic particulate causes near-surface temperature decreases within a couple or 3 weeks to a month or so after an eruption.
Samuel C Cogar,
You comment on my report of the seminal work of Kuo et al. and reply,
“I can agree with the above, ….. but not this, to wit:
“Changes in carbon dioxide content lag those in temperature by five months.””
Especially when MacRae and D’Aleo claim it is a 9 month lag, to wit:”
It seems that you missed my writing immediately after quoting the Abstract of Kuo et al. (1990),
“Subsequently, several other studies have confirmed the work of Kuo et al, and determined that the length of the lag varies with distance from the equator.”
Richard
@ur momisugly Richard S Courtney
Nope, don’t be talking silly, ……. I didn’t miss it. It was inconsequential to the 1st claim.
“Changes in carbon dioxide content lag those in temperature by five months.””
verses:
“, and determined that the length of the lag varies with distance from the equator.”
Richard, but don’t get confused, …. I agree with said “lag from equator” because it CONFIRMS my claim that the ocean water temperature drives the atmospheric CO2 ppm increases/decreases. RAH RAH RAH
But Richard, iffen you are an avid believer of the CAGW junk science claim that the “green growing/dying biomass” of the NH drives the atmospheric CO2 ppm increases/decreases …… then you have a real serious problem with your stated “distance from the equator” claim.
Don’tja think?????
“Samuel C Cogar October 29, 2019 at 5:05 am
@ur momisugly Richard S Courtney“
____________________________
Samuel C, all Richard said was
– 1st CO2 lags temperatures at the Equator
– 2nd temperature rise distant to Equator lags temperature rise at the Equator
which gives
– 3rd CO2 rise lags temperature distant to Equator lags CO2 rise at the Equator – lagging temperature rise at the Equator:
Everywhere: CO2 rise lags temperatures rising.
Obviously you did not read or under stand Humlum et al’s paper.
It is very difficult, possibly impossible for cult of CAGW scientists to do real science.
The entire CAGW team have ignored the recent observation that C14 (C14 from the atomic bomb test) has made it way down to the deepest ocean with no delay, disproving the CAGW necessary Bern model of CO2 sources and sinks and resident times.
The carbon 14 is carried down to the deep ocean by particular organic carbon which absolutely disproves the CAGW so called Bern model of CO2 sources and sinks.
Odd also that there is a paper from 1990 that estimates 130% of the atmosphere pool can sink to the bottom of the ocean in less than a year (Toggweiler)
CAGW requires that humans cause the majority of the CO2 rise which required the cult of CAGW to create the non-physical so-called Bern model (named after a city) of CO2 sources and sinks which assumes that ocean circulation (with hundreds of years delay) is the only method of deep sequestration of CO2 in the ocean.
Based on a half dozen independent analytical techniques and different measurements, humans are responsible for less than 15% of the recent rise in atmospheric CO2.
Analysis of yearly changes in the CO2 shows that the majority of the rise in the atmospheric CO2 is caused the increase in temperature.
This is an interesting summary of the Monkey business concerning the creation of the Bern model and past cherry picking of CO2 data to create the CAGW paradigm.
Carbon cycle modelling and the residence time of natural and anthropogenic atmospheric CO2: on the construction of the “Greenhouse Effect Global Warming” dogma.
https://www.co2web.info/ESEF3VO2.pdf
The Bern model assumes that ocean circulation (with hundreds of years delay) is the only method for deep sequestration of CO2 in the ocean.
The alleged long lifetime of 500 years for carbon diffusing to the deep ocean is of no relevance to the debate on the fate of anthropogenic CO2 and the “Greenhouse Effect”, because POC (particular organic carbon; carbon pool of about 1000 giga-tonnes; some 130% of the atmospheric carbon pool) can sink to the bottom of the ocean in less than a year (Toggweiler, 1990).
https://www.livescience.com/65466-bomb-carbon-deepest-ocean-trenches.html
Bomb C14 Found in Ocean Deepest Trenches
‘Bomb Carbon’ from Cold War Nuclear Tests Found in the Ocean’s Deepest Trenches
Bottom feeders
Organic matter in the amphipods’ guts held carbon-14, but the carbon-14 levels in the amphipods’ bodies were much higher. Over time, a diet rich in carbon-14 likely flooded the amphipods’ tissues with bomb carbon, the scientists concluded.
Ocean circulation alone would take centuries to carry bomb carbon to the deep sea. But thanks to the ocean food chain, bomb carbon arrived at the seafloor far sooner than expected, lead study author Ning Wang, a geochemist at the Chinese Academy of Sciences in Guangzhou, said in a statement.
William Astley,
I read it and I understood it.
I am willing to debate that paper with you but I refuse to engage in slanging match with you because it is not worth the bother.
Richard
Richard,
You need more facts and an alternative hypothesis. The cult of CAGW are 100% incorrect about everything.
Cooling is going stop all this CAGW nonsense. I will start a thread when there is cooling.
Atmospheric CO2 levels in the last 20 years, correlate with planetary temperature changes and planetary temperature changes correlate with mid-ocean seismic activity which in turn correlates with mid-ocean heat release.
https://www.omicsonline.org/open-access/have-global-temperatures-reached-a-tipping-point-2573-458X-1000149.pdf
Namely, increased seismic activity in the HGFA (i.e., the mid-ocean’s spreading zones) serves as a proxy indicator of higher geothermal flux in these regions. The HGFA include the Mid-Atlantic Ridge, the East Pacific Rise, the West Chile Rise, the Ridges of the Indian Ocean, and the Ridges of the Antarctic/Southern Ocean. This additional mid-ocean heating causes an acceleration of oceanic overturning and thermobaric convection, resulting in higher ocean temperatures and greater heat transport into the Arctic [2,3]. This manifests itself as an anomaly known as the “Arctic Amplification,” where the Arctic warms to a much greater degree than the rest of the globe (Table 1) [4,5].
It is fact that there has been a 300% increase in the frequency of earthquakes (no increase in the magnitude, just an increase in the number of earthquakes which correlates linearly with amount of energy that is required to cause the earthquakes and move the ocean plates) that occur at the edges of mid-ocean ridges, at near the ridge where ocean plates are pushed apart, all over the planet.
What is interesting is geology does not have an explanation as to what generates the force to move the tectonic plates, before the observation that the frequency of mid-ocean earth quakes increased by 300% average for 20 years.
The lack of a forcing mechanism explains why the theory of plate tectonics took so long to be accepted.
http://www.davidpratt.info/tecto.htm
I am very thankful that my little niche in the american midwest has produced a good crop of corn despite the conditions, thanks to a replant in May.
The potential crops lost to flooding here at the junction of the Mississippi, Illinois and Missouri rivers are considerable, just as they are all the way up the Missouri.
I think there should be federalization of flood plains and the removal of levees protecting croplands, with fair prices paid to the owners and first dibs on leasing the land at a low price during low water. The breaching of levees protecting river towns would be greatly reduced.
In my corner of the world we had a late killing frost, followed by one of the driest coolest summers in a long time, followed by heavy rains and an early spring blizzard. We have had snow on the ground for two weeks now. Winter is firmly here. Overall it has been a bad year but nothing is record breaking. Every nasty event has happened before in the last six decades.
“climate computer models used by the IPCC and other global warming alarmists employ climate sensitivity values 3-to-5-times higher than 1C/doubling, in order to create false fears of dangerous global warming”
The connection from fossil fuel emissions to co2 driven warming cannot be made without the use of spurious statistics. The issue is not what the value of the climate sensitivity is but whether the climate sensitivity is a relevant issue. Pls see
https://tambonthongchai.com/2018/12/19/co2responsiveness/
https://tambonthongchai.com/2018/05/06/tcre/
https://tambonthongchai.com/2018/09/08/climate-change-theory-vs-data/
https://tambonthongchai.com/2018/09/25/a-test-for-ecs-climate-sensitivity-in-observational-data/
https://tambonthongchai.com/2019/09/21/boondoggle/
Interesting article. I didn’t know the United States constituted the world, as this author seems to believe. Wonderful to have those Soybean numbers, and the author seems to have other agricultural skills; cherry picking.
Tony wrote this nonsense:
“I didn’t know the United States constituted the world, as this author seems to believe.”
How about if you state what you believe, and I will state what I believe. That is much more rational.
I do not believe that the USA is the whole world, perhaps because I’ve seen the whole world, or most of it (6 of the 7 continents) and it is definitely bigger than the USA. 🙂
“I didn’t know the United States constituted the world”
Well, as regards the U.S. surface temperature chart, it *does* “constitute” the world, as all the unmodified regional surface temperature charts from around the world resemble the temperature profile of the U.S. surface temperature chart, i.e, the 1930’s was as warm or warmer than temperatures today.
That’s unusual. My post above was edited by someone (maybe). I’ve never had a post edited before in all the years I’ve been here. The edit left out another paragraph I had written and it left out the four links I provided to surface temperature charts from around the world.
Any explanation for that Mods? I assume it was some kind of mistake because there was nothing in the edited part that was offensive and I’ve posted four links at a time in the past without any problem. So, like I said: Unusual.
Nevermind Mods (others). I found the post I was referring to farther down the thread. It was not edited, I just happened to write very similar things in two posts and got them confused.
Sorry about that.
Prior to about 1940, the US record was practically the world’s records…with over 80% of the whole world’s records. The entire continent of Antarctica had one thermometer until just before 1930. And even to this very day ARE NOT SUITABLE for the determination of Global Average Temperatures (properly cited automated modern stations would provide 24 hour integrated temperatures providing for a better assessment of temperatures all day compared to the current “High/Low” reporting).
That’s why the surface record is so often referred to as “guesstemp”.
“Prior to about 1940, the US record was practically the world’s records…with over 80% of the whole world’s records.”
That’s true. One thing that is not often mentioned about the records from other parts of the world during this time period is that although they are few and far between, they all resemble the U.S. surface temperature profile where the 1930’s shows to be as warm as today and dispels the myth that today is the hottest period in history. It was just as hot in the 1930’s, and we have charts to prove it..
And where did our Alarmist Climate Gurus get the data for their “Global Temperature Average”, why from these very records. They then took these records, bastardized them, and turned them into a global surface temperature average and a Hockey Stick chart that doesn’t resemble reality.
Here’s the real global surface temperature profile, the U.S. surface temperature chart. All the old, unmodified charts from around the world resemble this one. They do not resembel a “hotter and hotter” alarmist Hockey Stick chart.
US chart:
If a few trees rings can be a proxy for the world, how can an entire continent not be?
IOW…can anyone explain how an entire mid-latitude continent can have a different temperature trend from the planet it is sitting on, over a multidecade period spanning over 100 years?
A few years here and there is one thing, but when the entire record is looked at in unadjusted form, it is clear that the pattern of warming and cooling is highly correlated.
How could it be otherwise, being that the jet stream carries air masses around the planet in a matter of a week or two, and the primary cells (Hadley, Ferrell, Polar) likewise distribute heat around the planet on other time scales?
Pre-global-warming-alarmism-era graphs of global, hemispheric, and US temps closely match the patterns seen in most individual locations from all over the Earth.
And they are concordant with historical accounts of ice changes, patterns of heat waves, etc.
All that really varies are the exact years of the inflection points, and the magnitude of the variations, with polar locations tending to show larger trends, and equatorial locations showing smaller ones.
Continental interiors likewise tend to show exaggerated variations as compared to locations closer to the moderating effect of oceans and seas.
This concordance disappears in adjusted data sets.
“The Real Climate Crisis Is Not Global Warming, It Is Cooling, And It May Have Already Started”
No evidence in UAH data that cooling has started.
https://tambonthongchai.com/2019/07/23/cooling/
Emailed earlier today to my friend Madhav Khandekar:
Hi Madhav,
It is difficult to argue with UAH satellite data, which shows some warming, although in a step-down pattern, but as we said in our article:
“For the past ~five years, MacRae has written that global cooling would start closer to 2020. This global cooling will start sporadically, at different locations in the world.”
I think Earth is shedding heat now in this step-up/step-down pattern – I think we are in a transition zone now – we’ll see.
Best, Allan
So you admit the claim “it is cooling” is unsubstantiated at this point. But like other modellers you expect it is just about to happen. Excuse me of being equally skeptical of both claims.
Once again, climate models to not employ “assumed values of climate sensitivity co CO2”. It is an emergent property. Please get back facts right, if you want your claims to be taken at all seriously.
What the do “assume” is faked parameters for other forcings such as the scaling of AOD to radiative forcing which ARE and input to the models. Around 2000 AD, Hansen’s group dropped basic physics and observational estimates of this scaling and instead tweaked it, and other parameters, with the declared object of “reconciling” model output with the climate record.
In effect this change means they are increasing the climate sensitivity to volcanic forcing. The means they will need to tweak other factors to produce a model more sensitive to an opposing or warming forcing. We know which that has to be.
So modellers are not “assuming” high sensitivity to CO2 , they are creating conditions where that will emerge from the model by rigging other parameters.
The repeated use of atmospheric temperatures (without any regard to enthalpy) as a guide to the heat content of the Earth’s climate systems which includes the oceans is one of the problems. Heat in the atmosphere is on its way out of the Earth system to space. Warm winds blowing over the ocean will cause more evaporative heat loss for the oceans than cold winds, so the Earth climate system will be cooled by a warm atmosphere not warmed, and that should include the albedo effect of increased cloud. This is the activity of the largest of Earth’s cooling systems, the hydrologic cycle.
As the top 6 meters or so of the oceans have a higher heat content than the entire atmosphere, more emphasis should be put on the ocean heat content, and not just ocean surface temperatures.
Greg wrote: “So modellers are not “assuming” high sensitivity to CO2 , they are creating conditions where that will emerge from the model by rigging other parameters.”
Mere semantics Greg. The climate computer models are nonsense – they “employ” (is that better than “assume”?) values of climate sensitivity that are much higher than the MAXIMUM probable climate sensitivity, which is about 1C/doubling of CO2.
Repeating from the paper:
“The failed CAGW hypothesis assumes that increasing atmospheric CO2 from fossil fuel combustion drives dangerous runaway global warming. The alleged evidence for this fraud is climate computer models that greatly over-predict current observed warming, typically by 300 to 500%. These climate models deliberately employ excessively high assumed values of climate sensitivity to CO2, and are designed to create false alarm.”
So you are claiming that a signal trend of .03C is detectable?
Looks like noise to me.
Try not to confuse reported instrument resolution with accuracy.
This seems to be a common thread in current climate science.
From Dr. Roy Spencer
“Because of various radiometer-related and antenna-related factors, the absolute accuracy of the calibrated Earth-viewing temperatures are probably not much better than 1 deg. C. ”
http://www.drroyspencer.com/2010/01/how-the-uah-global-temperatures-are-produced/
Since I think I’m the only one who’s mentioned 0.03C, I guess you are referring to that. As I stated, it is a residual – ie noise or small undetected cycles.
OK. Tracing indents, seems it was something chaamjamal linked to.
Correct.
chaamjamal linked to:
https://tambonthongchai.com/2019/07/23/cooling/
And declared “No evidence in UAH data that cooling has started. ”
I looked at the charts, saw that the were anomalies over a 30 year period
and concluded that there was no evidence of anything.
Folks are trying to ferret out a .001 degree signal when the instrument is only accurate to 1 degree.
Game on. We need a really cold winter to shut up these urverdammnis politicans.
We need a really cold winter to shut up these urverdammnis politicans.
A as in One cold winter? It’s going to take way more than that.
You got it. If the MSM doesn’t even report colder temperatures, such as —4F at West Yellowstone this morning, or any number of indicators of a cooling climate, why would we believe anything will change. The stand up and salute narrative of warming will be the default story for decades.
If it gets really bad, like a mile of glacial material burying Al Gore’s house, then maybe the public will catch on.
In the meantime, I’m not holding my breath.
The good news is that if cooling is coming, at least we will be able to see if you are holding your breath…
Ask the people in Denver about an early winter this year. The best part is all those people in Boulder are freezing their butts off. Haven’t seen any outdoor Climate Change demonstrations there in the past couple of weeks.
cerescokid, –4F is -20°C.
That’s REAL cold.
https://www.google.com/search?client=ms-android-huawei&sxsrf=ACYBGNQdk3GZoh2OcryYReq7bVJlJhiWwg%3A1572873251698&ei=IyTAXfigKtOHwPAPtu6R-Ak&q=-4+Fahrenheit&oq=-4+Fahrenheit&gs_l=mobile-gws-wiz-serp.
Agreed.
It will take a multiyear cooling trend that shows global temps falling below the long term averages on a sustained basis to change anyone’s mind, if then.
Short term changes are not the issue, and so will not resolve anything.
We had a really cold winter in the eastern part of US/Canada in 2015 – extremely cold and lasted forever. There may have been another one since but I remember that one as being out of the ordinary in both cold and duration of cold temps.
MSM and green blob still claimed that these kinds of winters are the results of global warming wreaking havoc on the planet. So, don’t hold your breath. They have lied for years about this hoax, so why stop now…
Hi Walter.
In 2019 the Canadian prairies had the coldest February in 70 years. It was brutal.
We hardly had any summer in Calgary – I think there were a few days in August that felt a bit like summer.
Best, Allan
Here on the prairies, we almost had a frost in August, and did have one in September. I actually put the winter tires on the car in September, for the first time ever.
But, hey, it was the warmest year ever or something.
And the cold is due to Global Warming, according to the alarmists.
“But, hey, it was the warmest year ever or something.”
Months. NASA Climate and NOAA are reduced to declaring months as “the hottest month evah!” since they haven’t been able to declare a “hottest year evah!” since 2016. “Global” temperatures are down about 0.4C since 2016 according to the UAH satellite chart..
On August 18th, it was 26 degrees in Tok AK
The hysteria is like seasonal influenza, it migrates to the S H.
In the twin city metro area of MN, the last 2 winters have been awful. Each producing a depressing whopper April snowstorm.
I don’t want a third 😡
Hate to break it to ya, but prepare for it, and a fourth, and a fifth – ad nauseum!!!
Derg, don’t believe “tomwys October 28, 2019 at 8:47 pm
Hate to break it to ya, but prepare for it, and a fourth, and a fifth – ad nauseum!!!”s kidding you;
We’re already through with La Niña phase, gathering warmth during El Niños.
Nonetheless this one could get a hard winter too: due to atmospheric humidity, precipitation.
It is -9 degrees C here in mid-Saskatchewan…I woke this morning at 7:00 am to an 18-inch snowdrift across my driveway. The wind chill has bitterly driven the temperature down. This all follows an ice rain about three days ago that froze on the roads — and then turned to snow. It has been snowing since then, needless to say, the roads are treacherous and I am sure this is the low point of a failed solar cycle.
It is going to get very cold.
It is -10C in Calgary now, at 1pm.
I am already sick of winter.
Minus 16C in Calgary this morning. I’m really really sick of winter.
Just received this email:
Global warming causes early snow storms out west:
“Here in Saskatchewan, we didn’t even get the crop off before the steaming hot snow covered it.”
My comment:
I am convinced that the global warming extremists fully understand that they are deceiving the public for their own political and financial objectives – nobody could be this stupid for this long.
Mr. Sobchak:
We in the US are living in an unusually cold year — from January 2019 through August 2019 was a record cold January through August (based on daily maximum temperatures from the USHCN weather station network, since 1895 — not every state set a record, but about 2/3 of the surface area of the 48 continuous states did).
Did anyone but me know this ?
Did anyone else care ?
Don’t jump to a conclusion that “a really cold winter” will make a difference, because the government bureaucrat scientists who predict a lot of global warming … also OWN the historical temperature data, and they are NOT afraid to “adjust” it … again and again !
It might feel like a cold winter on the land, but remember that the oceans cover 71% of our planet, and they can be made “warmer” by a bureaucrat’s “stroke of a pen”, just like they did in 2015, to “officially” end “the pause”.
This is politics, and junk science, not real science !
I think a really cold winter on the US east coast would be helpful. This is where all the media folks live. Having them deal with snow, sleet and ice for a couple of months would get their attention.
I would love to see an omega pattern set up over the US. That would make both coasts colder than average. Sorry to wish this on those of you who haven’t bought into the hype, but hopefully this would do a lot of damage to the propagandists.
Do we get an omega block in 2019:
https://www.google.com/search?q=do+we+get+an+omega+block+in+2019&oq=do+we+get+an+omega+block+in+2019&aqs=chrome.
It’s amazing you say that.
REGARDLESS of what the weather is like in the next several years, it will be blamed on climate change caused by human activity and CO2 (regardless if CO2 levels increase, decrease or stay the same).
Too hot/cold, wet/dry, snowy/no snow. stormy/no storms, windy/no wind, hail/no hail…………….. it makes no difference.
It AGW religious zealots (i.e., left wing fanatics) will blame it on human caused climate change because the AGW movement is a POLITICAL movement.
We’ve passed the peak of the modern warm period.
I’ve analysed the southern ocean surface temperatures (SST) using an algorithm optimised for extracting cyclic components longer than the data period. It was designed to decompose vocal tract resonances for my PhD in automated speech recognition (100-200ms speech segments between glottal excitations) and applied as-is to the SST data.
It extracted 800y, 200y, 60y, 30y, and 11y cycles in order of decreasing strength leaving a 0.03C mean residual. The SST can be viewed as a smoothed basal temperature of the Earth. The circa-800y cycle matches the thermohaline ocean currents.
http://brindabella.id.au/ftp/SST+C14.png
Suppose that you have a triangle wave. Your sampling window is only wide enough to contain less than half a cycle. The signal in the window is just a monotonously increasing time series. It doesn’t have any inflections.
What will your software do with that.
Wouldn’t like it at all 🙂
In the domain it was built for the signal was constrained to a few resonances, coloured noise, or bursts which were handled separately. SST is more cleanly cyclic than speech so it worked.
The use of language that appeals to emotions does not belong to science. Please, do you not words like fraud. Let the evidence guide the reader.
Read the Climategate emails, referenced in the report.
FRAUD.
https://climateaudit.org/2007/11/06/the-wegman-and-north-reports-for-newbies/
FRAUD
Hey , Global : tell that to the alarmists . It is all they have !
Fraud is what is occurring, so how can anyone be guided to the correct conclusion without mentioning it?
OK. If you don’t like calling it a fraud, how about calling it what it is, which is a criminal conspiracy? The IPCC/UNFCCC, the political left and the MSM are all colluding towards perpetrating a financial crime against the developed world that makes Bernie Madoff look like a petty thief. While the IPCC/UNFCCC are fully conscious of this, I’m not sure that the political left and its lackey MSM understand the extent to which they are being manipulated towards the repressive agenda of the IPCC/UNFCCC.
Sugar coating the malfeasance only reinforces the alarmists who clearly have no qualms about using inflammatory rhetoric against skeptics. It’s important to counter their rhetoric on the same terms and not allow them the exclusive use of manipulating emotions to gain support for their position.
Sure, inflammatory rhetoric doesn’t belong in science, but that’s all the alarmists have and taking the high road on this isn’t working.
Not only it is the greatest scientific fraud but is also the greatest economic fraud in history. The lost economic costs are incalculable. See Bastiat.
FRAUD
😎 ✔ Moderator, please delete this comment.
+1 Well said.
We are getting full press climate alarmism. They have switched the limit down from 2°C to 1.5°C. They are desperate. They know, or at least strongly suspect, that the jig is up.
The solution to CO2 is nuclear power.
I was very happy to hear a Canadian Conservative Party insider touting nuclear on the radio today.
CO2 doesn’t need a solution. Especially if the climate begins cooling we’re going to need all the plant fertilizer we can get for crop growth.
commieBob
“….the jig is up”
Precisely what I said when the lowered the limit to 1.5C. And haven’t they reduced that from the original number of 3C?
The best thing that can happen is that the world blasts through 1.5C and nothing happens. What do the idiots say then?
Tragically, however, sceptics are destined to wish for the very thing the world doesn’t want to make our point – global cooling.
How much money and resources have been wasted chasing the wraith of global warming, to the detriment of everyone’s children and grandchildren?
As realisation gradually dawns on the UK’s government at least, there will be a mad scramble for fracking, ignoring the wishes of the anti fracking brigade; there will be a knee jerk demand for nuclear, probably SMR’s which will be rushed online with risks not fully understood, and there will be accidents, because that’s what stupid governments do.
They did precisely the same thing with wind and solar, to everyone’s detriment. No cautious long term approach with a gradual winding down of fossil or nuclear facilities…….Just shut them all!
Even as a non scientist I recognise this as folly on a monumental level.
Perhaps the abandoned wind turbines littering our landscapes and oceans will serve as a reminder for generations to come.
“Tragically, however, sceptics are destined to wish for the very thing the world doesn’t want to make our point – global cooling.”
It’s not so much a wish for global cooling, but an understanding that periodic cooling and warming is what the climate does and next in the progression is cooling. The alarmists don’t understand this, for if they did and to be consistent with their position that CO2 emissions are warming the world, they would want us to emit as much as possible before the next, inevitable, ice age arrives, not that it would actually have any tangible effect. Kilometer thick ice bearing down on NYC is a lot more inconvenient then the worst case warming claims by the IPCC. Where are the Canadians on this? How about the Swedes, Norwegians and the other countries that were completely buried during the last ice age? Talk about potential climate refugees.
If we do hit a very fast and (literally) deathly cooling trend. And we need to go full bore, extracting coal as fast as possible and using the COAL AS A TRANSITION FUEL until nuclear, through necessity, is fully developed and utilized throughout any northern hemisphere country that wants to stay viable. Then I would want some sort of prescriptive mine labor to include Al Gore and Mike Mann.
(In turn, if the temp increases five degrees Celsius I will offer my free labor to wave a fan for those guys on hot days.)
A couple of Russian scientists back between 2005 to 2010, maybe a bit before, IIRC made a prediction of a cooling period similar to that of the 1970’s to start to make it’s presence felt around 2030-ish. I think they have it right as there does seem to be evidence in the past of a bit of a warm up just before a drop in to cold. Given we are still in an ice age, and we have been through well document cold spells in the past, this seems reasonable.
https://sputniknews.com/russia/2006082553143686/
2006, yup, I recon they are right too lasting beyond mid-21st century.
Yabut, you’re forgetting that the heat is going into the oceans now, through an unknown, magical process. CarbonHeat™ just “decides” where to go, and when. But wait, there’s more. It also has an uncanny and spooky way of hiding from us, so right when we least expect it, BOO! There it is, in your face. Be afraid, be very, very afraid.
I thought CarbonHetaInTheoceans (CHITo) went AWOL?
“heat is going into the oceans now,”…of all their stupid excuses….that one is on top
Looks to me like heat is coming out of the oceans right now. Not such a bad thing, really, if you want to keep the Earth, in general, warmer. If we’re lucky, things will stay warmer. Hooray for warmth!
However –
We know dick about what the climate is going to do as that’s the kind of thing that is measured in, multiple, human lifespans. Speculate all you want about what will happen, temp wise, in the next 5, 10, 20 or even 100 years. Go for it! Maybe it will cool off for a bit and then warm up and then get colder still after that.
Maybe.
Opinions vary.
What seems a certainty, no maybe about it, is that it WILL get cold and ice sheets will come to scrape away much of human civilization as we know it. Might be a few hundred or a few thousand years but the ice is coming eventually.
Oh, and the ones who are pushing the CAGW nonsense will give it up when they’re freezing and starving in the dark and sizing up their neighbors for a long pig BBQ.
Cheers
Max
TSI does not seem to be correlated with 40’s to 70’s cooling.
RE your statement:
“TSI does not seem to be correlated with 40’s to 70’s cooling.”
See Willie Soon’s three charts in the paper.
“TSI does correlate with 1940’s to 1970’s cooling.”
OK, I see that now. I was looking at the reconstruction: http://lasp.colorado.edu/home/sorce/files/2011/09/TIM_TSI_Reconstruction-1.png
The seasonal response of biomass to temperature can explain most of the shorter term lags seen in the Moana Loa data since without burning fossil fuels, atmospheric CO2 concentrations are roughly proportional to the amount of planet wide plant life. Two things contribute to this. First is that to support a larger biomass. more atmospheric CO2 is required and second, when there is more biomass alive, there’s more biomass decaying back into CO2 and CH4.
Similarly, the birth and death of forests takes centuries and can explain the multi-century lags seen in the ice cores. Note that the 800 year Vostok lag is too large and is an artifact of low CO2 sampling resolution in that core. Newer cores, for example DomeC, exhibit a lag closer to 2-3 centuries which is more compatible with the ebb and flow of forests as melting ice frees up land for new forests, while advancing ice slowly kills them off.
Yep I’m now in the ”cooling camp”
Maybe soon, maybe a couple of decades but co2 dogma is dying a slow agonizing death.
Actually, I would prefer it stay warm!
Excellent 20-minute video from 2015 by Prof. Carl-Otto Weiss – thank you Mike.
The really good stuff starts at about 11 minutes.
https://youtu.be/l-E5y9piHNU
Emailed earlier today to my friend Madhav Khandekar:
Hi Madhav,
It is difficult to argue with UAH satellite data, which shows some warming, although in a step-down pattern, but as we said in our article:
“For the past ~five years, MacRae has written that global cooling would start closer to 2020. This global cooling will start sporadically, at different locations in the world.”
I think Earth is shedding heat now in this step-up/step-down pattern – I think we are in a transition zone now – we’ll see.
Best, Allan
Surely that’s a non-falsifiable statement.
Please give me some falsifiable predictions.
I am a global warming sceptic, but also a global cooling sceptic.
Global cooling will start by 2020-2030, probably closer to 2020.
Free beer tomorrow.
The promise or intimation of free beer tomorrow doesn’t hurt me.
Taking my money & liberty today and telling me that in return I’ll get free beer sometime in the future is a pretty shitty thing to do. (And since they are planning on giving out only O’douls it is worse than shitty, it is a criminal lie)
Loydo, Macrae has been making the same prediction “cooling will start soon” now for 20 years. He’s been wrong for 20 years.
Who doesn’t like free beer?
“Please give me some falsifiable predictions.”
That’s oxymoronic language. Predictions can only be falsified (or verified) at the temporal intersection of reality and prediction.
Is there a global dataset of wet-bulb temperatures?
Jean
You might do better with temps, pressure, and humidity or dew point and calculate. My local station does not have WBT
https://www.easycalculation.com/weather/dewpoint-wetbulb-calculator.php
The idea that we humans are somehow idealised for a cool world, based on the climate over the past 50,000 years (or something) needs to the called out for the nonsense it is.
If you want to understand the conditions we have evolved for look at our evolved physiology: no protective fur or blubber (land whales excepted) and one of the most effective cooling systems of any creature; our whole bodies are a cooling evaporation plate. We can run down antelopes in a hot climate our refrigeration system is that good.
There’s no doubt we evolved for a warm/hot climate with reasonable available water. The fact we survived the last glaciation is down to intelligence, inventiveness, adaptive behaviour and in-group cooperation. The Neanderthals, arguably better suited to the cold, failed to make it though some of their DNA may survive among the climate apocolysts.
Humans are tropical animals. Without artificial aids (fire, clothing, buildings) they cannot survive a winter outside the tropics.
I read somewhere a couple of years ago that humans would die of hypothermia in most regions of the world without shelter, clothes and a source of heat. The excess winter deaths data for the UK and Europe confirms that. The deaths in winter predominantly affect people who would expect to live several more years whereas heatwave deaths affect people with underlying health issues.
Which makes a move to renewable and intermittent energy supplies a real threat to life and well being. Extinction Rebellion is well named, with extinction of the human race the goal.
Ben Vorlich
According to the Office for National Statistics, Excess winter deaths in the UK during 2017/2018 were 50,100. The lowest on record was in 2013/14 at 17,310.
However, the terrifying prospect of people dying during heat waves is quite staggering:
“According to the NDMA (India’s National Disaster Management Authority) heat waves in India have accounted for over 22,000 deaths since 1992. In 2015, 2,040 Indians died in shocking heatwaves. Recent years have seen declines, to 1,111 in 2016 and 222 in 2017.”
Yes, that’s two hundred and twenty two!
That’s strange, we are told a warming planet (which, the IPCC assures us, will occur predominantly in the Northern & Southern hemispheres, in winter, and at night) is a bad planet. Yet in 2017 the UK suffered 50,000 fatalities from cold (nor was it a particularly cold winter) and India, a country with immense poverty, ill equipped to deal with weather extremes, suffers 222 deaths from heat.
In 27 years India’s total fatalities from heat is only ~5,000 more than the lowest recorded UK deaths from cold in a single year.
“Based on 2005’s PPPs International Comparison Program, in 2011, the World Bank estimated that 23.6% of Indian population, or about 276 million people, lived below $1.25 per day on purchasing power parity.” (Wikipedia. I don’t like using it but sometimes it’s useful to get a feel for numbers).
Even were that 276 million figure halved between 2011 and 2019, the number of Indians living in poverty is still still more than twice the population of the entire UK, yet only 222 people died from heat.
You are of course welcome to verify these figures.
https://www.ons.gov.uk
https://ndma.gov.in/en/
Good post, thank you HotScot.
To clarify, the 50,100 Excess Winter Deaths that occurred in December 2017 through March 2018 was only for England and Wales – and did not include Scotland and Northern Ireland. That is about 35,000 more Excess Winter Deaths than the average per capita EWD rate for the USA or Canada, and it is a national tragedy and a national disgrace.
Excessively high energy costs in the UK are probably the primary cause of these EWD’s – remember this the next time you see demonstrators protesting the fracking of gassy shales, or protesting fossil fuels, or blocking traffic and blocking trains to “fight global warming”.
These anti-fossil fuel activists are by far the greatest killers in the UK, but since they kill off the elderly and the poor they get a free pass.
I’m with the good people of Canning Town.
https://youtu.be/9P1UXYS6Bmg
Best personal regards, Allan
Allan
Thanks for pointing out the missing Scotland and NI figures.
It really is a national disgrace, but the British government is so incompetent it can’t deal with the simple matter of a referendum and the resulting Brexit never mind care for the elderly and vulnerable.
“HotScot October 28, 2019 at 3:35 am
However, the terrifying prospect of people dying during heat waves is quite staggering:
“According to the NDMA (India’s National Disaster Management Authority) heat waves in India have accounted for over 22,000 deaths since 1992. In 2015, 2,040 Indians died in shocking heatwaves. Recent years have seen declines, to 1,111 in 2016 and 222 in 2017.”
Many many more people dies in poverty. Many many more people die as a result of not wanting to live in that poverty and commit suicide.
Patrick MJD
There is statistical analysis for those dying of suicide, but not their reasons given for committing the act. So quite how you can claim that people are killing themselves because it’s too hot I really don’t understand.
I have my doubts if there is a category of ‘Died from poverty’ as poverty isn’t a fatal condition. The causes may be malnutrition or disease, but unlikely to be ‘poverty’. So, again, interested where you get these claims from.
Waiting for Mosh-pup to make a one word drive-by….
Hello Mosh-pup… calling Mosh-pup.
Care to guess what the next 10-20 years of GMST looks like?
NOAA can mal-adjust GHCN only so much…
(cue: natural internal system variation takes over)
I doubt it not worth the argument … prediction made let it live or die by it 🙂
I’m signing off for the evening now.
PUULEASE read the paper and check the embedded references before commenting.
That will save all of us considerable time.
Ja. Ja. Click on my name to read my report about thr droughts that are coming.
The left needs to implement Green New Deal policies quickly in order to take credit for global cooling, which is inevitable.
Global cooling is not the real problem. It is the leftist political reaction to it that will be the disaster.
Exactly right. That must be why they have given the world a 12-year deadline for action to prevent a “meltdown.” The inner circle knows that after 12 years, it will be obvious (without a green deal as a smokescreen) that global warming is only the result of natural variability, and it is over for now.
Leftist politicians and “scientists” have continually given 5, 10, and 12 year deadlines for climate Armageddon. When they pass with no result, they set another. This is identical to doomsday cults, who set another deadline for the world’s end when the last one passes, pretending the last prediction never existed.
Recent weather in Washington State is cooperating with sporadic global cooling by suddenly giving a cold winter in February, 2019; a cooler than normal summer with much fewer triple digit temperatures than in the past; and now a cold fall with snow at the end of September.
“Climate Change” is a diversion from the most dangerous threat to mankind: Jihad.
Yup, smoke and mirrors!