By Christopher Monckton of Brenchley
The new Pause has lengthened by another month. On the UAH satellite monthly global mean lower-troposphere temperature dataset, seven and a half years have passed since there was any trend in global warming at all. As always, if anyone has seen this surely not uninteresting fact mentioned in the Marxstream news media, let us know in comments. One of the best-kept secrets in what passes for “journalism” these days is that global temperature has not been rising steadily (or, since October 2014, at all). It has been rising in occasional spurts in response to natural events such as the great Pacific shift of 1976 and the subsequent strong el Niño events, rather than at the somewhat steadier rate that one might expect if our continuing – and continuous – sins of emission were the primary culprit.

To forestall the usual whingeing about “cherry-picking” from the climate-fanatical trolls, here is the entire HadCRUT4 record of monthly global mean surface temperature anomalies for the 172 years 1850-2021. The trend is a not particularly catastrophic half a degree per century equivalent. Oo-er! Stap me vitals!

The HadCRUT4 dataset, now at last updated to the end of 2021, shows no global warming for almost eight years:

The significance of these long Pauses should not be underestimated. IPCC (1990, p. xxiv) confidently predicted 1.8 K global mean anthropogenic warming from 1850-2030. Of this, 0.5 K (HadCRUT5: Morice et al. 2021) had occurred by 1990, so that the projection was equivalent to 1.3 K over the four decades 1991-2030, or 0.34 K decade–1. However, observed warming from January 1991 to December 2021 as the mean of the monthly UAH lower-troposphere and HadCRUT4 surface monthly global mean surface temperature anomalies, was 0.5 K, or 0.18 K decade–1. Even if all warming since 1990 was anthropogenic (which it was not), IPCC’s finger-in-the-air prediction has proven to be almost twice outturn.
Meanwhile, soi-disant “leaders” on both sides of the Atlantic, having half-wittedly committed themselves to the Party Line on climate so sedulously peddled for so long by the Desinformatsiya directorate of the KGB (now FSB) and by the many Chinese agents of influence (such as the “Confucius Institutes” at many Western universities), dare not lose face. They cannot bring themselves to admit that they have been wrong, that they have been fooled, and that they have needlessly and expensively ended the free market in energy supply. They cannot brin themselves to change their catastrophic and unaffordable energy policies, even in the face of the fact that it was their eagerness to suppress competition from coal-fired power-stations in the name of Saving The Planet that was the chief source of funding for Vlad the Invader’s special military massacre in Ukraine.
On this side of the pond, Boris Johnson – than whom no previous prime minister has ever known less about science and mathematics – is about to publish an “energy strategy” that is widely expected to remove the now-formidable zoning constraints that have, for a few blissful years, prevented the installation of almost all new onshore unreliables.
I am now in Scotland on a walking holiday, but it is a lot less of a holiday than once it was. For every hillside is infested with whomping windmills – 14th-century technology to address a 21st-century non-problem. Birds, bees and bats by the billion are being blended or batted out of the sky. Yet few politicians dare to challenge the climate-Communist Party Line for fear of being unpersoned by savage, organized and persistent reputational assaults.
For instance, in a further attempt to damage my own reputation (for our research is more than somewhat challenging to the Party Line, and there are increasing signs of panic in the ranks of the ungodly), some wretched climate fanatic has asked the overpaid, under-responsible numbskulls at the office of the Clerk of the Parliaments, the senior bureaucrat at the House of Lords, to order me to stop using my well-kent logo, the portcullis (a generic heraldic charge) surmounted by the coronet vicecomital, a hat to which I and just 28 other Viscounts are entitled. I ran up this design on my architectural drawing program, I have been using it for well over a decade, and I shall continue to use it:

The House of Lords uses a badly-drawn, puke-red, 2-dimensional representation of the portcullis, with chains droopily pendent rather than triumphantly volant, and surmounted not by my coronet vicecomital, distinguished by the nine visible pearls, but by the Crown Royal. As the cuisses-de-cuir will discover to their dismay when they consult Garter King of Arms before shooting their mouths off again in their eagerness to advance climate Communism, a coronet vicecomital and a Crown Royal are clean different things. I have never used the latter, for I am not really royal. I am merely the Queen’s seventh cousin twice removed (“Kindly remove him a third time”).
The dusty dolts will also discover from Garter (who will, no doubt, much enjoy this nonsense, just as I do) that no one else has registered my device and that, therefore, I am fully entitled to use it. How lucky you are, across the pond, that your wise Constitution altogether prohibits titles of nobility. That is one more thing the bureaucrats in your country can’t try to mess up and use against us as they try to do here.
The gnomes of Westminster are also proposing to consult the Lord Chamberpot, whose original job, before Thos. Crapper Esq. came along, was to empty the night soil from the Royal porcelain each morning. For they do not like me to call myself a member of the House of Lords (which I am, for the letters patent granted by Her Majesty to my late beloved grandfather have not been withdrawn or repealed by the special Act of Parliament that would be necessary). Indeed, I was in the House only the other day, giving a briefing to a group of my peers, one of whom even voted for me in a by-election for a vacant hereditary seat.
By vice of the House of Lords Act 1999, passed by a Communist administration, nearly all hereditary peers have no seat or vote. But we remain members of the House until hundreds of individual special Acts are passed, to annul our letters patent. And that won’t happen anytime soon.
It is time to start building coal-fired power stations again. That would cut electricity bills by five-sixths. It is also time to reject electric buggies. Otherwise we shall make exactly the same mistake we made in shutting down the coal-fired power stations that generated electricity at less than half the unit cost of Siberian gas. As things now stand, we shall ban production of all internal-combustion engines and replace them with electric buggies very nearly all of which, throughout the world, will utterly depend upon lithium carbonate whose production is owned or controlled by Communist China. Enjoy your personal transport while it lasts. Even if you can afford to run the present one, you won’t be able to afford a new one.
This strategic double-whammy – replacing our own coal with Kremlin gas and our own petroleum with Peking lithium carbonate – is a self-inflicted and, if not reversed, potentially fatal wound to the economies as well as to the freedoms of the West.
It will make no difference to global temperature. Even if all the nations bound by the Paris discords actually achieved net-zero emissions by 2050, as Mr Johnson fatuously proposes, the global warming abated would be little more than a twentieth of a degree, for most countries are not bound by it. The cost to the free world – and the profit to Communism – would be in the quadrillions. Is that really what we want to achieve?
Well, no, we don’t. The global warming scam was based on an elementary mistake. Consider the position in 1850. Climatologists forgot the Sun was shining. They took the whole 24 K feedback response up to that year and attributed all of it to the 8 K direct warming by preindustrial noncondensing greenhouse gases. Therefore, they imagined that because the 32 K sum of these two values was four times the 8 K reference sensitivity to the preindustrial gases the 1 K direct warming by doubled CO2 today would become, at midrange, about 4 K (CMIP6: Zelinka et al. 2020).
They had forgotten the feedback response to the 255 K emission temperature that would obtain at the surface if, at the outset, there were no greenhouse gases in the air at all. They had misallocated it to, and miscounted it as part of, the actually tiny feedback response to the 8 K direct warming by the preindustrial noncondensing greenhouse gases. At any given moment – such as 1850 – any feedback processes then subsisting must perforce respond equally to each degree of the entire (255 + 8) K reference temperature and hence proportionately to each component therein.
For 1850, the system-gain factor, by which one multiplies a direct warming (or reference sensitivity) to allow for feedback response and derive final warming (or equilibrium sensitivity) is not, as Hansen (1984), Schlesinger (1988) or Lacis (2010, 2013) absurdly imagined, 32 / 8 = 4. Instead, it is (255 + 32) / (255 + 8) < 1.1. Their error is as elementary as that.
The feedback-loop schematic below represents not only a linear feedback system (such as climatology imagines the climate to be, for CMIP6 models’ midrange prediction implies a midrange system-gain factor today identical to, or even somewhat less than, that of 1850). It also serves to represent a potentially non-linear system at a particular moment of interest, here 1850. Note that the simplified feedback formulism shown in the diagram gives outputs identical to the more complex formulism in the textbooks, if based on identical inputs. But the simpler formulism is a lot easier to understand than the original formulism developed by Black (1934) and codified by Bode (1945).

The 255 K emission temperature erroneously neglected by climatology in its derivation of feedback response and hence of equilibrium doubled-CO2 sensitivity (ECS) is shown in gold. Dark blue values are common to the erroneous and corrected methods. Erroneous values consequent upon forgetting that the Sun is shining and thus neglecting the feedback response to the 255 K emission temperature are italicized in red. Corrected values, in green, are below the italicized erroneous values.
Since reference doubled-CO2 sensitivity (RCS) is about 1 K, ECS is approximately equal to the system-gain factor. For 1850 – and for today, if, as is very likely, climatology is at least right in taking the system-gain factor as invariant in the industrial era – the 4 K predicted midrange ECS in the CMIP6 models is about 4 times the corrected 1.1 K ECS.
If the system-gain factor were to be just 1% greater today than it was in 1850, then ECS would exceed the value implicit in the data for the climate in 1850 by 250%, because that 1% change must be applied not only to reference sensitivities but also to emission temperature itself. Yet global warming is not even occurring at the rate originally predicted on the basis of climatology’s error. It is occurring at little more than half that rate – and that is before making any allowance for the fact that not all warming in recent decades was anthropogenic.
Accordingly, the absurdly elevated feedback fractions imagined by climatology based on diagnoses from the outputs of the wretched climate models cannot possibly be correct. Which means, in turn, that the climate models themselves cannot possibly be correct. For if the feedbacks diagnosed from their crazy outputs were correct then ECS would be somewhere between 450 and 600 K, and it just isn’t.
Our paper explaining these inconvenient truths has been languishing at a leading journal, marked on its author tracking system as “With Editor”, for well over a year. While I am in Scotland, I am hoping to consult a very senior police contact about the numerous fraudulent aspects of the climate scam in general, and about the misconduct of the journals in particular.
If a journal says it will usually give a response within x days but no response is forthcoming even after 5x days, and if that journal says it brings the latest science to its readers and generally represents itself as publishing properly-peer-reviewed science, and if its editor is sitting on our paper because he cannot refute its argument but is not willing to publish it because he has previously gone on record as saying that we skeptics have no credible arguments against the Party Line, then that is fraud by false representation. We have had enough of it. For it is – as the late Nils-Axel Mörner used to say, the largest fraud in human history.
The tens of thousands of gallant Ukrainians slaughtered by the brutal advance of clapped-out Communism would perhaps still be alive today if we had been able to prevent the climate fraud that has, in no small measure, paid for Vlad’s reconstruction and expansion of his armed forces. For that reason, I suspect we may well now get a fair hearing from the police and, in due course, from the intelligence services of the West.
For our own nations’ protection, as well as for that of the myriad past, present and potential future victims of Russian and Chinese Communism, the most murderous form of government the world has known, we can no longer tolerate this nonsense from which the Marxists so mightily profiteer. Our politicians are too thick and too frit to stop it, but the police, the intelligence services and eventually the courts can – and will.
Any assessment of a warming effect from CO2 is questionable including the good Lord’s. They all assume that CO2 creates a downward IR flux. Miskolczi 2007, 2010, 2014 demonstrated that our atmosphere exhibits radiation exchange equilibrium. This alone prevents any downward IR flux from a well mixed gas.
The only downwelling IR is local to its emission due to increasing absorption as you move lower in the atmosphere. However, upward flux is not limited as density decreases as you move up in the atmosphere.
The net result is an upward flux of energy that increases with increases in CO2 concentration. CO2 atmospheric flux is a cooling effect.
Richard M is wrong, as the position in 1850 demonstrates. The 32 K difference between the observed equilibrium temperature in 1850 and the emission temperature comprises 8 K direct warming by preindustrial noncondensing greenhouse gases and 24 K feedback response (nearly all of it attributable to emission temperature itself). If greenhouse gases exerted a cooling effect, the temperature in 1850 would have been below the 255 K emission temperature: but it was 32 K above emission temperature.
Yes, CO2 has a warming effect until all the available 15 micron energy is absorbed. I didn’t mention this because the amount of CO2 in our atmosphere has always been sufficient to reach this saturation level. It’s irrelevant to future analysis.
I’m referring to future warming. This warming is supposedly caused primarily by a downwelling flux of energy from CO2 within the atmosphere. With radiation exchange equilibrium, this flux doesn’t exist.
What does exist, and is found by examining radiation models, is the local DWIR I mentioned. It has no warming effect because is does not contribute to an overall flux.
Richard M is confused. The more CO2 is added to the atmosphere, the more forcing there will be, though because the response is quasi-logarithmic each additional CO2 molecule causes less warming than its predecessors.
And CO2 does not radiate downward only, but in all directions.
Not according to this science.
http://www.john-daly.com/artifact.htm
Of course CO2 radiates in all directions, however, only the downward component has the ability to warm the planet.
As I have tried to explain to the partly anonymous Richard M, heat generated by the interaction of a CO2 molecule with a photon in one of its characteristic absorption wavebands radiates in all directions. That heat is then transferred in all directions, chiefly by non-radiative transports. It is the net downward component in these radiative transports that is the principal reason why CO2 and other noncondensing greenhouse gases can cause warming.
This is the area which I have some disagreements about. If the CO2 in the atmosphere blocks upward radiation then it should also block downward radiation, meaning far less downward radiation should reach the earth than the earth originally sent skyward. This will obviously raise the atmospheric temperature but I fail to see how it can raise the surface temp significantly at all. Since most of the impacts we see on the surface of the earth (or at least the near earth, say the first 6 feet) is not conduction from the atmosphere the rising atmospheric temp should have little direct impact. The sun is far more of a factor than any GHG downward radiation.
Observations or criticisms?
It is good that you are thinking about these things, rather than taking them on trust from either side of the debate. That is rare and precious.
About 40% of all incoming radiation is already in the near-infrared, where it might interact with greenhouse gases such as CO2. Some of that radiation will interact with CO2 on the way down, and the CO2 will then cause warming in the atmosphere. The rest, whatever its wavelength, will strike the surface, and will then be displaced to the near-infrared (the temperature of the emitting surface being the sole determinant of the resultant wavelength). Therefore, on the way out there is a lot more infrared radiation than there was on the way in, and that will react far more with the CO2 than on the way, because there is so much more of it. Net effect: modest warming.
We know beyond doubt that there is a greenhouse effect, because we can calculate it from well-constrained data for 1850, where the emission temperature (which would prevail at the surface if there were no greenhouse gases in the air at the outset) is 255 K, but the observed temperature was 287 K. The 32 K difference is the greenhouse effect.
What you are basically describing is increasing the R factor of an insulator. I have started investigating describing the atmosphere as an insulator in thermodynamic terms. What the greenhouse theory doesn’t deal with is how the thermodynamic processes work.
As a beginning, assume the atmosphere has a conductivity of zero. In other words it doesn’t radiate or conduct heat at all to a third body. At best it would only heat until it reached equilibrium with the surface. An insulator can not “reverse” heat the source to a temperature higher than what the source is. Neither conduction nor radiation will allow that without violating conservation of energy.
Richard M posted:
“Any assessment of a warming effect from CO2 is questionable including the good Lord’s. They all assume that CO2 creates a downward IR flux. Miskolczi 2007, 2010, 2014 demonstrated that our atmosphere exhibits radiation exchange equilibrium. This alone prevents any downward IR flux from a well mixed gas.”
However, IMHO, these statements are fundamentally incorrect in describing the physics behind the “greenhouse effect” as it acts in Earth’s atmosphere.
The rates for CO2 collisions with N2 and O2 molecules in the lower troposphere (up to about 5 km altitude) are 10^6 to 10^9 times faster than the rates at which CO2 molecules, on average at these conditions, will undergo “photo-relaxation” of any absorbed LWIR energy by spontaneous emission of a photon of equal or lesser energy than the one absorbed. This physical fact has been emphasized by Dr. Will Happer, among others.
Same process and trends apply to water molecules in Earth’s atmosphere, which actually exert a much stronger “greenhouse gas” influence due to being (a) in much higher concentration than CO2 over most of Earth’s surface over the range of absolute humidity conditions, and (b) having a much broader integrated-LWIR absorption band than CO2.
What this means physically is that within 5 km of Earth’s surface, atmospheric CO2 at its current level of about 420 ppm (.0004%) will essentially redistribute any LWIR energy absorbed from surface radiation, via collisional energy exchange in vibratory and translational degrees of freedom, to nitrogen and oxygen molecules . . . and just not “carry” LWIR absorbed energy into the upper half of the troposphere, let alone to the tropopause.
This “thermal equilibration” (reference Maxwell–Boltzmann distribution and energy equipartition laws) of surface energy radiation throughout all atmospheric constituents, due to very rapid collisions of all the mixed gases, in turn means that all atmospheric gases (99.1% being N2 and O2) will radiate thermal energy—since they are at temperatures above absolute zero—either directly to space or via chained collisional energy exchanges up to the level of the stratosphere where they can then radiate directly to space.
Thus, all atmospheric gases thermally radiate energy, some of which originated as Earth LWIR surface radiation energy, throughout the stratosphere . . . not just CO2 (or water vapor). Due to their much higher relative concentrations, IMHO it is more accurate to state that N2 and O2 are the major radiators of thermal radiation in the stratosphere.
And the reverse is equally true: all atmospheric gases thermally radiate energy, some of which originated as Earth LWIR surface radiation energy, back towards Earth’s surface . . . not just CO2 (or water vapor or methane or N2O). In this regard, “greenhouse gases” do function as claimed for intercepting LWIR radiation energy from Earth, but they get the underserved bad rap for being the only atmospheric constituents that radiate that energy back to the surface.
BTW, I believe the above understanding of energy exchange/equilibration taking place within the lower troposphere goes a long way toward resolving the controversy over the tropospheric “hot spot” measured temperatures being so low compared to model predictions (reference, as but one example: https://wattsupwiththat.com/2013/07/16/about-that-missing-hot-spot/ ).
If there are no emissions by CO2 molecules in the lower 5 km then there are also no absorptions (Kirchhoff’s Law). However, real experiments show 99.94% of the absorption takes place in the first 10 meters of the atmosphere.
http://www.john-daly.com/artifact.htm
Isn’t the first 10 meters of the atmosphere within the first 5 km of the atmosphere?
And, wow, if 99.94% of the absorption of all of Earth’s LWIR radiation, from ~3.5 to ~70 microns wavelength, takes place in those first 10 meters, why don’t I feel a distinct chill when I climb up to, say, the fifth story of an office building that does not have active HVAC?
Finally, “emissions” of photons from CO2 molecules are, as I tried to carefully point out, about one-millionth to one-billionth less frequent than CO2 collisions with other molecules in the atmosphere below 5 km altitude. CO2 re-distributes its absorbed LWIR surface radiation energy overwhelming by collisional exchanges of translational and vibration energy (per Maxwell–Boltzmann distribution and energy equipartition laws of mixed gases).
The lower 1 km of the atmosphere is known as the boundary layer. This layer is known to be in thermal equilibrium with the surface. Lots of reasons for this including a lot of turbulence. Radiation is likely a minor factor.
I agree that CO2 loses absorbed energy from the surface through collisions before it is able to reradiate. However, it is constantly being energized as well by more collisions. It is just as likely to radiate energy after these collisions as absorb energy between collisions. The net result is CO2 does radiate energy in the lower 5 km. In fact, that is where it is most active.
I’m not sure your logic holds here. If a CO2 molecule is more likely to lose energy in a collision with another molecule, it really doesn’t matter if the original energy gain comes from radiation or from another collision. Any radiation that passes by while it is energized by a collision will be absorbed higher in the atmosphere.
I suspect the probability of emitting radiation is pretty small considering the density at the boundary layer.
Well, the US Standard Atmosphere gives the temperature associated with 1 km altitude as being at 8.5 °C whereas it gives the atmospheric temperature at the surface as being 15 °C.
(Ref: https://www.digitaldutch.com/atmoscalc/ )
I do believe that 6.5 °C difference over 1 km altitude does falsify the assertion that “this layer is know to be in thermal equilibrium”.
In this regard the dry, environmental, and moist lapse rates in the atmosphere are seen to begin at the surface, not at 1 km altitude.
Such an assertion of thermal equilibrium over 1 km altitude would also be falsified by the known fact that clouds can form at altitudes below 1 km while simultaneously there is no fog at the surface beneath.
Having flown private aircraft and sailplanes, I can attest to the practical truth of the above facts (need I mention the formation and evolution of “thermals”?).
Winter is comming, energy is becoming more expensive… un-mothball your thickest sweaters!
“At any given moment – such as 1850 – any feedback processes then subsisting must perforce respond equally to each degree of the entire (255 + 8) K reference temperature and hence proportionately to each component therein.”
Christopher this is a jewel of an explanation of your thesis and I wish others could find such a touchstone for their technical criticisms of other aspects of the sc@m. I am an engineer, so had no trouble understanding the idea as originally presented, but the vast majority do not understand. These are the people we do not reach!
Apparently, 79% of British believe we need to act to switch to ‘clean’ energy. I’m sure this is an exaggeration but, still, innumerate folk have no way to judge such things. They do however possess at least simple logic and that is the Avenue to their understanding.
For example there is a large dead, still rooted tree trunk at Tuktuyaktuk on Canada’s NW Arctic coast dated a 5000yrs before present. It is 100km north of the present treeline and a few more 100s of km north of living white spruce (the same species as the oldTuk tree) of this size. A 12 year old schoolboy had no difficulty interpreting this puzzle correctly.
Mr Pearse is very kind. When we first came across climatology’s error, five years ago, we had great difficulty in explaining it to those not familiar with control theory. Now, however, we have found various ways of putting our point in plain English.
It is important to understand, though, that the statement you have been kind enough to appreciate does not in itself in any way imply that the system-gain factor in the industrial era is constant. It may well vary, but not by more than a fraction of 1%, because any change in the system-gain factor must be applied not only to the tiny greenhouse-gas reference sensitivity but also to the 30-times-larger emission temperature.
Sorry MoB, but the planet’s average temperature is basically controlled by clouds, albedo, Planck and Clausius Clapeyron equations, as generally recently graphed (Cloud Radiative Effect) here by Willis Eschenbach as follows….and the theory of gain of electronic amplifiers is too simplistic to quantify it. Really like the Monckton pause calc every month though…
Like most things climate, clouds are as a much a consequence of temperature as they are a cause.
Evidently, Mr McKenzie is not a control theorist. Control theory – the science of feedback – applies universally to all feedback-moderated dynamical systems, including climate. It is the error perpetrated by climatology that is simplistic, and it is fatal to the Party Line, which is why there is so much ill-informed resistance to our exposure and correction of it here.
5000yrs before present
Back in those days summer insolation at that latitude was markedly greater than today’s.
My point was and is that strident alarmist claims that today is the warmest it’s been for over a 100,000yrs (presumably some accept the Eemian was likely warmer) is completely falsified by this tree stump and other such evidence. I am assuming that Arctic amplification still operated and that the global anomaly was ~½ the Arctic one so perhaps 4 to 6°C warmer at Tuk and and 2 to 3°C Globally. I’m sure you arent arguing it was cooler in the tropics.
In order to prove what effect CO2 has on temperature changes in the troposphere, it is necessary to show what effect it has on the vertical temperature gradient (analogous to the case of water vapor, whose effect on the vertical temperature gradient is proven).
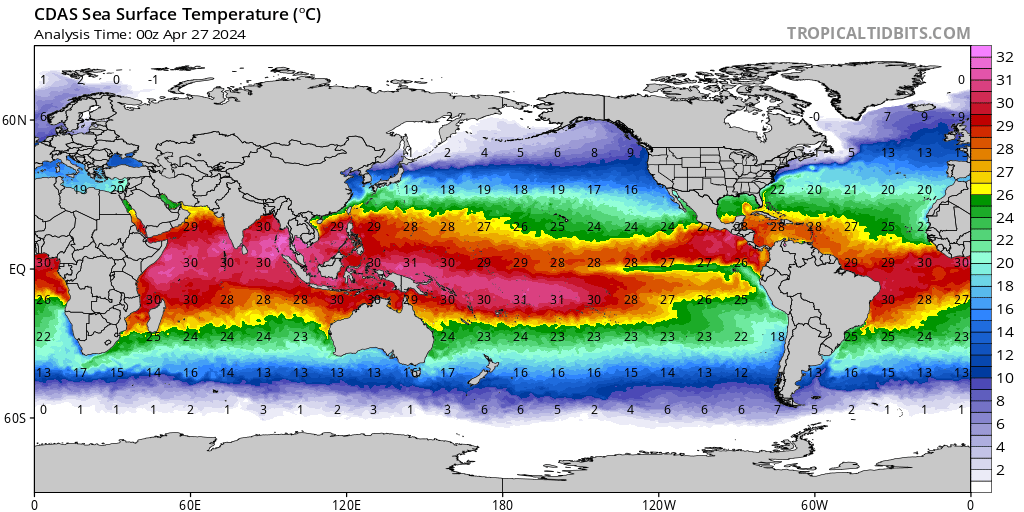
The surface temperature of the open ocean cannot exceed 31 degrees C, due to water evaporation. Only an increase in sea surface pressure can raise the ocean temperature.
Not this ECS tosh again.
CMoB said: “Even if all warming since 1990 was anthropogenic (which it was not), IPCC’s finger-in-the-air prediction has proven to be almost twice outturn.”
You keep saying this but not providing the reference in the FAR.
Here is what the IPCC FAR actually said. In terms of emissions humans selected a path far below business-as-usual.. As of 2020 there was 413 ppm of CO2 which puts us a hair above scenario B. There was 1900 ppb of CH4 which puts us right on scenario C. And there was 225 ppt of CFC11 which puts us well below scenario C/D. A big part of this is the result of the Montreal Protocol.
In terms of forcing for all GHG species via W/m2 humans selected a path even below D. Again, this is due in part to the Montreal Protocol.
Based on the information contained in the IPCC FAR I think a reasonable assignment of human behavior is scenario C. The warming the IPCC predicted for scenario C is 0.55 C. HadCRUT shows that it actually warmed 0.65 C from 1990 to 2020. Based on this it looks like the IPCC did not overestimate the warming by a factor of 2x, but actually underestimated it by about 15%. Even if you think humans went down a course closer to B that would be about 0.65 C of warming as to the observed warming of about 0.65 C or nearly spot on.
Love being frightened by modified data.
To the best of my knowledge I don’t think anyone modified the IPCC prediction from 1990 and got the modification somehow included in the official publication especially without anyone noticing for 30 years. Either way you do not need to be afraid.
Bdgwx should read the head posting. There he will find a reference to IPCC’s prediction of 1.8 K global warming by 2030 compared with preindustrial temperature.
First, I was not talking about the 1.8 K figure. But now that you brought it up let’s discuss it. On page xxiv it clear says “IPCC Business-as-Usual Scenario”. Did you not know that the 1.8 K figure was for the business-as-usual (A) scenario?
Second, I did read the head post and I did see the reference to IPCC FAR pg. xxiv. Where do you think the graphs I posted above came from?
Third, let me be perfectly clear with this question…where specifically in the IPCC FAR do you see a prediction that was 2x above observations for the emission scenario that actually played out?
CO2e emissions are at present somewhat above Scenario A of IPCC (1990).
Really? I’d like for you to show us what you are looking at because what I’m looking at isn’t even remotely consistent with your statement here. If you don’t mind post the business-as-usual (A) scenario emissions for 2020 that you see in the IPCC FAR (1990).
In the real world, the question is how much CO2-equivalent radiative forcing has arisen in the 30 years since IPCC first made its extreme predictions. The answer is that CO2e emissions are tracking Scenario A, the business-as-usual scenario, yet the planet is not warming at much more than half the originally-predicted rate.
Where does it say CO2 emissions are tracking scenario A? Be specific. What section and page number are you looking at? And what are the emissions of the other gas species? Which scenario are they tracking? Again be specific. Which section and page number are you looking at? It might help if you post a link to the copy of the IPCC FAR report that you are looking at to eliminate the possibility you are using an altered copy.
The IPCC report in 1990 could hardly be expected to say whether emissions in 2020 were tracking IPCC’s 1990 prediction. We now know, however, that they were just a little above the 1990 prediction for Scenario A (business as usual).
MoB said: “We now know, however, that they were just a little above the 1990 prediction for Scenario A (business as usual).”
Where are you seeing that?
I’m looking at the IPCC FAR from 1990 and I see nothing of the sort. In fact, I see that CO2 emissions are well below scenario, CH4 is right at about scenario C, and CFCs are well below scenario C & D.
What are you possibly looking at in the IPCC FAR from 1990 to get something remarkably different from what is published?
Why just post a page number?
Look either the IPCC can make projections of what might occur or they can make predictions. What you are proposing is that these scenarios are predictions and scary ones at that.
You need to declare your belief of which it is. Are these simple projections? If so, what is their likelihood? Or, do you treat them as actual predictions?
Remember, if projections have a greater than 50% possibility, they suddenly turn into predictions.
Where are the uncertainty bounds, bdgwx?
The question I’ve been asking of Monckton. He insists the IPCC confidently predicted some figure he’s made up, and ignores the IPCC’s stated uncertainties.
I say that IPCC (1990) “confidently predicts” because IPCC prefaces its global-warming predictions with the words “We confidently predict …”.
I cannot find those words anywhere in the report. Maybe you have a different version than me
https://www.ipcc.ch/site/assets/uploads/2018/03/ipcc_far_wg_I_full_report.pdf
In the executive summary they say
Which lists two things: that there is a greenhouse effect and that humans are increasing greenhouse gasses.
Then they say
Which lists three things, none of which are about predicting temperature rises.
Then they say
And this is where they put the warming predictions. (my emphasis)
The next heading states:
This section concludes
Later they say
which includes, better understanding of climate related processes, improving observations of climate variables, and developing better models.
And that’s just the first couple of pages of the executive summary.
Moving on to page xxiv, the one used in the head post to make the 0.34°C / decade extrapolation.
This is describing regional changes, with an emphasis that the confidence is lower for those. The relevant part says:
No mention of high confidence in the global value. It’s described as the best “estimate” and given a range of -30% to +50%.
Pages xxvii and xvii contain a lot more discussion about how much confidence they have in the predictions.
Bellman, my implied point was that all of bdgwx’s graphics are physically meaningless.
Good question. When we try to bring this up with CMoB his responses are unsatisfactory if he even engages in that line of discussion at all.
I was referring to the uncertainties in your graphics, bdgwx, not in Christopher’s work. The projections in your graphics are physically meaningless.
They support no point at all, except that the IPCC don’t know what they’re talking about.
It is noteworthy that Dr. Roy Spencer says the satellites have an uncertainty of 5 – 10 W/m^2 reaching the earth. Basically, everything on the graphics depiction is within that uncertainty interval and therefore attribution to any given thing is simply meaningless.
For my own interest I though I’d plot what the lengths of all the pauses, using Monckton’s definition, looked like. That is the length of the longest sub zero trend from each month.
Not the most elegant graph I’m afraid, but it does suggest one thing to me. Monckton Pauses, at least using UAH, go out with a bang not a whimper. They basically keep increasing with the passage of time, as the start date doesn’t change too much, until the next big El Niño. Then the old pause dies and the next one is born.
This graph shows how the pause start date has changed over time.
You are just mad because we are all cold.
You say that like it was actually something meaningful.
I should make it clear that I consider the pause start and length to be pretty much meaningless. This is just a bit of fun.
Bellman is here repeating an analysis I had previously published here, showing that each Pause begins not with a spike in greenhouse-gas concentrations but with a spike in the naturally-occurring el Nino Southern Oscillation. Yet no one is monitoring the volcanic activity in the Nino 1-2 region of the equatorial eastern Pacific, where three tectonic divergence ridges meet, and where the divergence of the tectonic plates occurs at a rate exceeding the global mean by an order of magnitude.
Sorry I missed that previous analysis. Do you have a link?
It’s not really a surprise, the opposite in fact, that each pause starts just before a large El Niño and ends with the next. To me that suggests these pauses are just statistical mirages rather than actual descriptions of what temperature is doing.
As my other graph shows, not only does the length of a pause grow as we wait for the next spike, so too does the length of periods with faster rates of warming. Neither of these are a good basis to claim that the rate of increase is falling or increasing.
“To me that suggests these pauses are just statistical mirages rather than actual descriptions of what temperature is doing.”
To most of us it represents a natural variation, probably cyclical. Standard statistical analysis is not very good at describing such phenomenon.
If you want to show there are cyclical natural variety, drawing flat lines going up in steps is not the best way.
Never heard of a square wave or triangle wave, eh? Just more ignorance of physical reality from you. Get your head out of your math book and join us in the real physical world.
(Hint: what is the Fourier transform of a square wave or a triangle wave?)
Do you expect theglobal climate in the real physical world to follow a square wave? What is your real world physical basis for this.?
And if this is a square wave, shouldn’t go up and down, rather than just going up?
You didn’t answer my question. I didn’t expect you to.
A square wave, a triangle wave, and a trapezoid wave are all made up of cyclical sine waves. So are more complicated waveforms.
Glacial periods and inter-glacials are a cyclical phenomenon. So are lots of ocean cyclicals.
Who says temps must always go up and never down. You are betraying your ignorance of time series.
I’ve no intention on answering questions about Fourier translations. Is that the same as a transform? It’s not something I have any familiarity with.
The fact that you can combine multiple sine waves to make any shape you like is a problem. How do you know there’s any physical basis to your deconstruction. Is the same problem as fitting a high order polynomial to the temperature record. With enough degrees of freedom you can get a good fit, but you could just be fitting the noise.
I’m not saying temps can only go up. I’m saying that so far your square wave pattern, i.e. those selected pauses, have only gone up.
LOL!! You do realize you just blew off most of physics and electromagnetic theory don’t you?
I guess you do realize there is a difference between time related periodic phenomena using trigonometry versus algebraic polynomials, right?
How does one know there is a physical basis? Go back to school and learn. There is already too much teaching of basics on this site to start also teaching calculus based analysis of basic phenomena. Look up Maxwell’s partial differential equations if you don’t think there is a physical basis.
You do realise the climate isn’t an electromagnet don’t you?
Does it have periodic time related cycles? Then Fourier applies. You’ll notice I did say physics!
Do bridges require harmonic analysis to make sure they don’t fail in wind? How about harmonic distortion is speakers? Do you think step functions can’t and aren’t used to analyze the various harmonics in any physical reaction to an impulse? How about wave machines? What are their fundamental and harmonic possibilities?
You’re out of your league here dude!
Whatever. As I’ve asked you before, if you think you can predict temperature by combining sine waves, show your work.
Is La Nina a cyclic process? Can it influence temperature?
If it is cyclic it is made up of sine waves.
Is the sun’s path sinusoidal from sunrise to sunset? Is the sun’s insolation related to sin(x). Does that sinusoid impact the temp at any specific point on the earth? (x is longitude) is the sun’s isolation related to its latitude (y) by sin(y)? f so then the sun’s insolation at any point on the earth is related to the combination of two different sinusoids.
Is the temp at any point on earth related to the sun’s insolation at that point?
Need I go on?
If ENSO is a cyclic process it’s very irregular. If you can model it by a combination of sine waves then presumably you can predict when the next big El Niño will happen.
ENSO is cyclic. It is made up of various other pieces that go into and out of phase on an irregular basis.
You obviously know little about wave theory or you would understand constructive and destructive interference and how moving phases can cause all kinds of things. Have ever tuned an instrument with a tuning fork and listened for the beat note? Have you ever tuned a multi-element directional antenna like a microwave link.
You’re right I know little about this, but unless you can demonstrate how you can actually predict the cycles of ENSO using constructive and destructive sine waves, it’s difficult to see why you would assume there is a physical cause. I expect a tuning fork or microwaves to have predictable wave patterns. I doubt the same is true about ocean cycles.
Whoa! No physical cause? Getting pretty far out there aren’t you?
It’s cycles all the way down! ESNO appears to be of a varying frequency because it too is made up of other varying cycles.
I give you this page: https://byjus.com/maths/trigonometric-identities/
Or better yet, this one: https://dotancohen.com/eng/taylor-sine.php
The second link shows the Taylor series for a single sine wave. Now consider how two of these would combine! Especially if they are at different frequencies.
Look especially at the sections Product-Sum and Product. These identities are for just TWO components, e.g. sin(x)sin(y). There are multiple factors affecting the biosphere of Earth. The climate scientists trying to develop models today have no idea what all the various factors are let alone how they combine. And they don’t appear to even be interested in learning about this subject at all. They have their control knob, CO2, and by God they are going to stick to it!.
And it *is* obvious that you know little about this. But it doesn’t seem to stop your pontificating on the subject and denigrating those that do.
Yes, with enough cycles you can fit anything.
https://www.youtube.com/watch?v=r6sGWTCMz2k
But correlation is not causation.
Read; this, it is a good tutorial on the start of time series analysis.
Explaining Mauna Loa CO2 Increases with Anthropogenic and Natural Influences – Watts Up With That?
Read; this, it is a good tutorial on the start of time series analysis.
Explaining Mauna Loa CO2 Increases with Anthropogenic and Natural Influences – Watts Up With That?
It really isn’t “flat” lines. That was just my way of emphasizing the uncertainty interval. It could be shading to show the uncertainty interval. The point is that the actual value is unknown. You only know that it is somewhere in that interval.
When you pull up data from the past that is recorded in integers, do you know if the actual mercury level was below or above the recorded value?
The correct answer is “I don’t know where the actual mercury level was!”. That means you must show the interval that the measurement could have had. That interval MUST be carried through each computation that uses that value, such as, daily midrange, weekly, monthly, annually, anomaly, etc. That interval never disappears regardless of what gyrations of math you take.
Graphs that don’t show these intervals with line width, shading, bars or some type of method make me suspicious from the outset. It tells me that the maker has no idea what uncertainty is and even less knowledge about how to show it.
I’m not sure what you are referring to here. If the pause isn’t a flat line then what makes it a pause?
You still seem to be insisting that UAH data is completely unreliable, yet claim you can use it to show a lack of correlation with CO2.
I’m not saying that UAH is unreliable. You are reading too much into what I said. The pause trend is well defined within the boundaries of the data.
I have the benefit of forecasting data of numerous kinds for years. Calls, usage of equipment (Poisson usually), budgets, people, etc. You learn very quickly that regression trends are fine for looking at data you already have. But, beware using them to march into the unknown future especially when they have cycles involved.
I’ll guarantee you that if the scientist’s and politician’s jobs truly depended on ACCURATE predictions of what was going to happen and WHEN, they would be much more circumspect in what CO2 was going to do.
Look at the graph. A return to zero from both warmer and colder periods puts a kibosh on a constantly growing temperature. It is an indication of cyclical behavior or more likely some combination of different cycles with varying periods.
What do you think zero means in this case? Would you argue differently if UAH kept the older anomaly period?
The only cycles I see in the graph, are the unpredictable ups and downs of changing ENSO conditions. These sit on top of a clear upward trend. Of course this could be part of a bigger cycle, and maybe we reached the peak in 2020 and it’s all down from here. But there;s no way you could tell that just by looking at “pauses”.
Where do you see pauses in this graph? I see time varying ups and downs from the combinations of various cycles with different periods (and varying periods) and phases.
Your exclamation that who knows whether we could go up or even go down is exactly on point. At this point in time we simply don’t have the data to gauge what and how cycles combine. Especially when some will obviously have periods in the hundreds of years. 150 years of questionable data doesn’t even come close to the Nyquist limit required for adequately assessing how this whole climate thing works.
I don’t. As I keep saying I think most of these pauses are statistical mirages, people searching for what they want to see.
I’ve also tracked the longest period of “accelerated” warming for each date, here defined as warming at a rate of 0.3 °C / decade or higher.
I find it interesting that for a lot of the time, both pause and acceleration lengths are increasing at the same time, rather than being a mirror image of each other.
At present the > 0.3/decade warming is around twice as long as the pause, but I expect that to change at some point.
Really? Another foolish (posted on WUWT on April 3rd, two days late) “bu bu bu bu bu PAUSE” piece of nonsense to spoon feed to the willfully ignorant WUWT crowd?
Wouldn’t one think that after getting egg on their collective faces after the last “pause” ended so decisively against them, that soi-disant “skeptics” would quit playing their loser “bu bu bu bu PAUSE” card? Nope, here they are, at it again, just itching to be hosed this time around, too.
Also included free of charge in this latest Monckton screed is one of those typically pompous handwaving claims that “they (i.e. the entire worldwide scientific community) ‘forgot’, they ‘mis-allocated’, they ‘miscalculated’ … and I and I alone ‘know better’ … simply because I say so”.
So ridiculous.
Why don’t you try convincing me that his post is wrong?
Your pompous whining fact/evidence free bla bla bla doesn’t work here.
Have you noticed how all of the trolls start spouting the same message at the same time? This month they are universally trying to claim that the fact that previous “pauses” have ended, proves that this one will end and therefore are meaningless.
It’s almost as if they all got the same talking points memo at the same time.
I’m not saying. All I say is that if temperatures keep rising it’s certain this pause will end at some point, just as all the previous ones did. Probably with the next big El Niño.
That doesn’t prove temperatures will continue to rise, and if they don’t yes the pause will continue for ever. I just think “sceptics” here might be wise to wait until there was clear evidence that this was happening, rather than getting all exited over natural variation.
Bellman,
There is more interest in the mechanisms of how the temperatures pause for a decade or so, while GHG are observed to increase. What makes the temperature immune from increase over a pause? Does the GHG lose its strength to warm, or do cooling factors from natural variation offset the climb?
I am more interested in an explanation of the mechanisms than in more graphs that simply observe the result. Geoff S
The temperature change of a body is given by ΔT = ΔE/(c*m) where ΔT is the change in temperature, ΔE is the change in energy, c is the specific heat capacity, and m is mass. Since c and m are essentially constant for the UAH TLT layer that means ΔE is almost entirely modulating the temperature change. And since ΔE = ΣEin – ΣEout we know that temperature changes are modulated by the net of all energy fluxes into and out of the body. CO2 is only one among many factors acting on the energy fluxes. All it takes is an offsetting decrease of Ein or increase of Eout from from another factor to create the pause. This could be transient increase in albedo, decrease in the latent flux to the atmosphere, decrease in the sensible flux to the atmosphere, decrease radiative forcing by a gas species other than CO2, and numerous other possibilities.
“transient”
Why do you use the word transient? That indicates you think the pause will stop and the temp will return to a rising trend. There *are* other options. Changes may not be transient at all. If you don’t know what the cause is then assuming it is transient shows a bias.
It would be even more interesting to establish that there really is a pause in temperature. E.g. show that there was a statistically significant change in the rate of warming.
So far all I see is the natural consequences of an underlying rate of warming with variation. You can easily find longish periods where the linear trend is zero, but that doesn’t prove there is no warming, any more than finding a linear trend of much faster warming rates means the rate of warming has increased.
Yes, the trend of pausing/declining global temperatures from about 1940 to about 1975 did finally end . . . after 35 years, a period sufficiently long to qualify it as true climate change.
Similarly, each of the typical 60-80 thousands of years of cooling associated with the last three stadials did eventually end, with a succeeding interval of global warming.
Meaningless, as you say.
The alarmists really are desperate to prove to each other that the scam isn’t falling apart.
That made me laugh out loud! 🙂
Trump says climate change (the human-caused kind) is a hoax.
The climate change scammers are having a hard time successfully promoting their scam. They’ve got the politicians (except Trump) and the monied Elites in their corner, but they don’t have the people.
The scammer’s only hope is to lie better, but even that won’t help their cause in the long run.
Here’s Tom Abbott still pretending that quite accurate scientific projections made decades ago, that continue to play out accurately, are a “scam”. His “position” sadly remains the very epitome of delusional anti-science head-in-the-sand political ideology.
Here’s MGC whistling past the graveyard, still trying to pretend that the utterly discredited projections were actually accurate.
MarkW speaks of the so-called “utterly discredited projections”
Such a pitiful display of outright & willful dishonesty, MarkW. So sadly typical of so-called “skeptics”.
Here’s reality: current mean global temperature is just about right smack dab in the middle of the 1995 IPCC SAR projection window.
It also happens to be nearly spot on with the 1990 IPCC FAR projection as well.
“His “position” sadly remains the very epitome of delusional anti-science head-in-the-sand political ideology.”
I think you are being kind.
Are you the same MGC who used to post lies on Yahoo? You know before Yahoo discontinued all comments because they were receiving too many factual comments that challenged the leftist narrative?
The same MGC who posted that climate change would make fresh water a scarce resource followed almost immediately by a post that claimed climate change would inundate us with rain?
That idiot?
meab,
More rainfall on a global scale but scarcity of fresh water in particular local regions are not incompatible outcomes. In fact, we are already seeing exactly that scenario play out: overall rainfall has been increasing worldwide, yet water resources in places such as the U.S. Southwest have been dwindling, and continue to do so.
Your comment is an unfortunate example of the typical intentionally ignorant “skeptical” attitude so often found at places like WUWT.
Another silly person—the Southwest is arid (i.e. desert) and semiarid climates, drought are to be expected, has nothing to do with the CO2 boogieman.
And who are “we”?
Irony alert.
“has nothing to do with CO2”
Merely because I, the great and powerful “Monte Carlo”, have declared it to be so! Never mind what the overwhelming vast majority of the worldwide scientific community has to say.
“10 out of 9 dentists agree!!”
MGC: The vast majority of the worldwide scientific community called, they said you could speak for them! Imagine my surprise.
paul, thanks for yet another example of a totally lame comment. Anyone can simply look up what the worldwide scientific community has had to say regarding CO2 and climate change. But you apparently won’t do so, because you want to pretend away reality.
Your reality apparently. Tell you what, look up what the worldwide scientific community said about heliocentricity or plate tectonics or even Einstein’s theories. You reckon the worldwide scientific community might have been wrong on those or a hundred other things?
He’s a droid, programmed to repeat the official party politics.
Yet another irrational, illogical non-response response, Jim. Scientists sometimes having been wrong before is not evidence that they are “wrong” now.
You have never taken any logic courses have you. Look up the phrase “contradiction in logic” or “proof by contradiction”. You made an assertion that you believe is true, I proved it not true by using a contradiction.
You should realize that science is NEVER PROVEN or DISPROVEN simply by consensus.
Jim, your comments just get more and more ridiculous. You proved nothing whatever.
Your so-called “argument”, just blurting out “bu bu bu bu they’ve been wrong before!” could be used as an “argument” against literally *anything*, including arguing against things that we are more or less certain of being correct.
The one here who does not understand logic is you, son.
I expect the “son” thing is reversed, but be that as it may, you still have not shown one reference for any of your assertions. All you are doing is word salad ad hominems. That is really scientific! Congratulations.
Jim changes the subject again, which means he is tacitly admitting that his so-called “logical” so-called “argument”, that being “bu bu bu bu bu scientists have sometimes been wrong before” was neither logical nor an actual argument. It was nothing but irrational handwaving in order to try to pretend away reality. Sadly typical.
I googled “worldwide scientific community” to find their site. No climate porn sites came up. So, I really tried. I’ll have to rely on you- please tell me what the worldwide scientific community says regarding CO2 and climate change. For me, your word is good enough; others here will want citation.
Thanks paul, for yet another childish deflection away from having to face reality.
MC told you that the Southwest is an historic arid and semi-arid desert. You use the argumentative fallacy of Argument by Dismissal to just ignore that fact and couple it with the argumentative fallacy of Argument by Ad Hominem instead of actually addressing the point being made. You are a troll, pure and plain.
Tim, merely stating that the U.S. Southwest is “an historic arid and semi-arid desert” is in no way “evidence” that CO2 has “nothing to do” with current changes there.
Monte’s observation is every bit as logically flawed an “argument” as claiming, if, say, a meteor strike in the U.S. Southwest happened to set off massive forest fires, that the meteor had “nothing to do” with those fires, “because the U.S. Southwest is an historic arid and semi-arid desert, don’t ya know”. Its a totally laughable non-argument.
And so yes, I did make fun of that “argument”, because it was beyond obvious (to me anyway, but apparently beyond your limited comprehension) that it was not any kind of an “argument” at all.
“Tim, merely stating that the U.S. Southwest is “an historic arid and semi-arid desert” is in no way “evidence” that CO2 has “nothing to do” with current changes there.”
In other words you think the current changes in the Southwest are unique in the history of the area.
Here’s what you said: “yet water resources in places such as the U.S. Southwest have been dwindling, and continue to do so.”
Water resources in the Southwest have been scarce historically. It’s why it’s been classified as arid desert or semi-arid desert. If there has been a larger abundance of water in the recent past then THAT is what has been unique – not a return to what is considered historically normal. CO2 has been both higher and lower in the Southwest historically than it is today – but neither have changed its classification from arid/semi-arid desert.
“ the meteor had “nothing to do” with those fires”
The meteor is a direct causal link to the fires. Since CO2 has been both higher and lower in the Southwest in the past while it has remained classified as arid-semi-arid desert the whole time there is *no* corresponding direct causal link to CO2.
You are grasping at straws.
Check your own comprehension levels before criticizing those of others.
Tim says:
“Since CO2 has been both higher and lower in the Southwest in the past while it has remained classified as arid-semi-arid desert the whole time there is *no* corresponding direct causal link to CO2.”
Merely remaining “classified as arid-semi-arid desert the whole time” is far, far too broad a range to try to ascertain a causal link to CO2. You could say exactly the same thing about the meteor strike example. And you would be equally wrong.
Your religion is in trouble.
They’ll need a new one in five years, if not less. Perhaps by then, some will have finally learned that the things are charged mainly by generators running on natural gas and coal. Unlikely, but possible, while others are paying for it.
I appreciate the small lesson on arms in the age of cancellation.
Readers should be aware that the “HadCRUT4 record of monthly global mean surface temperature anomalies for the 172 years 1850-2021” is at best a blatant GUESS before the turn of the 20th century — even up to the end of WWI is is only representational and exact average annual temperatures should be be considered even vaguely accurate — only magnitudes are possibly accurate for comparative use.
Up until the first satellite measurements of almost the entire earth, all of the temperature averages were little better than guesses.
MarkW ==> With your point taken — satellite temperatures are not the same thing as thermometer measured surface air temps. One measures sensible air temperature at head height (in the past almost entirely by human checked and recorded thermometer readings — and in present by automated electronic weather stations). satellites measure heat content of the atmosphere at different levels — none of which are surface temperatures at six feet.
The problem of the past is that there simply were not enough thermometers adequately spread out geographically or recorded accurately enough to be analyzed into a Global single number.
What are the correct number of thermometers?
I can go a short distance and have a different reading.
Derg ==> That is the Sampling Problem that appears in almost every bit of research about anything. How many samples do I need?How close physically? How close temporally? How accurate? Measured and recorded by what methods?
You are dodging the question. You asserted “The problem of the past is that there simply were not enough thermometers adequately spread out geographically…” which begs the question of “how many would be enough”? a question you avoided answering.
John ==> If it were my research issue, say for my PhD thesis, I would have be to able to give a serious answer that question within the the perimeters of my overall research question. But I am not in that business.
The fact of “not enough thermometers adequately spread out geographically…” remains — and I need not have a precise answer to the question to makis the statement of obvious scientific fact. You see, more than one is a given, as is more than 1+1 …..and more than 1 + 2. Where that makes sense is a question that depends on whay question one is trying to answer and to what degrees of accuracy and within what range of uncertainty.
It really doesn’t matter much what the number or spread of thermometers is. It doesn’t matter whether you use absolute temps or anomalies. Using absolute temps creates a multi-modal distribution between the NH and SH. Since anomalies are greater in the winter than in summer the same multi-modal distribution occurs when using them. Thus the average is meaningless for describing the data. And that doesn’t even account for the propagation of uncertainty associated with thousands of measurements of different things using different measurement devices.
“The problem of the past is that there simply were not enough thermometers adequately spread out geographically or recorded accurately enough to be analyzed into a Global single number.”
There are enough thermometers, in the form of unmodified, regional surface temperature charts to show us it was just as warm in the Early Twentieth Century as it is today, and this pattern shows up in every region of the world where these measurements were taken, which in effect covers the whole world.
Being just as warm in the recent past as today means CO2 is a minor player in the Earth’s atmosphere, since there is more CO2 in the air today than back then, yet it is no warmer today than then. The regional surface temperature charts tell us we have nothing to fear from CO2.
The temperature profiles of the regional temperature charts look nothing like the profile of HadCRUT4 or any of the other bogus, instrument-era Hockey Stick charts.
If I were asked to choose between the regional charts and the bogus Hockey Stick charts as being the best representation of the global climate, I would have to go with the regional charts as being representative of the whole globe.
I don’t see how any other conclusion can be reached given the existence of the regional charts, and given the dishonesty displayed by the Temperature Data Mannipulators.
The unmodified regional surface temperature charts put the lie to the bogus Hockey Stick charts. One set of charts, the regional charts, were put together by human beings with no climate change agenda or bias, and the other set were created out of whole cloth by dishonest climate change activists to sell the human-caused climate change hoax. They have been very successful in their lies so far.
But actual recorded temperatures tell a different, benign story, of the Earth’s climate.
Hockey Stick charts were designed to scare people into submission.
Yes. If global means anything at all, it means the entire globe is doing the same thing. Far too many scientists use this interpretation. Regional temps tell a different story. They put the lie to “global changes” and meaningless averages.
I predict you will never see any of the usual suspects admit to this inconvenient truth.
Tom Abbott sadly keeps repeating the totally false claim that
“it was just as warm in the Early Twentieth Century as it is today”
If this claim were really true, Tom, then please explain to us how last spring frosts continue to come earlier and earlier, first fall frosts continue to come later and later, first spring blossoms come earlier and earlier, and plant hardiness zones continue moving toward the poles.
Fact is, even plants and the soil that they live in both know beyond any doubt whatever that temperatures have most definitely increased over the past century.
This data demonstrates that so-called “skeptics” such as Tom Abbott are … literally … “dumber than dirt”.
Warmth is typically measured against max temps. Last spring frost is dependent on min temps. Avg temps can go up from min temps going up just as easily as from max temps.
Tim Gorman says “Warmth is typically measured against max temps”
No it isn’t. Another typically false WUWT excuse in order to try to pretend away reality.
For the purposes of gauging climate change, average temperatures are what are primarily looked at, and the first and last frost dates data just cited demonstrates that averages have definitely been going up. Tom Abbott’s claim that it was “just as warm in the early 20th century” is completely refuted by this data and is totally false.
It is worth noting however that the CO2 warming mechanism does in fact influence minimum temperatures more than maximum temperatures. It was predicted decades ago that this would be the case, and it is what is actually observed. That’s another correct AGW projection that so-called “skeptics” disingenuously ignore.
Its fiction, GAT doesn’t even exist.
“GAT doesn’t even exist”
Another utterly ridiculous WUWT excuse for pretending away reality, as totally lame as pretending that there is no such thing as an average weight of people.
Tell you what, would you make saddles/halters in one size for the average height of horses? How about shirt sleeves in one size for the average arm length?
Today, all these come in different sizes! Do you know why and can you tell us the math behind using different sizes rather than the mean?
You also talk like anomalies are real temperatures, THEY ARE NOT! You sound like you know that either the whole earth is warming as the GAT says or that there are specific areas where it is happening. Tell us which and where! Inquiring minds want to know!
Jim says:
“would you make saddles/halters in one size for the average height of horses? How about shirt sleeves in one size for the average arm length? Today, all these come in different sizes!”
So what? Doesn’t mean there isn’t still an average size that can be calculated. Moreover, we would find that average shirt sleeves sizes today are larger than they were a few hundred years ago. As nutrition has become better, people have on average become larger.
What a laughably lame excuse for pretending away reality, Jim!
You are continuing to show your lack of knowledge, do you know that?
Sure you can calculate a mean value of a distribution. The point is that without the other statistical parameters that are associated with the distribution from which you obtain the mean, you have no way to know what the dispersion of the data is.
What was the last statistics class you took? Did the instructor allow you to assume all distributions are Gaussian? If so, you wasted your money.
re: “What was the last statistics class you took?”
Ha! I’ve *taught* college engineering statistics, Jimbo.
So stop pretending that I don’t know what I’m talking about, and try instead reading *carefully* and *thoughtfully* what I said:
“Doesn’t mean there isn’t still an average size that can be calculated”
That average size (or, in the case of climate change, average temperatures) would be calculated from the values of the individual datapoints that make up the dataset. Yep, to calculate the mean, we would need to know those individual data point values. Therefore the dispersion of the data would be known as well … for shirt sleeve sizes, or for global temperatures. DUH.
Jim also said: “You also talk like anomalies are real temperatures, THEY ARE NOT!”
Wrong again, son. “anomalies” are nothing more than a fancy term for the calculated change of real temperatures. But apparently you have swallowed some WUWT anti-science propaganda that has you imagining otherwise.
Oh yeah! Come on smart guy, tell us the statistical parameters associated with the GAT anomaly AND the same for the real temperatures! As a teacher you must know that a mean is meaningless without knowing these parameters. What are they?
Or maybe you have ingested the propaganda and incorporated it into your system.
Attached is a graph from a previous post on this site. Show us a graph of a local/regional location that generates temperatures sufficient to have an average of GAT for the same period!
Your lack of references just keeps making your lack of knowledge about the subject more and more plain.
Really Jim? You are imagining that data from just a single season of the year at a single little teensy weensy location on the planet is “evidence” ?? What is the matter with you?
And really? Are you truly unaware that there are literally hundreds of measurement stations around the globe, similar to the one you reference, with the vast majority of them showing a clear warming trend that’s been going on for decades? You really don’t know this?
If you are truly unaware of such well known facts, then you have no business whatever engaging in a genuine climate change discussion. You don’t meet even the simplest prerequisites.
And sorry, but no, I’m not your remedial tutor on this. Genuinely educate >>yourself<< for a change. That means getting off this WUWT propaganda channel and investigating instead what the most prestigious scientific organizations in the entire world have had to say about this topic, and the decades of data that they have to back what they say.
You just keep on with the ad homs! Shame, shame. Someone able to teach college level math should have better responses to my references.
You should also know that for every data point below the average, you need one the same distance above the average in a Gaussian distribution. If the distributions aren’t Gaussian not knowing the associated statistical parameters is even worse. And, btw, averaging SST’s, NH/SH always gives a multimodal distribution.
I see you are into the concensus science religion and its dogma. Take your own advice and do some in depth research into how the atmosphere works.
I have included another graph from NASA that shows the GAT. Find another site where the average with the Japan data comes out with the GAT. FYI, Japan’s last year is 0.41 and the GAT is about 0.9. When you find one we can scratch those two from the list.
“And sorry, but no, I’m not your remedial tutor on this.”
I’ll tell you the same thing. If you haven’t done the research and can’t post references then you are behind the 8-ball. Ad hominem,’s and appeals to your own authority don’t fly here.
Forgot to add the graph with shading.
Jim, your questions about station data are on the same level as if, say, we were in an algebra class discussing the quadratic formula, but you are asking how is it that we know seven times nine is sixty three.
That’s the level of gross incompetence you’re displaying here. You don’t belong in any serious discussion of climate change if you are genuinely not aware of the answers to your questions.
“concensus science religion”
A truly childish so-called “skeptical” talking point, and yet another indication of your woeful lack of any kind of genuine competence on this topic.
Troll answer. You fail again.
Sorry that you are unable to handle the reality of your lack of competence on this topic, Jim.
Troll answer. Fail again.
Answer my question.
Jim also says: “btw, averaging SST’s, NH/SH always gives a multimodal distribution.”
So what? There’s a multimodal distribution of human heights, too, male vs female and adult vs child. That doesn’t in any way, shape, or form change the fact that humans have been getting taller over the past few centuries.
Likewise, a multimodal distribution of SST’s doesn’t in any way, shape, or form change the fact that our planet is warming. Not to mention that one might expect to see that kind of distribution, given the uneven distribution of land masses between the hemispheres.
Yep, just another utterly laughable, totally incompetent, so easily refuted so-called “skeptical” so-called “argument” from Jimbo.
I’m truly embarrassed for you, son. Your “arguments” are all so tragically ridiculous.
Troll answer. Fail again.
A legitimate response from Jim would have been to accept and acknowledge that the mere existence a multimodal distribution is not relevant to the discussion of the trend of a dataset over time. The example of the trend of human heights over time fully demonstrates this.
But no. Instead, we’re treated to Jim’s new go to “response”, apparently to be seen every time now after he’s been totally owned:
“Troll answer. Fail again.”
Troll answer. Fail again.
Answer my question. You made the claim, not me. Let’s see your response.
Nothing more from me until you answer my question about the book you taught from. This is not a hard question to answer. It doesn’t even require you to use an internet search. Just a simple book title and author.
And oh, by the way, my comments were not “ad homs”.
Pointing out that you don’t meet the prerequisites for a genuine discussion, because you are not aware of the actual station data, is not an “ad hom”. It is a simple statement of fact, no different than stating the fact that a student does not meet the prerequisites for Calculus I, because they have not yet learned algebra.
Among others. Ad hominem. Maybe you should read about the definition.
You are being silly avoiding his challenge, I think you made your claims up since you haven’t once explicated a cogent reply to his challenge.
The longer you avoid an answer that meets your claimed expertise you will be considered unreliable therefore dismissed.
You can’t even honestly take up his challenge, it should be easy for you to tackle being a TEACHER of Engineering Statistics.
What is holding you back?
You claim to have taught “engineering statistics” at college. I would like to obtain the book(s) you used in your classes. Pleade tell us the title and the author. An ISBN number would work also.
First things first, Jimbo. You first need to educate yourself on the station data. It is completely useless discussing any statistics textbooks or any statistical make-up of the data when your commentary demonstrates that you don’t even know what the data is to begin with.
Troll answer. Fail again.
Answer the question.
You don’t even know the data, Jim. Your comments indicate that you know only certain cherry picked bits and pieces of the data that WUWT has disingenuously spoon fed you.
Under such circumstances, any discussions or any questions about statistics textbooks or the statistical distribution of the data are therefore meaningless, and will remain so until you’ve actually educated yourself on the overall station data.
But I’m not holding my breath on that happening any time soon.
Troll answer. Fail again.
Answer the question.
Did your textbook even discuss metrology, uncertainty, and how to propagate it? My guess is that it didn’t. None of mine did till I got into the engineering lab and was taught by the professors that the correct answer was not an average of everyone’s results because each workstation had different equipment – i.e. multiple measurements of different things using different measuring devices. Just like in temperature measurements around the globe.
What did *you* teach your students on this subject? I pretty sure it wasn’t in the textbook.
“the correct answer was not an average of everyone’s results”
I mentioned much this same idea to Willis Eschenbach after he tried to pretend that his mere arithmetic averaging of sea level tidal gauge datasets “proved” that the Church & White sea level trend calculations, published in the peer reviewed scientific literature, were “wrong”.
Not surprisingly, he continued to pretend away anyway, LOL.
For a man who claims to teach engineering statistics you write like a teenager with a lot of angry replies and blog wide insults.
You lose credibility when you behave like this.
sunset –
The real insults here are all the illogical and irrational “arguments” that try to pretend away reality with half truths and false information.
Troll answer. Fail again.
Answer my question.
Your continued refusal to provide a simple book title and author is very illuminating.
But YOU don’t explain it as a “teacher” you avoid discussing the fine details completely which is why I think you are bogus.
I hate droids—/whack/
MGC: There exists an average weight of people IF you count and weigh them all, every one. Any fewer and you don’t have enough data to say “average of people”, but you could fudge it.
Now, if you can determine the narrative, you can plan your fudge. For instance, if you want to show people are gaining weight over time, you can adjust the past average weight downward (the people they didn’t count in the thirties and forties were skinny, so……). See, I do know what the worldwide clisci community says. And does.
“There exists an average weight of people IF you count and weigh them all, every one”
Oh please. Yet another utterly ridiculous nonsense “response”.
If you measure a decent representative sample, you can get a *very* good idea of what the actual average is. Same with global temperatures. Pretending otherwise remains nothing but pathetically childish hiding from reality.
And then we have another blind parroting of the totally made up out of thin air “they adjusted the past downward” denier nonsense.
Yeah right, they “adjusted” farmer’s and gardener’s long publically available records from all over the world that clearly demonstrate how growing seasons have been increasing over time because of the warming trend.
You guys should be truly ashamed of yourselves with all these laughably nonsensical and totally bogus “arguments” that you bring to the table. What an anti-science disgrace.
Show some studies where rising night time Tmin temperatures pose an “existential” risk to humans. Without that risk, why are we destroying current electricity production?
99.999% show high temperatures being the problem.
You have yet to provide any references that back up your criticisms or assertions. You won’t be considered to be more that a troll if you continue without showing some studies to back you up.
Simple logic tells you that rising night time temperatures will ameliorate the need for heating at night thereby reducing energy use. That’s Tmin in case you don’t know.
Again, show some references.
Here we go now with the typical “move the goalposts” routine.
The question, Jim, was whether it is warming or not. You fools tried to pretend it wasn’t. Now you’ve essentially acquiesced, Jim, in moving on to “bu bu bu bu is it really a problem”, to admitting that you were just blowing smoke on that question. So disingenuous.
Jim also asks: “why are we destroying current electricity production?”
We’re not. Yet another made up out of thin air so-called “skeptical” claim.
Here we go again. More troll bait. WUWT has a new troll.
Come on dude, put some facts behind your assertions. Simply “declaring the truth” doesn’t fly here.
Tmin increases are a good thing. You may call that moving the goalposts, but that is your problem to refute not mine.
Tmin’s are increasing, that will raise an “average” temperature” while hiding the reason for the change.
Like it or not an average is only the center of a normal distribution. The other statistical parameters are just as important as the mean. If you can’t quote them, then neither can you claim the average shows anything.
Your evasions are destroying your credibility, why can’t YOU get on with the discussion?
I no longer believe that you taught Engineering Statistics because you keep avoiding discussing it in the thread where it should be EASY for you to talk about.
You haven’t addressed my questions about an average. Why?
An average (mean) is meaningless unless you also provide the statistical parameters that define the distribution. Things like standard deviation/variance, kurtosis, skewness.
Please post these parameters for the GAT so we can know what the anomaly distribution looked like. Then find the same information for the real temperatures that are used to calculate the GAT anomalies. Without this information, YOU are the one waving your hands in the wind. You have no basis for claiming you know anything about the statistical parameters used in describing the distributions.
“An average (mean) is meaningless unless blah blah blah … ”
Ridiculously false. And anyone who actually knows what kurtosis and skewness are should immediately realize what a ridiculous falsehood it is.
SMH in disbelief at the lengths some folks are willing to go to in order to pretend away reality.
Keep it up MostlyGarbageCrap. Pretty soon people who deal with statistics for real work will simply start skimming your comments because they contain no useful information.
Some of us have been arguing with the Gormans for months over this. They are completely impervious to any argument., and will just keep asserting things like this. They believe that the more samples you have the more uncertain the mean will be. They believe that averages tell you nothing, yet seem to be happy to accept them when talking about the pause. And as you’ve noticed they are very good at changing the argument rather than admit a mistake.
As usual your ignorance is overwhelming. When you are measuring different things using different devices the uncertainties *DO* grow. You been shown this multiple time from the Taylor and Bevington tomes on uncertainty. And you simply say they don’t understand and dismiss their work.
They even point out that *ALL* measurements of combination of random and systematic errors. They can’t be separated out. Uncertainty only cancels when it is totally random, all systemic uncertainty has been somehow eliminated. So even multiple measurements of the same thing using the same device can see uncertainty grow purely because of the systemic error inherent in the measurements.
Again, your ignorance is amazing. Averages of the measurements of different things using different devices simply cannot tell you anything about the distribution of the measurements. You seem to think that if you just pick up random boards you see discarded in ditches or dumps you can calculate their average and get something meaningful. Something you can use to build a stud wall in a house or to use in ordering studs from the lumber yard to build a deck on the back side of your house.
There are none so blind as those who will not see. I’m not happy with *any* so-called “global average temperature”. All I see is whining from the CAGW advocates when someone uses the data the CAGW advocates depend on to rub their noses in what that data shows.
The only time the goal-posts change is when you refuse to stay on the playing field and actually answer the assertions addressed to you!
Thanks for proving my point.
Rather than rehash all the arguments people can go back to previous discussions such as this from last month
http://wattsupwiththat.com/2022/03/04/the-pause-lengthens-again-no-global-warming-for-7-years-5-months/#comment-3471360
or for some prime goalpost moving
https://wattsupwiththat.com/2022/03/15/satellite-and-surface-temperatures/#comment-3478615
And, for yet another time. I have not said Taylor and Bevington don’t understand what they write. I’ve said you don’t understand what they write.
Bellman –
Thanks for those references. They’ve helped me better understand the wild level of irrationality that we’re dealing with here.
Nutter.
“If you measure a decent representative sample, you can get a *very* good idea of what the actual average is. “
Actually you can’t. You can only do so from statistics textbooks that assume all those measurements are 100% accurate. If they are not 100% accurate then you can only calculate the actual average to within an uncertainty interval propagated from the individual measurements.
Sorry, Tim, but no, statistics textbooks do not “assume all those measurements are 100% accurate”. I’ve taught university engineering statistics, which absolutely includes measurement uncertainty. You haven’t a clue what you are talking about. None.
Your further claim, in your follow-on screed below, that climate scientists are “totally ignorant of metrology principles” is just as utterly ludicrous and just as totally false.
You’re still just blowing smoke in order to pretend away reality.
Give me the title and author of a statistics text book that include an uncertainty interval for the data in any example and how to handle that uncertainty.
What you have taught is most certainly how to handle uncertainty in a set of MULTIPLE measurements taken from the SAME THING using the SAME device. I.e. all error is random and cancels out.
“Your further claim, in your follow-on screed below, that climate scientists are “totally ignorant of metrology principles” is just as utterly ludicrous and just as totally false.”
ROFL! And yet you can’t give a single, on-point criticism of where I am wrong! I give you Berkeley Earth which states right in their data set that they assume instrument precision is the uncertainty of their data points – and then go on to show they think the precision of thermometers in the 1920’s was in the hundredths of a degree!
Jim is right. You are a troll with absolutely nothing to offer except the argumentative fallacy of Argument by Dismissal. You can’t refute anything so you just dismiss it out of hand. The mark of a true troll!
Most climate scientists are like you, totally ignorant of metrology principles. The GAT is formulated of many individual measurements of different things by different measuring devices.
Each of those measurements carry with them an uncertainty that is not a constant. When you add all those measurements together you must also add together their uncertainties. At some point the propagated uncertainty interval exceeds the sum of the temperatures thus rendering the entire process of calculating a mean a useless activity.
This applies to so many studies done today it is unbelievable. It is a consequence of university-level statistics classes never addressing uncertainty. Go to your local university and ask to look at their statistics textbooks. They *all* describe data sets as stated values only – no associated uncertainty. Even those that do something like calculating an average weight only use assumed 100% accurate data points. Like all scales are 100% accurate. So the scientists trained in those classes just assume the same thing. They will weigh 1000 people using 1000 different scales and assume the calculated mean is 100% accurate. In reality, just like temperatures, sooner or later the propagated uncertainty of each of those measurements will overwhelm the ability to sum all the weights and get a mean that actually describes the data.
And you have just sucked all this down from the climate scientists using a GAT that is truly meaningless.
Consider what you get when you add monthly temps in the NH with monthly temps in the SH? You get a bimodal distribution at best, and more likely a multi-modal distribution based on latitude bands. What does the average of a multi-modal distribution tell you?
Essex, C., McKitrick, R., & Andresen, B. (2007). Does a Global Temperature Exist? J. Non-Equilib. Thermo., 1–27. doi: https://doi.org/10.1515/JNETDY.2007.001
Abstract: Physical, mathematical, and observational grounds are employed to show that there is no physically meaningful global temperature for the Earth in the context of the issue of global warming. While it is always possible to construct statistics for any given set of local temperature data, an infinite range of such statistics is mathematically permissible if physical principles provide no explicit basis for choosing among them. Distinct and equally valid statistical rules can and do show opposite trends when applied to the results of computations from physical models and real data in the atmosphere. A given temperature field can be interpreted as both ‘‘warming’’ and ‘‘cooling’’ simultaneously, making the concept of warming in the context of the issue of global warming physically ill-posed. (my bold)
“there is no physically meaningful global temperature for the Earth in the context of the issue of global warming”
Utterly ludicrous. If some cataclysmic event happened that suddenly raised temperatures all over the earth by 40 degrees, to pretend that this would not be “physically meaningful” is nothing but pure nonsense.
What is even more nonsensical is people actually listening to this kind of garbage.
Troll answer. Fail again.
Answer my question.
Now your answer is truly stupid especially when you want to use the super rare extinction level event to bolster your dead-on arrival argument.
Pat, there is also a lot of time series problems that are totally ignored. One, why are calendar years used and not seasonal periods. Two, are the data used to calculate a GAT stationary (the mean and variance don’t change across time)?
Malarky!
Canada is considered to be *colder* than Texas even during the summer. That’s not because of their minimum temps, it’s because of their max temps! Topeka, KS is colder than Mexico City not because of minimum temps but because of maximum temps.
The only one trying to pretend away reality is you.
As I already told you, the average can go up just as easily from min temps going up as from max temps going up. Min temps going up just doesn’t carry the “scare factor” that max temps going up do.
The latest ag scientist study I have shows lengthening growing seasons from earlier LSF and later FFF while also showing moderating heat accumulation over the season. The only way that could happen is if min temps are going up and max temps are going down. As usual, you lose data when you look at an average. You lose at least the range and standard deviation descriptors when only looking at an average.
You all can try to hand wave reality away as much as you want. Temperatures are still going up no matter how much you try to pretend otherwise.
Again, put your money where your mouth is. Show some of the local/regional temperatures where this is occuring.
Here is just one data set covered here.
https://wattsupwiththat.com/2022/03/09/japan-sees-no-winter-warming-in-decadestokyo-winters-havent-warmed-since-1984/
Now show us one you have that has a large growth in temperature that makes the GAT average work. Please use real temperatures, not anomalies just like this post on WUWT.
Winter trends since 1988 from GISS
And so an increase in winter temps is a bad thing? It means longer springs, summers, and autumns!
Would you want to destroy the current electrical production and distribution if your winter temps increase by 1.5C? Believe me, I would say bring more CO2 on. Longer growing seasons for growing crops is a good thing.
“And so an increase in winter temps is a bad thing?”
Congratulations on winning the moving goal posts award for this hour.
You pointed to a cherry picked data set showing no warming in Japan, in winter, since 1988.
You asked where the large increases in temperature are to cancel out Japan’s lack of winter warming.
I show you the global changes for winter since 1988.
You change this to a question about whether it’s a good thing or not to be warming in winter.
In case you don’t know the world is round, the southern hemisphere is in summer when it’s winter in the north.
Here’s the trends for NH Summer since 1988.
https://data.giss.nasa.gov/gistemp/maps/
I never asked for “global averaged temperatures”. I asked for local and regional graphs that show the how the GAT can be reached when there are areas with little to no growth.
You need to investigate further the conundrum you have raised.
Look at your graph for the area surrounding Japan. Do you think there is a problem between what NASA is showing versus the study shown on WUWT? I would hope so.
Please explain why NASA’s calculations for that area show such a warming while using actual, real data recorded at real existing weather stations does not show that.
“I never asked for “global averaged temperatures”.”
And I gave you a regional chart.
“Look at your graph for the area surrounding Japan. Do you think there is a problem between what NASA is showing versus the study shown on WUWT?”
The NASA graph shows no warming for winter over Japan, just as your JMA graph shows.
Jim, is this a serious question? Are you *really* not aware that the large majority of temperature measuring stations worldwide have been showing a warming trend for many, many decades? Seriously? You are genuinely unaware of this well known fact?
And are you really not aware of the large increases in temperatures in the Arctic region of the world? Some arctic stations have seen 3 to 4 degrees centigrade warming over just the past 40 years.
And are you also not aware that AGW theory predicted, decades ago, that, indeed, the arctic would be the part of the world that would warm the fastest? That’s a massively correct prediction from what you so-called skeptics ridiculously call “failed projections”.
And then you want to go and pretend that the silly little WUWT article that you referenced, that presents data from just a *single* season of the year at a *single* location, somehow represents “evidence” ?? What the bleep is the matter with you?
And, of course, you didn’t even bother to research the data for the other three seasons of the year at those locations in Japan, did you? No, of course you didn’t. But I did. On a four season basis, it has definitely been warming at those places in Japan.
Yep, as it turns out, your WUWT propaganda puppet masters dishonestly cherry picked just one little slice of the year in just one little teensy weensy part of the world, in order to intentionally deceive. And you fell for it hook, line, and sinker.
I’m not only embarrassed for you but am, honestly, deeply ashamed for you, that you would blindly accept the say-so of a bunch of dishonest pseudo-scientific charlatans here on WUWT, rather than investigate what the most prestigious scientific organizations in *every* major developed nation everywhere around the world have had to say about these topics. Its truly disgraceful.
“Jim, is this a serious question? Are you *really* not aware that the large majority of temperature measuring stations worldwide have been showing a warming trend for many, many decades? Seriously? You are genuinely unaware of this well known fact?”
Which temperatures? Tmin or Tmax? Or are you just looking at the mid-range averages?
Ag studies today show that the CONUS is seeing expanded growing seasons with stagnant or lower total heat accumulation over the growing season. That can’t happen if Tmax is rising. If it is Tmin rising then tell us all exactly what bad things that will cause. We await breathlessly!
Remember, a mid-range average can go up because Tmin goes up just as easily as if Tmax goes up.
Tim claims “moderating heat accumulation over the season”
Also false. Not that this is any surprise. Practically everything that so-called “skeptics” bring to the table is so easily demonstrated to be false.
75% of measurement stations in the U.S. are showing an increasing trend in growing degree days:
https://www.epa.gov/climate-indicators/climate-change-indicators-growing-degree-days
“Tim claims “moderating heat accumulation over the season”
Also false. Not that this is any surprise. Practically everything that so-called “skeptics” bring to the table is so easily demonstrated to be false.”
Malarky! Why don’t you do some *real* research instead of just making unsupported claims.
From http://www.nature.com/scientificreports
Published online 3 May 2018
“US Agro-climate in the 20th Century: Growing Degree-Days, First and Last Frost, Growing Season Length, and Impacts on Crop Yields”
“The trends in the CONUS agro-climate with respect to agricultural production, in conclusion, can be characterized by decreased heat accumulation during a fixed crop growing season for the majority of commodity crops, and lengthening of the climatological growing season for all crops studied. This implies that these two agro-climate indicators, counter each other as a lengthened CGS means increased availability of heat accumu-
lation (in cases where producers and managers actually adapt to a longer CGS), whereas heat accumulation over time has decreased, which results in longer time (seasons) required for crop maturity. Hence, the actual crop yield impacts that different cropping regions have experienced would be dictated by a complicated balance between the lengthening of CGS and the decrease in heat accumulation. ”
Before you start calling someone a liar you need to make sure you have some basic facts in hand.
“unsupported claims” ?? You were given a valid, verifiable reference. Thanks for yet another outright LIE, Tim.
And I don’t see your reference as invalidating what I stated, which was that “75% of measurement stations in the U.S. are showing an increasing trend in growing degree days”. In fact, figure 1b of the paper you reference looks like it confirms my statement.
If 75% of the stations in the US are showing a warming trend then how can the national average for heat accumulation during the expanding growing season be stagnant to down? Use your brain for once!
Just as you’ve been arguing all along, Timmy Boy, mere averages don’t tell the whole story.
Again, figure 1b of your own reference supports my statement that 75% of the stations in the US are showing a warming trend.
“Again, figure 1b of your own reference supports my statement that 75% of the stations in the US are showing a warming trend.”
And now we are back to the canard that the average of an average of an average can tell us a believable trend line.
BTW, Fig 1 in the article is on GROWING DEGREE-DAYS, not temperature. It’s apparent you don’t even know what degree-days are! Growing degree-days can go up because of longer growing seasons without any change in Tmin or Tmax.
You just keep on showing yourself to be a troll! Change your name and come back and try to convince us that you actually know something on the subject and aren’t just a CAGW troll.
Timmy, I’m fully aware of what growing degree days are, thank you.
If growing degree days are increasing, and figure 1b shows that in around 75% of the country, they are increasing, then there must be some kind of a warming trend occurring at those locations … even if Tmin and Tmax should happen to remain unchanged for some of them.
My statement still stands: 75% of the stations in the US are showing a warming trend.
You do *not* understand degree-days. The more days you have with temperatures above the set point the higher the degree-days value gets. There doesn’t have to be any warming trend at all. In fact the trend can actually be going down while the total degree-value goes up!
As usual you just prove yourself to be nothing but a troll, and a bad one at that!
You do understand that last frost dates may or may not actually affect an average. It is one day a year, not a group of days like a month. It also depends on what the Tmax is for those days whether you see any change or not.
Jim, temperatures are still going up no matter how much you may want to try to pretend otherwise.
A very simple measure of total heat accumulation, seasonal growing degree days, has been on an increasing trend at 75% of measurement stations here in the U.S.
https://www.epa.gov/climate-indicators/climate-change-indicators-growing-degree-days
Read this and understand it. It refutes your assertions.
From the study:
I expect you know little about farming and purchasing the correct variety of seed for the soil and temperatures in your fields.
I grew up shoveling out chicken poop from chicken coops. That is, working on farms doing everything. Believe me, WEATHER can be devastating to crops, climate change not so much.
Jim, your quote says nothing, nothing, nothing at all about the actual question that has been on the table, which is … is it warming or not.
Another typical “move the goalposts” example. So disingenuous.
Actually over the last 7+ years it has not been “warming” according to UAH.
You want to tell us if Tmax or Tmin has been falling? If you want to be an expert, you should know the answer off the top of your head.
Tell us where. Narrow your view from a “GAT” temperature anomaly to more local. I know you can find numerous locations that have little to no temperature anomaly increase over the last 150 years. That means you must find locations with a 3 degree increase to make the average anomaly come out to 1.5 degrees.
Put some data behind your assertions.
The data you ask about has been freely available at a multitude of locations for a long, LONG time, Jim. How about you do some REAL research of your own for a change (i.e. don’t just blindly accept whatever anti-science drivel that WUWT wants to vomit into your empty skull).
Just as I thought. You are a troll. You have no data to back up your assertaoooons. Come back when you have educated yourself.
If you are truly unaware of this data that you are asking about, Jim, then you have zero business discussing any of this topic.
These are very basic, well known facts that anyone who wants to legitimately engage in climate change discussion should already be well aware of. If you are truly unaware, then the climate troll here is no one but you, pal.
Genuinely educate yourself for a change and then maybe we can have a legitimate discussion.
Have you posted one measly reference or graph? You are a troll. Who is paying you?
Earlier, Jim stated:
“I know you can find numerous locations that have little to no temperature anomaly increase over the last 150 years.”
So here’s the giant elephant-in-the-room question:
Why do Jim’s comments indicate that he is not equally aware of the data at hundreds and hundreds of other locations, which all show a clear warming trend that’s been in place for decades and decades? Why?
Oh never mind. We all know why, including Jim himself.
Jim knows that if he ever actually looked into the totality of the data, published by the most prestigious scientific organizations in the world, then his fairy tale world of denier delusions would be ripped to shreds. And Jim just can’t accept that.
So instead, Jim just blindly accepts whatever biased, dishonest, cherry picked propaganda that WUWT wants to vomit into his empty skull. Like that totally disingenuous cherry picked dataset he just referenced the other day, of just one season of the year in just one little teensy weensy part of the world.
If Jim wants to engage in any kind of legitimate discussion of climate change, then he has to investigate the totality of the data, not just certain cherry picked parts that he can pretend are “supportive” of his anti-science worldview. But Jim has never done so, despite months and months if not years and years of opportunities.
And to all appearances, Jim has no intention of doing so any time soon. Thus, its difficult to imagine why much of anything that Jim has to say about climate change would be genuinely worthy of consideration.
Apparently, Jim just wants to play the climate troll, nothing more.
Troll answer. Fail again.
Answer the question.
ROFL! Of course high temps are what is used to judge the warmth of a local climate. It’s why Dallas is considered to be warmer than Toronto! It’s why San Diego is considered to be warmer than Seattle!
Of course they have. But averages give you *NO* information about the temperature profile. No range, no standard deviation, no minimums, no maximums, no quartile information. Have you ever heard of the 5-factor statistical description? Or do you just always assume all data fits a Gaussian curve?
You are ignoring the inconsistency in your assertions. Warmer minimums won’t cause crop failures and global starvation – which the AGW advocates claim will happen in the next ten years (always 10 years in the future, why is that). Higher minimums won’t cause species loss – another AGW claim.
The AGW projections *always* assume that the average is going up due to higher max temps. ALWAYS! Earth is going to turn into a cinder if we don’t eliminate fossil fuels and cause starvation in poor countries.
More Timian handwaving in order to pretend away the reality of a warming world. Not to mention poor Timian reading comprehension skills.
Here’s what was stated: “the CO2 warming mechanism does in fact influence minimum temperatures more than maximum temperatures”
Tim’s poor reading comprehension somehow got him to imagining that this must mean that maximum temperatures won’t increase much at all, if any.
But of course that is not anywhere near what it actually means.
I’m embarrassed for Tim to see that he’s not even at a 7th grade level of reading comprehension.
Please read more carefully next time, son!
You totally miss the point that increasing Tmax is what will cause crop failures, desertification, species loss, etc – *NOT* rising Tmin.
It is Tmax that the climate scientists claim are rising because they are predicting things that only a rising Tmax can cause.
At least you are finally admitting that it is rising Tmin that is causing the temperature rise in the average of the average of the average temperature values the climate scientists are seeing.
Give up your defense of CAGW – the evidence simply doesn’t support it. From ag studies to consecutive record crop harvests over the past twenty years to the greening of the earth by more than 10% since 1980 everything points to a rising Tmin from the CO2 increase (as well as providing more plant food) and from a holistic view of the biosystem known as the Earth that is all a GOOD thing, not an existential threat!
Still pretending that Tmax is “not” rising simply because Tmin is rising faster?
Try again, Timmy.
Lord M – Just for laughs ( and also to avoid doing any actual work on this dreary Sunday afternoon in Ontario), I copied last month’s UAH 1979-2022 LT graph, and sketched on it the current Monckton Pause. I also sketched on the previous (1997-2014) Monckton Pause, greatly celebrated at the time but now languishing forlornly in the mists of antiquity. Here it is.
(As I’m only a commenter, the JPEGs that I upload always come out too small to see the details, but you can click on them and they open at full size in a separate tab or window).
Yes I know that your lordliness used RSS for the previous pause, but in those years there wasn’t that much difference between the two satellite services; it was in those heady days before RSS adjusted itself into alarmist territory. And it’s just an illustration anyway.
What can one deduce from this inconsequential little exercise? What I (cynic, skeptic, long-c0vid-survivor, dεnier from the top of my head to the soles of my feet) deduce is that there’s a temperature series with an apparently monotonal increase of about 0.12°C per decade, with a high-frequency spikiness due in part to all those niños and niñas running around and getting underfoot, and the occasional volcano to smack them down*.
The high frequency variation creates an opportunity for a peer of the realm with a mathematical bent to do some least-squares fitting and produce horizontal lines, which he then lordishly posts on WUWT with a striking display of erudition, fuelled by an apparently limitless vocabulary.
I look forward to these posts, not because the horizontal lines teach me anything, but because I get a chuckle from the aristocratically understated humour contained in the lordly posts. Plus, I usually get to learn a new word. Today was a double offering – “comital” and “frit” (I had to look them both up!).
With respect, your eminence, thank you for your explanation of the role of feedback; it’s a nice succinct demonstration of one of the many reasons why “mainstream” climate science gets it so wrong. Unfortunately, simple though it is, and even though each time you explain it, it gets even simpler, it is still probably beyond the intellectual capabilities of most of the opposing team (and those who could understand it will undoubtedly just dismiss it as a denialist fabrication).
The crest of a wave. From here it will level out and begin to decline. There is no other possibility. That is when the climate zombies will start to awaken from their deep nightmare.
AMO peaking…
Central Europe measurements and Antarctic ice core.
How much evidence do we need?
The only reason that co2 is suspected as the culprit for the modern milding is due to the timing with natural cycles. They will of course diverge (they already are) more and more as the time goes on
Zombies awaken?
Aside from being a mixed metaphor, “Ain’t zombies. Them boys is jest stupid!” – RAH
Hockey stick away
The new Pause lengthens: now 7 years 6 months
By using this piecewise approach to global mean temperature history you are falling into the trap laid by Skeptical Science years ago.
The Escalator – How contrarians/realists view global warming
https://skepticalscience.com/escalator
BS though it is, to the casual reader it is a very powerful piece of comparative logical thinking.
So, a 7 years 6 months pause? Climate alarmists will say it’s the long term trend that counts.
The alarmists will choose the parameters that shows them to be right and the media will back them to the hilt and in some cases so will governments.
Stop this nonsensical update, Brench. It doesn’t help.
”Climate alarmists will say it’s the long term trend that counts.”
Too which we should reply…define ”long term” There is usually no answer – rendering their comment stillborn.
Yeah, right. CNN and the BBC will collapse with shame. You’ve obviously put a lot of thought into this, Mike.
I’m not suggesting they will stop flogging the dead horse. That will happen slowly and one by one. But the need to shine a light on the bullshit remains….
Bob Tisdale improved on that SKS post with this one:
SkepticalScience Needs to Update their Escalator
and this one:
SkepticalScience Misrepresents Their Animation “The Escalator”
Enjoy.
So bellman plagiarized SkepticalScience, amusing.
Leitmotif should stop whining. These articles on the Pause will continue for as long as the Pause continues. It may well end with the next large el Nino: but it serves to illustrate, graphically, the failure of global temperatures to rise anything like as fast as the climate Communists had originally predicted. If Leitmotif does not want to read these articles, he is under no obligation to do so.
As to the “escalator”, as an architect I know that if the runs are long and the rises are few the slope will be gentle. And the runs – the Pauses – are certainly long. They are not what one would expect on the basis of the climate fanatics’ predictions.
Stair steps make me very skeptical of what is going on.
First, for temps to continue on at the high values of an El Nino it means CO2 must have “tipping” points that are passed and permanently warm the globe. I really need to see proof of what mechanism is at work to cause this.
Second, UAH shows a vastly different thing going on with temps. See the attached figure. The return to zero of both La Nina’s and El Ninos are more like what should happen with an earth that tends to an average value. It also make the stair step theory very bogus.
There is no pause, you dolt, Brench. There is also no GHE or ECS.
Stop your sophistry and maybe people like Antonio Gutteres will stop telling us it is Code Red.
North-Atlantic Sea Surface temperature has already dropped since 2016.
Feedbacks???
FFS, the only feedbacks are for bogus climate scientists as they open and close their tills!
The sun heats the planet. The planet heats the atmosphere.
END OF!
Leitmotif – not for the first time – displays his ignorance. If there are no feedbacks, then there is no likelihood of warming fast enough or severe enough to be apocalyptic. it is because of the imagined large feedback response to tiny direct warming by noncondensing greenhouse gases that climatology has erroneously predicted large warming. No amount of childish shouting on the part of Leitmotif will alter that fact, which is becoming ever more widely known and discussed.
Leitmotif – not for the first time – displays his ignorance.
I think ignorance is in your domain, Brench.
WTF are you talking about, Brench? You do realise that you believe in warming by some feedbacks and I don’t believe in feedbacks or warming at all.
Do you actually read before you comment?
If there were feedbacks they would have been measured by now.
THEY HAVE NOT BEEN MEASURED. NO WARMING HAS BEEN MEASURED
Science 1 Brench 0.
Don’t be silly. Though no individual feedback process can be quantified by measurement or observation, or even quantitatively distinguished from the forcings that engendered it, the fact that feedbacks exist and cause warming can be very simply demonstrated by considering the position at the temperature equilibrium of 1850. The reference or pre-feedback temperature that year was the 263 K sum of the 255 K emission temperature and the 8 K direct warming by preindustrial noncondensing greenhouse gases. Yet the observed temperature that year was 287 K. The 24 K difference between 287 K and 263 K was feedback response.
The climate is a complex dynamical system. Therefore, it contains feedback processes. Those feedback processes cause feedback responses that have had the effect of elevating global mean surface temperature above what it would have been if there had been no feedback processes in the climate.
In any dynamical system – such as the climate – in which feedback processes operate, the norms of control theory are applicable. Climatology has flouted those norms to a fundamental degree by overlooking the fact that the 255 K emission temperature itself engenders a feedback response, and attributing all of that feedback response to, and adding it to, the actually minuscule feedback response to direct warming by greenhouse gases.
I’m not a big fan of the “feedback” analysis of the Earth’s system. Positive feedback phenomenon in nature typically move into a run-away condition sooner or later unless some kind of separate limiting process intervenes. I have never seen anyone articulate what that intervening process might be.
But you *do* make a convincing argument for it!
In fact, the system response to feedback is rectangular-hyperbolic. It is only where the feedback response as a fraction of the output signal (in climate, the output signal is equilibrium sensitivity) exceeds 0.5 that the system is in any danger of runaway feedback.
If one were to believe IPCC, with its feedback fraction 0.75, then the climate would indeed be grossly unstable. But it isn’t, and it isn’t.
Provided that the feedback fraction is below 0.5, there is no reason at all to expect that runaway feedback will occur. Our paper has a nice graph showing the rectangular-hyperbolic response curve, and showing that after correction of the error the entire interval of possible feedback fractions is safely below 0.3, where the curve is not too different from linearity.
Leit, the sun is 30% brighter now than it was 4 billion years ago. And yet the surface of Earth has not fried.
Negative feedback is the reason. Mostly, feedback from the water cycle, which includes fractional cloud cover.
There’s no doubt that the terrestrial climate is dominated by negative feedbacks in response to positive perturbations. Were that not true, the climate would have zoomed off into boiling-ocean-land long ago.
Christopher is correct.
Please can someone explain in lay man’s language the feedback argument towards the end of this piece
It all has to do with the “equilibrium climate sensitivity” value, ECS. The feedback amplifier analogy was first used years ago by climate disaster proponents to calculate an ECS value of 3+ °C/(W/m2). What CMoB has done is to take this same analogy and show that this calculation is wrong because it neglected the signal at the input of the amplifier caused by the sun shining on the Earth. After accounting for this signal, the ECS value dropped to ~1.2 °C/(W/m2), which indicates there is no “climate emergency”.
Succinct and well put! I see no one has refuted your point!
Except that it is b0ll0cks.
There is no ECS or else there would be data to support it.
Ex definitione, ECS – equilibrium doubled-CO2 sensitivity – is the final warming that may be expected to occur once the climate system has resettled to equilibrium following a perturbation equivalent to the 3.5 Watts per square meter radiative forcing by doubling the CO2 in the air.
It is known down to the quantum level how it is that the interaction between CO2 molecules and photons of radiation in CO2’s absorption wavebands induces an oscillation that warms the surrounding air. It is known from simple calculations based on the equilibrium of 1850 that feedback response to such direct warming or temperature exists. It follows, therefore, that there is such a quantity as ECS. The question is not whether ECS exists but what is its magnitude? As the head posting explains, after correction of climatology’s elementary control-theoretic error there is no longer any legitimate expectation that ECS will be anything like as elevated as IPCC et hoc genus omne profiteer by inviting us to imagine.
Monte Carlo has neatly encapsulated our main point. The clahmatawlagists forgot the Sun was shining and is responsible or nearly all the feedback response, but they erroneously blamed greenhouse-gas warming for all the feedback response.
Thank you CMoB and Tim for the kind words.
You obviously need daily reassurance.
If the furtively pseudonymous leitmotif cannot contain its habitual and gratuitous discourtesy, it should really not seek to interpose itself in these threads. It is not learned in the relevant sciences; it is strikingly ignorant of their elements; and it seems not to know how to be polite at all. It should fall silent.
Do you have anything better to offer besides dead replies?
They’ve only just started to implement the green green-insanity reset, and almost before it’s begun, all the politicians are deluged by problems with voters obsessed with the very petty problem that its destroying their standard of living as the cost of fuels and everything else rises.
And, they are only in the foothills. Watching the green fanatics, is rather like watching someone who said they were planning to climb mount Everest, fail to climb the steps to the airplane to take them to India.
For years they’ve done nothing but talk about reducing fossil fuel usage, and then Putin forces just a small fraction of what they’ve done nothing but talk about for decades, and the brown stuff immediately hits the fan within days.
Dear Viscount Monckton of Brenchley,
I appreciate your eminent teams outstanding work on climate feedbacks. I commend your efforts of bringing the truth out to the public. I personally believe and always will that the truth with trump politics and science. I have 2 points and a question for you.
I would like to raise my 1st point, when using 1991 as a benchmark for climate observations and model comparisons, no one has firstly made an allowance for the fact that the first few years from about 1991-1994 was influenced by the eruption on Mt Pinatubo in June 1991.
A temporary temperature decrease from Pinatubo can be clearly seen in both the surface and satellite records. The result of this is it depresses the temperatures at the very start of the time period and hence reduces the (possible) Greenhouse warming trend by maybe 0.03K/per decade which reduces the approximate 0.16K/decade to about 0.13K/decade. 20% of warming can be attributed to the fact that there was a volcano at the start of the time interval.
See (Christy et al 2017)
The second point is my calculations highest plausible climate sensitivity are as follows;
Taking a co2 doubling reference sensitivity as 1K,
The Clausius-Clapeyron relationship according to Wijngaarden and Happer 2020,2021 (WH20,21) is a 6% increase in water vapour per degree C. If the 24K feedback response in 1850 was to increase by 6% with a 1C reference degree warming for a Co2 doubling it will yield a feedback response by 6% percent of 24K which equates to 1.44K producing an ECS of approximately 2.5K.
However this assumes that the concentration of water vapour is directly and linearly proportional to the radiative forcing and hence warming. In reality again according to (WH20,21) and also the IPCC, the warming is logarithmic to its concentration making the feedback response will be much lower.
I would finally like to ask a question about the non linearity of feedback response to reference temperature. In a post back in 2020 just before you submitted your current draft that has been sitting with the journal for 15 months. See link
https://wattsupwiththat.com/2020/10/17/nature-abandons-science-and-embraces-uniformitarian-totalitarianism/
You mentioned that your team was able to quantify the feedback response if there were no non condensing greenhouse gases (NCGHG) present e.g if the reference temperature only consisted of the emission temperature e.g 255K. Then obviously if we add in the 8K NCGHG signal this will bring the reference temperature up to 263 K in 1850 producing a feedback of 24K. I am aware that the feedback must respond in strict proportions between the 255K emission temperature and the 8K NCGHG signals.
You mentioned the following;
“We were able to calculate that feedback response numerically, having first prescribed the three nonlinearities in the curve of feedback response with temperature. Those nonlinearities are caused by the Clausius-Clapeyron-mandated increase in specific humidity with atmospheric temperature (in the atmospheric window only), and below the mid-troposphere, at which altitude, contrary to all the models’ predictions, no such increase has occurred); the increase in the Planck sensitivity parameter with temperature; and the rectangular-hyperbolic response of the system-gain factor (the ratio of equilibrium sensitivity to the directly-forced warming that had triggered the feedback response) and hence of all equilibrium climate sensitivities to the feedback fraction (i.e., to the fraction of equilibrium sensitivity represented by feedback response).”
My question is if you can elaborate on the above quote a little more?
Thankyou for taking the time to read this
Many thanks
TheSunDoesShine
TheSunDoesShine makes some excellent points. He is right about Pinatubo, but it is necessary to keep the analysis as simple as possible here, so I tend to neglect what Cicero used to call a secondaria consideratio. He is also about the quasi-logarithmic effect of warming by greenhouse gases, including water vapor. As to how we conducted the numerical calculation, this is quite complex and beyond the scope of the current column, and is also still awaiting peer review.
Pay attention to the history of the planet.
An alternative view of this issue, with the “generated electricity” data updated to 31/3/2022.
Looks like time to go back to horse-and-buggy.
I see no one understood my point about the UK generation graph—without electricity, it is back to the days of horses-and-buggys.
Best wishes to our friends in the UK. You will need more natural gas ASAP.
You sure have a lot more faith in the “Intelligence Services” than I have. The U.S. Socialist Party (i.e. the Dim-ocrats) have thoroughly burrowed into every government agency and department with their non-elected bureaucrats to the point that government barely functions anymore. It all starts with the indoctrination of the children – make true believers out of children and elections really stop mattering. If you want to put a stop to whole-sale stupidity, you have to take education back from the hacks.
Robert of Texas is right about education. It is now mere totalitarian propaganda in most schools. But don’t underestimate the intelligence services: even where the leadership has been corrupted by contamination at the political level, there are some very good people below the top of the tree, and they do not like the capitulation of Western politicians to the climate narrative.
Check this out, Robert. A possible ray of hope.
We need a Truth and Reconciliation Court for climate crusaders along the lines of Mandela’s court in SA.
Anyone with 1/2 a brain (that leaves out most liberals), knows what affects our planet is that “tiny” star about 93 million miles away. Every 11 years, the solar cycle changes. Cycle 24 & now 25 have been pretty quiet. When less CME’s hit our planet, it doesn affect the weather patterns.
We all know what global warming/climate change/climate emergency is about. Taking away freedoms, more government control.
“Birds, bees and bats by the billion are being blended or batted out of the sky.”
Alliteration anyone ? He could have substituted “blue” for “sky”.
The Earth is over 4.5 BILLION years old. The age of the Universe of which Earth is apart is almost 14 BILLION years old.
Talk to me about global weather trends when you have data of at least 100,000 years or it is so noticeable it is unavoidable to conclude otherwise. Now is not that time.
Global warming data, bought and paid for by the elite wanting to eliminate your freedoms for the “greater good” of the elite.
Global warming is nothing but a hoax that liberals use as an excuse to boss people around and take their stuff.
So glad to see this report.