From Dr. Roy Spencer’s Global Warming Blog
April 9th, 2022 by Roy W. Spencer, Ph. D.
SUMMARY
The proper way of looking for causal relationships between time series data (e.g. between atmospheric CO2 and temperature) is discussed. While statistical analysis alone is unlikely to provide “proof” of causation, use of the ‘master equation’ is shown to avoid common pitfalls. Correlation analysis of natural and anthropogenic forcings with year-on-year changes in Mauna Loa CO2 suggest a role for increasing global temperature at least partially explaining observed changes in CO2, but purely statistical analysis cannot tie down the magnitude. One statistically-based model using anthropogenic and natural forcings suggests ~15% of the rise in CO2 being due to natural factors, with an excellent match between model and observations for the COVID-19 related downturn in global economic activity in 2020.
Introduction
The record of atmospheric CO2 concentration at Mauna Loa, Hawaii since 1959 is the longest continuous record we have of actual (not inferred) atmospheric CO2 concentrations. I’ve visited the laboratory where the measurements are taken and received a tour of the facility and explanation of their procedures.
The geographic location is quite good for getting a yearly estimate of global CO2 concentrations because it is largely removed from local anthropogenic sources, and at a high enough altitude that substantial mixing during air mass transport has occurred, smoothing out sudden changes due to, say, transport downwind of the large emissions sources in China. The measurements are nearly continuous and procedures have been developed to exclude data which is considered to be influenced by local anthropogenic or volcanic processes.
Most researchers consider the steady rise in Mauna Loa CO2 since 1959 to be entirely due to anthropogenic greenhouse gas emissions, mostly from the burning of fossil fuels. I won’t go into the evidence for an anthropogenic origin here (e.g. the decrease in atmospheric oxygen, and changes in atmospheric carbon isotopes over time). Instead, I will address evidence for some portion of the CO2 increase being natural in origin. I will be using empirical data analysis for this. The results will not be definitive; I’m mostly trying to show how difficult it is to determine cause-and-effect from the available statistical data analysis alone.
Inferring Causation from the “Master Equation”
Many processes in physics can be addressed with some form of the “master equation“, which is a simple differential equation with the time derivative of one (dependent) variable being related to some combination of other (independent) variables that are believed to cause changes in the dependent variable. This equation form is widely used to describe the time rate of change of many physical processes, such as is done in weather forecast models and climate models.
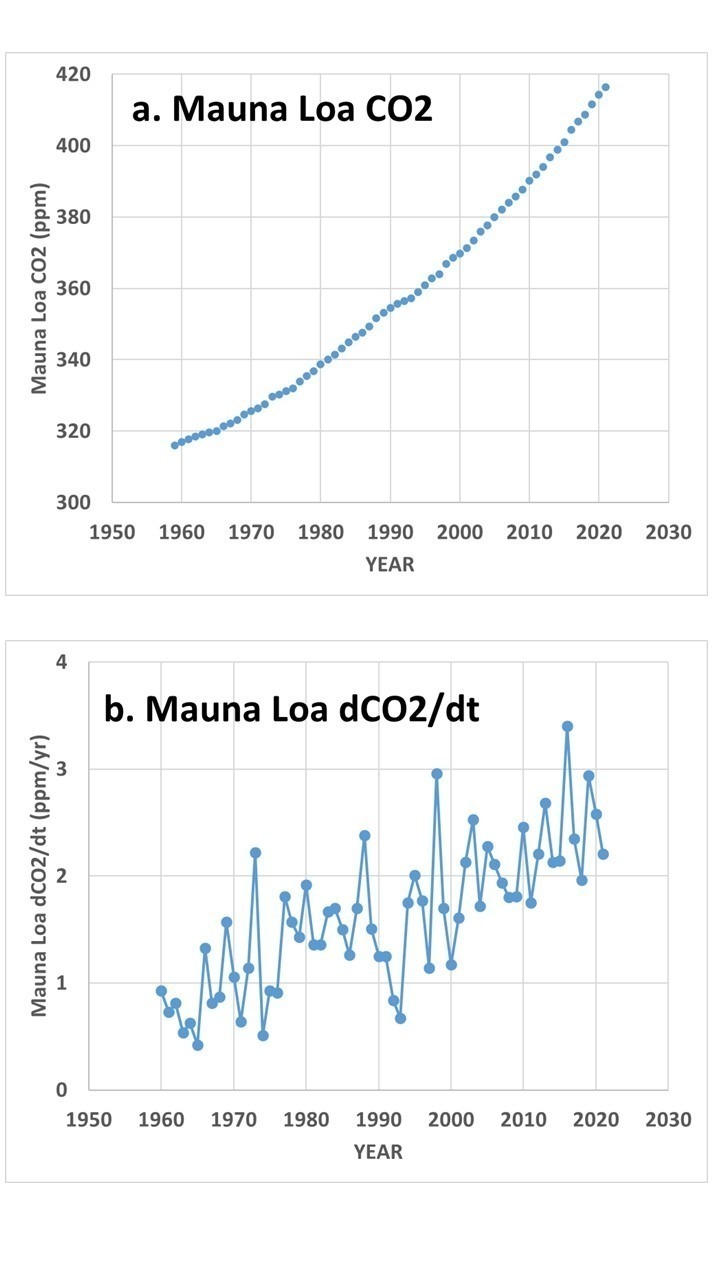
In the case of the Mauna Loa CO2 data, Fig. 1 shows the difference between the raw data (Fig. 1a) and the more physically-relevant year-to-year changes in CO2 (Fig. 1b).
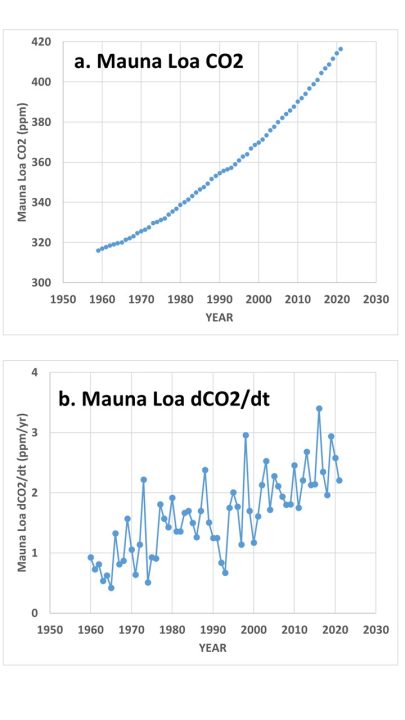
If one believes that year-to-year changes in atmospheric CO2 are only due to anthropogenic inputs, then we can write:
dCO2/dt ~ Anthro(t),
which simply means that the year-to-year changes in CO2 (dCO2/dt, Fig. 1b) are a function of (due to) yearly anthropogenic emissions over time (Anthro(t)). In this case, year-on-year changes in Mauna Loa CO2 should be highly correlated with yearly estimates of anthropogenic emissions. The actual relationship, however, is clearly not that simple, as seen in Fig. 2, where the anthropogenic emissions curve is much smoother than the Mauna Loa data.
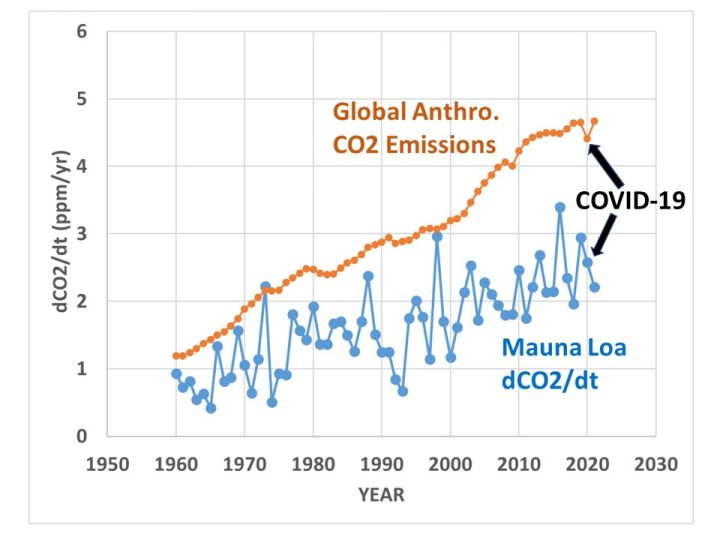
Therefore, there are clearly natural processes at work in addition to the anthropogenic source. Also note those natural fluctuations are much bigger than the ~6% reduction in emissions between 2019 and 2020 due to the COVID-19 economic slowdown, a point that was emphasized in a recent study that claimed satellite CO2 observations combined with a global model of CO2 transports was able to identify the small reduction in CO2 emissions.
So, if you think there are also natural causes of year-to-year changes in CO2, you could write,
dCO2/dt ~ Anthro(t) + Natural(t),
which would approximate what carbon cycle modelers use, since it is known that El Nino and La Nina (as well as other natural modes of climate variability) also impact yearly changes in CO2 concentrations.
Or, if you think year-on-year changes are due to only sea surface temperature, you can write,
dCO2/dt ~ SST(i),
and you can then correlate year-on-year changes in CO2 to a dataset of yearly average SST.
Or, if you think causation is in the opposite direction, with changes in CO2 causing year-on-year changes in SST, you can write,
dSST/dt ~ CO2(t),
in which case you can correlate the year-on-year changes in SST with CO2 concentrations.
In addition to the master equation having a basis in physical processes, it avoids the problem of linear trends in two datasets being mistakenly attributed to a cause-and-effect relationship. Any time series of data that has just a linear trend is perfectly correlated with every other time series having just a linear trend, and yet that perfect correlation tells us nothing about causation.
But when we use the time derivative of the data, it is only the fluctuations from a linear trend that are correlated with another variable, giving some hope of inferring causation. If you question that statement, imagine that Mauna Loa CO2 has been rising at exactly 2 ppm per year, every year (instead of the variations seen in Fig. 1b). This would produce a linear trend, with no deviations from that trend. But in that case the year-on-year changes are all 2 ppm/year, and since there is no variation in those data, they cannot be correlated with anything, because there is no variance to be explained. Thus, using the master equation we avoid inferring cause-and-effect from linear trends in datasets.
Now, this data manipulation doesn’t guarantee we can infer causation, because with a limited set of data (63 years in the case of Mauna Loa CO2 data), you can expect to get some non-zero correlation even when no causal relationship exists. Using the ‘master equation’ just puts us a step closer to inferring causation.
Correlation of dCO2/dt with Various Potential Forcings
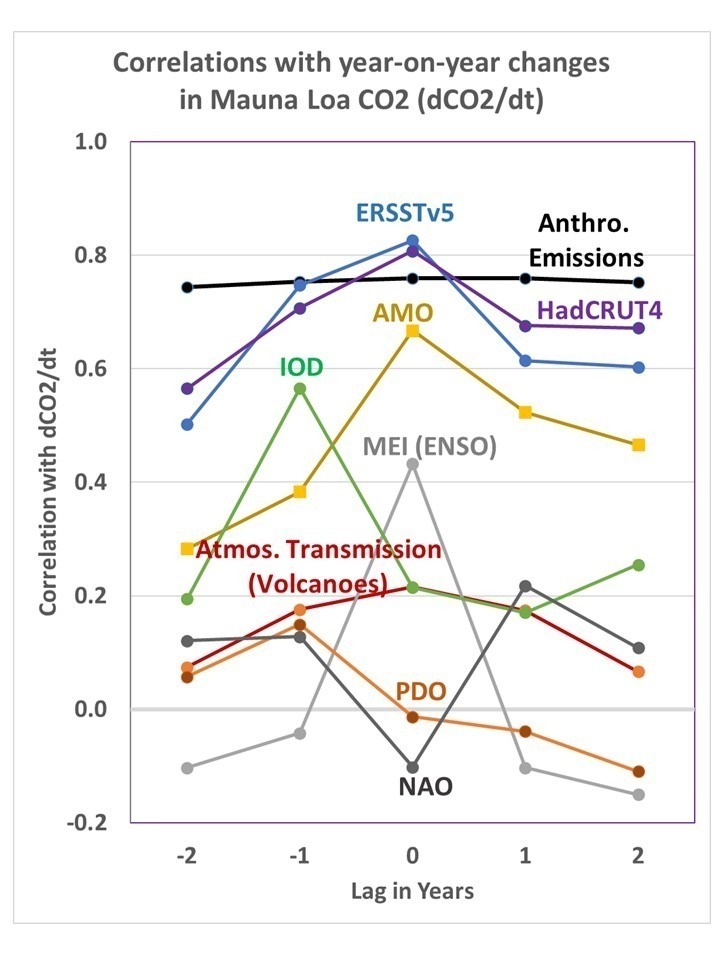
Lag correlations of the dCO2/dt data in Fig. 1b with estimates of global anthropogenic CO2 emissions, and with a variety of natural climate indicies, are shown in Fig. 3.
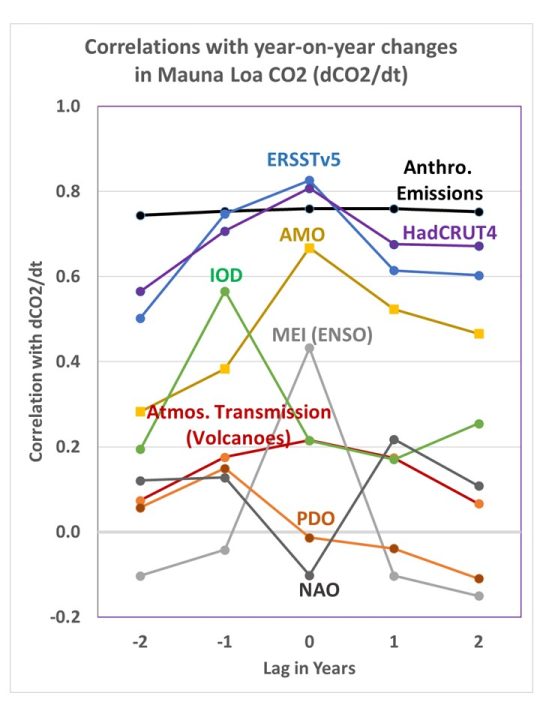
The first thing we notice is that the highest correlation is achieved with the surface temperature datasets, (tropical SST or global land+ocean HadCRUT4). This suggests at least some role for increasing surface temperatures causing increasing CO2, especially since if I turn the causation around (correlate dSST/dt with CO2), I get a very low correlation, 0.05.
Next we see that the yearly estimates of global anthropogenic CO2 emissions is also highly correlated with dCO2/dt. You might wonder, if the IPCC is correct and all of the CO2 increase has been due to anthropogenic emissions, why doesn’t it have the highest correlation? The answer could be as simple as noise in the data, especially considering the emissions estimates from China (the largest emitter) are quite uncertain.
The role of major volcanic eruptions in the Mauna Loa CO2 record is of considerable interest. When the atmospheric transmission of sunlight is reduced from a major volcanic eruption (El Chichon in 1983, and especially Pinatubo in 1991), the effect on atmospheric CO2 is to reduce the rate of rise. This is believed to be the result of scattered, diffuse sky radiation penetrating deeper into vegetation canopies and causing enhanced photosynthesis and thus a reduction in atmospheric CO2.
Regression Models of Mauna Loa CO2
At this point we can choose whatever forcing terms in Fig. 3 we want, and do a linear regression against dCO2/dt to get a statistical model of the Mauna Loa CO2 record.Â
For example, if I use only the anthropogenic term, the regression model is:
dCO2/dt = 0.491*Anthro(t) + 0.181,
with 57.8% explained variance.
Let’s look at what those regression terms mean. On average, the yearly increase in Mauna Loa CO2 equals 49.1% of total global emissions (in ppm/yr) plus a regression constant of 0.181 ppm/yr. If the model was perfect (only global anthropogenic emissions cause the CO2 rise, and we know those yearly emissions exactly, and Mauna Loa CO2 is a perfect estimate of global CO2), the regression constant of 0.181 would be 0.00. Instead, the anthro emissions estimates do not perfectly capture the rise in atmospheric CO2, and so a 0.181 ppm/yr “fudge factor” is in effect included each year by the regression to account for the imperfections in the model. It isn’t known how much of the model ‘imperfection’ is due to missing source terms (e.g. El Nino and La Nina or SST) versus noise in the data.
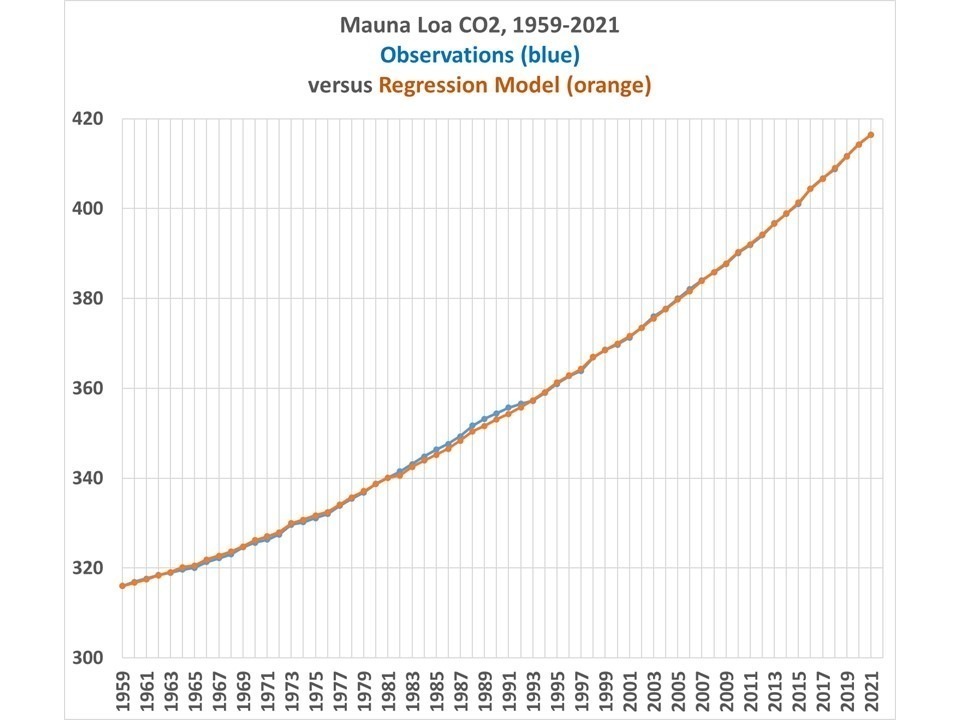
By using additional terms in the regression, we can get a better fit to the Mauna Loa data. For example, I chose a regression model that includes four terms, instead of one: Anthro, MEI, IOD, and Mauna Loa atmospheric transmission. In that case I can improve the regression model explained variance from 57.8% to 82.3%. The result is shown in Fig. 4.
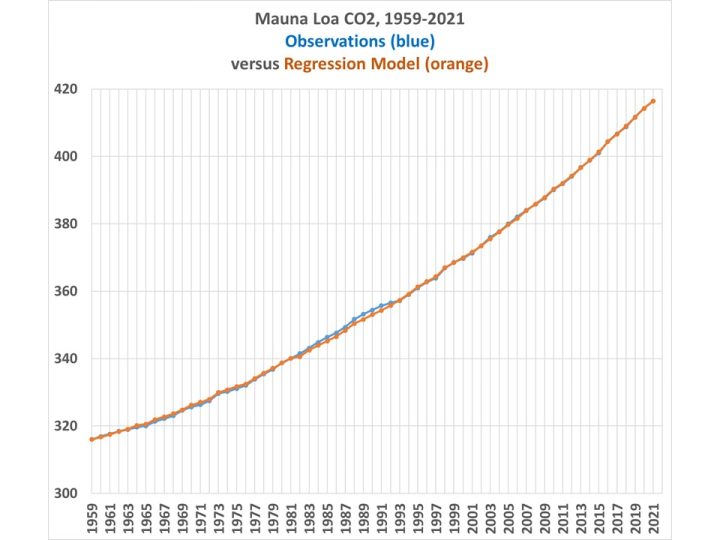
In this case, the only substantial deviations of the model from observations is due to the El Chichon and Pinatubo volcanoes, since the Pinatubo event caused a much larger reduction in atmospheric CO2 than did El Chichon, despite the volcanoes producing very similar reductions in solar transmission measurements at Mauna Loa.
In this case, the role of anthropogenic emissions is reduced by 15% from the anthro-only regression model. This suggests (but does not prove) a limited role for natural factors contributing to increasing CO2 concentrations.
The model match to observations during the COVID-19 year of 2020 is very close, with only a 0.02 ppm difference between model and observations, compared to the 0.24 ppm estimated reduction in total anthropogenic emissions from 2019 to 2020.
Conclusions
The Mauna Loa CO2 data need to be converted to year-to-year changes before being empirically compared to other variables to ferret out possible causal mechanisms. This in effect uses the ‘master equation’ (a time differential equation) which is the basis of many physically-based treatments of physical systems. It, in effect, removes the linear trend in the dependent variable from the correlation analysis, and trends by themselves have no utility in determining cause-versus-effect from purely statistical analyses.
When the CO2 data are analyzed in this way, the greatest correlations are found with global (or tropical) surface temperature changes and estimated yearly anthropogenic emissions. Curiously, reversing the direction of causation between surface temperature and CO2 (yearly changes in SST [dSST/dt] being caused by increasing CO2) yields a very low correlation.
Using a regression model that has one anthropogenic source term and three natural forcing terms, a high level of agreement between model and observations is found, including during the COVID-19 year of 2020 when global CO2 emissions were reduced by about 6%.
That lead graph is an absolutely perfect answer to those who wonder why they don’t notice the effect of the pandemic in the atmospheric CO2 trend.
Not to those who wonder how Net Zero policies are meant to help.
It still shows that Net Zero policies are not going to make a practical difference.
Net zero is not needed, 35 GtCO2/y leads to an atmospheric CO2 equilibrium of only 525 ppm, which is not a climate crisis.
“absolutely perfect”
Means only one thing:
bullshit
Literally and otherwise.
🙂
cheers
The main reason you don’t see the effect of the pandemic is that the natural fluctuations in CO2 are much greater than the effect you would calculate from anthropogenic emissions alone, so the anthropogenic number gets lost in the noise. However, the cumulative effect of anthropogenic emissions is still very real.
The cumulative effect is very real, but also not easily quantified because we can’t quantify how much anthropogenic CO2 is being taken up by the biosphere and soil, nor can we quantify how quickly it is being sequestered by geological processes.
We know, quite precisely, the net rate at which the sum of natural processes remove CO2 from the air: it averages roughly 2.5 ppmv/year (depending on how land use change effects are accounted). But estimates for the various components of that sum vary considerably.
That is, we know how much CO2 is leaving the atmosphere due to natural processes, but we’re less sure about just where it’s going. Although we know what the natural sinks are, we aren’t as sure of their relative size/importance.
In this list, #1 and #3 are almost certainly the largest sinks:
1. We know some of it is going into the terrestrial biosphere, “greening” the Earth:
https://www.youtube.com/watch?v=zOwHT8yS1XI
https://sealevel.info/greening_earth_spatial_patterns_Myneni.html
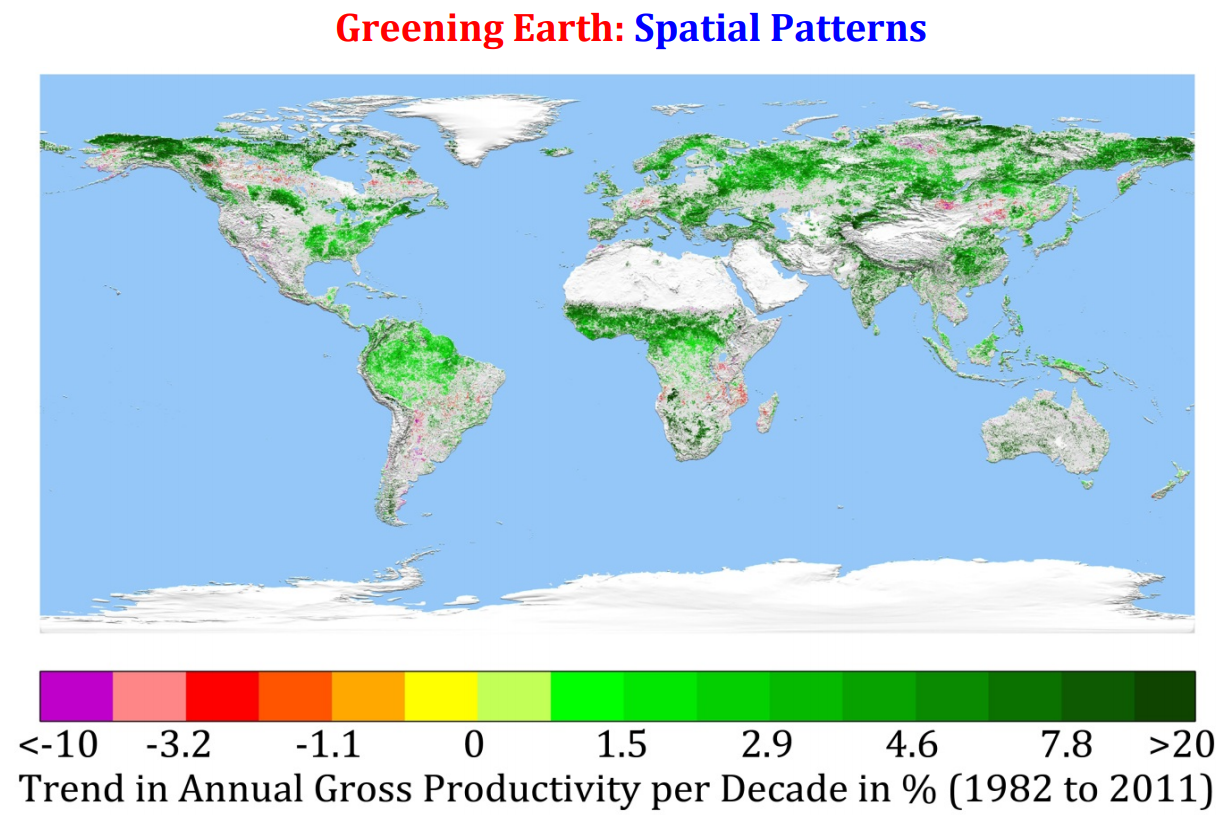
Note, however, that not all accelerated plant growth is equal. Grasses and leaves mostly rot within a year or two, returning most of their sequestered carbon to the atmosphere. But trees sequester much of their carbon for much longer, often for many decades.
2. Growing more plants obviously puts carbon into the soil, as well.
3. We also know that higher CO2 levels accelerate the rate of dissolution of CO2 into water (oceans, raindrops, etc.). (Of course, most rain falls into the oceans.) So obviously some of the removed CO2 is going into the oceans.
3(b). Higher CO2 levels in the oceans accelerate the growth of calcifying coccolithophores, accelerating the transport of carbon from surface waters to the ocean depths and seabed.
4. We also know that CO2 removal by “rock weathering” accelerates a bit when atmospheric CO2 concentrations go up.
And, given the lack pf an observable variation in the current cycle relative to past natural cycles, we probably underestimate the dominant climate control power of negative feedback from the changing cloud albedo that arises from the evaporative response to SST change. About 50W/m^2 total currently, and increasing in sensitivity with rising temperature.
Here’s a discussion of the Sea-surface temperature / cloud feedback that Brian is talking about:
https://sealevel.info/feedbacks.html#tropicalsst
If you can’t quantify it, how do you know it is real? We do know what our emissions are and can posit that has an impact. But verification requires wrestling a discernable signal from the noise.
It’s a mass balance equation. I didn’t say it can’t be quantified. I said it was difficult to do so, particularly accurately, because most of the variables are only estimates or unknown.
Dave Burton clearly explained it in several comments.
We can easily quantify the net rate at which CO2 is being removed from the atmosphere by nature, we’re just not sure how much of it is going into each of the various known natural sinks: terrestrial “greening,” soil, oceans, and rock weathering being the main ones.
Here’s an analogy: If you put 180 pieces of candy in a candy bowl (either all at once or a little bit at a time, it doesn’t matter), and leave the bowl unguarded with your kids at home, and later you find find that there are only 101 pieces of candy in the bowl, you cannot say how much candy Susie ate, but you have no trouble quantifying the total amount of candy consumed.
Moreover, if Ed Berry and Murry Salby told you that nobody ate the candy, you’d be foolish to believe them.
But how do you know you put 180 pieces in the bowl?
Thanks Roy & commenters;
if the bowl (atmospheric gas) is in a candy shop (dissolved CO2 in seawater) that is in a candy factory (sedimented carbonates) and people are moving items between all of the areas, both depositing into the bowl and shop but also moving back to the factory –
that is to say there are fluxes in both directions at each interface:
then observation in one location alone may be insufficient data to quantify a relationship between the multiple sources;
particularly when there is feedback in both directions – SST is influenced over lengthy periods by clouds, for example
If you want to know how we know that mankind added about 180 ppmv of CO2 to the atmosphere since Mauna Loa measurements began, the answer is that the bean-counters keep track of the production / use of fossil fuels and cement, which are the largest anthropogenic sources.
https://ourworldindata.org/co2-emissions
The number varies a bit, mostly depending on how you account for “land use change emissions.” They can be accounted for either as a reduction in CO2 removal by nature, or as an increase in CO2 emissions by mankind.
The problem is that “land use change emissions” are very poorly constrained. AR5 Fig. 6.1 estimated them as 1.1 ±0.8 PgC/yr, which is anywhere from 0.14 ppmv to 0.90 ppmv. AR6 Chapter 5 estimates 1.6 ±0.7 PgC/yr, which is 0.42 ppmv to 1.09 ppmv.
What’s more, that broad range uses a 1σ CI, rather than the usual 2σ (95%). Obviously, nobody really knows how much they are.
hmmm, that graph (also fig 2) seems at odds with many of the claims about the size of the emissions drop, which seem to be around 20%
looks more like 5% in the graph
if you imagine the line falling all the way to just above 3.5 it is much, much less persuasive
the “over 100% of gains since 1945 are anthropogenic” view is harder to square with that
remember, the sinks are much more active today than they used to be
that was the major error in Hansen 1988
the correlation should be increasing, under that scenario
Who claimed that CO2 emissions dropped by 20%?
OurWordInData shows a 5.2% (1.895 Gt) decrease in global CO2 emissions in 2020: That’s only about 0.25 ppmv:
https://ourworldindata.org/co2-emissions
They don’t have 2021 data yet.
5.2% (0.25 ppmv) is simply too tiny to be noticeable, because it is much smaller than the usual year-to-year fluctuations in the rate at which CO2 level increases each year.
TallDave wrote, “remember, the sinks are much more active today than they used to be / that was the major error in Hansen 1988”
True!
Well, I wouldn’t say “the major.” I would say “worst.” There were many other major blunders in that train wreck of a paper, too.
https://www.sealevel.info/hansen1988_retrospective.html
It doesnt answer anything. Reducing mans CO2 output had no measurable effect on global atmospheric CO2 levels. You can say, ‘ah, that little reduction there, thats it’ but Maunaloa data is littered with such small reductions.
Dont forget, the 6% reduction was for the year. Mans co2 reduction during the first lockdown was 20%. Thats s BIG drop, yet it didnt cause a big drop in global levels, and this was during NH spring/summer, when global CO2 uptake is high. A greening planet and 20% drop in man made CO2 should be very visible in the Maunaloa data. it wasnt, and thats very interesting.
I wonder if Obama also plans to cap Mauna Loa … https://www.youtube.com/watch?v=OZhngxgkOPE
IPCC says the anthro-CO2 flux is 4 percent of the total.
Add 4 percent to a river flow with new water. The total flow is 104 percent, it never accumulates, it just keeps flowing.
Atmospheric CO2 flows like a river. 400 ppm times .04 is 16 ppm.
The rest is natural increase. So 1/6 of the 100 ppm increase from 300 to 400 is anthro-CO2.
Anthro-CO2 never accumulates selectively over natural CO2, it’s chemically impossible.
The 1963 atmospheric bomb ban shows radioactive from atmospheric bombs caused 14CO2 peak in 1964 due to global mixing. The 14CO2 then declined by 1/2 in 10 years.
That’s absolute proof that a pulse of added CO2 never accumulates the Earth’s atmosphere.
Humans have never added enough CO2 to the atmosphere to matter. Whether it’s 1 percent, 2 percent, 3 percent or 4 percent, the river will never stop flowing.
That is incorrect. There is no “natural increase” in the amount of CO2 in the atmosphere. Nature is removing CO2 from the atmosphere, each year, not adding it.
As you can see from Roy’s graphs, the amount of CO2 we add to the atmosphere each year is greater than the measured increases in the amount of CO2 in the atmosphere.
In fact, we know from reliable measurements that every year since 1959 the amount of CO2 in the atmosphere has increased by less than the amount of CO2 which mankind has added to the atmosphere (with the arguable exception of 1973, a year in which the two numbers were very similar).
In other words, mankind increases the CO2 concentration in the atmosphere, and nature reduces it (since 1959, at least).
That means the only reason that the atmospheric CO2 level continues to rise is that mankind is adding CO2 faster than nature is removing it.
I sometimes say that all of the rise in atmospheric CO2 concentration since 1959 is due to mankind’s emissions, but that’s not quite precise. Actually, in those 63 years, mankind has added about 180 ppmv of CO2 to the atmosphere, nature has removed about 79 ppmv from the atmosphere, and the atmospheric CO2 concentration has risen by the difference between those two numbers: about 101 ppmv.
So mankind can take credit for about 180% of the (beneficial!) rise in atmospheric CO2 concentration since 1959.
The clearest and most thorough examination of the cause of rising CO2 concentration which I’ve found is this analysis by Ferdinand Engelbeen:
http://www.ferdinand-engelbeen.be/klimaat/co2_origin.html
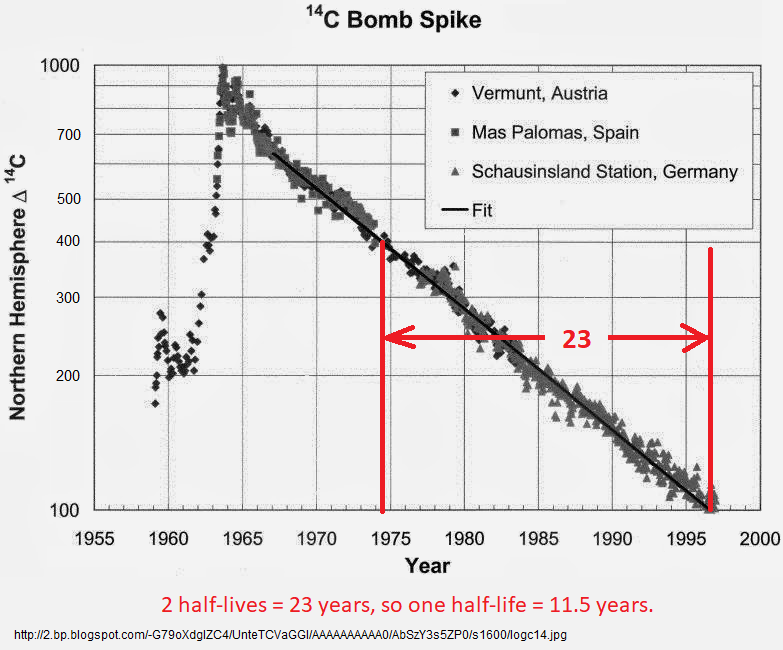
The “effective” residence time for added CO2 is about fifty years, which is much longer than you would guess from the decay rate of the 14C “bomb spike.” This is a log scale plot of the decline of 14C levels in the atmosphere, following the atmospheric test ban treaty:
http://2.bp.blogspot.com/-G79oXdgIZC4/UnteTCVaGGI/AAAAAAAAAA0/AbSzY3s5ZP0/s1600/logc14.jpg
When atmospheric tests of A-bombs and H-bombs suddenly ceased (because of the atmospheric test ban treaty), the 14C concentration dropped on a near-perfect exponential decay curve, with a half-life of 11.5 years, implying a residence time of 16.6 years.
(Note: ¹⁴CO2 is 4.5% heavier than normal ¹²CO2, which affects biological uptake and diffusion rates slightly. But not much.)
16.6 years is obviously much shorter than the 50 year effective lifetime of atmospheric CO2 emissions. Can you guess why?
The answer is that some of the processes which remove ¹⁴CO2 from the atmosphere do so by exchanging it, one-for-one, for ¹²CO2. Those processes cause the fraction of 14C in the atmosphere to decline without actually reducing the amount of CO2 in the atmosphere. That means the 11.5 year half-life and 16.6 year residence time are necessarily less than the effective lifetime of CO2 emissions.
The effective lifetime of anthropogenic additions to CO2 in the atmosphere, defined as the time it would take for (1-(1/e)) = 63% (sometimes rounded to 2/3) is roughly fifty years, making the half-life about 35 years.
That’s the result that Prof. Richard Lindzen reported during the Q&A (3rd video) of this (excellent!!!) lecture:
● Part 1:
https://www.youtube.com/watch?v=hRAzbfqydoY
● Part 2:
https://www.youtube.com/watch?v=V-vIhTNqKCw
● The Q&A which followed:
https://www.youtube.com/watch?v=69kmPGDh1Gs (including his discussion of CO2 atmospheric lifetime)
That’s also the approximate result that Dr. Roy Spencer found:
http://www.drroyspencer.com/2019/04/a-simple-model-of-the-atmospheric-co2-budget/
That’s also the approximate result that I got, first with a little program to simulate declining CO2 levels, based on the historical CO2 removal rate as a function of CO2 level, and then with a modified version of the program based on Dr. Spencer’s model; the source code is here:
https://sealevel.info/CO2_Residence_Times/
Ferdinand Engelbeen reported roughly the same result, here:
https://edberry.com/blog/climate-physics/agw-hypothesis/contradictions-to-ipccs-climate-change-theory/#comment-50170
Hmmm… I don’t know why that 14C bomb spike decay graph didn’t “inline.” Here’s another version of it, annotated, and this time fetched from my site:
If nature is only reducing the amount of CO2, then we as humans better do all we can to keep it increasing.
Cause I don’t see any other species digging up carbon based fuels that give off the life giving compound of CO2
Yes, the natural trend toward lower atmospheric CO2 concentrations would be most concerning if it had continued. Apparently, termites weren’t up to the job.
Anyway, the net effect of all natural sinks, in combination with natural sources, is that it appears that about half of CO2 emissions from fossil fuel burning are being removed from the atmosphere. If it were only that simple.
There are several sources and sinks at play, all varying, cycling, changing, at least to some extent. I don’t think we know enough about these to apportion where everything is coming from and ending up. Mathematically, there are a lot of possibilities that could explain observations.
Cissor,
If you have a small business and start the day by counting your cash register. Then you ad $100 into it.
After a full day with hundreds of sales and deliveries that had to be paid, you are counting what is in the cash register.
It turns out that you have $50 more than in the morning.
The next day, the same play. At the end of the day $50 gain.
The next day,…
Every day, you add $100 of your money and at the end of the day you count a “gain” with $50 more in the cash register of your shop than the morning count before adding the extra $100.
There is one simple explanation for what happens: your small shop shows a continuous loss and there are zero possibilities to mathematically explain that otherwise…
Get the chainsaws out before the planet dies!
Matt Kiro,
On very short (2-5 years) and longer (millennia) time periods, CO2 follows the temperature of the ocean surface. For the current average ocean surface temperature, the equilibrium CO2 level in the atmosphere would be around 295 ppmv. Thanks to humans, we now are at about 415 ppmv.
Even if we should stop all CO2 emissions from fossil fuels today, the CO2 level would drop, but with a half life of around 35 years towards the 295 ppmv, not below…
OMG. Of course Nature is “adding” CO2 to the atmosphere, otherwise plant life would have never evolved as it has requiring CO2 to grow. Nature “adds” CO2 and “removes” CO2. The removal process is slowed down as CO2 in the atmosphere becomes more rare, thus the adding and removal are always trending to a balance.
Adding an additional 4% CO2 to the atmosphere does nothing but speeds up the removal process over enough time. The only way CO2 builds up to any important degree is if green plant life is somehow damaged or removed slowing down the removal process.
This idea that there is some magic right amount of CO2 in the atmosphere is complete nonsense, just like the idea of a magic temperature. There is a natural range for both, and any value in that range is just fine. Yes, humans will have to continue to adapt to change – that too is natural and how we evolved.
Yes. No one has quantified the massive destruction of the tropical biome by humans. That’s where lots of CO2 is coming from.
Temperate agriculture is also massive. Melting of the boreal tundra, chinese soot on the northern ice alters albedo. That’s just the obvious.
So it’s not that humans are emitting too much CO2, but rather, by thoughtless land use choices, humans are destroying the natural CO2 sinks. Instead of Zero Emissions, the appropriate focus should be More Plants and Trees.
CO2 is dangerously low. We need to grow more food.
bwegher, the O2 balance shows what the biosphere as a whole is doing: more uptake than release of CO2.
Even including the destruction of tropical forests, the earth is greening…
http://www.bowdoin.edu/~mbattle/papers_posters_and_talks/BenderGBC2005.pdf
Robert, the discussion is about the net addition or removal of CO2 by nature and at least since Mauna Loa started its measurements, nature was a net sink for CO2, not a source, thus not the cause of the increase of CO2 in the atmosphere…
the IPCC claims the last 4% of each year’s emissions magically swirls the drain for 100,000+ years, never being absorbed
this might seem like an obvious violation of entropy, but fortunately, anthropogenic CO2 is legally required to be clearly labeled so it doesn’t get mixed up with the other CO2 constantly flowing through the natural cycles
good thing too, or they’d be in for quite a shock when the flows reach equilibrium and we head gently towards falling crop yields and creeping glaciation
then we dig up the sequestered CO2, just as planned
Robert, the point is that the increase in plant uptake is less than what humans currently emit per year. Only 1/4 of human emissions. Another 1/4 goes into the oceans. 1/2 remains (temporarily) in the atmosphere.
If that has much effect is complete different question and the answer is no, currently far more benefits than harm.
But insisting that the increase is not man-made is simply stupid and undermines all good arguments that skeptics have to point to the non-performance of the disaster climate models…
DB says “from reliable measurements that every year since 1959 the amount of CO2 in the atmosphere has increased by less than the amount of CO2 which mankind has added to the atmosphere” but atmospheric CO2 has been increasing since 1800 or before. The increase until 1959 had to be natural. Why did that natural component of the increase change in 1959?
The change in 1959 was not a change in “natural component of the increase.” It is simply that 1959 is the first year for which we have precise measurements of the atmospheric CO2 concentration for the full year. So, for times before 1959, we cannot say the “from reliable measurements” part of the statement.
When human CO2 emissions were low, the natural year-to-year fluctuations in CO2 sources and sinks, as well as natural climate changes, meant that some years CO2 levels went up slightly, and some years they went down slightly. Eventually, anthropogenic CO2 emissions increased to the point that they are greater than those fluctuations, so now CO2 levels go up every year.
However, as CO2 levels rise, the natural processes which remove CO2 from the air are accelerating. Dr. Roy Spencer analyzed that and determined from measurements that the net natural removal rate is closely approximated by the following “Simple Model” formula:
removalrate = (co2level – 295.1) × 0.0233
(units are ppmv CO2/year)
It very closely approximates measured reality, as you can see:
That has some very important implications. See of you can work out, using that formula, how high the atmospheric CO2 level could eventually get, if our CO2 emissions never decreased, but instead stabilized at, say, 5 ppmv per year.
There’s no reason for your comments to be getting negative votes.
Yep. Atmospheric CO2 actually rose faster than anthropogenic emissions up until the 1960’s. The cooling of the southern oceans from the 1940s to 1960s actually caused the rise in atmospheric CO2 to flatten, possibly even fall, for about 10-15 years.
While anthropogenic emissions are only 3-4% of the annual flux, we are causing a cumulative increase in the total reservoir of CO2 being actively exchanged between the atmosphere, oceans, biosphere and soil. There’s no way to balance that equation without anthropogenic emissions accounting for 50-80% of the rise from ~290 to ~400 ppm.
It’s a basic material (or mass) balance equation. However, most of the variables can only be estimated. So there’s no way to be certain of the exact numbers.
In other words, basically without reliable measurements to apply to the subjective estimates of the variables in the equation. And, the advocates typically ignore the uncertainties of those estimates.
We know that the two most directly measureable variables are increasing in proportion to one another. We knew enough about the other variables to know that they aren’t.
We think we know enough.
https://scitechdaily.com/new-research-shows-estimates-of-the-carbon-cycle-vital-to-predicting-climate-change-are-incorrect/
Clyde, the mass balance measurements are accurate enough to know that humans are the cause of the CO2 increase and nature is a net sink for CO2.
The accuracy of human emissions is better than +/- 0.25 ppmv
The accuracy of the CO2 increase is better than +/- 0.2 ppmv
The net result currently is roughly:
yearly change in the atmosphere = human emissions + natural emissions – natural sinks
2.5 ppmv = 5 ppmv + X – Y
X – Y = -2.5 +/- 0.45 ppmv
Thus nature is a proven sink for CO2, whatever X and Y are.
One don’t need anything to know of any individual natural influx or outflux, because we know the exact result of all these fluxes together after a full year with more than sufficient accuracy.
If X = 20 ppmv/year then Y must be 22.5 ppmv/year
If X = 200 ppmv/year, Y must be 202.5 ppmv/year
If X = 2000 ppmv/year, Y must be 2002.5 ppmv/year
No matter if any natural flux in that year halved or doubled or reversed from net in to net out…
Since you consider yourself an expert on the CO2 mass-balance relationship, I have a question that I’d appreciate you answering:
If the natural system, unperturbed by humans, is in equilibrium, and the carbon was formerly completely re-cycled with no growth, how did photosynthetic organisms manage to change the world from an anoxic regime to one with oxygen far exceeding CO2? Are not photosynthesis and respiration, inverse chemical reactions, balanced?
In the 1950s the atmospheric CO2 level, estimated mostly from ice cores, rose by less than 6 ppmv:
https://sealevel.info/co2.html
But anthropogenic CO2 emissions from fossil fuels and cement manufacturing in the 1950s totaled 9.2 ppmv. Here’s a spreadsheet:
https://sealevel.info/global.1751_2014_2019.ems5_v07d.html
So it appears that Nature was a net remover of about 3-4 ppmv of CO2 from the atmosphere in the 1950s, though the ice core measurements are rough enough that I wouldn’t stake my life on it.
Dave,
Two of the Law Dome ice cores have a resolution of less than a decade, the third about 20 years. The two taken at the summit go back 150 years in time, the third, taken further down the slope, goes back near 2000 years.
The repeatability of ice core CO2 measurements are better than 1.2 ppmv (1 sigma) and there is an overlap of about 20 years with the direct measurements at the South Pole:
I definitely agree that Law Dome ice cores have very high resolution over the past 2,000 years… Good enough to integrate with instrumental data.
I’m puzzled as to why the warming of the oceans wouldn’t then have contributed to the resumption of the upward curve. From 2 possible sources…
A few years back the church of AGW was all alarmed that:
It was pointed out the time lag between temps rising and CO2 rising was approx 800 years and that meant the MWP effects were now returning as the ocean cycled heat back from the depths.
(also that you cannot physically have BOTH a warming ocean and an ocean taking up more CO2, but AGW’ers never seemed to understand or acknowledge chemistry. :D)
So looking at ‘natural’ CO2 emissions will surely be skewed by the release of CO2 stored for ~800 years – I haven’t seen anyone measuring the outgassing of the oceans and pointing out the correlation between temp of ocean increase and increase in CO2.
(I could easily be misunderstanding or just haven’t seen the info, but it’s been several years since anyone mentioned the MWP effect on our current situation)
And the ocean effect would be vastly greater than us mere humans could achieve.
‘Global’ Solar Maximum should of course be Grand Solar Maximum
[2nd try — Mods, if this is a duplicate, please just delete the first one; for some reason I can’t see it. Thanks, Dave]
MarkMcD wrote, “you cannot physically have BOTH a warming ocean and an ocean taking up more CO2″
We can, and we do.
At the air-water interface, CO2 molecules are constantly being exchanged between the two. The rate at which the ocean absorbs CO2 from the air is proportional to CO2’s partial pressure in the air. That’s intuitively obvious when you remember that the concentration of CO2 in the air determines the rate at which CO2 molecules collide with and are absorbed by the surface of the ocean, and falling raindrops.
Mankind has increased the atmospheric CO2 level by about 32%. since 1958. (I’m using 1958 since that’s the start of the Mauna Loa CO2 measurements.) Here’s a graph:
https://sealevel.info/co2.html
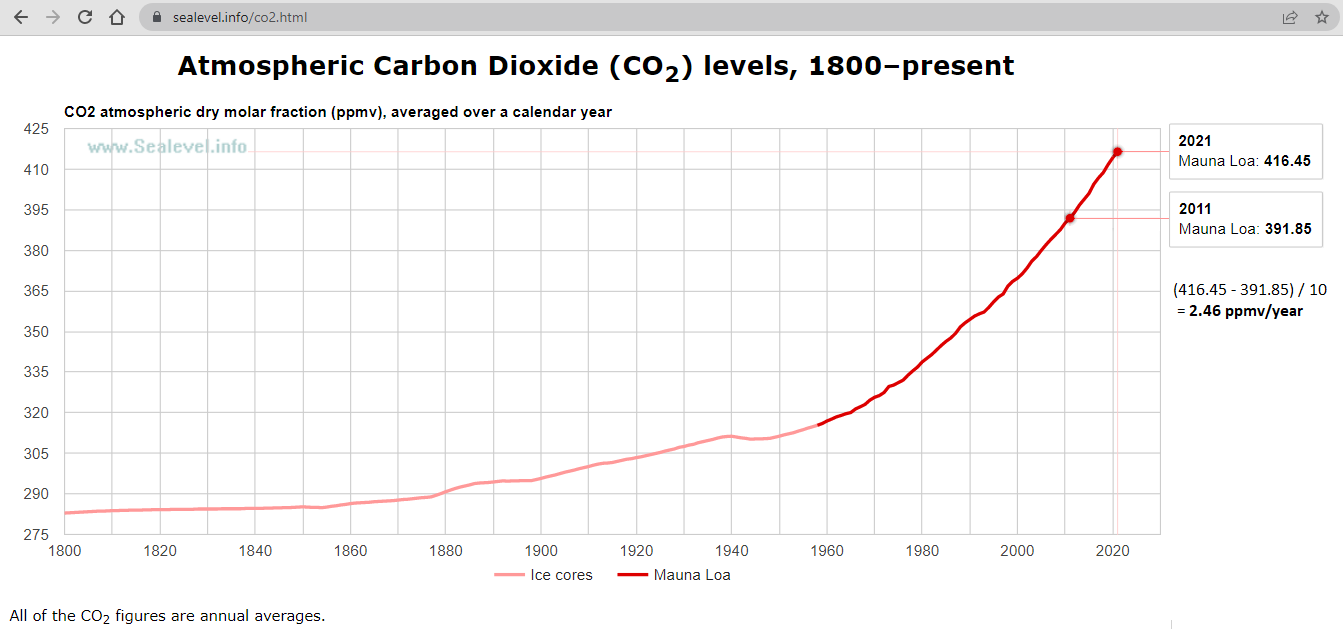
A 32% increase in the concentration of CO2 in the air increases the rate at which CO2 molecules in the air impact the ocean & falling raindrops by 32%, and thus increases the rate at which CO2 in the air is absorbed by the water by 32%. It effectively increases the equilibrium capacity of the water to hold dissolved CO2 by 32%.
Water temperature also has an effect on the rate at which CO2 dissolves into the ocean, per the temperature dependence of Henry’s Law, but that effect is much smaller. Here’s a graph:
The solubility of gases like CO2 in water decreases as the water gets warmer (per the temperature dependence of Henry’s law), so as the oceans warm they would outgas CO2, if nothing else changed. But the capacity of the water to hold dissolved CO2 decreases by only about 3% per 1°C by which the water warms. Since 1958 sea surface temperatures have warmed, on average, only about 0.6°C. Here’s a graph:
https://www.woodfortrees.org/plot/hadsst3gl/from:1958/mean:12/plot/hadsst3gl/from:1959/trend
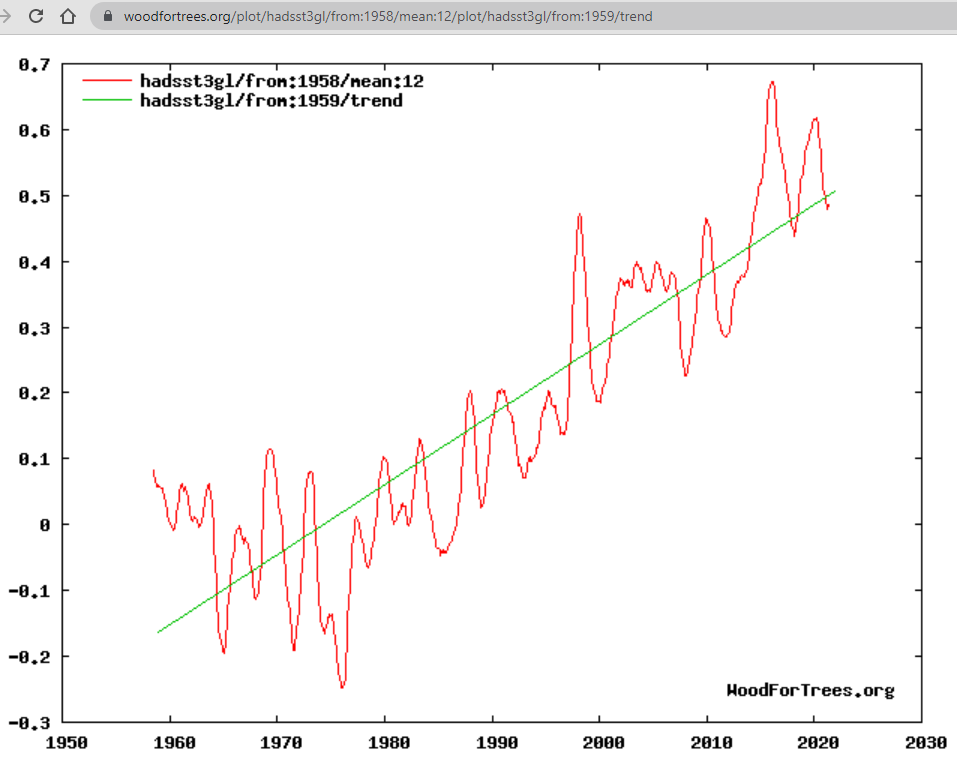
That ≈0.6°C SST increase should have decreased solubility of CO2 into the ocean by about 2%.
As you can see, the effect of the 32% increase in atmospheric CO2 level since 1958 dwarfs (is at least 15×) the effect of the slight water temperature increase over the same time period.
So the measly 3% per °C, by which CO2 solubility in water decreases as the water warms, is dwarfed by the increasing atmospheric CO2 concentration, and as atmospheric CO2 level continues to rise, the rate at which the oceans remove CO2 from the air will continue to accelerate.
When the oceans are absorbing CO2, as is currently the case in most places other than the tropics, if the water warms then the oceans absorb CO2 only slightly more slowly.
(Multiple links automatically place unapproved comments into the Moderator bin) SUNMOD
Wow no natural sources of CO2 … Are you THAT ignorant on purpose…?
That’s not what I said. Net natural fluxes are negative, every year. That means Nature is removing CO2 from the atmosphere, not adding it.
The net natural flux was approximately zero for most of the past 2,000 years…
Atmospheric CO2 would have been falling during pre-industrial times if the flux was negative.
Otherwise, your point is correct.
Yes, by “are negative” I meant “currently / recently.” I didn’t mean they’ve always been negative.
The reason they are negative is that that our current higher CO2 level accelerates the natural processes which remove CO2 from the atmosphere.
Dr. Roy Spencer quantified that relation. He determined from measurements that the net natural removal rate is closely approximated by the following “Simple Model” formula:
removalrate = (co2level – 295.1) × 0.0233
(units are ppmv CO2/year)
It very closely approximates measured reality, as you can see in his graph:
That has some very important implications. Who here can work out, using that formula, how high the atmospheric CO2 level could eventually get, if our CO2 emissions never decreased at all, but instead stabilized at, say, 5 ppmv per year? (I mean “who here” other than Hans Erren, because Hans knows the answer.)
I wrote, “Who here can work out, using that formula, how high the atmospheric CO2 level could eventually get, if our CO2 emissions never decreased at all, but instead stabilized at, say, 5 ppmv per year? (I mean “who here” other than Hans Erren, because Hans knows the answer.)“
Anyone?
Come on, don’t be shy!
Nobody?
https://www.youtube.com/watch?v=f4zyjLyBp64
Alright, here’s a hint.
Initially (currently) the natural CO2 removal rate is considerably less than the approximately 5 ppmv per year anthropogenic emission rate, which is why the amount of CO2 in the atmosphere increases each year. But as the CO2 level in the atmosphere rises, the natural processes that remove it accelerate. When the level gets high enough, the net removal rate will have accelerated enough to equal the 5 ppmv emission rate, and so the CO2 level will rise no further.
It is a very important negative feedback:
higher atmospheric CO2 level
→ accelerated tree growth, dissolution in water & rock weathering
→ faster removal of CO2 from the air
→ lower CO2 level
That means if the emission rate is fixed at 5 ppmv/year, the amount of CO2 in the atmosphere will eventually plateau at the level for which the removal rate is also 5 ppmv/year.
Now, recall Dr. Spencer’s “Simple Model” formula::
removalrate = (co2level – 295.1) × 0.0233
(units are ppmv CO2/year)
At the CO2 plateau level, the removal rate = the emission rate = 5 ppmv/year. So what will the CO2 level be when it plateaus, if CO2 emissions are fixed at 5 ppmv/year?
Tau is 20 years from the bomb decay curve.
Anyone who calls Ferdinand Engelbeen a clear thinker is a fool.
I doubt that he has ever been cited in a serious science paper, and never will.
The bomb curve is absolute proof that CO2 never accumulates in the atmosphere.
The OCO-2 was designed to be able to show anthropogenic CO2 as fundamental to the design. Actual data from that satellite show the opposite of what they claimed.
There is no significant anthro signal. It does show the massive CO2 cycling over the tropics.
Only a complete idiot could think that Ferdinand Engelbeen(!!) is a fool.
Ferdinand and I have disagreed on a lot of things, particularly the resolution of ice cores and validity of plant stomata… However, he is 100% correct in asserting that it has to be treated like a material (or mass) balance equation.
bwegher, besides a “Letter to Nature” about a complete different subject (chlorine in the world – against Greenpeace), I never attempted to publish anything in the “official” AGW publications, just a waste of time…
The bomb curve doesn’t proof at all that CO2 never accumulates in the atmosphere, as the bomb tests were stopped and what was already in the atmosphere did slowly sink in the (deep) oceans and vegetation.
If they had continued the bomb tests with increasing number (as human use of fossil fuels did), then one would have seen an increasing amount of 14C in the atmosphere, as the removal of 14CO2 was slower than the release from the bomb tests in the period 1942-1960.
Why then is the removal of an extra shot 14CO2 faster (around 14 years e-fold time) than for an extra injection of (mainly) 12CO2?
That is caused by the deep oceans circulation:
What goes into the deep oceans is the current isotopic composition of CO2, what comes out of the deep oceans is the isotopic composition of ~1000 years ago, long before human use of fossil fuels and the bomb tests.
That makes that in 1960, at the peak of the 14CO2 level in the atmosphere, some 97.5% of all 12CO2 (as mass) returned in the same year as absorbed, but only 45% of all 14CO2 (again as mass).
That makes that the removal of any extra 14CO2 is much faster (~factor 3) than of any extra 12CO2 above equilibrium…
“In other words, mankind increases the CO2 concentration in the atmosphere, and nature reducesit (since 1959, at least).”
WRONG. You leave out the oceans which have up to 50 times more dissolved CO2 than the atmosphere. It is constantly giving off and redissolving CO2 in various parts of the world. It is the oceans which outgas rapidly and redissolve slowly. There is a large delay in the overall changes in ocean temperatures based on solar activity, 8 years for small changes and 800 years for large. To pretend that nature only removes CO2 is ingenuous, or purposeful, but VERY WRONG. We have no effect on CO2 in the atmosphere as its half-life is about 5 years. AND, even if we did, more CO2 is beneficial as it is PLANT FOOD.
Well, Charles, your last sentence is correct: more CO2 is beneficial, as it is plant food. That is true.
But the rest is wrong. The oceans absorb CO2 in some places, and outgas in others, but the net flux is negative. So the oceans are removing CO2 from the atmosphere, not adding it to the atmosphere.
The half-life of the effect of CO2 we add to the atmosphere is about 35 years, not five. (The “bomb spike” puts a lower-bound on the number of 11.5 years.)
There is no 8 year or 800 year delay before changes in energy input affect ocean temperatures, either. Where on earth did you hear THAT? How on earth do you think that could possibly work, anyhow? Where do you imagine the energy hides, for 8 or 800 years, before it comes out of hiding and affects temperatures??
The fact that the oceans contain roughly 50 times as much CO2 as the atmosphere simply means that the flow of CO2 from atmosphere to oceans has a much greater effect on the atmosphere than it does on the oceans.
My only problem is that El Nino’s cause upwelling cold water to reach the surface. That does cause more CO2 to be released into the atmosphere. According to your timetable it would take 35 years for that spike to dissipate. It would also result in a long term accumulation just like anthro CO2 and every El Nino would add to that accumulation.
La Niña causes a transient increase in net removal of CO2 by the oceans, El Niño causes a transient decrease in net removal of CO2 by the oceans. Over 35 years we get quite a few of each, and they largely cancel.
Jim, I think the opposite is the case. In other words, it is La Niña events that allow the upwelling to occur; El Niño events do the opposite; they cut-off the upwelling, which is why: “The effects during the months of February, March, and April may become critical along the west coast of South America, El Niño reduces the upwelling of cold, nutrient-rich water that sustains large fish populations, which in turn sustain abundant sea birds, whose droppings support the fertilizer industry. The reduction in upwelling leads to fish kills off the shore of Peru.”
For more discussion, see: 2017 Eddebbar et al.
Wouldn’t cold water rising to the surface cause uptake of CO2? Warming water releases CO2, cold water absorbs it.
That’s the principle my home brew works on. 😀
Mark, The link for Eddebbar et al is:
https://agupubs.onlinelibrary.wiley.com/doi/10.1002/2017GB005630
See, in particular, Figure 1. The paper is mainly about O2 fluxes, but does discuss the CO2 exchanges as well.
I don’t know about the 8 years, but a few years back there were a number of articles and papers about how, during a GSM like the MWP, the ocean transported heat to the depths.
The 800 years (give or take) is not disputed even by the priests of AGW – it comes from solid science from ice cores and other sources. Temps rise then circa 800 years later, CO2 goes up.
The suggested explanation is the various large cycles that more oceans around. e.g. the PDO pushes warm water into the depths during it’s cycle. Large scale currents move the warmed water around until ~800 year later they return to the surface and cause a CO2 release.
I even recall one article proposing the LIA was caused not just by the Sun going quiet but also because colder waters were pushed to the surface to help lower the global temps. From memory, the author thought the Grand Solar Minimum couldn’t have enough of an effect by itself and proposed the rise of cold ocean pushed the balance into the little ice age.
The science and rationale behind it seemed solid and based on research from fields other than climate.
Well, the AMOC (Gulf Stream etc.) does apparently run on a (very roughly) 1000 year cycle.
But that doesn’t mean energy/warmth added to (or released from) the ocean has a delayed effect on average ocean temperature. It just describes how the warmer (or colder) water moves around.
Not much surface water warmth actually ever reaches the ocean depths. The temperature of the deep ocean is very, very stable. Most radiative energy (warmth) absorbed by the ocean is absorbed at low latitudes, and travels slowly to higher latitudes (where some of the water eventually sinks for its return trip to the tropics). During the several hundred year trip away from the tropics, the warmer surface water is continually evaporating (and raining back out), cooling, and very gradually becoming more saline. If, due to “global warming,” that water starts its journey a degree or two warmer than it otherwise would have been, after several hundred years most of that additional warmth will have been lost.
What’s more, there’s a natural “thermostat” (negative feedback mechanism) which works to further reduce the residual warmth that reaches the ocean depths. Decreased polar sea ice coverage (Arctic & Southern Ocean) increases water evaporation, cooling the ocean by evaporative heat loss (see also “Ice / Albedo Feedback”)
warmer water temp → less sea ice coverage → more evaporation → cooler water temp
Based on Nimbus-5 observations, Zwally, et al. 1983 [alt1] [alt2] reported that:
“…the release of heat to the atmosphere from the open water is up to 100 times greater than the heat conducted through the ice.”
It’s an important effect, as the NSIDC explains:
“Sea ice regulates exchanges of heat, moisture and salinity in the polar oceans. It insulates the relatively warm ocean water from the cold polar atmosphere except where cracks, or leads, in the ice allow exchange of heat and water vapor from ocean to atmosphere in winter. The number of leads determines where and how much heat and water are lost to the atmosphere, which may affect local cloud cover and precipitation.”
…and in another article:
“Less ice also contributes to higher air temperatures by allowing transfer of heat from the relatively warmer ocean.”
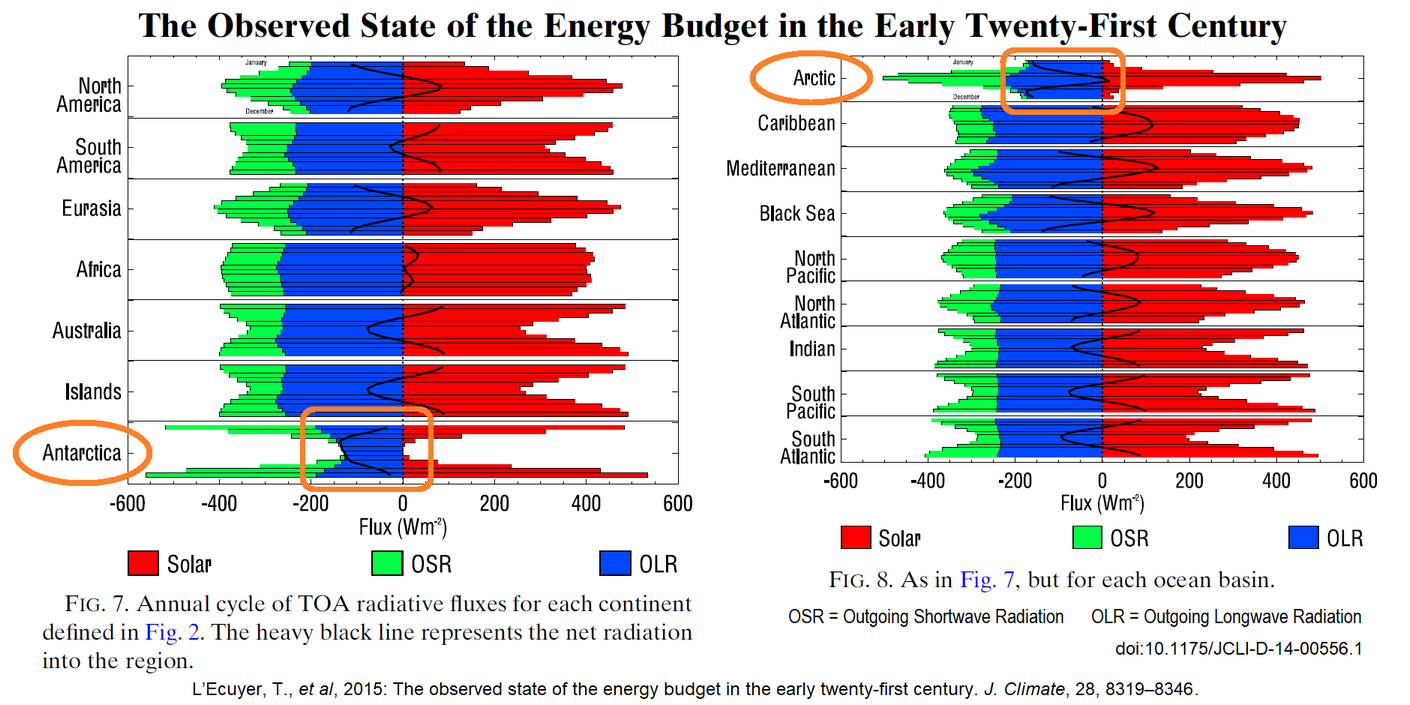
Note that the Earth’s polar regions have net-negative radiation budgets. That is, they radiate more energy than they absorb from sunlight. That is always the case in Antarctica, even in summer. It is nearly always the case in the Arctic, as well, except for a brief period near the summer solstice, when the Sun is at its zenith, and solar radiation absorbed approximates radiation emitted.
https://sealevel.info/2015_lecuyer_eeb_jcli_fig7-8.html
Why, when I attempt to find the level of the human CO2 contribution, I am given a 33/4 percent contribution estimate by the EPA and a 5 percent contribution by the IPCC? Why has an early OCO-2 satellite mapping shown that the highest levels of CO2 on Earth were at the locations of the Amazon Rain Forest, The Central African Congo Basin, Southeast China, Southeast Asia and Indonesia, the most highly vegetative areas on Earth?
Where are those numbers from, Bill? (Links, please.)
Since 1959, mankind has added about 180% of the observed increase in the amount of CO2 in the atmosphere.
Bill, a good bookkeeper looks at all ins and outs:
In: 95% natural, 5% human
Net increase in the atmosphere: 2.5%
Out (in minus increase): 97.5% natural
Net natural: -2.5%
Thus (near) all increase is from the human contribution, even if that is only 5% of the input…
The OCO-2 satellite measures the extra CO2 from the upwelling waters near the equator which spreads all over the equator. Tropical forests are largely neutral: sources during El Niño, sinks during La Niña.
CO2 moves from the equator to the poles and sinks there with the cold waters to return some 1000 years later near the equator. Even so, that cycle is more sink than source: together with the ocean surface about 1/4 of human emissions (in CO2 mass).
I have a geologic perspective. The consistent interstadial increase in temperature, methane, and CO2 in the 2 million years of mostly glacial earth climate becomes inconsistent in my mind with your assertions, calculations, and cites. In my mind, the data should correlate to the theory from a longer perspective. Further, it is shown that CO2 lags temperature increase so a rule in science applied to a lagging phenomena says CO2 can not be the cause of the steady rise in temperature on the scale of the glacial cycles. From the generally accepted data from the Vostok Ice Cores, it is interesting that the temperature, CO2, and methane are at their highest at the end of the interstadial period coincidentally at the onset of the next continental glacial cycle. By inspection, the correlation of high temperature, high methane high CO2 to the end of the warming belies the three of them as the driver of warming and cooling at the significant scale of the 2 million years of the glacial phase of earth’s climate. The correlation is there and it would be more compelling to consider the glacial cycle that repeatedly followed was caused by or had a trigger that these phenomena caused. Since we have no direct quantitative reading of what the actual relationship of CO2 is to temperature it is also possible to conject that if the warming although unquantified relating to anthropogenic CO2 overwhelms the undefined cooling mechanism that initiated the Little Ice Age presumably will also initiate the next Ice age. There is also a conjecture that could be examined that if the above has merit save the anthropogenic CO2 we would be in the next Ice Age now. The CO2 argument is essentially that as a species, we are Geoengineering a warmer climate. If the Little Ice Age was actually the termination of the interstadial period, we could otherwise be under a mile of ice in New England and initiating mass migrations held in bay only by rising Anthropogenic CO2 causing extra heat retention. Wouldn’t it be an error on a very strategic level, considering the unanticipated result of an Iceage, to cease contributing CO2 if that action would mitigate the inevitable? ( using a scientifically acceptable principle of looking at a series of repeating cycles and predicting that the cycles if uninterrupted by some known mechanism will continue) This whole short-sighted argument about anthropogenic CO2 seems mostly political with blinders on to a solid two million-year perspective that seems to point in a very different direction. And even more questionable as we will need Carbon-based energy to waste on sending our children to overcome and kill other people’s children. Again on another level strategically inconsistent.
I agree with most of what you wrote, Halftiderock, except that it would take a lot more than two or three centuries of ice sheet growth before the Laurentide would again cover New England in a mile of ice.
We know from ice cores that glaciation cycles have typically driven about a 90 ppmv change in atmospheric CO2 levels, from a low averaging around 190 ppmv at glacial maxima, to a high averaging around 280 ppmv at interglacial peaks. That 90 ppmv CO2 level swing corresponds to a global average temperature swing estimated to have been 5-10°C (and a polar temperature change somewhat more than that).
That suggests we we could get 9-18 ppmv of eventual CO2 increase from a 1°C global temperature increase.
That’s also fairly consistent with the 9 ppmv CO2 decrease from the 284.1 ppmv MWP peak circa 1170 to the 275.3 ppmv LIA minimum circa 161, which is recorded in ice cores.
Thanks to mankind’s CO2 emissions, the CO2 level is now about 130 ppmv higher than the high end of that range. Murry Salby thinks the CO2 level increase is due to global warming, but at 9-18 ppmv per °C it would take 7°C to 15°C of global warming to get that much additional CO2!
What’s more, to get the 90 ppmv CO2 increases from glacial maxima to interglacial climate optimums typically took on the order of 10,000 years. We’ve gotten >130 ppmv in only about two centuries, and 3/4 of it in just the last 63 years.
Paragraphs PLEASE, Halftiderock? My old eyes start to give me double vision trying to read that wall of text. 😀
The 8-month seasonal ramp-up phase of atmospheric CO2 has a range of about 6-8 PPM. To make calculations simple, let’s say it is about 1 PPM per month. It appears to be driven primarily by biological decomposition. Whereas, the anthro’ contribution is <0.4 PPM per month.
During the 4-month draw-down phase, driven by photosynthesis, the biological decomposition continues, at an accelerated rate, with additions from oceanic out-gassing. The flux is about -1.5 PPM. Yes, plants can’t keep up with the annual increases from everything except anthro’ emissions. That is, anthro’ emissions are pretty much constant. Yet, you attribute the net gain of about 2 PPM per year to only the small constant anthro’ emissions when all the other sources are increasing.
Clyde, it sounds like you’re talking specifically about the local seasonal CO2 cycle at Mauna Loa. The seasonal cycle varies drastically with location (especially with latitude). Here’s Mauna Loa contrasted with Cape Grim:
Here’s a map:
That’s why, if you’re talking about global CO2 levels (or the total amount of CO2 in the atmosphere), you need to use annual averages, to get rid of the seasonal cycle, like I do in this graph:
https://sealevel.info/co2.html

It is obviously true that seasonal plants only draw down CO2 in their growing season. But so what? That doesn’t change the fact that the net sum, over an entire year, of all natural CO2 fluxes, is negative (counting emissions as positive and removals as negative). It is been true every year for many years that nature removes more CO2 from the atmosphere than it adds.
Yes, I was talking specifically about MLO. It is about midway between Barrow and Antarctica. Thus, it is a good first-order approximation of the global average and has the longest and probably the highest quality data.
I focused on MLO at a monthly resolution because a correlation doesn’t exist between the highly variable MLO monthly fluxes and anthro’ emissions. The situation is even more extreme using Barrow data.
So, the current paradigm is that because the annual increase in atmospheric CO2 is approximately half of the annual anthro’ emissions, despite no demonstrable correlation, and natural sources obviously driving the seasonal changes, it must be the small, constant anthro’ emissions that is responsible for the net increase. A case of the tail wagging the dog.
Plants and plankton are important because they have a relatively short growing season and there is probably a lag in absorbing the growth in CO2 from warming Winters (particularly in the Tundra, but probably also significant in the Boreal forests as the Winters warm, allowing increasing respiration.)
Clyde, again…
Short time variability says nothing about long term cause and effect.
Of course, the seasonal temperature changes are followed by seasonal CO2 changes: higher temperature = less CO2.
Of course the year by year temperature changes are followed by year by year CO2 changes: higher temperature = more CO2.|
Even for the fast changes, the CO2 changes are opposite to each other. And you expect that one can use that to “prove” that our emissions are not the cause of the increase?
Moreover, there is a extreme good correlation between total emissions and total increase in the atmosphere.
Even if correlations between two up going variables is often spurious, the cause in this case is supported by every single observation. No observation refutes the cause…
Clyde, the oxygen balance shows that the biological cycle is absorbing more CO2 out of the atmosphere in spring/summer than releasing it again in fall/winter.
No matter how fast that happens or how that cycle increased over time.
The biosphere as a whole is more sink than source.
Thus the biosphere can’t be the cause of the CO2 increase in the atmosphere, the earth is greening!
Nature works in cycles and cycles have sinks besides sources. Humans emit mostly one-way. That is why that tiny contribution of humans is the main cause of the increase.
https://tildesites.bowdoin.edu/~mbattle/papers_posters_and_talks/BenderGBC2005.pdf
“The answer is that some of the processes which remove ¹⁴CO2 from the atmosphere do so by exchanging it, one-for-one, for ¹²CO2.”
This statement has no sense. We all know that there is CO2 flux happening all the time and the Earth breath atmosphere in and out like a person breathing. If you look at the residence time for CO2 this way, then some water effectively does not ever leave the atmosphere at all and has infinite residence time since there are on the average an 13K cubic Km at any given moment in the atmosphere.
You are twisting definitions like a contortionist on fentanyl.
I don’t know what is confusing about this to you, pulsar.
The same thing happens whenever two carbon reservoirs have offsetting fluxes between them, but have differing percentages of the different carbon isotopes.
Suppose, for example, that you have a body of water which contains dissolved CO2 at 1 ppt ¹⁴CO2 (meaning one in a trillion C atoms are 14C), and the atmosphere above it contains CO2 at only 0.5 ppt ¹⁴CO2 because a lot of it is from 14C-depleted “fossil” carbon. For simplicity, also suppose that the temperatures and partial pressures of the two CO2 concentrations (air & water) are in equilibrium (per Henry’s Law), and let’s assume the temperatures of air and water are the same and are stable.
Are you with me, so far?
Since the the two are in equilibrium w/r/t their CO2 concentrations, the amount of CO2 in the air and the amount in the water will not change.
However, at the boundary between air and water, CO2 is continually being exchanged. Since they’re in equilibrium, the rate at which CO2 molecules are released from the water equals the rate at which CO2 molecules from the air dissolve in the water.
That process will not change the total amount of CO2 in the air or in the water, but it will gradually decrease the percentage of ¹⁴CO2 in the water and increase the percentage of ¹⁴CO2 in the air.
Do you see that?
So, after a while, the percentage of the CO2 in the air which is ¹⁴CO2 will have increased above 0.5 ppt, and the percentage of the CO2 in the water which is ¹⁴CO2 will have decreased below 1.0 ppt.
That’s what I’m talking about. That’s how processes which merely exchange CO2 one-for-one can change the amount of ¹⁴CO2 in the air or water without affecting the total amount of CO2.
That’s why the 11.5 year half-life of CO2 in the atmosphere, which we deduce from the “bomb spike” decay curve, understates the effective half-life of CO2 added to the atmosphere: because some of the processes which remove 14C do so by replacing it with 12C, and do not affect the amount of CO2 in the air.
The NASA paper entitled “Satellite Reveals Human Contribution to Atmospheric CO2” includes mapping of the US which shows levels of human CO2 contribution. The Western half of the US shows almost no contribution. Almost all of the contribution is in the East. The states of West Virginia and Pennsylvania show the highest level of CO2. The North-South line delineating the CO2 area from the non-CO2 area coincides closely with the North-South line in the World Atlas’s climate map of the US which separates the moist- rainy East from the semi-arid West. The area with the most CO2 presence is the Southeastern US. There is no correlation between areas of human concentration and higher CO2 levels.
The latest papers by Dr. Ed Berry and the ones by Salby and Harde agree with your analysis using well thought out physical reasoning. If the IPCC crowd want to continue their position they better get serious about falsifying those new papers.
Yes, Harde’s work is impressive. There are a lot more out there. Lovelock says the same thing. Ask any biologist or botanist or anyone who has any understanding of the global biogeochemical carbon cycle. They will agree if they are honest.
Ed Berry’s paper and his PSI article are a mess.
Ed (and a few others, like Salby & Harde) contend that adding CO2 to the atmosphere does not significantly affect the amount of CO2 in the atmosphere.
Read that sentence again. If it sounds ridiculous, that’s because it is ridiculous.
They would have you believe that the anthropogenic CO2 just vanishes from the atmosphere, or somehow doesn’t count. Salby, at least, thinks that the atmospheric CO2 level is increasing by an average of more than 2 ppmv per year simply because global mean temperatures are now about 1°C warmer than they were during the Little Ice Age.
That is obviously nonsense. I critiqued it here:
https://sealevel.info/Salby_CO2_lecture_critique.html
I also critiqued it in the comments on his youtube video, in two parts: here, and here. (He never responded.)
Ed published his paper on this in one of those pay-to-publish journals:
http://www.sciencepublishinggroup.com/journal/paperinfo?journalid=298&doi=10.11648/j.ijaos.20190301.13
I wrote to them and asked if they would accept a Letter to the Editor about it, and their answer was that they would do so only if I paid them. (Are you surprised?)
We know from reliable measurements that every year the amount of CO2 in the atmosphere increases by less than the amount of CO2 which mankind adds to the atmosphere.
In other words, mankind increases the CO2 concentration in the atmosphere, and nature reduces it (since 1959, at least).
Those facts are not disputable.
That means the only reason that the atmospheric CO2 level continues to rise is that mankind is adding CO2 faster than nature is removing it.
Why do we assume that El Nino and La Nina are necessarily naturally caused events?
Because they have been happening for hundreds of years. Lots of science and history on them
2014 Science Mag paper on el nino
That article talks about El Nino during the last 21,000 years. I recall mention of a paper that linked El Nino variations over the past several million years to paleo data from tropical coral remains.
It would be rather hard to fine human causes in that.
#1
Thank you, Mike, for that confirmation that ENSO cycles are known to have been going on for far longer than mankind’s influence.
However, that snippet from the paper made me roll my eyes. I think that it is absolutely ridiculous to trust simulation runs with untestable and certainly very badly broken GCM models to inform your understanding of ENSO cycles thousands of years in the past. The writers of those models can’t even agree, to within a factor of two(!), on the most basic climate parameters!
https://sealevel.info/AR5_Table_9.5_p.818.html
It is ludicrous to hope that GCMs have any hope of correctly modeling the intricacies of ENSO.
There’s a good lesson about the usefulness of sophisticated but untestable computer models to be learned from NASA’s “sophisticated computer model of the sun’s inner dynamo.”
On the basis of that sophisticated computer model, in 2006 they confidently predicted that Solar Cycle 24 would be very strong:
https://science.nasa.gov/science-news/science-at-nasa/2006/21dec_cycle24/#:~:text=a%20sophisticated%20computer%20model%20of%20the%20sun%E2%80%99s%20inner%20dynamo%20to%20produce%20a%20physics%2Dbased%20prediction

Of course, as most readers here know, Solar Cycle 24 was the weakest solar cycle in about a century.
#2
This bit is odd:
Since atmospheric CO2 concentrations tend to rise as glaciers retreat, that statement seems like a contradiction.
Are you a human that considers humanity is unnatural then?
Remarkably arrogant of you, if I may say so.
Because Occam’s Razor is a great, practical tool for understanding nature and physics.
It’s a generality. More philosophical than practical.
I worked in life critical engineering and sciences for decades and never met one person who used Occam’s Razor to solve a specific problem. It might come up in a group of people framing a complicated hypothesis with lots of unknowns.
Hmmm . . . my life experience in engineering is quite different from yours.
Go figure.
But you actually are not an engineer, or are you!
Nuclear engineer 1977 to 1981. Typical failure rate of the training classes was 2/3.
Part of the final exam was the design of a heterogeneous core. All you had was a slide rule and an hour of time. Also had the highest final rating in the following six months of practical training.
On the 688 class sub, I doubt anyone outside of the training would say we were not engineers. I became part of the ongoing teaching of various engine room systems. During external oversight inspections, I was always picked for the interviewers questions.
No one ever mentioned Occam’s razor.
What specific engineering question did you solve using Occam’s Razor?
bwegher
Have you ever played minesweeper!
I suggest it to you as a simple elementary example introduction to Occam’s Razor method for dummies.
As far as I can tell there is no any viable correct answer or solving of any practical engineering problems to consider, outside or in absence of the Occam’s Razor method approach.
Of course, there may be a lot of engineers out there, relying significantly on the practical application of the Occam’s Razor method, without even knowing it, as most not even have heard of it.
So very much practical method it happens to be in it’s nature.
Getting to approach, consider and weight the most possible valid solution, via elimination, excluding or cancellation of the non valid options… is one of the simple ways to put it.
No any major philosophicals, or rocket science there.
Oh,well.
cheers
whiten,
Nicely summarized! Especially the statement: “. . . there may be a lot of engineers out there, relying significantly on the practical application of the Occam’s Razor method, without even knowing it . ..”
Occam’s Razor stops Rube Goldberg devices from proliferating.
So Bewgher, you never use the simplest solution when engineering something?
“I worked in life critical engineering and sciences for decades and never met one person who used Occam’s Razor to solve a specific problem.”
Well, then, I conclude that you never performed—nor ever met a person that performed—a rigorous failure analysis or a FMECA (failure modes and effects criticality assessment).
In both cases, there is a normal engineering assumption at the start that multiple simultaneous failures of separate critical point mechanisms or processes in the system being considered will not happen . . . a method of asserting that simpler explanations are favored over more complicated explanations . . . Occam’s Razor used in real life, to great benefit.
A classic case in point was Dr. Richard Feynman’s public presentation that the root cause of the Space Shuttle Challenger’s explosion was launching the STS assembly with the SRB critical o-ring seals at a temperature below which they had functional elasticity (see short video of his demonstration using the o-ring material in a cup of ice water at
https://www.youtube.com/watch?v=raMmRKGkGD4 ).
As has been noted by others, Feynman didn’t need to devote hours to calculations about the structural integrity of the integrate Shuttle, nor assert multiple simultaneous critical point failures in order to reach a conclusion about the cause of its disintegration. His brutally simple explanation is shown in the video above. He was correct.
Ali Bertarian;
La Ninas and El Ninos are primarily caused by changing levels of SO2 aerosols in the atmosphere, primarily from volcanic eruptions.
VEI4 and larger volcanic eruptions .inject enough reflective SO2 aerosols ,into the stratosphere to cool the earth down to La Nina temperatures .
When those aerosols eventually settle out, temperatures rise because of the cleansed air to pre-eruption temperatures, and usually a bit higher, usually frequently causing an El Nino..
For El Ninos, about half of those that have occurred between 1850 and the present have been caused by man’s activities. , ,
To those “down voters”, educate yourselves by reading “A Graphical Explanation of Climate Change”
http://www.skepticmedpublishers.com/article-in-press-journal-of-earth-science-and-climatic-change/
The attached graph shows that all temporary increases in average anomalous global temperatures have been due to decreases in atmospheric SO2 aerosol levels, and that the gradual increase since circa 1980 has been due to global Clean Air efforts to reduce industrial SO2 aerosol emissions
Dr. Roy has a wicked sense of humor, if you are into probability theory, resulting statistics, and econometrics applications (all of which deals with autocorrelation and heteroskedasticity in almost all economic data analysis).
Unfortunately most are not, including most ‘climate scientists’—Mann centered PCA being exhibit A. So unfortunately little ultimate impact despite his post being a great ‘climate science’ takedown here.
I spent a couple of weeks one year looking at the author lists on global warming papers and failed to locate a single statistician on any of the papers. (Process: look at names and affiliations on paper, go to web site for affiliate and search for name, find department website for individual, find individual and see what their bio or brief bio blurb says. – results: no stats people even when the paper relied on statistics.)
granted, it was only 100 or so papers in Nature. It was made somewhat easier by the same couple of dozen names over and over again.
A legitimate statistics person onboard their teams would have prevented ‘p hunting’ and their sorting inputs/outputs for results most aligned to their desires.
Similarly, honest engineers on their team would have harmed their ignoring proper error bounds tracking and accumulation.
Why would they include people on their team that would point out fundamental flaws in their approach and results? They have a pre-determined result and don’t want any dissension.
Indeed.

https://sealevel.info/FOIA/1299.txt#:~:text=Why%20should%20I%20make%20the%20data%20available%20to%20you%2C%20when%20your%20aim%20%20%20%20%20%20is%20to%20try%20and%20find%20something%20wrong%20with%20it.
“a role for increasing surface temperature causing increasing CO2”
Well, of course, that is what the Antarctic Ice Core data told you 20+ years ago.
Good data from Dr. Roy spencer, but the two main problems with CAGW continue. There is not a useful signal that can be defined against the background of natural variance, in this case a steady atmospheric CO2 increase (probably since the end of the Little Ice Age?), and association is not causation. The last one requires a dedicated examination of all potential influences to atmospheric CO2, and that simply hasn’t been done. I’m still headed for the beaches for vacations.
Is there a global UHI measure to throw in and check for multicollinearity?
If I had to pick a man made effect that would affect global temperatures since WWII I wouldnt pick CO2. I would pick two other things – the rise of urbanisation, and the rise of air travel.
Never mind che*trails, contrails are real and dump albedo modifying ice into the straposhere. The arctic is a place many aircraft fly over. No aircraft use the south pole as an air route.
Cities exist where humans exist, and temperature gauges exist where humans exist too.
Yes. At one time, sulfate aerosols were blamed for the cooling from the 40’s through the 70’s, and it was in the 70’s that we began cleaning up first emissions from coal fired power plants, and since from petroleum derived fuels. If they did contribute to cooling, then it stands to reason that their reduction would lead to warming.
I lived in the industrial midwest during the 60s and early 70s, and I always thought the crayon box was wrong on labeling sky blue. The sky I saw had a vaguely brown hue with blue highlights. By the 80s, it was blue. I have often postulated that any warming in the 80s and 90s was likely due to the clearing of the sky until an equilibrium was reached.
I often say that the EPA achieved its mission by about 1978 and has been living on bureaucratic immortality ever since.
Yep, though, reducing sulfur in gasoline and diesel enable catalytic converters and particulate traps to be more effective and that came in the 90’s to early 2000’s. Sulfur reduction in jet fuels came along for the ride and now reduction of sulfur in marine fuel oils has been mandated.
OweninGA
You are correct, except that equilibrium still has not been reached.. Industrial SO2 aerosol emissions peaked at 136 Megatons in 1979, and are currently (2019) at 72 Megatons.
Room for a lot more warming to occur, when there are no volcanic SO2 aerosol emissions present.
Dr Spencer,
I was part way through an analysis just like yours when I paused to seek monthly or quarterly data which might be better than annual. (No luck so far on estimated emissions). Thank you for saving me a duplicated effort.
Some points arose that might bear discussion.
Hope this helps and does not distract. Geoff S
With regard to the covid effect. Emissions from burning fossil fuels are only a few percent of natural emission. So, the net effect would have been a small percentage of a small percentage. Natural variation makes it very difficult to observe that signal.
Geoff, you said,
I provided a link to 2020 monthly anthro’ emissions here:
https://wattsupwiththat.com/2022/03/22/anthropogenic-co2-and-the-expected-results-from-eliminating-it/
Clyde.
Yes, I remember that. On my to-do list was to contact you to see if you could email me the monthly data you had. Some of my search was for up-to-date data into the first months of 2022. Clyde, if you can help, most grateful sherro01 at outlook dot com
Geoff S
Geoff,
I took my raw data from the graph here:
https://www.iea.org/data-and-statistics/charts/monthly-evolution-of-global-co2-emissions-2020-relative-to-2019
The supposed CV-19 CO2 downturn wasn’t any different than previous or later downturns that naturally followed equatorial SST changes, such as during the 2020-21 La Nina:
The ocean temperature profile conforms to the CO2 solubility curve (via Henry’s Law):
What does the CO2 level near the surface tell us? It is mainly marine algae at the surface of the oceans that absorb CO2 and produce oxygen. Above the surface of the cold oceans (currently in the north) CO2 levels are high.
https://earth.nullschool.net/#2022/04/09/1500Z/chem/surface/level/overlay=co2sc/patterson
La Niña, thanks to upwelling, is very conducive to algal growth in the tropical Pacific.
https://www.longpaddock.qld.gov.au/soi/
How does the equatorial Pacific respond?
http://www.bom.gov.au/archive/oceanography/ocean_anals/IDYOC007/IDYOC007.202204.gif
Let’s look at chlorophyll growth in the Hawaii area since 2020.
https://www.ospo.noaa.gov/Products/ocean/color/viirs/snpp/timeseries-chl-a.html
Atmospheric CO2 changes lag atmospheric temperature changes at all measured time scales. The future cannot cause the past.
Roy Spencer published two papers re my 2008 correspondence with him and my paper of that year.
http://wattsupwiththat.wordpress.com/2008/01/25/double-whammy-friday-roy-spencer-on-how-oceans-are-driving-co2/
http://wattsupwiththat.wordpress.com/2008/01/28/spencer-pt2-more-co2-peculiarities-the-c13c12-isotope-ratio/
Humlum et al confirmed my 2008 work in 2013.
Ed Berry further supported my 2008 work in 2021.
And Kuo et al observed this lag and published in Nature way back in 1990.
I am aware of the counter-arguments, and most of them are invalid.
There may be a human-made component of atmospheric CO2 growth, probably less than 50% of the total, and maybe much less (Berry says 25%).
There is certainly a natural component of atmospheric CO2 growth, probably more than 50% (Berry says 75%).
In any case, it is highly improbable that Climate Sensitivity to increasing atmospheric CO2 is more than ~1K/doubling and it is probably so close to zero as to be insignificant.
In conclusion, there is NO catastrophic human-made global warming (CAGW) crisis – that hypothesis was falsified decades ago, was never true and has caused the waste of trillions of dollars and millions of lives, especially in the developing world. CAGW is a decades-old scam – Wolves stampeding the sheep, for financial and political gain – Crimes against humanity.
Regards, Allan MacRae
Calgary
https://wattsupwiththat.com/2021/06/07/carbon-cycle/#comment-3264363
[excerpt]
Atmospheric CO2 changes lag temperature changes at all measured time scales. (MacRae 2008). Humlum et al (2013) confirmed this conclusion.
Kuo et al (1990) made similar observations in the journal Nature, but have been studiously ignored.
IF CO2 is a significant driver of global temperature, CO2 changes would lead temperature changes but they do NOT – CO2 changes lag temperature changes.
Think about that:
Kuo was correct in 1990, and for 31 (now 32) years climate science has ignored that conclusion and has been going backwards!
Climate Sensitivity (CS) to CO2 is a fiction – so small, if it even exists, it is practically irrelevant.
“The future cannot cause the past.” Here is the proof, from my 2008 paper:
https://www.woodfortrees.org/plot/esrl-co2/from:1979/mean:12/derivative/plot/uah6/from:1979/scale:0.18/offset:0.17
In the modern data record, the lag of atmospheric CO2 changes after atmospheric temperature changes is ~9 months. This is an absolute disproof of the CAGW hypothesis, which states that increasing CO2 drives temperature. “The future cannot cause the past.”
In my 2019 paper below, I explained why the lag is ~9 months – it is basic calculus, the 90 degree (1/4 cycle) lag of the derivative and its integral, which is the ~3 year ENSO period.
My 2008 paper remains very important. My 2008 conclusion was confirmed and expanded by Humlum et al in 2013, for which I am grateful.
All warmists and most skeptics argue about the magnitude of climate sensitivity to increasing CO2, and whether the resulting CO2-driven global warming will be hot and dangerous or warm and beneficial. Both groups are probably wrong.
There is a high probability that the mainstream climate debate about the magnitude of CS is wrong – a waste of decades of vital time, tens of trillions of dollars of green energy nonsense and millions of lives. Vital energy systems have been compromised, damaged with intermittent, unreliable wind and solar generation – a debacle.
It is important to note that Global Cooling is happening now, even as CO2 concentration increases – another disproof of the global warming fraud.
Cheap abundant reliable energy is the lifeblood of humanity – it IS that simple. The green sabotage of our vital energy systems, whether innocent or deliberate, has cost lives and could cost very many more.
https://wattsupwiththat.com/2022/01/16/how-much-manmade-co2-is-in-the-atmosphere-really/#comment-3433167
Ed Berry’s similar conclusion was published in December 2021.
Preprint #3: A new carbon cycle model shows human emissions cause 25% and nature 75% of the CO2 increase – edberry.com
HUMAN CARBON EMISSIONS CAUSE ONLY 25% OF THE CO2 INCREASE
Edwin X Berry
Climate Physics, LLC, Bigfork, Montana59911, USA
Edwin X Berry, ed@edberry.com
August 12, 2021
Excellent. Just excellent. Check out Hermann Harde’s work. For example
https://www.sciencedirect.com/science/article/abs/pii/S0921818116304787
That’s a brilliant paper. It makes sense.
Murry Salby, Hermann Harde and Ed Berry all make the same point. I don’t know Harde, but am friends with Salby and Berry. It’s long past time that we gave them fair consideration. The Climate Cancel Culture is finished – they have made 48 consecutive wrong, expired predictions, and have 100% negative credibility!
“VIRTUALLY EVERY SCARY PREDICTION BY GLOBAL WARMING ALARMISTS IS FALSE.”
“Rode and Fischbeck, professor of Social & Decision Sciences and Engineering & Public Policy, collected 79 predictions of climate-caused apocalypse going back to the first Earth Day in 1970. With the passage of time, many of these forecasts have since expired; the dates have come and gone uneventfully. In fact, 48 (61%) of the predictions have already expired as of the end of 2020.”
https://www.inderscience.com/info/inarticle.php?artid=112896
By the end of 2020, the climate doomsters were proved wrong in their scary climate predictions 48 times. At 50:50 odds for each prediction, that is like flipping a coin 48 times and losing every time! The probability of that being mere random ignorance is 1 in 281 trillion! But no sensible person makes a 50:50 prediction – at 60:40 the odds against being this wrong are 1 in 13 quintillion; at 70:30 the odds against being this wrong are 1 in 13 septillion. With their falsehoods, the climate doomsters have wasted trillions of dollars and millions of lives, mostly in the developing world. Crimes against humanity!
Contrary to popular belief, science is not about how many times a falsehood is repeated. Science is about hypothesis, evidence, support or disproof – and the alleged Global Warming Crisis was disproved decades ago.
THE CATASTROPHIC ANTHROPOGENIC GLOBAL WARMING (CAGW) AND THE HUMANMADE CLIMATE CHANGE CRISES ARE PROVED FALSE January 10, 2020
https://thsresearch.files.wordpress.com/2020/01/the-catastrophic-anthropogenic-global-warming-cagw-and-the-humanmade-climate-change-crises-are-proved-false.pdf
Allan, Murry Salby, Hermann Harde and Ed Berry all make the same point.
And all four are equally wrong.
It is not because you and the others are wrong, that the IPCC and others are right on all points. Only on the point that the CO2 increase is man-made, the IPCC is right. That is rock solid science: all observations support that conclusion, none violates it.
Any non-human increase of CO2 violates one (at least the mass balance) or more observations…
That doesn’t mean that the IPCC is right on any of their “projections” for the future: there they are completely wrong.
That is where skeptics should focus: the non-performance of climate models with all their dire predictions. Not on the cause of the CO2 increase: that is man-made and a completely lost battle if you try to prove otherwise…
Hi Ferdinand,
We’ve been discussing this point since 2008 or earlier.
It’s good to see you are well.
Are you saying that 100.0% of the increase in atmospheric CO2 is human-made and caused by fossil fuel combustion and 0.0% is natural?
If not, exactly what are you saying?
Is there a natural component at all, in your opinion?
bwegher, it seems to me that you just accept any paper that tells what you like to hear…
At that time, I wrote a comment where Harde made several fundamental errors in his paper:
http://www.ferdinand-engelbeen.be/klimaat/Harde.pdf
Conclusion:
Dr. Harde makes three fundamental errors:
Besides that, the “temperature fits almost all” solution violates about every single observation in the atmosphere, oceans and vegetation, while the human cause fits them all. Like the mass balance, the decline of δ13C level (in atmosphere, ocean surface and vegetation), the pre-1950 change in 14C, the changes of pH and DIC in the ocean surface, the change in oxygen balance and last but not least Henry’s law for the solubility of CO2 in seawater
CO2, GLOBAL WARMING, CLIMATE AND ENERGY – Watts Up With That? June 15, 2019
Excerpt of the mechanism sequence Nino34SST changes -> Atmospheric CO2 changes:
6. The sequence is Nino34 Area SST warms, seawater evaporates, Tropical atmospheric humidity increases, Tropical atmospheric temperature warms, Global atmospheric temperature warms, atmospheric CO2 increases (Figs.6a and 6b).
Other factors such as fossil fuel combustion, deforestation, etc. may also cause significant increases in atmospheric CO2. However, global temperature drives CO2 much more than CO2 drives temperature.
Fig.6a – Nino34 Area SST warms, seawater evaporates, Tropical atmospheric humidity (offset) increases, Tropical atmospheric temperature warms…
Fig.6b …and UAH LT Tropics Atmospheric Temperature leads UAH LT Global Atmospheric Temperature, which leads changes in Atmospheric CO2.
Allan, we have been there before many times, but you are simply wrong.
To start with in the first reference, you compare temperature variability with the derivative of the CO2 increase, thus effectively removing the cause of the slightly quadratic trend in CO2: human emissions that also increase slightly quadratic, at twice the increase in the atmosphere.
Either compare temperature increase with CO2 increase or compare the derivatives of both. Not a full variable with the derivative of the other variable.
Moreover, there is zero lag in the variability. Zero, none. You can’t say from your graph that temperature variations leads CO2 variations or reverse.
Of course there is a lag, but that is in the derivatives and that shows that all variability is caused by temperature variability, but that the trends are caused by the trend in human emissions: the trend in the derivative of temperature is zero…
Further, your theory violates the carbon mass balance: if humans add twice the amount of CO2 than is observed as increase in the atmosphere, nature is a net sink, not a source.
No matter how many others support your conclusions (BTW Dr. Spencer changed his mind on that topic), they are all wrong as their conclusion violates one or more observations…
Here the reality by plotting all variables as derivatives:
Dr. Spencer, thank you for this insight as to how Mauna Loa-measured CO2 variations may, or may not, reveal a “signature” of anthropogenic CO2 emissions.
Can you please comment on the following:
One of the criticisms I’ve heard in the past concerns locating NOAA’s laboratory near/on the peak of Mauna Loa which itself is a “dormant” volcano and is located near other volcanoes that may still be emitting gases, particularly CO2, that in turn may create bias/variability in the laboratory readings. Not only may Mauna Loa be venting considerable amounts of CO2, despite being considered “inactive”, the same can be said for Mauna Kea, which is located generally upwind of Mauna Loa, and for the active volcano area of Kilauea that is located in the foothills to the east of Mauna Loa (the geographical area identified as the “Hawaii Volcanoes National Park”).
The geography and prevailing trade winds are provided in the attached diagram, which in the source article has this underlying figure title:
“On the Island of Hawai`i, the trade winds (blue arrows) blow the vog from its main source on the volcano (white plume) to the southwest, where wind patterns send it up the island’s Kona coast. Here, it becomes trapped by daytime (onshore) and nighttime (offshore) sea breezes (double-headed arrows). In contrast, when light “Kona” winds (red arrows) blow, much of the vog is concentrated on the eastern side of the island. Image credit USGS”
(source: https://www.lovebigisland.com/weather/#:~:text=Trade%20winds%20over%20the%20Hawaiian,the%20air%20is%20lifted%20up.
N.B., the Oxford Languages definition for “vog” is:
“(chiefly in Hawaii) smog or haze containing volcanic dust and gases”.
The linked source provides the following additional statements:
“Trade winds over the Hawaiian islands blow from the East and Northeast between 250 and 300 days every year. . . . Once the trade winds reach the mountains (volcanoes) on the Hawaiian islands, the air is lifted up.”
So, my bottom line question: how does the NOAA observatory on Mauna Loa preclude their data from “being contaminated” by volcano-produced plumes of CO2 emissions from Mauna Loa, Mauna Kea, and Kilauea?
The following provides detail that should help answer your question about CO2 measurement at Mauna Loa. They actually take good care to avoid measurement contamination from local sources and sinks. https://gml.noaa.gov/ccgg/about/co2_measurements.html
Scissor,
I very carefully read (and performed searches for selected words, such as “vog”) in the NOAA website article that you linked. Not only did I find NOTHING that addressed my comments posted above, I instead find that the referenced webpage takes an alarmingly sophomoric position about local “contamination” of the air that the NOAA laboratory samples.
To wit, this statement:
“The observatory is surrounded by many miles of bare lava, without any vegetation or soil. This provides an opportunity to measure “background” air, also called “baseline”” air, which we define as having a CO2 mole fraction representative of an upwind fetch of hundreds of km. Nearby emission or removal of CO2 typically produces sharp fluctuations, in space and time, in mole fraction. These fluctuations get smoothed out with time and distance through turbulent mixing and wind shear. A distinguishing characteristic of background air is that CO2 changes only very gradually because the air has been mixed for days, without any significant additions or removals of CO2.”
The straight-line distance from the peak of Mauna Loa to the peak of Mauna Kea is about 43 km, according to Google Earth. Similarly, the straight-line distance from the peak of Mauna Loa to the most active volcanic area in Kilauea is about 52 km. Therefore, NOAA’s claim of sampling air “representative of an upwind fetch of hundreds of km” is falsified.
And, at a very conservative trade wind (or, alternatively, Kona wind) speed of 5 km/hour, it is easily seen that it would take less than 12 hours for CO2 emission from Mauna Kea or Kilauea to reach the peak at Mauna Loa, thus falsifying NOAA’s statement that “A distinguishing characteristic of background air is that CO2 changes only very gradually because the air has been mixed for days, without any significant additions or removals of CO2.”
I conclude that you must not have bothered to read fully—perhaps, more importantly, not understood—what was actually written at the weblink that you cited.
I think your confusion may relate to their definition of “background air.” By definition, it is air that is representative of an “upwind fetch of hundreds of km.”
Did you read their description of data selection criteria?
They are able to use meteorological data and temporal patterns to exclude measurement data that is influenced by local sources/sinks, i.e. air that does not meet their definition.
If you examine their measurement record, you will see that there are periods with data not reported because conditions do not favor or allow accurate “uncontaminated” measurements.
“They are able to use meteorological data and temporal patterns to exclude measurement data that is influenced by local sources/sinks, i.e. air that does not meet their definition.”
Hmmm . . . they (NOAA) don’t even admit the possibility that their “baseline” air could be contaminated (at least at the webpage link that you originally provided).
If what you claim is true is based on other publications, it smells an awful lot like cherry-picking data that is then to be used for calculations and publication.
Interesting.
On their site, they talk about local sources and sinks and the criteria they use to exclude these. They also point out the advantages of the location for measuring air that is representative of the “baseline.”
To me, their explanations and data selection criteria seem reasonable. I don’t have much doubt about the veracity of their measurements of CO2 in the atmosphere. There could be some concern about the program used for generation of calibration standards as it seems like Scripps is a single source supplier. But does it really matter that the accuracy of their measurements is good to 0.2 ppm or 1 ppm or even 10 ppm? (They claim 0.2 ppm now.)
Keeling founded the CO2 measurement programs and has addressed the issues. If you are interested at looking at this in greater detail, Scripps maintains a list of Keeling references, some more relevant than others.
https://scrippsco2.ucsd.edu/publications/scientific_literature.html
“But does it really matter that the accuracy of their measurements is good to 0.2 ppm or 1 ppm or even 10 ppm?”
Yes it does. As Dr. Spencer takes care to point out in his above article, it is critical to measure the rate of change in CO2 concentration (ppm/year) at resolutions/accuracies of about 0.1 ppm if one is looking for evidence of changes due to anthropogenic CO2 emissions. This is, correlating measured total CO2 changes against the calculated CO2 changes due to mankind’s use of fossil fuels, cement, etc. at year-over-year resolution (see the article’s Figure 2 and Figure 3)
Such would not be possible if the measurement accuracy was only ±1 ppm, let alone or ±10 ppm.
Gordon I have downloaded the raw hourly data of Mauna Loa and plotted both all available data and only the “selected” data. The only difference is that “all data” is more noisy (+/- 4 ppmv) than the “selected” data, but the average increase is exactly the same (within 0.1 ppmv) over a year. Even if there was a slight difference, the next year that difference is added or extracted from the increase over a new year…
Unfortunately that link doesn’t exist anymore.
Here for the 2008 data. Negative values are caused by upwind conditions in the afternoon which brings CO2 depleted air from the (green) valleys up to the observatory. These are labeled “U” and not used for daily and other averages.
CO2 is simply NOT a well mixed gas globally according to the satellites… single point measurements are useless
Nonsense…
About 20% of all CO2 in the atmosphere is exchanged with other reservoirs within the seasons back and forth.
And you call a 2% absolute change of CO2 between the North Pole and the South Pole not well mixed?
Look at the variability on the absolute scale…
Only in the first few hundred meters over land, nearby huge sources and sinks, there is a huge variability, but that represents only 5% of all CO2 in the atmosphere…
There is only a 6-months lag between sea level and 3000 m height and about 2 years between the NH and SH, due to the slow mixing rate over the ITCZ.
Other stations around the world show basically the same thing as Mauna Loa:
https://scrippsco2.ucsd.edu/graphics_gallery/other_stations/global_stations_co2_concentration_trends.html
OK, thank you for the reply, Dr. Spencer.
I was not aware that other sites claimed the same degree of measurement accuracy as the Mauna Loa observatory. I stand corrected . . . and will avoid further debate about CO2 measurement “contamination” there.
March 2022 took an anomalous dip like never before observed.
https://gml.noaa.gov/ccgg/trends/weekly.html
https://woodfortrees.org/plot/esrl-co2/derivative
Relevant question #1: Is the data valid?
I mean, is one month sufficient time to rule out instrumental/data reduction error(s)???
it’s a good question.
https://woodfortrees.org/graph/esrl-co2/derivative/from:2018
CO2 is NOT a well mixed gas globally as the satellites have proven … measuring it at one location in the middle of the Pacific next to a volcano is simply stupid ….
Check out the OCO-2 data.
It takes about a year for the atmosphere to fully mix. Pulses of 14CO2 from the northern hemisphere atomic bombs could be traced. The Chernobyl release in 1986 was fairly well traced. It all mixes with time.
Mmm, simply stupid didn’t even bother to Google it. How about the South Pole, or Tasmania, or Samoa or Barrow Alaska?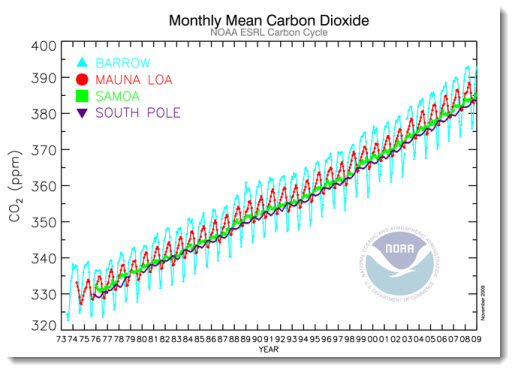
Or New Zealand

CO2 IS a very well mixed gas being measured in hundreds of places.
Loydo posted: “CO2 IS a very well mixed gas being measured in hundreds of places.”
Right . . . just not well-mixed between NH and SH over a less-than-annual timescale, according the first graph you present for Barrow (AK) & Mauna Loa data versus Samoa and the South Pole data, and similarly according to the second graph you present for Mauna Loa data versus Baring Head, NZ, data.
Now, about “simply stupid” . . .
Gordon,
Just plot it on full scale keeping in mind that about 20% of all CO2 in the atmosphere is seasonally exchanged back and forth with CO2 of other reservoirs…
It is well mixed in 95% of the atmosphere: all over the oceans and above 500 meters over land. Near ground over land you can measure any amount of CO2, depending of the time of the day and nearby forests (as is the case for rural Giessen, where the late Ernst Beck based his 1942 “peak” on), industry, traffic,… But that represents only 5% of all CO2 mass in the atmosphere…
For the bulk of the atmosphere it looks very well mixed to me…
My specific point was that, on a seasonal basis, the atmosphere is NOT well mixed between Earth’s northern hemisphere (NH) and its southern hemisphere (SH).
The seasonal variation that is apparent in the NH does not appear in the SH . . .the reason, as you yourself point out below is the mixing “barrier” resulting from the ITC, the interface between the northern and southern Hadley cells of major atmospheric circulation patterns.
The graphs posted above by Loydo provide sufficient resolution to make this obvious.
So, when on refers to “well mixed in 95% of the atmosphere: all over the oceans and above 500 meters over land” that is not really correct considering that 50% of the atmosphere exists in each N/S hemisphere but the NH has much more land surface area compared to water surface area (a ratio of 0.39:0.61) compared to the SH ratio of 0.19:0.81. The ratio of land area between hemispheres is therefore about 0.39/0.19 or about 200%.
Satellite measurements like those from OCO-2 show that CO2 is well-mixed with a horizontal and vertical range of only a few ppm.
Well mixed doesn’t mean that a huge release at one place on earth is measured instantly at 20,000 km away…
It only says that any change is rapidly mixed all over the atmosphere. In the case of CO2, there is a lag between surface and height (about 6 months) and between the NH and the SH (about 2 years), as the ITCZ allows only 10%/year mixing between the NH and SH atmospheres…
FFS! We should be attacking the United Nations IPCC day-in-day-out for the day-in-day-out disinformation they disseminate not arguing amongst ourselves.
We should be forcibly telling the public that the IPCC:
does not conduct any research, itself
chooses the literature that it includes to support the analysis of its assessments
is not a scientific body but a political body
knows the final report is not peer reviewed
The clue is in the IP of the IPCC – Intergovernmental Panel.
The IPCC is a political body not a scientific body.
The IPCC produces a report.
The IPCC lays out the chapters it wishes the report to contain. END OF!
Reviewers populate with their findings in those chapters.
Reviewers are not allowed to go without the scope of the IPCC designated chapters.
When the report is complete the SPM, Summary for Policymakers is produced.
The SPM is then butchered by all the nations on the planet to suit their agendas.
The final SPM “agreement” is then applied to the original analysis by the IPCC and changed to reflect the political findings.
The IPCC openly admits that this process is called “trickleback”
The IPCC report and the SPM is then published.
The media then goes mad and the governments go green.
Complete agreement on the IPCC. It should be terminated.
The same can be said of the UN, it’s a waste of money.
Ironically, much of the IPCC basic science, especially the first report, shows that there is no CO2 problem. It supports the sceptics.
The politics eventually killed the credibility of their reports.
The summary statements do not match the science.
The same is true today, the overwhelming weight of the current climate related science shows that there is no problem. Just read a sample of the papers.
The Global Warming issue is a politically driven media freak show.
None of the various regional climates on Earth have changed in the last century.
There is no reason to merge the various climates into a “global” climate.
If you have no objection, I’m going to steal your summation and send it to every UK politician that thinks that climate is something that needs to be “fought”.
I agree – a good summary of the toxic IPCC and the useless, harmful UN.
“This suggests at least some role for increasing surface temperatures causing increasing CO2, especially since if I turn the causation around (correlate dSST/dt with CO2), I get a very low correlation, 0.05.”
That is surprising – I’d be interested to know how the numbers are calculated. The formula for correlation coefficient, as given by Wiki, is
There is no directionality; it doesn’t matter whether you call one or the other variable x. The lag may make a difference, but lag 0 correlations should be exactly the same.
Answering my own question – I see that the second correlation differentiates SST rather than CO2 with respect ti time.
The lower correlation probably reflects greater noise in SST.
Please help?
i don’t understand something.
What happens if we extend Roy’s figure 2 back to 1850?
Eyeballing the figure suggests the pre 1920s would be very messy.
Are we to assume that natural CO2 went up and down but averaged to zero rate increase for 70 years.
sorry, I don’t understand, it just looks wrong
Waza, have a look at how much humans emitted since 1900 and what the CO2 levels were in the pre-Mauna Loa period were (from ice core measurements). The resolution of CO2 is worse (about 8 year averages at best), but on the other hand, it smooths out natural variability. Even so, it is clear that in the period 1900-1958 human emissions still were twice the increase in the atmosphere, thus even in that period, nature was a net sink in average…
The graph need some correction, as the start in 1900 is not at zero for both: 10 ppmv for the emissions and 5 ppmv for the increase in the atmosphere…
Until we understand short term natural climate variation, it is problematic to assign any warming to additional CO2 accumulation in the atmosphere. If it is simply ascribing correlation to causation, then that gets complicated to figure how cooling over certain time periods translates when increasing CO2 levels were accumulating. Clearly, that must mean that natural variation swamps any warming (or cooling) from any increase in atmospheric CO2.
Anyway, the first 50 ppmv retards the majority of ‘heat’ escaping the good Earth as regards to GHGe, so adding more CO2 when we are already at 412 ppmv is sort of a moot point, also given that water vapor retards in the same wavelength at ~15 μm. More CO2 at this point only assists in greening the planet. That probably has more effect than than any radiative properties of CO2 itself. And a positive effect.
Future generations are going to wonder why the all the fuss to get to Net Zero, when it is only a bit player in the climate in the scheme of things. Doubling something next to zero, is still next to zero. And we are a long way of even doubling the residual CO2 in the atmosphere which is now just 4 parts in 10,000. We maybe increased it 1 part in 10,000 in 200 years.
They should start on fixing the X Y-axis on the CO2 chart, as is the same fraud that Mann and Gore did to promote this sham science.
Many of the readers of this blog clearly do not believe this.
Roy
Many thanks for this explanation.
But if you want to explain modern warming you have to come up with an explanation as to why the SST of the oceans have gone up exactly as has been measured,
see Table 2 (you can click on the blue numbers to see the original reports as to where the figures came from)
https://breadonthewater.co.za/2022/03/08/who-or-what-turned-up-the-heat/
If that explanation is different to the one I offered, I would sure like to hear about.
CO2 is a well-mixed gas in the long term, but in the short term it isn’t, so I think the use of annual change from a single geographic location makes this kind of analysis suspect.
There is no reason to ignore the isotopic fingerprint of anthropogenic CO2.
Tom.1,
Interesting statement.
Andy May points out in his recent book,”The Great Climate Change Debate”,
“HadCRUT5 shows the Northern Hemisphere warming 0.28C per decade and the Southern Hemisphere warming at only 0.11 C per decade.”
The Northern Hemisphere has warmed much faster than the Southern Hemisphere in recent years by a factor of 2.5.
As Andy muses,
”This difference is possible but suggests that the cause of the warming in the Northern Hemisphere is not the same as the cause in the South, as the IPCC claims.
If CO2 were the cause, and it is evenly distributed globally, how could the warming rates be so different?”
Herbert
I take it you saw the results in my Table 2?
Globally, the difference in CO2 concentration is very small, so it’s warming effect from that standpoint should be more uniform globally. However, the geography of the northern hemisphere and the southern hemisphere is quite different, so I suppose that may account for some of the difference. I’m not prepared to say or even able to say, but I think the fact the “global warming” is not more uniform is a weakness in the theory that all of the warming is caused by anthropogenic greenhouse gases.
There is more land in the NH than the SH.
bdgwx
so what has that got to do with anything?
Due to the Gas Law the CO2 concentration increases at the same rate both in the NH and the SH.
Land is warming more than oceans.
yes. why?
Land has a lower specific heat capacity and smaller latent and sensible fluxes to/from the atmosphere which creates the transient divergence. What is not well understood is how this difference will behave in the future as the climate system equilibrates. Will the difference remain or will it pull back in some?
If we r talking abt retardation of heat transmission to space by gh gasses that argument does not hold water.
There is a relationship between more greening and more heat being trapped on earth. I explain ths towards the end of my report. Click on my name.
Yes, that is what “anomalies” are supposed to capture. Maybe something wrong with that assumptions.
We’re only discussing why land warms faster than ocean here. The reason is invariant of the cause of the warming. Any warming regardless of cause would create the divergence in the trends.
Latent heat causing evaporation is the answer. Latent heat is absorbed energy but is unmeasurable with thermometers. It is as simple as that.
All the analyses I have seen for the “isotopic fingerprint” are incomplete. In essence, the analyses are cherry picking.
Clyde explain that further…
Why does it appear to me that the lead graphs show a trail off/decline in co2 starting around the point the planet started getting colder several years ago (several years prior to “covid”)?
Isn’t the influence of El Niño and la Niña evident?
https://woodfortrees.org/plot/esrl-co2/derivative/from:2015
Yes, absolutely. I think it is best viewed in the Mauna Loa monthly data, where it is evident that there is a short “pause” in CO2 growth rate at some point during the Jan/Feb/March period for most years. Generally, it is seen as a noticeable reduction in growth rate, though still positive, but sometimes it is significant enough to show up as a drop in atmospheric concentration for that month from the previous one. Another example is March 2011, again correlating with a La Niña.
Where El Niño is involved, the “pause” is minor or even non-existent (see 1997-98, for example). This variation in growth rate then fits with the overall annual growth rate changes which are well-known to reflect ENSO.
My suspicion is that in some years it gets cold enough to shut down the biological decomposition in the Tundra, and possibly inhibits Boreal forest respiration.
My post answers that question.
Strong temperature drop across the western US.