Meandering Through A Climate Muddle

Guest Post By Willis Eschenbach

One reason that I’m always hesitant to speculate on other peoples’ motives is that half the time I have no clue about my own motives.

So … for the usual unknown reasons and with the usual unknown motives, I got to thinking about the GISS climate model known as the “GISS GCM ModelE”, or as I call it, the “MuddleE”.

Like many such climate muddles, it was not designed before construction started. Instead, it has grown over decades by accretion, with new parts added, kluges to fix problems, ad-hoc changes to solve new issues, and the like. Or to quote one of the main GISS programmers, Gavin Schmidt, in a paper describing the ModelE:

The development of a GCM is a continual process of minor additions and corrections combined with the occasional wholesale replacement of particular pieces.

For an additional difficulty factor, as with many such programs, it’s written in the computer language FORTRAN … which was an excellent choice in 1983 when the MuddleE was born but is a horrible language for 2022.

How much has it grown? Well, not counting header files and include files and such, just the FORTRAN code itself, it has 441,668 lines of code … and it can only run on a supercomputer like this one.

The Cray ecoplex NOAA GAEA supercomputer used for modeling. Gaea was funded by a $73 million American Reinvestment and Recovery Act of 2009 investment through a collaborative partnership between NOAA and the Department of Energy.

So I thought I’d wander through the GISS model and see what I could find. I knew, from a cruise that I’d taken through the MuddleE code two decades ago, that they’d had trouble with “melt pools”. These are the pools of meltwater that form on top of the seasonal sea ice. They are important in calculating the albedo of the sea ice. In my previous cruise, I’d found that they’d put a hard time limit on the days during which melt pools could form.

This leads me to a most important topic—the amazing stability of the climate system. It turns out that modern climate muddles have a hard time staying on course. They are “iterative” models, meaning that the output of one timestep is used as the input for the next timestep. And that means that any error in the output of timestep “J” is carried over as an error in the input into timestep “K”, and on ad infinitum … which makes it very easy for the muddle to spiral into a snowball earth or go up in flames. Here, for example, are a couple of thousand runs from a climate model …

Figure 1. 2,017 runs from the climateprediction.net climate model.

Notice in the upper panel how many runs fall out the bottom during the control phase of the model runs … and that has never happened with the real earth.

So I wrote up a computer program that searches through the 511 individual files containing the 441,688 lines of computer code for keywords and word combinations and the like, and when it finds a match it lists the file number and the line number where the keyword appears, and prints out the line in question and the surrounding lines, so I can investigate what it’s found.

To avoid the climate model losing the plot and wandering away from reality, as a programmer you have two choices. You can either fix what’s wrong with the model that’s making it go off the rails … or you can do what the MuddleE programmers did with the melt ponds. You can simply put a hard limit, basically an adjustable guardrail, that prevents the muddle from jumping the shark.

It appears that they’ve improved the melt pond code because I can no longer find the hard limit on the days the melt ponds can form. Instead, they’ve put in the following code:


C**** parameters used for Schramm sea ice albedo scheme (Hansen)                       
 !@var AOImin,AOImax           range for seaice albedo                       
 !@var ASNwet,ASNdry           wet,dry snow albedo over sea ice              
 !@var AMPmin                  mininimal melt pond albedo                
       REAL*8 ::                                                             
 C                         VIS   NIR1   NIR2   NIR3   NIR4   NIR5            
      *     AOImin(6)=(/ .05d0, .05d0, .05d0, .050d0, .05d0, .03d0/),        
      *     AOImax(6)=(/ .62d0, .42d0, .30d0, .120d0, .05d0, .03d0/),        
      *     ASNwet(6)=(/ .85d0, .75d0, .50d0, .175d0, .03d0, .01d0/),              *     ASNdry(6)=(/ .90d0, .85d0, .65d0, .450d0, .10d0, .10d0/),                  *     AMPmin(6)=(/ .10d0, .05d0, .05d0, .050d0, .05d0, .03d0/)

What this code does is to put up hard limits on the values for the albedo for sea ice and melt ponds, as well as specifying constant values for wet and dry snow on the sea ice. It specifies the limits and values for visible light (VIS), as well as for five bands of the near infrared (NIR1-5).

What this means is that there is code to calculate the albedo of the sea ice … but sometimes that code comes up with unrealistic values. But rather than figure out why the code is coming up with bad values and fixing it, the climate muddle just replaces the bad value with the corresponding maximum or minimum values. Science at its finest.

Here’s a comment describing another bit of melt pond fun:


 C**** safety valve to ensure that melt ponds eventually disappear (Ti<-10)
         if (Ti1 .lt.-10.) pond_melt(i,j)=0.  ! refreeze  

Without this bit of code, some of the melt ponds might never refreeze, no matter how cold it got … gotta love that kind of physics, water that doesn’t freeze.

This is what the climate modelers mean when they say that their model is “physics-based“. They mean it in the same sense as when the producers say a Hollywood movie is “based on a true story”

Here, for example, is a great comment from the MuddleE code (the “c” or the “!” in a line indicates a comment):


 !@sum tcheck checks for reasonable temperatures                         
 !@auth  Ye Cheng/G. Hartke                                              
 !@ver   1.0                                                             
 c ----------------------------------------------------------------------
 c  This routine makes sure that the temperature remains within           
 c  reasonable bounds during the initialization process. (Sometimes the  
 c  the computed temperature iterated out in left field someplace,       
 c  *way* outside any reasonable range.) This routine keeps the temp     
 c  between the maximum and minimum of the boundary temperatures.        
 c ----------------------------------------------------------------------

In other words, when the temperature goes off the rails … don’t investigate why and fix it. Just set it to a reasonable temperature and keep rolling.

And what is a reasonable temperature? Turns out they just set it to the temperature of the previous timestep and keep on keeping on … physics, you know.

Here’s another:


c  ucheck makes sure that the winds remain within reasonable         
c    bounds during the initialization process. (Sometimes the computed
c    wind speed iterated out in left field someplace, *way* outside
c    any reasonable range.) Tests and corrects both direction and     
c    magnitude of the wind rotation with altitude. Tests the total    
c    wind speed via comparison to similarity theory. Note that it     
c    works from the top down so that it can assume that at level (i), 
c    level (i+1) displays reasonable behavior.

… when the climate muddle goes off the rails, and the wind is blowing five hundred miles per hour, don’t look for the reason why. Just prop it up, put it back on the rails, and keep going …

Then we have a different class of non-physics. These are tunable parameters. Here’s a description from Gavin Schmidt’s paper linked to above:

The model is tuned (using the threshold relative humidity U00 for the initiation of ice and water clouds) to be in global radiative balance (i.e., net radiation at TOA within ±0.5 W m−2 of zero) and a reasonable planetary albedo (between 29% and 31%) for the control run simulations.

In other words, the physics simulated in the climate muddle won’t keep the modelworld in balance. So you simply turn the tuning knob and presto! It all works fine! In fact, that U00 tuning knob worked so well that they put in two more tuning knobs … plus another hard limit. From the code:


 !@dbparam U00a tuning knob for U00 above 850 mb without moist convection     
 !@dbparam U00b tuning knob for U00 below 850 mb and in convective regions    
 !@dbparam MAXCTOP max cloud top pressure

Finally, all models are subjected to what I call “evolutionary tuning”. That is the process whereby a change is made, and then the model is tested against the only thing we have to test it against—the historical record. If the model is better able to replicate the historical record, then the change is kept. But if the change makes it work worse at hindcasting the past, it’s thrown out.

Unfortunately, as the stock brokers’ ads in the US are required by law to say, “Past performance is no guarantee of future success”. The fact that a climate model can hindcast the past means absolutely nothing about whether it can successfully predict the future. And this is particularly true when the model is propped up and kept from falling over by hard limits and tunable parameters, and then evolutionarily tuned to hindcast the past …

What else is going on? Well, as in many such ad-hoc projects, they’ve ended up with a single variable name representing two different things in different parts of the program … which may or may not be a problem, but is a dangerous programming practice that can lead to unseen bugs. (Note that FORTRAN is not “case sensitive”, so “ss” is the same variable as “SS”.) Here are some of the duplicate variable names.


SUBR	identifies after which subroutine WATER was called
SUBR	identifies where CHECK was called from
SUBR	identifies where CHECK3 was called from
SUBR	identifies where CHECK4 was called from

ss = photodissociation coefficient, indicies
SS = SIN(lat)*SIN(dec)

ns = either 1 or 2 from reactn sub
ns = either ns or 2 from guide sub i2 newfam ifam dummy variables

nn = either nn or ks from reactn sub
nn = either nn or nnn from guide sub
nn = name of species that reacts, as defined in the MOLEC file.

ndr = either ndr or npr from guide sub
ndr = either nds or ndnr from reactn sub

Mo = lower mass bound for first size bin (kg)
Mo = total mass of condensed OA at equilibrium (ug m-3)

ks = local variable to be passed back to jplrts nnr or nn array.
ks = name of species that photolyses, as defined in the MOLEC file.

i,j = dummy loop variables
I,J = GCM grid box horizontal position

Finally, there’s the question of conservation of energy and mass. Here’s one way it’s handled …


C**** This fix adjusts thermal energy to conserve total energy TE=KE+PE 
       finalTotalEnergy = getTotalEnergy()                               
       call addEnergyAsDiffuseHeat(finalTotalEnergy - initialTotalEnergy)

Curiously, the subroutine “addEnergyAsDiffuseHeat” is defined twice in different parts of the program … but I digress. When energy is not conserved, what it does is simply either add or subtract the difference equally all over the globe.

Now, some kind of subroutine like this is necessary because computers are only accurate to a certain number of decimals. So “rounding errors” are inevitable. And their method is not an unreasonable one for dealing with this unavoidable error.

However, twenty years ago I asked Gavin Schmidt if he had some kind of “Murphy Gauge” on this subroutine to stop the program if the energy imbalance was larger than some threshold. In the real world, a “Murphy Swichgauge” is a gauge that will give an alarm if some user-set value is exceeded. Here’s what one looks like

Without such a gauge, the model could be either gaining or losing a large amount of energy without anyone noticing.

Gavin said no, he didn’t have any alarm to stop the program if the energy imbalance was too large. So I asked him how large the imbalance usually was. He said he didn’t know.

So in this cruise through the code 20 years later, once again I looked for such a “Murphy Gauge” … but I couldn’t find one. I’ve searched the subroutine “addEnergyAsDiffuseHeat” and the surrounds, as well as looking for all kinds of keywords like “energy”, “kinetic”, “potential”, “thermal”, as well as for the FORTRAN instruction “STOP” which stops the run, and “STOP_MODEL” which is their subroutine to stop the model run based on certain conditions and print out a diagnostic error message.

In the ModelE there are 846 calls to “STOP_MODEL” for all kinds of things—lakes without water, problems with files, “mass diagnostic error”, “pressure diagnostic error”, solar zenith angle not in the range [0.0 to 1.0], infinite loops, ocean variables out of bounds, one STOP_MODEL that actually prints out “Please double-check something or another.”, and my personal favorites, “negative cloud cover” and “negative snow depth”. Hate it when those happen …

And this is all a very good thing. These are Murphy Gauges, designed to stop the model when it goes off of the rails. They are an important and necessary part of any such model.

But I couldn’t find any Murphy Gauge for the subroutine that takes excess or insufficient energy and sprinkles it evenly around the planet. Now, to be fair, there are 441,668 lines of code, and it’s very poorly commented … so it might be there, but I sure couldn’t track it down.

So … what is the conclusion from all of this?

Let me start with my bona fides. I wrote my first computer program over a half-century ago, and have written uncountable programs since. On my computer right now, I have over 2,000 programs I wrote in the computer language R, with a total of over 230,000 lines of code. I’ve forgotten more computer languages than I speak, but I am (or at one time was) fluent in C/C++, Hypertalk, Mathematica (3 languages), VectorScript, Basic, Algol, VBA, Pascal, FORTRAN, COBOL, Lisp, LOGO, Datacom, and R. I’ve done all of the computer analysis for the ~1,000 posts that I’ve written for WUWT. I’ve written programs to do everything from testing blackjack systems, to providing the CAD/CAM files for cutting the parts for three 80′ fishing steel boats, to a bidding system for complete house construction, to creating the patterns for cutting and assembling a 15-meter catenary tent, to … well, the program that I wrote today to search for keywords in the code for the GISS ModelE climate model.

So regarding programming, I know whereof I speak.

Next, regarding models. On my planet, I distinguish between two kinds of models. These are single-pass models and iterative models. Single-pass models take a variety of inputs, perform some operations on them, and produce some outputs.

Iterative models, on the other hand, take a variety of inputs, perform some operations on them, and produce some outputs … but unlike single-pass models, those outputs are then used as inputs, which the model performs operations on, and the process is repeated over and over to give a final answer.

There are a couple of very large challenges with iterative models. First, as I discussed above, they’re generally sensitive and touchy as can be. This is because any error in the output becomes an error in the input. This makes them unstable. And as mentioned above, two ways to fix that—correct the code, or include guardrails to keep it from going off the rails. The right way is to correct the code … which leads us to the second challenge.

The second challenge is that iterative models are very opaque. Weather models and climate models are iterative models. Climate models typically run on a half-hour timestep. This means that if a climate model predicting say 50 years into the future, the computer will undergo 48 steps per day times 365 days per year times 50 years, or 876,000 iterations. And if it comes out with an answer that makes no sense … how can we find out where it went off the rails?

Please be clear that I’m not picking on the GISS model. These same issues, to a greater or lesser degree, exist within all large complex iterative models. I’m simply pointing out that these are NOT “physics-based”—they are propped up and fenced in to keep them from crashing.

In conclusion, a half-century of programming and decades of studying the climate have taught me a few things:

• All a computer model can do is make visible and glorify the under- and more importantly the misunder-standings of the programmers. Period. If you write a model under the belief that CO2 controls the temperature … guess what you’ll get?

• As Alfred Korzybski famously said, “The map is not the territory”. He used the phrase to poetically express that people often confuse models of reality with reality itself. Climate modelers have this problem in spades, far too often discussing their model results as if they were real-world facts.

• The climate is far and away the most complex system we’ve ever tried to model. It contains at least six subsystems—atmosphere, biosphere, hydrosphere, lithosphere, cryosphere, and electrosphere. All of these have internal reactions, forces, resonances, and cycles, and they all interact with all of the others. The system is subject to variable forces from both within and without the system. Willis’s First Rule of Climate says “In the climate, everything is connected to everything else … which in turn is connected to everything else … except when it isn’t.”

• We’ve only just started to try to model the climate.

• Iterative models are not to be trusted. Ever. Yes, modern airplanes are designed using iterative models … but the designers still use wind tunnels to test the results of the models. Unfortunately, we have nothing that corresponds to a “wind tunnel” for the climate.

• The first rule of buggy computer code is, when you squash one bug, you probably create two others.

• Complexity ≠ Reliability. Often a simpler model will give better answers than a complex model.

Bottom line? The current crop of computer climate models are far from being fit to be used to decide public policy. To verify this you only need to look at the endless string of bad, failed, crashed-and-burned predictions that have come from the models. Pay them no attention. They are not “physics-based” except in the Hollywood sense, and they are far from ready for prime time. Their main use is to add false legitimacy to the unrealistic fears of the programmers.

And there you have it, a complete tour of a climate muddle.


Here in the redwood forest, it’s my birthday.

I’m three-quarters of a century old. And I’ll take this opportunity to thank all of my friends both in real life and on the web for two things.

The first is the endless support that I’ve gotten for my life, my writings, and my research. Everything of value in my life I’ve learned from family and friends. I owe profound thanks to the encouragement and support of people like Anthony Watts, Steve McIntyre, Roy Spencer, William Gray, Charles the Moderator, Viscount Ridley, Bishop Hill, Judith Curry, of course my gorgeous ex-fiancee, and many others for all that you have done. No way to mention everyone individually, but you know who you are, and you have my thanks.

The second thing I’m thankful for is the endless checking and public peer-review of my work. I love writing for WUWT because I know that a) whatever I write about, someone out there has done it for a living and knows more than I do about it, and b) whatever mistakes I make won’t last longer than a couple of hours without people pointing them out. This has been immensely useful to me because it has kept me from following false trails and wasting weeks or years going down blind alleys based on mistaken beliefs. Keep up the good work!

So what does a man do at 75? Well, after doing absolutely nothing today, tomorrow I’m going back to climbing 20 feet (6m) up a ladder to pressure-wash shingles with my new pressure washer … hey, do I know how to party or what?

My very best to all,

w.

Again I Ask: When commenting, please quote the exact words you’re responding to. And if you’re commenting on something not on the thread, provide a link. It avoids endless misunderstandings.

4.9 58 votes
Article Rating
262 Comments
Oldest
Newest Most Voted
Inline Feedbacks
View all comments
ResourceGuy
February 18, 2022 10:15 am

A Murphy Gauge might shut off funding. You can’t have that.

Reply to  ResourceGuy
February 18, 2022 11:46 am

The aim of green scientists is to be sustainable. Therefore the output of the model must generate enough resources to sustain modelling.
The resource academia needs is money.

To correctly assess climate models against their aim you don’t need to survey the code. You need to survey the funding.

LARRY K SIDERS
Reply to  ResourceGuy
February 19, 2022 8:13 am

Climate funding isn’t dependent on the Models working reliably time after time….they just have to give the “correct answer” ONCE for each set of “runs”. And the result has to be at least a little more alarming on each successive run.

I wish this were satire.

Tom Halla
February 18, 2022 10:18 am

Happy birthday, Willis.

Rob_Dawg
February 18, 2022 10:23 am

Happy Birthday! Here’s to another three quarters of a Century.

I would never trust an iterative model that didn’t eventually blow up.

Dr. Jimmy Vigo
Reply to  Rob_Dawg
February 18, 2022 4:33 pm

I’m a PhD scientist doing generic drugs. This sounds like adjusting data to achieve the outcome that you want, AKA pseudoscience. The reason why they do this is because they are not regulated like we do by FDA. We have the risk of getting audited and figured out fixing numbers of safety, purity. If I cook my numbers, someone could die, I could lose my company, my job, get heavily-fined and even get arrested. What a difference!

Thomas
Reply to  Dr. Jimmy Vigo
February 19, 2022 7:47 am

Faulty climate models can also cause death.

Vuk
February 18, 2022 10:42 am

As I recall two of us were born just over 175 miles distance apart, but alas in different year, regretfully (or not) country of our birth has disappeared from the world maps, which is a bit of a problem when filling all kind of forms, have a Happy Birthday.

Not that you need my advice, but if your property has a good water supply consider installing a sprinkler system all around along the fence.

ResourceGuy
February 18, 2022 10:46 am

It makes you wonder where we would be today if Einstein and fellow physicists delving into quantum mechanics and relativity had similar online rapid feedback and error checking of papers and equations.

Vuk
Reply to  ResourceGuy
February 18, 2022 11:16 am

Einstein wasn’t very good at maths, he relied on his student days friends, his first wife Mileva Maric, and well known mathematician Marcel Grossmann, but even he couldn’t solve some of  Einstein’s field equations before his paper went into publication.
Solution was found soon after publication by Karl Schwarzschild, another less known German. For those really keen to know (not that I have any idea how to get there) here is the solution:  
comment image
 

Ron Long
Reply to  Vuk
February 18, 2022 12:30 pm

Everything was visual with Einstein. He had visual reference memory (not photographic, but videos with sound) and his brain switched back and forth from left to right hemispheres visualizing and analyzing. His brain still holds the record for most cross-connections between hemispheres.

Vuk
Reply to  Ron Long
February 18, 2022 12:46 pm

Same with Nikola Tesla.
Tesla developed the ability to visualise his work in great detail and that allowed him to save vast amounts of time, money and effort in designing, testing and building his machines. He cultivated his ability to visualise complex rotating machinery, electric currents, magnetic fields and astoundingly, how all these things interact together – before he touched a piece of machinery!”

atticman
February 18, 2022 10:48 am

Is pressure-washing shingles up a 20 foot ladder the sort of thing a 75-year-old should be doing? We can’t afford to lose you, Willis! Come to that, is pressure-washing shingles a good idea, period? Much greater force than rainfall… Happy Birthday!

Reply to  atticman
February 18, 2022 12:00 pm

Very good advice atticman – for the shingles also.

Now I will venture wildly Off Topic – apart from the one concerning property (and Willis) preservation techniques…

In all my time looking after myriad wooden constructions around the family farm, I have never had the urge to pressure wash anything.

My first thought was in the example of the farm Quad Bike (ATV) or my petrol powered pony.

Several of my neighbours liked to regularly pressure wash their bikes but I couldn’t the point – within minutes of venturing out on the thing, in Cumbria, it was right back where you started. Muddy.
I mentioned this to a farm machinery salesman who sold ATVs to farmers and his advice was:
Do Not Ever Pressure wash the thing. Except if you’re trying to sell it

Reason being that the high power water jet pushes dirt, grit, soil, mud etc into all sorts of places it should not get = drive joints, wheels bearings, brakes drums, suspension bushes etc etc and very effectively trashes your bike

That was my thinking regards the shingles – you are going to be forcing water and whatever grot into places it should not go
So I did ‘search’ and first thing I found confirmed the suspicion..
https://www.customshingles.com/blog/why-you-should-not-power-wash-a-cedar-roof

Previously yo mentioned ‘FireStop’
If you’ve not already bought the stuff – don’t.
If you have but not opened the containers, take it back.

As best I can understand it is little more than highly diluted PVA adhesive and/or being as they say a ‘water based polymer’ is no more than emulsion paint.

If the shingles are mossy and mouldering, that probably will be an effective fire-stop in its own right. That moss is there because it has found moisture within the wood and is always working to collect ever more.
THAT is your fire-stop.

But but but, the moss is destroying the wood and, frankly, just like cement roof tiles here in the UK, when they grow moss they are finished. Replace them.
Not least, that damp is getting into the fabric of your house and certainly will be setting off (black) mould in whatever the shingles are fixed to.

Equally worse, moss is dirty stuff, it will be constantly showering down a mini blizzard of spores, dust and all sorts of shyte that has nothing better to do than set off some hideous respiratory complaint in the residents of the house
And it is generally ‘dirty’ stuff when it gets inside.

(Many folks in the UK imagine that a house with a mossy roof is somehow ‘romantic’ and countrified. They could not be more wrong and if/when it sets of Asthma in their children…….sigh)

If the shingles are still fairly strong, do as the link suggests, clean them with some bleach – applied at very low pressure or via a brush.
Maybe some Copper Sulphate solution painted on afterwards to slow down its return.
But It Will Return

As regards fire prevention, save the pressure washer for when a fire does approach – soak the wood before the flames get near.
Also, take a leaf out of Climate Science and increase the Albedo of the shingles – get them to reflect the heat of the approaching fire.
Win win win, the bleach will have that effect – it will ‘whiten’ the wood.

If household bleach doesn’t do much, go nuclear = get some Sodium Hydroxide
That really will take down the moss, lichen, spores, dirt, grot with lasting effect and will thoroughly bleach the wood – leaving it with a pretty high Albedo

(It takes down all forms of biologic things – be careful with it)

After all that and in conjunction with what the shingles link said – I’ve sussed out the FireStop and how it might help.

What that stuff is doing is gluing down the very fine fibres on the surface of the wood- it is they that burn easiest and let the fire take hold.

So there you are. Home made firestop process=

  • No pressure washing
  • Paint on household bleach or maybe Caustic Soda
  • Just let it dry, do not wash off the caustic
  • Maybe run a sander over the wood to get rid the tiny surface fibres but DO wash the wood first in this case
  • (A propane gas torch would work a treat to burn off the fine fibres = no sander)
  • Maybe after that, mix some Copper Sulphate in some well diluted PVA glue and paint that on

Have fun Willis, and lots more birthdays
(I was never ‘good with ladders’ I get dizzy going beyond the 2nd rung usually)

Dudley Horscroft
Reply to  Peta of Newark
February 19, 2022 12:08 am

You might also wish to think about using paint. This will not stop fire, but if you use a brand called “Aluminium” or “Silverine” it will reflect the heat of the fire and reduce the increase of temperature of the shingles. Remember the episode of those two ‘special effects’ men who parked two identical cars in full sunshine and recorded the internal temperature. The only difference was that one was white and the other black. And generally the white car had an internal temperature 10 degrees (presumably F) less than in the white car.

I have suggested in the past that since book paper, and most other carbon fibre materials self ignite at 451F or around that figure (remember Ray Bradbury), the best way to protect your house is to add portable panels of aluminium foil (kitchen foil) stretched over a wooden framework to cover the exterior windows. These should reflect much of the radiant energy from a fire front (reputedly up to 2000F) and stop the transmission of this radiant energy into the house, where it can set many things on fire.

Keep on going, Willis, and you will eventually realise that there are many on this site and elsewhere who appreciate your thought.

Rob_Dawg
Reply to  atticman
February 18, 2022 12:01 pm

We had to limit my grandmother to no higher than two stories on a ladder at 83. She reluctantly agreed.

Alexy Scherbakoff
Reply to  Willis Eschenbach
February 18, 2022 2:49 pm

You only stop doing stuff when you can’t. Happy Birthday.

Reply to  Rob_Dawg
February 18, 2022 1:39 pm

My 76 year old mother used to climb the ladder to get on her roof to clean the rain gutters. I dropped over one day and found her on top and chastised her. “Phone me before you do so someone will know.” I knew better than to tell her not to go.

The next year I got a call. “I’m on the roof so you’ll know” she said. Thanks mom.

A few minutes later it occurred to me that she only had a dial telephone, not a remote. So I headed over there and sure enough, she was on the roof with her dial telephone with a newly added 50 ft. extension cord.

Nels
February 18, 2022 10:54 am

Once upon a time, I had the pleasure of working on a model for estimating electric generation costs for a network of generating plants. One part summed up a long list of small numbers in single precision Fortran. Even in double precision, the list was long enough, and the values small enough, that a good part of the list got ignored once the sum got big enough. The model ran rough, in that small changes in the input made big changes in the output. I’m guessing similar things happen in this code.

Erik Magnuson
Reply to  Nels
February 18, 2022 1:26 pm

Classic numerical analysis issue, a better way to do the addition would be adding two numbers at a time and storing the sums, then add two sums at a time to get a second set of suns and repeat the process until getting down to a single sum of the total. Note that the algorithm would need a slight tweak to handle other than a power of two quantity of numbers. The numerical analysis issue is not limited to Fortran, which is still a reasonable programming language.

I would not be surprised if the various GCM’s had problems with similar numerical analysis oopsies.

D. J. Hawkins
Reply to  Erik Magnuson
February 18, 2022 2:44 pm

My FORTRAN skills are more than 4 decades fallow, but I don’t see how this pair-wise summation improves things. What am I missing?

Ed Bo
Reply to  D. J. Hawkins
February 18, 2022 5:40 pm

With floating-point numbers (basically scientific notation in binary format), when you add two numbers of different magnitudes, it has to shift the mantissa of the smaller number until the exponent matches the larger number. This can cause the loss of a lot of precision in the smaller number.

To use a decimal example to illustrate, with 4-digit “mantissas”:

(1.234 x 10^6) + (5.678 x 10^3) =

(1.234 x 10^6) + (0.006 x 10^6) = 1.240 x 10^6

You can see that almost all the precision of the smaller number is lost.

Erik’s technique makes it more likely that numbers of similar magnitude are added together.

Ed Bo
Reply to  Willis Eschenbach
February 19, 2022 1:47 pm

Hi Willis! If you have a long enough mantissa, you can do a lot more before you get into trouble.

I was illustrating the point with a very limited mantissa – 4 decimal digits only (equivalent to ~14 bits) to show the principle of how you can lose precision. Standard IEEE-754 single-precision floats have a 24-bit mantissa, and double-precision floats have a 52-bit mantissa. I suspect R is using quadruple-precision.

Erik Magnuson
Reply to  D. J. Hawkins
February 18, 2022 5:55 pm

If you are doing integer arithmetic, pair-wise summation will not make any difference other than taking up more CPU time.

With floating point arithmetic, adding a small number to a large number results in a loss of precision in the smaller number. With a sufficiently large difference in magnitude, the process of addition will result in a complete loss of information from the smaller number because the smaller number was less than the difference in magnitude of the change of the LSB of the larger number. By doing pair wise summation, chances are that the two numbers in each pair will be reasonably close to the same magnitude and thus less information will be lost compared to an infinite precision sum.

UCB Prof Kahan had a paper about the difference in accuracy for calculating beam deflection with the 8087’s 80 bit floating point arithmetic versus the IEEE 64 bit floating point arithmetic showing significant improvements with 80 bits over 64 bits. I would contend a re-factoring of the problem would have greatly improved the 64 bit result.

D. J. Hawkins
Reply to  D. J. Hawkins
February 22, 2022 12:36 pm

Many thanks to those who took the time to walk me through the thought process.

MarkW
Reply to  Erik Magnuson
February 18, 2022 5:25 pm

By definition, computers always add two numbers at a time and store the result. There is no other way to do it.

Dudley Horscroft
Reply to  MarkW
February 19, 2022 12:11 am

Remember that 2+ 2 = 5, if you allow rounding.

Reply to  Erik Magnuson
February 19, 2022 11:29 am

It would make more sense to sort the numbers from smallest to largest, and add them up that way to preserve the precision as much as possible, instead of relying on random chance that pairs of numbers will be of equal/close magnitude.

Not sure if this helps the climate models, or even the thermohydraulic models like CATHENA used to characterize nuclear reactors, because one is not summing a table of numbers but doing quasi interpolation, calculating the value of a cell (position in space at a point in time) based on a calculation that takes into account the values in the other cells around it – which will probably be of the same magnitude.

That said, it’s always good to look out for the problem you mentioned and other kinds of numerical analysis issues when designing any model, definitely.

Ed Zuiderwijk
February 18, 2022 10:55 am

Back in the nineties, thirty years ago, I was at a presentation about such models. So, being a physicist, I asked a simple question about (early) atmosphere-ocean coupled models they were working on: how do you treat the exchange of energy between water and atmosphere? The anwer was reavealing: it’s rather difficult so we have some heuristic approach with a few adjustable parameters. Any experiments in the real world to test the validity of that approach? Eh, no, not yet.

If it wasn’t so sad it would have been funny. I’m sure it is not much better now, thirty years later. The more I know about those models, the more I realise that if aircaft had been designed using that level of dillentantism, I would not set a foot in an airplane. Climate models model a sardonic universe designed by clowns.

Curious George
Reply to  Ed Zuiderwijk
February 18, 2022 11:28 am

Setting aside the question “how fast does the sea water evaporate?” (a difficult one, depends on the water temperature, the air temperature, the wind speed, the waves, and probably many other things): even if they somehow divine how much water evaporates, they still don’t get the latent heat correct. They disregard the temperature dependence of the latent heat of vaporization. Maybe not all models, but the CESM model for sure – and it does not stand out in the CMIP6 model assembly. The error in energy transfer is 3% for tropical seas. The error of 3% in a global temperature 300 degrees Kelvin is 9 degrees C, or 16 degrees Fahrenheit.

Reply to  Curious George
February 18, 2022 11:59 am

While living on a boat my father did some research into this. He found that ripples were very important. They make tubes of air surrounded on three sides by water. This high water surface to air volume ratio leads to increased water vapour content in the air along the ripple.

And when the ripple breaks due to disruption
9waves, impacts… other things) that high water vapour tube is no long surrounded on three sides by water. And so is less likely to exchange the water vapour back into the liquid.

Now ripples are small. But there are a lot of them. And no-one considers this mechanism in seas, lakes, ponds or puddles.

Reply to  M Courtney
February 18, 2022 3:59 pm

In a 2003 paper, Carl Wunsch pointed out that most ocean mixing occurs at the margins. But that dynamic is not part of the climate models.

tygrus
Reply to  Ed Zuiderwijk
February 18, 2022 4:57 pm

Climate models are typically made by either meteorologists I wouldn’t trust to predict weather or physicists I wouldn’t trust to design an autopilot.

Gary Pearse
Reply to  Ed Zuiderwijk
February 18, 2022 8:27 pm

It seems to me, to take such pains to build a detailed model on “the physics” and then to have to add all kinds of fixes on an ad hoc continuing basis to ‘keep the model on the rails’ which in itself requires knowing where you want everything to go, is completely ridiculous. Doesn’t the model itself in this case totally falsify the chosen “physics” of a CO2 control knob?

Time and massive failures of projections shows this to be the case. CO2 is clearly dropping out of the principal component category, let alone being the control knob. The “Pause” and a 300% overestimate of warming should have been the end of it all. The 2016 el Niño gave temporary hope, but since, 7years of cooling pulled the rug out. Gavin Schmidt finally stated what was known over a decade ago that “models are running a way too hot, and we don’t know the reason why”. Willis seems to have several reasons why in this article.

RayG
Reply to  Ed Zuiderwijk
February 19, 2022 11:03 am

See my comment at February 19, 2022 10:51 am pertaining to Verification and Validation of simulation models.

J Mac
February 18, 2022 11:07 am

Happy Birthday, Willis! And Thanks A Bunch for the tour de force on predicting future climates by examining climate model entrails.

February 18, 2022 11:09 am

Happy birthday Willis!

Herbert
February 18, 2022 11:12 am

Again Happy Birthday Willis!
On iterative models and your experience of code writing,I have a query.
For AR6 2022 there are I believe some 86 CMIP 6 computer models.
Do the authors of each of these models create their programs from scratch or are they borrowing the essential codes from each other to save time and no doubt great cost?
What “ crossover” of coding exists between say the Russian Model which I understand gives the lowest SSP of 1.9 and the many Western computer models giving much higher results?
Does it matter or am I asking the wrong question?
Thanks.

Herbert
Reply to  Willis Eschenbach
February 19, 2022 8:01 am

Thanks, Willis. Much appreciated.

Alan Tomalty
Reply to  Herbert
February 18, 2022 12:20 pm

There is a common core kernel of code that is passed to each of the 86 climate units for each version number. Thus CMIP 6 is the 6th version of this core code. I highly suspect that it contains the formula for translating W/m^2 to temperature increase via increases in CO2 in the atmosphere. This is to keep the predicted temperature showing increases with any CO2 atmosphere increase. However it can be overridden with specific code as the Russian model does. The Russian model is the closest to the UAH satellite results. I have verified the 1st sentence above with Greg Flato the head of the Canadian computer model unit with Environment Canada.

Herbert
Reply to  Alan Tomalty
February 19, 2022 8:44 am

Thanks, Alan.
Most informative and useful to know.

MPassey
Reply to  Herbert
February 18, 2022 12:31 pm

Also google Reto Knutti, Climate model geneology

February 18, 2022 11:13 am

Nice picture. To those living in the US, can you possibly recall how the sky looked like during the post 9/11 shut down?

In the course of Covid lockdowns, especially March/April 2020, we had amazingly blue skies over Europe. It was not just the absence of contrails, but a much darker blue with otherwise clear skies.

Something similar is reported with regard to the short downing of air traffic during the 2010 icelandic volcano eruption.

ralph ellis
Reply to  E. Schaffer
February 18, 2022 12:38 pm

And I too had marvellously clear skies.
Just airborne out of Malaga (Spain)…

ATC: “Cargo-123, direct to Brussels.”

Brilliant – not been able to do that since 1945…

Ralph

Gary Pearse
Reply to  E. Schaffer
February 18, 2022 8:38 pm

I know in Canada, the rich clear blue is a regular feature of an arctic air mass overhead. In the case you describe, probably the drop in particulate matter is the whole explanation and my arctic air blue is just because its clean.

Reply to  Gary Pearse
February 19, 2022 5:44 pm

The thing is, it was not just Spring 2020, but also early 2021 (again widespread lockdowns) that the sky was deep blue. Not quite as extreme, but still. Air traffic was down by about 70%. And I have pictures of it.

comment image

Given similar enounters with previous groundings, it seems hard to blame the weather on it.

In terms of climate this may be a big thing. If it is due to air traffic, then it would make a huge forcing.

MarkW
February 18, 2022 11:16 am

And that means that any error in the output of timestep “J” is carried over as an error in the input into timestep “K”

Since these programs are typically done with floating point data, then every step has errors and they are built in due to rounding issues that are inherent with floating point data. After millions of iterations, these errors can become a significant fraction of the data being displayed.

Gerald the Mole
Reply to  MarkW
February 19, 2022 3:42 am

Am I correct in believing that in any itinerative process the final error is the stage error multiplied by the square root of the number of iterations?

February 18, 2022 11:20 am

It’s unbelievable that economic/energy policy is based on this muddled junk

ResourceGuy
Reply to  Mike McHenry
February 18, 2022 11:35 am

Global scale policy fail is unprecedented and yes unbelievable. It rivals world wars for diversion of output, wealth, and human progress.

James B.
Reply to  Mike McHenry
February 18, 2022 12:04 pm

The muddled junk is a feature. The politicians funding the green lobby only care that the “results” of the GCM drives cash flow to the politicians donors.

February 18, 2022 11:22 am

Happy Birthday Willis. Thank you for another excellent exposition. I always look forward to the reading and enjoyment of your posts.

February 18, 2022 11:28 am

Willis,
“In other words, when the temperature goes off the rails … don’t investigate why and fix it.”
You missed a key part of both of these comments (this and wind), which was
“during the initialization process”.

GCM’s, like CFD, have to start from an initial state, but, as often commented here, yield results that are not well related to that particular choice. So they have an “initialization process” which winds back to an earlier time, when you don’t necessarily know the state very well, and then let it work through a few decades until it reaches a starting point which is physically realistic. An initial spec will have velocities that are converging, which will make unintended waves etc. The wind-back allows that all to settle down. And it is during that time that they exercise these controls. They accelerate the settling down.

“Without such a gauge, the model could be either gaining or losing a large amount of energy without anyone noticing.”
No, the point of the routine is that it checks the total energy balance after each step. If there is a discrepancy, it corrects it. A “Murphy gauge” would only check if this accountancy had been done correctly.

“This makes them unstable. And as mentioned above, two ways to fix that”
No, as I wrote about here there is much art to designing iterative processes to be stable, emulating the stability of nature. If you don’t succeed, the program just won’t work, and can’t be repaired with hard boundaries etc. But we know how to do it. CFD works.

Bob boder
Reply to  Nick Stokes
February 18, 2022 12:12 pm

And hence not physical as Willis said.

Alan Tomalty
Reply to  Nick Stokes
February 18, 2022 12:34 pm

“then let it work through a few decades until it reaches a starting point which is physically realistic”. This is bullshit. The only physically realistic starting point would be the present temperature 2 metres( you pick the exact height you want) above ground at the billions of points around the globe which all have different temperatures, different wind speeds, different air pressures, different topographies, different relative humidities, different insolation…………..etc. Since the above parameters change in an unknowable way every split second, averaging the billions of spots is an impossible task. THERE IS NO REALISTIC STARTING POINT.

Reply to  Alan Tomalty
February 18, 2022 12:56 pm

“The only physically realistic starting point would be the present temperature 2 metres( you pick the exact height you want) above ground”
You have no idea how GCMs work. They are not models of surface temperature. They model the whole atmosphere/ocean; at all levels, humidity, wind, temperature, the lot. You can’t measure it all anyway, and there certainly aren’t measurements a hundred years ago. You can’t get a measured initial state, with values for all gridpoints. So you have to interpolate from whatever you do know. The interpolation will have artefacts which lead to spurious flows.

The good thing is that both the atmosphere and the model are basically stable, and conserve energy mass and momentum. All this initial stuff diffuses away. That is the initialization process.

jeffery p
Reply to  Nick Stokes
February 18, 2022 1:08 pm

You have no idea how GCMs work…”

First of all, the GCMs don’t work.

jeffery p
Reply to  Nick Stokes
February 18, 2022 1:22 pm

You wrote above that nobody knows the correct data for starting now. But then you claim that by letting a model work through decades, it will have the correct starting data.

Obviously, if you don’t know what the correct data is to start the model run from today, you don’t know the data from running it for decades is correct, either.

You also made the beginner error of mistaking model output for data. It’s not data. Models don’t output facts. At best, the output is a prediction that must be compared to the actual future climate.

Reply to  jeffery p
February 18, 2022 3:10 pm

“you don’t know the data from running it for decades is correct”

We go round and round with this one. Often quoted here is the IPCC TAR statement
“The climate system is a coupled non-linear chaotic system, and therefore the long-term prediction of future climate states is not possible.”
Less often quoted is the next sentence:
“Rather the focus must be upon the prediction of the probability distribution of the system’s future possible states by the generation of ensembles of model solutions.”

Also from time to time, people discover that small changes in initial conditions grow into big differences later on. True in all fluid flow. These things are all related. We can’t predict those long future states, with the correct weather. But there are underlying patterns of climate, with conservation of energy mass and momentum, which we can figure out, and in particular how they are affected by changing GHGs. That is what climate models are for.

This is a general situation in fluid mechanics, both computational and physical. There is sensitive dependence on initial conditions, but we don’t know what they were anyway. The aim of experiment and computation is to calculate stuff like lift on a wing, or drag on a vehicle. Or for GCMs, climate. These do not depend on details of initial conditions.

Reply to  Nick Stokes
February 18, 2022 4:10 pm

calculate stuff like lift on a wing, or drag on a vehicle.

Parameterized to reproduce observables within the calibration bounds, i.e., the specified operational limits.

Or for GCMs, climate.” Parameterized to reproduce observables within the historical climate, and then extrapolated off into bizarroland.

There’s absolutely no valid comparison between the methods.

MarkW
Reply to  Pat Frank
February 18, 2022 5:32 pm

It really is amazing how alarmists actually think that pointing out that some models work, is proof that their models wok.

Carlo, Monte
Reply to  Nick Stokes
February 18, 2022 4:21 pm

“Rather the focus must be upon the prediction of the probability distribution of the system’s future possible states by the generation of ensembles of model solutions.”

Another impossibility—does GCM error go to zero as the GCM count goes to infinity?

Reply to  Nick Stokes
February 18, 2022 10:14 pm

“Rather the focus must be upon the prediction of the probability distribution of the system’s future possible states by the generation of ensembles of model solutions.”

God spare me.

jeffery p
Reply to  Nick Stokes
February 20, 2022 8:38 am

Your claim makes zero sense as do your arguments. If you don’t know if the starting data is right, you don’t know. You claim you can’t just input the data for a run starting today, but if you start the run decades ago, the data for today is correct.

You simply can’t claim both as true.

Again, a very rookie mistake in claiming models output data. That is, the output from a decades-long run is input data for starting now. Again, models do not output facts or data.

Nobody can argue with that.

Reply to  Nick Stokes
February 18, 2022 1:52 pm

If both the atmosphere and the model are basically stable, then where do the tipping points climate scientists warn about come from?

Reply to  Doonman
February 18, 2022 4:14 pm

“where do the tipping points climate scientists warn about come from”
Non-linearity. Although climate scientists don’t say there is a tipping point; they just say we don’t know that there isn’t. We’re currently in a state where small disturbances do not have big climate effects. That could change.

Curious George
Reply to  Willis Eschenbach
February 19, 2022 8:30 am

You can not see a tipping point. In the theory of catastrophes, a “catastrophe” is whether you catch your train or miss it. But an observer will only see you sitting in a train or in a waiting room.

Alan Tomalty
Reply to  Nick Stokes
February 18, 2022 7:09 pm

“We’re currently in a state where small disturbances do not have big climate effects. That could change.” What evidence do you have that there will be a big change? Supposedly the words “climate change” are what you mean. However all the world’s databases on extreme weather show no difference from previous decades/centuries. And yes I understand the basics of GCMs. They are basically iterative Fortran modules that all run large groups of code to model the atmosphere with a core kernel of code that is passed to each modeler around the world, thus the basis for version 6. There have been 5 previous kernels. Among other things this basic kernel of code translates the amount of warming predicted from the increase in atmospheric CO2. It can be overridden as the Russian model has shown.

Tom Abbott
Reply to  Nick Stokes
February 19, 2022 2:19 am

“We’re currently in a state where small disturbances do not have big climate effects. That could change.”

Pure speculation.

wadesworld
Reply to  Nick Stokes
February 19, 2022 10:40 am

So who has been warning us about tipping points for 40 years and where did they get that idea?

Reply to  Doonman
February 18, 2022 6:44 pm

Whether or not “tipping point” is a good label for it, there are such actual changes in the real world. Something(s) changing produces the condition that continental ice sheets start forming and continue to do so, or continental ice sheets start melting and continue to do so. If heat is continually applied for a long enough time, water changes from liquid to vapor and the locomotive starts moving.

For some things humans have a good general understanding, shown by their ability to get parts of the world to do what they want; the freight gets moved from point A to point B. Other things must exist, by evidence in the real world, but we can only speculate about the particulars of why the ice sheets formed. It is clear there are many different opinions because there are unknown.

Based on the evidence the world presents to us, that atmospheric CO2 concentrations have previously been much higher than now, without catastrophic results, any CO2 concentration tipping point is extremely far away.

Mr.
Reply to  Nick Stokes
February 18, 2022 4:26 pm

you have to interpolate from whatever you do know

Didn’t the IPCC “interpolate” their 1.5C warming limit?

(which means pulling a number out of one’s arse?)

MarkW
Reply to  Mr.
February 18, 2022 5:35 pm

Isn’t interpolate just a fancy way of saying, guess?

Reply to  MarkW
February 19, 2022 10:09 pm

In any other scientific or engineering field, interpolate means to start with what you know and figure out what you don’t. Sort of like filling in a crossword around an answer you don’t know, but eventually enough boxes are filled in to see the answer.

But yes in climate scientology it means to guess. Well actually one makes a computer model that makes the guess for you, that makes it more sciency.

Tom Abbott
Reply to  Mr.
February 19, 2022 2:20 am

Yes, they did.

MarkW
Reply to  Nick Stokes
February 18, 2022 5:31 pm

Models have been running for many decades, and they still haven’t managed to actually create anything realistic.

Reply to  Willis Eschenbach
February 18, 2022 4:21 pm

In his 2002 “Ocean Observations and the Climate Forecast Problem,” Carl Wunsch noted that ocean models don’t converge.

He noted that when brought up at conferences the modelers shrug him off because, the circulations look reasonable. So has the standard of modern physicists deteriorated.

jeffery p
Reply to  Nick Stokes
February 18, 2022 1:15 pm

This just doesn’t pass the smell test. This code stinks, literally. It’s a poor way of handling the problem. As Willis stated, the correct method is to find and fix the problem.

Reply to  jeffery p
February 18, 2022 6:48 pm

It isn’t necessarily the case that it can be fixed. If one does not understand the real world processes well enough, one may not be able to get any puppet to emulate them to a useful degree.

Reply to  Nick Stokes
February 18, 2022 4:05 pm

Your here refuted here.

Richard M
Reply to  Nick Stokes
February 19, 2022 9:46 am

Nick’s usual nonsense. The foundation of the atmosphere and hence the climate is the atmospheric boundary layer. Model that correctly and you have a chance. Get it wrong and you will never get anywhere. Of course, if it was modeled correctly one would immediately notice there is no such thing as a dangerous greenhouse effect. It’s all diffused in the boundary layer.

Reply to  Nick Stokes
February 19, 2022 11:45 am

“GCM’s, like CFDs” – ok, stop right there. That is comparing giant pumpkins to strawberries. Computational fluid dynamics is a well understood field and usually one is dealing with a wing or pipe not the whole f’n planet with its oceans, atmosphere, plant and sea-life.

It’s like defending that buggy, unplayable Cyberpunk video game by comparing it to how well your pocket calculator works.

Reply to  Nick Stokes
February 19, 2022 1:57 pm

“And it is during that time that they exercise these controls.”

I suspect this is nonsense. I’d be willing to bet GCMs don’t have a parameter that turns off boundary checks because it’s out of its control period. You can see that they blow up during the actual runs too.

Reply to  TimTheToolMan
February 19, 2022 2:08 pm

“because it’s out of its control period”
It isn’t the control period. It is the initialization process. Once initialized, a lot will change.

Reply to  Nick Stokes
February 19, 2022 4:36 pm

What is the difference between initialisation and control? You can see from Willis’ graphics they well after, say, the first few iterations.

Reply to  Nick Stokes
February 19, 2022 4:39 pm

Also, do you have any evidence that’s how they create initial values? I would have thought they’d try values until they find ones that dont immediately blow up and then they become valid initialisation values at least for that version of the model. Not that they’d knobble the “physics” (and I use that term loosely) until the model settles down.

Mike Sexton
February 18, 2022 11:38 am

OT
Car carrier on fire in Atlantic around Azores
Sounds like some battery powered cars caught fire

Vuk
Reply to  Mike Sexton
February 18, 2022 12:06 pm

Lithium-ion batteries in the electric cars on board have caught fire and the blaze requires specialist equipment to extinguish, captain Joao Mendes Cabecas of the port of Hortas said.
It was not clear whether the batteries first sparked the fire.
“The ship is burning from one end to the other… everything is on fire about five meters above the water line,” Cabeças said.

Ron Long
Reply to  Vuk
February 18, 2022 12:34 pm

Just read the story, more than 1,000 Porsche cars and a good number of Bentley’s onboard. The ship has been abandoned and available for salvage, would-be salvage crews racing as we “speak”.

Vuk
Reply to  Ron Long
February 18, 2022 12:53 pm

Perhaps one for   Eric Worrall to dissect on the blog.

Jim Murphy
February 18, 2022 11:39 am

Happy Birthday!

February 18, 2022 11:43 am

Perhaps “negative snow depth” is the result of particularly heavy hail?

Rud Istvan
February 18, 2022 11:45 am

This excellent post got me wondering how good the CMIP6 version of GISS Model E is. So I did a bit of internet wandering. At data.GISS.NASA.gov I learned that the version for CMIP6 is E2.1. It has an atmospheric grid resolution of 250x250km. So per my previous posts, must be parameterized, which drags in the attribution problem.
After some more Google-Fu, found an unpaywalled 2021 paper with Gavin as second author at J. Advances in Modeling Earth Systems, v13 issue 1, id e02034. Some quotes:
“more sensitive to GHG than for CMIP5” translation ran too hot in hindcasts, solved by
”a historical forcing reduction attributed to greater opacity”—the old throw in more historical aerosols to cool hindcasts down trick. Resulting in
”Most model versions [so not all] match observed temperature trends since 1979 reasonably well”.

How about the future? Back to GISS. The SPP4.5 scenario produces 4C by 2100! The SPP8.5 (impossible) scenario is over 5C. Even more impossible.

Chris Hanley
Reply to  Rud Istvan
February 18, 2022 1:08 pm

”Most model versions [so not all] match observed temperature trends since 1979 reasonably well”.

Laughable.

Clyde Spencer
Reply to  Chris Hanley
February 18, 2022 3:16 pm

Is “reasonably well” defined?

Rud Istvan
Reply to  Clyde Spencer
February 18, 2022 4:50 pm

Of course not.

Reply to  Clyde Spencer
February 18, 2022 6:52 pm

(1) close enough for government work
(2) keeps the funding coming
(3) keeps the faithful happy

Alan Robertson
February 18, 2022 11:47 am

Happy Birthday*, good fellow and job well done with this post.

*
“One reason that I’m always hesitant to speculate on other peoples’ motives is that half the time I have no clue about my own motives.”

Whew. I thought it was just me.

Thomas W Jacobs
Reply to  Alan Robertson
February 18, 2022 4:21 pm

I truly believe Willis is only seeking accuracy and truth. Noble fellow indeed!

Reply to  Alan Robertson
February 19, 2022 4:07 am

I thought it was just me.

I’m (almost exactly) 19 years younger than Willis, but always appreciate the “thought provoking” aspects of his articles.

As someone who never got further than “C” programming, I’m in awe of anyone who’s managed to get as far as “R”.

When he writes “half the time [50%] I have no clue about my own motives”, I can only shake my head with admiration as my “I have no clue” ratio for that particular metric is more like 90% (minimum) …

ResourceGuy
February 18, 2022 11:47 am

It could be worse; MuddleE could be in charge of all nuclear weapons or DoD could be sharing computer time on the same system.

False Warnings of Soviet Missile Attacks Put U.S. Forces on Alert in 1979-1980 | National Security Archive (gwu.edu)

Geoff Sherrington
Reply to  ResourceGuy
February 18, 2022 4:40 pm

ResourceGuy,
An Aussie mate of mine wrote this story about a guy in USA who has high responsibility for ex-reactor nuclear material.
The Dog Days of the Biden Administration – Quadrant Online
If a muddle exists with nuclear material, it is plausible that a muddle exists with general climate models. Part of that appears to be increasingly political. Geoff S

ralph ellis
February 18, 2022 11:53 am

Do they have an input parameter for Chinese industrial dust and soot?

The problem with ‘reasonable parameters’ is that soot on sea-ice can radically change the surface albedo from 0.9 to 0.2, and thus radically increase the amount of Arctic summer insolation absorption. (Note: Antarctic sea ice is not reducing in the same fashion as Arctic. Until 2017, Antarctic sea ice was increasing.)

Here is an image of Arctic sea ice, after some Chinese industrial deposition. Couple of problems with this. a. The models do not allow for this. b. The Dark Ice project to investigate this had it funding cut, and so its website is defunct and all the imaged they had uploaded are gone.

How can anyone investigate climate, if they do not investigate all possibilities?

One of the Dark Ice Project images of Arctic ice.
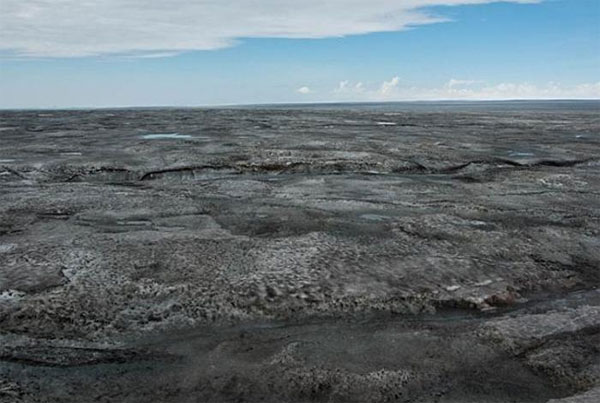
comment image

Ralph

Tom Abbott
Reply to  ralph ellis
February 19, 2022 2:26 am

That’s some dirty ice.

Reply to  ralph ellis
February 19, 2022 10:18 pm

Are the Chinese trying to melt the Arctic on purpose, to sell move turbines and solar panels?

Jonathan Lesser
February 18, 2022 11:59 am

Willis –

Your posts are always fantastic and I learn a lot from each one. Thank you for taking the time to present your work on this site.

And HAPPY BIRTHDAY. (I’m 11 years behind you.)

February 18, 2022 12:07 pm

Great Post ! Some highlights according to me (-:

But rather than figure out why the code is coming up with bad values and fixing it,

You mean coming up with values that they like. Uh. you know, supports the narrative.
________________________________________

This is what the climate modelers mean when they say that their model is “physics-based“. They mean it in the same sense as when the producers say a Hollywood movie is “based on a true story” 

Ha ha ha ha ha ha! Good one (-:
________________________________________

In other words, when the temperature goes off the rails … don’t investigate why and fix it. Just set it to a reasonable temperature and keep rolling.

And once again, reasonable means supports the narrative. 
________________________________________

twenty years ago I asked Gavin Schmidt if he had some kind of “Murphy Gauge” on this subroutine to stop the program if the energy imbalance was larger than some threshold. In the real world,

I am reminded of Trenberth’s “Iconic” Earth Energy Budget that he changed about ten years ago by adding “Net absorbed 0.9 W/m² ” obviously he changed it because it balanced, meaning world temperature wouldn’t increase. Original & Adjusted
________________________________________
 
 “negative cloud cover” and “negative snow depth”.

Another Ha ha ha ha ha ha ha ha!
________________________________________

 but unlike single-pass models, those outputs are then used as inputs, which the model performs operations on, and the process is repeated over and over to give a final answer.

A drunk walk graph where a random value is tacked on to the last one. It’s easy to produce a graph that looks a lot like the GISTEMP rendition we constantly see. All you have to do is add a small positive number to your random value. Run it a few times, and you’ll get one that you like.
________________________________________

Willis’s First Rule of Climate says “In the climate, everything is connected to everything else … which in turn is connected to everything else … except when it isn’t.”

The IPCC addresses that in that famous Quote from their Third Assessment Report:

In sum, a strategy must recognise what is possible. In climate research and modelling, we should recognise that we are dealing with a coupled non-linear chaotic system, and therefore that the long-term prediction of future climate states is not possible. LINK
________________________________________
 
The first rule of buggy computer code is, when you squash one bug, you probably create two others.

Yes, the rule of unintended consequences. We just bought a Ford Hybrid Escape, and it’s loaded with automatic shit some of which is great but there’s one in cruise control that forced me to jam on the brakes. When I flipped on the turn signal to pass the slow car in front of me. It stepped on the gas even though there was a car just a foot or two ahead of me in the left lane. I doubt a wind tunnel would have found that one.    

Dave Fair
Reply to  Steve Case
February 20, 2022 11:59 am

All you have to do is add a small positive number to your random value. Run it a few times, and you’ll get one that you like.” It’s the same trick used in inflating ARGO results by 0.12 C to “better match shipboard engine intake measurements.” As more ARGO data is added later in the series-establishing trends, the higher the temperature trend.

February 18, 2022 12:25 pm

Very nice, Willis and Happy Birthday, as well! I appreciate your including ‘Figure 1’ in your post, as it clearly shows the potential, at least for this particular GCM, to veer off into terra incognita. Interesting then, that when Pat Frank demonstrated that large iterative propagation errors in GCMs implied that commensurately large error bands should be placed around their temperature predictions, he was told by the modelers that the GCMs were incapable of attaining such temperatures.

Reply to  Frank from NoVA
February 18, 2022 4:26 pm

the GCMs were incapable of attaining such temperatures.” A typical modeler objection Frank, revealing that they don’t know the difference between a statistic and a physical temperature.

Reply to  Frank from NoVA
February 18, 2022 7:04 pm

Pat Frank has repeatedly written that it isn’t temperature extremes he is talking about, it is the uncertainty in saying anything in particular about the temperatures.

My apologies to Pat Frank if I am misrepresenting his work.

wadesworld
Reply to  AndyHce
February 18, 2022 10:17 pm

Although I’m completely incapable of understanding the math, as I recall despite his best efforts, none of the climate scientists arguing with him ever indicated they understood his point.

Reply to  wadesworld
February 19, 2022 9:10 am

You’re right, ww, and that remains true of them today.

Reply to  AndyHce
February 19, 2022 9:10 am

You are correct, Andy, thanks.

Tom Abbott
Reply to  ResourceGuy
February 19, 2022 2:35 am

Definitely keep your Vitamin D up. It helps with so many bodily functions. And doctors say just about every covid patient that has a hard time with the disease also has a low Vitamin D count.

Tom Abbott
Reply to  Willis Eschenbach
February 20, 2022 12:05 pm

I was doing that, too, until my new doctor told me I had toxic levels of Vitamin D in my system. Keep an eye on your levels.

Reply to  Tom Abbott
February 19, 2022 10:27 pm

That’s why COVID, and just about any cold/flu, disappeared during the summer time.

Ron Long
February 18, 2022 12:36 pm

Yea, Willis, but did you ever do Fortran punch cards? Happy birthday from another 75!

Fraizer
Reply to  Willis Eschenbach
February 18, 2022 2:53 pm

Learned the hard way to always pencil in a sequence number in the corner of punch cards.

Thank goodness those days are gone.

Carlo, Monte
Reply to  Willis Eschenbach
February 18, 2022 5:49 pm

A fat Magic Marker was an indispensable item in the card-deck jockey’s toolbox.

Herbert
Reply to  Willis Eschenbach
February 19, 2022 9:19 am

Willis,
You have probably read John Scarne on Cards.
In the 1920s as a young man he met with Arnold Rothstein the gambling czar in New York.
Scarne took a fresh card pack,, opened it, took off the cellophane and riffle shuffled the Cards.
He then dealt Rothstein the 4 Aces face up.
When Rothstein asked how he did that, Scarne said it was easy if you practiced 10 hours a day for a decade!

Alan M
Reply to  Fraizer
February 18, 2022 4:12 pm

Or the pencilled diagonal line across the stack

Mr.
Reply to  Fraizer
February 18, 2022 4:34 pm

I had to handle trays of cards for each run on the mainframe, so putting sequence numbers on thousands of cars wasn’t an option.

But a diagonal marker line drawn across the top of the tray card deck at least gave us an approximation of what went where after a butter-fingers episode.

Rud Istvan
Reply to  Mr.
February 18, 2022 5:49 pm

That is what I always did for my thesis.

ETHAN BRAND
Reply to  Willis Eschenbach
February 18, 2022 3:51 pm

Pah…punch cards!…BASIC punch tape…a bit of a horder..can still lay my hands on a pile of punch cards for a fortran program I wrote for a college professor trying to prove that lowering rat body temperature would increase life expectancy. Data did not support, so we “modeled” the data to show it did…and received further funding. 1976…nothing has changed….🙂

John Dilks
Reply to  Willis Eschenbach
February 18, 2022 4:38 pm

I never dropped them, but I did reuse Mark Sense Cards by turning them around and punching them. I was a broke college student. It worked out for me until the day came that a computer operator thought I had my deck facing the wrong way inside of my JCL cards. I ended up with a box of computer paper with thousands of errors and my program only had about 60 lines. I also had a note from the Computer Science Department thanking me for showing them an error in their code that was suppose to restrict student output.

MarkW
Reply to  John Dilks
February 18, 2022 5:47 pm

My favorite story is of a program that had an infinite loop with only a single command in it. Form Feed.
I’m told that the paper arced all the way across the room and a full box of paper emptied in about 20 seconds.

Reply to  Willis Eschenbach
February 18, 2022 7:07 pm

I did, once

Gerald the Mole
Reply to  Willis Eschenbach
February 19, 2022 4:13 am

Happy Birthday Day young man, I am eight years in front. By the way it used to be said that if you used paper tape you had to work in a high building with stairs that had a hole down the middle so that you could untangle the tape by dropping one end down the well! Some installations even had a tape winder permanently installed at t the top of the stairs. Happy days.

Paul Hurley (aka PaulH)
Reply to  Willis Eschenbach
February 20, 2022 6:19 pm

I have a punch card story from my university days in the late 1970’s. In one compsci course we were studying PL/1. Late one school night I was wrapping up my PL/1 work on a campus terminal, and I wanted a printout to take home. The mainframe system had a command line language for creating printouts the looked, as I recall, like this:

copy filename to LP at building

where building is the location of the line printer I want to use. So, I ran the command and went to the admin building to collect my printout and then catch the last city bus home. I arrived but didn’t find the printout. Oh well, I’ll be back tomorrow morning. At my first compsci class the next morning, I was confronted by a student worker at the admin building who was rather annoyed at what I had done! Why? Instead of typing LP for Line Printer, I typed CP for… Card Punch! That command generated 2 or maybe 3 boxes of punch cards of my PL/1 code, which someone had to box by hand, just for me. Oops!

But hey, they didn’t have a Murphy gauge.

ResourceGuy
Reply to  Ron Long
February 18, 2022 1:20 pm

I define cruelty as being assigned a Fortran project with punch cards at a point when they were already becoming obsolete. It was also a sign of outdated university resources.

MarkW
Reply to  ResourceGuy
February 18, 2022 5:49 pm

Ever try using a teletype as a user interface?

D. J. Hawkins
Reply to  Ron Long
February 18, 2022 3:02 pm

Somewhere I have a deck of punch cards for a very simple crude oil distillation program I wrote in college. No doubt the rubber bands securing them have rotted away. I’d have to be very careful digging them up, assuming the spirit moves me to.

Rich Lambert
Reply to  Ron Long
February 18, 2022 3:14 pm

About 10 years ago I happened to mention punch cards to some young coworkers. Of course, they had never heard of them.

Carlo, Monte
Reply to  Rich Lambert
February 18, 2022 4:27 pm

Or ferrite core memory planes…

Reply to  Rich Lambert
February 18, 2022 7:09 pm

Hollerith cards

Jan de Jong
Reply to  Ron Long
February 18, 2022 4:25 pm

I remember paper tape and closets with subroutine rolls. That was just before those modern cards.

Mike Smith
Reply to  Jan de Jong
February 18, 2022 5:23 pm

Paper is too fragile for military applications so we used mylar tape.

Best part of the project was when we finished a new release and inspectors descended to perform “software quality assurance”. The tape was inspected to see that the punched holes were in spec. and the tape had the prescribed length of blank leader and trailer.

I kid you not!

jeffery p
February 18, 2022 12:55 pm

But science!

Rick C
February 18, 2022 12:56 pm

Happy B-Day Willis. I’m 3 years younger, but FORTRAN was my first computer language followed by Basic and C/C++, but then my career path changed and I started hiring programmers instead of programming.

Anyway, many years ago I was provided with a FOTRAN program that written by a prominent PhD to carry out some quite complex chemical process calculations. When I reviewed the code I found a line that essentially said “if X< 0 then X = 0” with no explanation. X represented a quantity of a particular compound so a negative value was, of course, impossible. Curious, I removed the line and ran some sample data and was surprised to find in many cases the value calculated was substantially negative, not just a rounding artifact. It took a while but I tracked down the error which was causing the problem. I sent a note to the original author but never got an acknowledgment.

Since then I’ve seen lots of code that contains obvious fudge factors and constraining functions that just cover up what would be obvious errors. The climate-gate “Harry ReadMe” file demonstrated the poor practices that appear to be common in GCMs. Your post lays bare how bad the situation is with these climate models, but it is not surprising to me.

MarkW
Reply to  Rick C
February 18, 2022 5:54 pm

I used four different languages while in college, ASM80, Fortran, Pascal and PL/M. My first job out of college I worked for a small company that made EPROM gang programmers, I had to redesign the circuitry, layout the circuit boards and re-do much of the program which was written in 6805 assembler.

Robber
February 18, 2022 1:00 pm

Great work as always Willis. But it seems that in that 440,000 lines of code you didn’t find the key line that reads delta T=fn(CO2)

February 18, 2022 1:01 pm

Willis, congratulations with your special birthday!

The crux of the climate model matter indeed is in:

The fact that a climate model can hindcast the past means absolutely nothing about whether it can successfully predict the future.

Even the hindcast of several multi-million dollar models was not better than of a simple EBM (energy balance model) on a spreadsheet. That was what Robert Kaufmann found, see:
https://www.researchgate.net/publication/228543322_A_statistical_evaluation_of_GCMs_modeling_the_temporal_relation_between_radiative_forcing_and_global_surface_temperature

Here his comment on RealClimate in their better days when discussions were allowed (2005):
https://www.realclimate.org/index.php/archives/2005/12/naturally-trendy/comment-page-2/
and look for Kaufmann around the 6th comment.

Tom Abbott
Reply to  Ferdinand Engelbeen
February 19, 2022 2:51 am

“The fact that a climate model can hindcast the past means absolutely nothing about whether it can successfully predict the future.”

Especially when “the past” the models are hindcasting, the bogus, bastadrized global temperature record, is science fiction.

February 18, 2022 1:24 pm

As well as using the same variable name to represent different things, the names themselves don’t seem to be that descriptive, which makes it tough for the poor person trying to read the code.

I suppose that if you’re a climate model expert mysterious variable names like ‘nnn’ might mean something to you. I know, naming things is hard, but so is gleaning meaning from bad ones.

Joe Crawford
February 18, 2022 1:33 pm

If I remember correctly (I’ve got about 5 years on you), for government contract work we use to bid about 3.5 lines of code per man-day. That included design, coding and testing (i.e., both function and system testing). We assumed around 10 to 15 errors per thousand lines of code into function test and expected around 1 tr 2 errors per thousand out of system test. Using your count of 441,668 line of fortran code in the GISS GCM it won’t be ready for prime time until they’ve spent something like 500 man-years on it in development and testing. Without function or system testing, but giving them a little credit for fixing or kludging the errors they might have stumbled on, I would expect no better than 5 to 10 errors per thousand in the code as it sits today.

As you said: “All a computer model can do is make visible and glorify the under- and more importantly the misunder-standings of the programmers. Period. ” I have to agree. It, and the others like it, sure aren’t fit for prime time.

Reply to  Joe Crawford
February 18, 2022 7:13 pm

As compilers and error reporting improved, debugging generally went much faster.

Joe Crawford
Reply to  AndyHce
February 19, 2022 7:52 am

We usually had pretty strict requirements for system integrity, where the system and each module thoroughly validity checked each input, and for data integrity, where the system guaranteed to either report a mathematically correct answer or an error code and never unintentionally modified data. Meeting both of these requirements usually increased the design time, the size of the code and the testing by up to an order of magnitude over providing just the functional code as the GCMs appear to do. We also found that the man-power estimates for the project were pretty much independent of the programming language and compiler used, which were normally either specified by the user or matched to the hardware.

Vuk
February 18, 2022 1:35 pm

OT- attention if you use Chrome browser, email from Norton antivirus co :
“Google announces zero-day in Chrome browser  
What Happened?
Google confirmed in an official blog post that a new Zero-Day vulnerability (CVE-2022-0609) has been found in Chrome browsers and is being abused by the hackers.
You can read about the specifics of the vulnerabilities on Google’s blog site.
What should you do?
Google has pushed out the latest Chrome update (version 98.0.4758.102) which will roll out over the coming days/weeks.”

Editor
February 18, 2022 1:43 pm

Thanks w, for another excellent insight. In this case, that the core of a climate model, and the part that needs a supercomputer to run, is a random-number generator. The parameterisations simply provide the (very narrow) ranges that limit the random numbers. All you actually need are the parameterisations and a home computer. No 400,000 lines of code and no supercomputer are needed.

February 18, 2022 1:57 pm

Happy birthday, Willis, with great appreciation for your contributions here at WUWT and elsewhere.

You say, “Curiously, the subroutine “addEnergyAsDiffuseHeat” is defined twice in different parts of the program … but I digress. When energy is not conserved, what it does is simply either add or subtract the difference equally all over the globe.”

This is an important point. How much of an adjustment is it? NOAA’s GFDL model CM4.0 includes the atmosphere model AM4.0. There is a two-part paper describing the model. For Part II, this Supporting Information pdf quantifies the effect of using such an approach in the treatment of energy conservation. See p.2 top. (link pasted below)

The dissipation of kinetic energy in this model, besides the part due to explicit vertical diffusion, occurs implicitly as a consequence of the advection algorithm. As a result, the dissipative heating balancing this loss of kinetic energy cannot easily be computed locally, and is, instead returned to the flow by a spatially uniform tropospheric heating. This dissipative heating associated with the advection in the dynamical core in AM4.0 is ∼ 2 W m−2.”

2 W/m^2 seems like an awful lot of heat energy to spread around because it cannot easily be calculated locally. Especially so in an iterative model. And also because this amount of heat is so much larger than the year-by-year changes in GHG forcings being investigated.

https://agupubs.onlinelibrary.wiley.com/action/downloadSupplement?doi=10.1002%2F2017MS001209&file=jame20558-sup-0001-2017MS001209-s01.pdf

February 18, 2022 1:59 pm

Fortunately Earth’s climate is not an iterative model in FORTRAN.

The energy balance on Earth is a function of two very powerful temperature controlled processes.

Here is something to confirm. Turn off the nuclear reactors in the Sun and Earth and determines what happens to the oceans. I get 35,000 years for the first 2000m to form ice. Point here, sea ice has a huge bearing on the global energy balance. Where does it figure in the “greenhouse effect”.

However sea ice plays a small role in the energy balance compared with high level atmospheric ice over the oceans that kicks into gear when the atmospheric water reaches 45mm. Clouds are a function of surface temperature and ocean surface temperature is limited to 30C by the persistence of the cloud. Parameterising clouds is unphysical and definitely not “based on physics”

From what I have seen written about climate models, I believe they consider that excess surface heat can find its way into the deep oceans. That is unphysical because it is impossible to warm deep ocean water from the surface. Warming oceans is indicative of reduced evaporation not surface heat input.

bill young
February 18, 2022 2:06 pm

Happy Birthday Willis and may you enjoy many more. Your posts are always interesting and thought provoking.

Rud Istvan
February 18, 2022 2:08 pm

Happy birthday WE.
BTW, an easy and inexpensive way to ‘fireproof’ your shingles is to coat them in a colorless solution of diammonium phosphate (DAP, an inexpensive fertilizer) mixed with a clear water based latex sealant. Maybe that is what you are buying, branded. Simple to home brew. 5% by weight in solution suffices.That is the chemical (usually artificially colored purple or orange for visual drop application reasons) used to fight forest fires. Great flame retardant.

February 18, 2022 2:17 pm

Thanks, Willis, for a very systematic and detailed demolition of a GISS GCM Muddle.

Philip
February 18, 2022 2:25 pm

it’s written in the computer language FORTRAN … which was an excellent choice in 1983 

I respectfully disagree. Fortran was outdated by then. There were better languages around.
Fortran was used by “researchers” because they were not really interested in computing, beyond being able to use computers to solve things that were beyond their pocket calculators, and to make use of the large number of libraries available. Particularly statistical analysis libraries. Because, as we all know, statistics is hard. Getting it right is even harder.

People writing the code didn’t really understand what they were doing. Fortran was easy to learn (well, easy to come up with something that compiled, and printed a number at the end. The alternatives were harder to write a program which would actually compile, and run to completion without some sort of runtime error).

What you describe here is typical of stuff I have seen – patches to try to make broken code work. The real problem can be as simple as a programming error, it can be a runtime error where an arithmetic overflow goes undetected, the algorithm is incorrectly coded, or that the algorithm being used is actually wrong/inappropriate.

The programming mistakes are hard to detect, after the fact in an unstructured language, and even more so in half a million lines or so of that language.

Basically, not fit for purpose.

My favorite story about blind use of other’s code comes from the same era, 1980’s.
I had my computer science degree and was doing some graduate student work for the computer science department to earn a few pennies. Part of that work was running a “surgery” for undergrad computer science students to bring along their sick programs for a bit of help diagnosing the problem. One day, a girl I had never seen before arrived and asked if I could help with her program.

At that time, we were still using punch cards, and teaching using Algol60 as the programming language.

She plopped a lineprinter listing on the table and unfolded it.
I had honestly never seen anything like it. It was a solid block of code. No spaces, no indentation, just 80 columns wide, solid code.

At the end was the compilation error message:

“Mismatched Begin-End”

For those that don’t know, Algol60 uses the key words BEGIN and END to “bracket” together sections of code.

For a computer science student, I would have refused point-blank and told them to go back and re-enter it, with proper indentation to reflect the structure as they had been taught.

I asked a few questions – she was doing one of the “soft” sciences for her MSc. She had some data to analyze and he supervisor had handed her a book and pointed to a listing for a program to do what she needed. He told her that Algol60 was insensitive to spaces and indentation, so she didn’t need to worry about that. She just sat down at the card punch and started typing, ignoring spaces.

I explained that it was going to be painful because of the lack of any sort of structure, but we would have a go anyway.

I explained the technique of using a pen to draw lines between BEGIN-END to see what matched up with what.

45 minutes later, we found it. I was pretty much expecting it would be bad enough that she would have to re-type the whole thing again, but it turned out that it could be done by removing three cards from the deck, and replacing those with five.

It compiled. It ran.

I didn’t dare ask if the answer was correct. But she was happy with it, and so was her supervisor.

wadesworld
Reply to  Philip
February 18, 2022 10:26 pm

Fortran programmers later moved to SAS. Their tunnel vision knows no limits. When my university computing department needed to create some Helpdesk ticketing software, the modelers decided that SAS was the perfect environment in which to create a Helpdesk ticketing program, because, you know, SAS was the right answer for everything.

dk_
February 18, 2022 2:27 pm

Excellent post.

Until the software source code, compilation records, the input data, runtime conditions, and runtime records are made available for qualified, independent reviewers, no software should be “trusted” any more than one would a casual stranger.

At some level, is there anything that isn’t “physics based?”

Reply to  dk_
February 18, 2022 7:24 pm

RPGs

Disputin
Reply to  AndyHce
February 19, 2022 3:10 am

Rocket Propelled Grenades?

February 18, 2022 2:41 pm

Happy birthday

Richard Williams
February 18, 2022 2:49 pm

Best wishes Willis for a Happy Birthday, from middle England. Thank you for your good science, good sense and good humour.

Mike Thies
February 18, 2022 3:08 pm

Thirty minute iteration. Hmmm?

No wonder there are so few lines of code to model at least six interrelated subsystems whose natural iteration is one solar year.

It’s climate, not weather.

Tom.1
February 18, 2022 3:30 pm

Willis- You and I are the same age, and I also have a technical background, but otherwise, my life is pretty mundane compared to yours. I enjoy your posts so much. My first exposure to Fortan, or any programming was in college. We were still using card decks of course, and I recall a class problem solving a quadratic equation using the Newton-Raphson method or something like that. I moved on from there to industry where I became acquainted with linear programming, which we used to optimize the inputs and outputs of petroleum refineries. They also used punch cards and were probably even less accurate than today’s climate models. They were of course iterative, since they used the linear programming algorithm, but they were extremely dependent on some initial assumptions. There was no recursion then based on a run output. I suppose somebody might have come up with an automated key punch machine that would give you a new deck based on your just completed run, but we did not have that. As time went on, computers became powerful enough that you could add recursive calculations into which you incorporated non-linearities, and you could model a refinery down to the gnat’s ass in about two minutes. That was fun. Now I spend my time programming, which I have always loved, but the effort is not for refineries, but for automated trading systems for stock index futures. I do it all day, every day, just about. It’s fun.

Regarding your analysis of climate models, do people in the climate change business ever get exposed to your ideas? I feel like they should. If they do, what do they say? I’d really like to know what a Michael Mann, for instance, has to say about your post.

Mr.
Reply to  Tom.1
February 18, 2022 4:37 pm

Mann just blocks or deletes any information that doesn’t help push “the cause” (as he terms his climate “science”).

Tom Abbott
Reply to  Mr.
February 19, 2022 3:13 am

Yeah, the Climate Change Charlatans say “why should we turn over our data to you when all you are going to do is try to find something wrong with it?”

My question is: Why should we spend Trillions of dollars trying to fix CO2, when we can’t get confirmation of the “data” that says we need to fix CO2?

Reply to  Tom.1
February 18, 2022 7:27 pm

It seems hard to believe that anyone would want to know what MM says about anything.

Tom Abbott
Reply to  Tom.1
February 19, 2022 3:06 am

“Now I spend my time programming, which I have always loved, but the effort is not for refineries, but for automated trading systems for stock index futures. I do it all day, every day, just about. It’s fun.”

You sound like my nephew. He worked at the Citadel in Chicago working on automated stock trading systems. He has since retired at the age of 40.

MarkW2
February 18, 2022 3:41 pm

What a fabulous post. As someone who builds and uses computer models I find it unbelievable how so-called climate ‘scientists’ can be taken in by the idea that modelling past events somehow means it’s possible to model the future at anything like the precision being claimed.

Yes, the models are useful but we know they’re all wrong when it comes to predicting the future. What a bunch of conmen these people have become.

Tom Abbott
Reply to  MarkW2
February 19, 2022 3:14 am

“What a fabulous post. As someone who builds and uses computer models I find it unbelievable how so-called climate ‘scientists’ can be taken in by the idea that modelling past events somehow means it’s possible to model the future at anything like the precision being claimed.”

They are not modeling past events. They are modeling science fiction.

I’m amazed that climate scientists can be taken in by a bogus, bastardized global surface temperature Lie.

They should try to hindcast reality instead. The U.S. regional chart (Hansen 1999) is representative of the real global temperature profile. Unmodified, regional temperature charts from all over the globe have the same basic temperature profile as the U.S. chart. None of them look like the bogus, bastardized Hockey Stick chart lie.

comment image

February 18, 2022 3:47 pm

Happy birthday, Willis. 🙂

And thanks for the outstanding post. There’s nothing that illustrates the truth of a matter better than getting down to the details.

And without wanting to be self-serving, “any error in the output becomes an error in the input” exactly describes the logic at the center of “Propagation of Error …

Thanks again, Willis, for giving us all the gift of an outstanding analysis.

Clyde Spencer
February 18, 2022 3:52 pm

What this code does is to put up hard limits on the values for the albedo for sea ice and melt ponds, as well as specifying constant values for wet and dry snow on the sea ice.

I’m a little surprised that they use such a simplistic approach. The melt ponds will have a specular reflection that varies with location, (i.e. latitude), and with the day and time of day. The specular reflections vary from about 10% at a 60 deg angle of incidence to 100% at 90 deg. While snow, and to a lesser extent ice, is a diffuse reflector, one should use the bi-directional reflectance distribution function, and integrate over the hemisphere to obtain the total reflectance. Even snow has a strong forward reflectance lobe for low sun angles because of a tendency for the snow flakes to be sub-parallel. Therefore, the atmospheric scattering and absorption will vary depending on the angle of the outbound reflected rays.

If they can’t handle clouds, then they must be parameterizing the melt water ponds as well.

Reply to  Clyde Spencer
February 18, 2022 7:29 pm

snow exist over latitudes in a very uneven manner

Clyde Spencer
Reply to  AndyHce
February 19, 2022 8:43 am

That too!

Clyde Spencer
February 18, 2022 4:02 pm

For an additional difficulty factor, as with many such programs, it’s written in the computer language FORTRAN

Somewhere I had gotten the idea that a reason that FORTRAN was used was that it had been written to compile into sections that can be parallelized to take advantage of parallel processing on supercomputers.

How many ‘modern’ languages will compile parallelized code, or have need to?

Ed Bo
Reply to  Willis Eschenbach
February 18, 2022 6:16 pm

There are many great things about R, but it is an interpreted language, so it would not be efficient enough for the huge computational load of a long-term climate model.

Highly parallelized computing is a relatively small niche – I don’t know if there are really superior alternatives to Fortran (my first programming language, but I haven’t used in 40 years…)

MarkW
Reply to  Clyde Spencer
February 18, 2022 6:06 pm

Pretty much every language that I am familiar with can be written to run in parallel. What you need is an operating system that will support parallelism.

Bill Rocks
Reply to  MarkW
February 19, 2022 10:56 am

I see what you mean but you forgot the smiley face.

Scott
February 18, 2022 4:13 pm

Happy Birthday Willis – great stuff (again)

Clyde Spencer
February 18, 2022 4:14 pm

… but sometimes that code comes up with unrealistic values. But rather than figure out why the code is coming up with bad values and fixing it, the climate muddle just replaces the bad value with the corresponding maximum or minimum values.

Yes, it is a cheap fix. De-bugging even simple code can be very time consuming, hence expensive.

I guess what I would do if tasked to find the problem would be to write out a matrix of all the intermediate values and plot them later. I’d look for any variables suddenly stepping, or suddenly rising very rapidly, or flattening out indicating it had been clamped. I’d then explore those areas in the code to see what was going on.

When I was younger and less experienced, I wrote an iterative program in Basic on an 8-bit Atari to estimate the terminal velocity of a falling object. It was well behaved until it got close to about 120 MPH, and then the speed oscillated wildly. I think the major problem was round-off errors, particularly as the denominator approached zero.

Mr.
February 18, 2022 4:15 pm

mistaken beliefs

From pedants’ corner Willis –
“mistaken conclusions” please.

“belief” should not be used in any references involving proper scientific pursuits.
“Belief” belongs in religious discourse.
(or AGW disciples)

Clyde Spencer
February 18, 2022 4:21 pm

Pay them no attention. They are not “physics-based” except in the Hollywood sense, and they are far from ready for prime time.

I completely agree! I’d liken the parameterizations and clamping of out of range variables to writing the “physics-based” equation E = mc^(2 +/-20%). It is “physics-based), but probably not too useful.

Carlo, Monte
February 18, 2022 4:35 pm

How much training does the average climastrologer get or have in real software engineering?

All of these stories about FORBASH spaghetti noodle stirring point to the answer—none.

Geoff Sherrington
February 18, 2022 4:53 pm

Hi Willis,
Happy 75th. I got there 5 years ago, so can also relate to punched cards. Used to draw colored diagonal lines on the outside of a stack to make it easier to re-assemble it.
First programming was in machine language, make a perpetual calendar that accounted for leap years. After that, I realized that good programmers, like good golfers, were rare and needed to keep in heavy training, which I did not have the time for. My best calendar effort had twice the lines of my colleague, so over to him in future.
Re, GCMs. Pat Frank’s uncertainty estimates are interesting. You seem to be quiet about them, Nick Stokes simply unbelieves. After having worked for an income that depended on keeping within uncertainty bounds, I tend to agree with Pat’s findings. Any comment?
Finally, with many applications in science, a what-if can be diagnostic. What if a study was done on GCMs by turning off the main components one after another to see the effect on output. IIRC, that was done for clouds, authors claimed no effect of turning them off. Has anyone turned off CO2 to see the output?
Keep off ladders! My balance is now extremely poor, gave up ladders a decade ago, real threat. Geoff S

Editor
February 18, 2022 5:23 pm

w. ==> “They are “iterative” models, meaning that the output of one timestep is used as the input for the next timestep.

Notice in the upper panel how many runs fall out the bottom during the control phase of the model runs … and that has never happened with the real earth. [ Figure 1. 2,017 runs ]

This routine makes sure that the temperature remains within reasonable bounds”

Iterative models of non-linear physics always result in chaotic results (using the definitions of Chaos Theory.) That is why they get runs with results that fly off into the starosphere or dive to the center of the Earth (figuratively).

They must put bounds for all sorts of elements of the output, as Chaos demands that the models output nonsensical values sometimes lots of them. To solve this, they simply throw away these results and only keep the ones that agree with their biases (expected results). Even then, the spread of results is as shown in Fig 1 Panel a – all over the map.

Averaging such results is nonsensical and un-physical and violates basic principles of science.

They can not eliminate the effects of Chaos — and thus “we should recognise that we are dealing with a coupled non-linear chaotic system, and therefore that the long-term prediction of future climate states is not possible.IPCC Third Assessment Report (TAR) WG1 Section 14.2.2.2

February 18, 2022 5:26 pm

The file RADIATION.F contains much of the code that handles the radiant balance and contains thousands of baked in floating point constants, many of which have no documentation associated with them.

They have recently updated from F66 to the 1990 version of Fortran by replacing spaghetti code control constructs with loop constructs and even case statements…

Tom Abbott
February 18, 2022 5:49 pm

From the article: “Finally, all models are subjected to what I call “evolutionary tuning”. That is the process whereby a change is made, and then the model is tested against the only thing we have to test it against—the historical record.”

What historical record? The only historical temperature record I know of are the written, regional surface temperature charts. The models don’t test against those.

What the models test against is the bogus, bastardized Hockey Stick global temperature science fiction chart. This is not a historical record. This is dreamed up in a computer and looks nothing like the written, historical temperature record.

Testing a computer model against science fiction such as the bogus Hockey Stick chart will tell us nothing about the real world.

February 18, 2022 6:18 pm

“thank all of my friends both in real life and on the web…”
Being on the web does not make us less real!
Happy Birthday Willis and thank you for your posts.

Brian
February 18, 2022 6:32 pm

Happy Birthday Willis, you are amazing! My view on models is that there have only ever been two models worth bothering with. One you find on a catwalk and the other can be seen on the freeway, and until the advent of EV’s it was easy to determine which was the most reliable.

February 18, 2022 7:01 pm

Another dose of reality. Happy Birthday W
 
Years ago I surmised that Climate Science with their GCMs was ‘mired in minutia’. This assessment corroborates that.

To estimate the future average climate temperature, might just as well guess at what is important, use what has actually been measured and optimize their combination. Assume the same things will remain important for a while to predict the future. That’s what produced this. Click my name and see Sect 17 to see how.

Aintsm 1850 2020 sine.jpg
Reply to  Dan Pangburn
February 18, 2022 7:23 pm

Crap! Clicking my name doesn’t work with Google anymore. Click this: http://globalclimatedrivers2.blogspot.com

Reply to  Dan Pangburn
February 20, 2022 7:39 am

Is there any way to construct an equivalent graph using the raw or unprocessed data? Considering all the temperature and heatwave records set in the 30’s the HadCrut series seems nonsensical.

Reply to  PCman999
February 20, 2022 7:43 am

Certainly there is more concrete and asphalt on the ground now than 80 years ago!

Reply to  PCman999
February 20, 2022 10:44 am

True but emissivity is about the same and 71% of the planet is covered by oceans anyway. Evaporation change doesn’t matter because water vapor is measured and that is what I use. Water vapor has increased about twice as fast as possible from just feedback.

Reply to  PCman999
February 20, 2022 4:45 pm

Water vapor increase has been about twice as fast as possible from just feedback.

TPW meas & UAH thru Dec 2021 6.7%.jpg
Reply to  PCman999
February 20, 2022 10:34 am

Years ago I made this comparison of anomalies of all who reported way back in time. The ‘wrt’ is referring to the reference T as an average for some previous period, They were all constructed from the same data base of raw data. IMO they are close enough to each other that I decided to use H4 instead of some average. Also IMO back then they were a bunch of experts trying to get to the truth, while since then many (me included) think some might be ‘adjusting’ the data to better match their faulty GCMs. I have not been motivated to try to reconstruct a T trajectory using initially reported temperatures because I don’t think it would make much difference.

Four reported anomalies.jpg
H.R.
February 18, 2022 7:12 pm

I’ve been reading WUWT for many years and I can recall several articles Anthony posted where ‘Climate Scientists’ had things pointed out or found things that “aren’t in the models.”

I’m guessing that those discoveries of oversights led to a fair amount of the muddling.

Gary Pearse
February 18, 2022 7:42 pm

Willis, what a tour de force! Any reader that may have discounted you because “you are not a climate scientist” should benefit with a link to this remarkable piece of work.

You thanked so many people and it is proper to so, of course. But I have to say that the thanks that is your due for sharing your knowledge, clear analyses, patient explanations, all in straight forward language and with no pay walls or monetary profit to you, is global in scale. Even antagonist researchers have been enriched (some, like the Nile crocodile being saved by an ecologist, will still try to snap his benefactors ass off).

Gary Pearse
Reply to  Willis Eschenbach
February 18, 2022 9:11 pm

Oh, and Happy Bithday! And remember that the phenomenal Michael Faraday was a self taught amateur whom Sir Humphrey Davy took on as an assistant.

February 18, 2022 8:34 pm

I’ve done many model simulations that were iterative, but much simpler than a GCM. They were always essentially solutions to the diffusion equation. The good thing is that there is theoretical guidance as to how to combine your time and spatial steps so that the thing doesn’t go off the rails. Even then, it’s a tricky business when there are complex non-linear parts to the model, as there’s no solution “in the CRC Handbook” to check it against. So I completely agree with Willis that one should be exceedingly humble about the accuracy to be expected from such models.

One model I looked at from decades ago dealt with the uptake of oxygen diffusively into a long thin bit of muscle tissue which is in turn consuming oxygen. The muscle was approximated by an infinite cylinder (got to cut down on dimensions when you can). To get the “right” answer you run it and have a guardrail to prevent O2 from going to negative infinity. Physics! Biology! To paraphrase the immortal words of Clint Eastwood, a model’s got to know its limitations.

Loren C. Wilson
February 18, 2022 8:38 pm

Fortran 77 was my first language. It’s fine for number-crunching but no good for talking to anything besides the hard disk and the screen. Most big, iterative programs (finite element analyses, process simulators, etc.) were written in Fortran. They now have slick front ends but the guts are still Fortran. I asked my boss why they didn’t rewrite the reservoir simulation code in a more modern language. His answer was that the risk of it not running in the new language outweighed any benefit.

Christopher Chantrill
February 18, 2022 9:07 pm

I wonder if Gavin Schmidt ever gets on the roof to do a spot of pressure washing?

Happy Birthday, Willis, you youngster.

michel
February 18, 2022 11:53 pm

Willis, this was very interesting. It stimulated someone further down the thread to provide a link to this paper:

https://journals.ametsoc.org/configurable/content/journals$002fclim$002f24$002f9$002f2010jcli3814.1.xml?t:ac=journals%24002fclim%24002f24%24002f9%24002f2010jcli3814.1.xml&tab_body=fulltext-display

which addresses the question how many models there really are. The authors have taken 24 well regarded ones, and determined

we find that the effective number of models (Meff) is considerably smaller than the actual number (M), and as the number of models increases, the disparity between the two widens considerably. For the full 24-member ensemble, this leads to an Meff that, depending on method, lies only between 7.5 and 9 when we control for the multimodel error (MME). These results are in good quantitative agreement with those of Jun et al. (2008a,b) and Knutti et al. (2010), who also found that CMIP3 cannot be treated as a collection of independent models.

They therefore address the question that has always puzzled me, how legitimate it is to simply take a bunch of models and average them.

My own worry has always been that we seem to take the average both of ones with a good match to observational results, and ones that give predictions which are way off, and I have never understood why averaging the known bad with the known good could possibly give you more reliable predictions than just using the known good ones.

Their result bears on a different but maybe related question: if there are about one third the number of independent models than we had thought, then we are (at least to some considerable extent) just looking at groupthink when we look at the averages. It makes my puzzlement worse. If we take 8 basically identical models, then add another 16 to them, then take the means of all their predictions, the results will effectively be to weight the results that the 8 deliver, but without any justification.

Why are we not throwing out the failing models totally, and only using one of the identical ones?

The whole process seems completely illegitimate. Any other area of science this would never fly. Do you agree? I would also be grateful for any comments Nick Stokes has on this matter.

Reply to  michel
February 19, 2022 1:36 am

“how legitimate it is to simply take a bunch of models and average them”
Not particularly. But who does it? Can you quote? Generally IPCC etc present a spaghetti plot of trajectories. Sometimes someone might draw in a mean or median curve. 

On the other hand, having a number of different model results obviously does tell you more than having just one. There has to be some way of making use of that extra information. But I don’t think many people jst take a simple average of a subset.

“Why are we not throwing out the failing models totally”
Well, you don’t know which they are. People here like to make that judgement based on agreement with surface temperature over a few years of a prediction span. But first there is much more to model output than surface temperature. And second, models do not claim to forecast weather, up to say ENSO duration, so it is not an appropriate basis for ruling models out.

Reply to  Nick Stokes
February 19, 2022 3:51 am

“how legitimate it is to simply take a bunch of models and average them

Not particularly. But who does it? Can you quote? Generally IPCC etc present …

I’m sure “michel” has other examples, but my most recent example for the IPCC doing this is in the latest AR6 (WG1) report.

In section 1.4.1, “Baselines, reference periods and anomalies”, on page 1-54 :

In AR6, 20-year reference periods are considered long enough to show future changes in many variables when averaging over ensemble members of multiple models, and short enough to enable the time dependence of changes to be shown throughout the 21st century.

michel
Reply to  Mark BLR
February 19, 2022 1:00 pm

The examples I had in mind were the spaghetti charts with, as Nick says, a mean line superimposed.

But Nick’s reply makes me scratch my head even more. If its really true that we don’t pick the good ones and throw the others out because we don’t know which are the good ones…? We really don’t know enough to be able to reject any of the 24 in the cited paper?

It makes sense, its an excellent reason for not doing it, if you really do not know. But the implication of that is surely that the range of uncertainty is far bigger than I had thought climate scientists believe it to be. I mean, if the hottest forecasts are as good as the coolest ones, because we don’t know enough to tell which model is better, then we are in much more of a mess about policy than any of the alarmed admits.

Is there any other area of science and public policy where we find this situation? Where we have a huge range of outcomes, from the catastrophic to the minor problem, and after 30 years or so of trying to model the situation still cannot reject any of them? Maybe there are, but are there any of these in which the established view is that we should act on the catastrophic forecasts.

I mean, this is the precautionary principle in action, it would be arguing something like, we have these models, we have no idea which if any is right, but a few of them, as far as we know as good as the others, shows disaster coming unless we do X, so we have to do it, because the payoff if we are wrong is so huge.

Very hard sell to an increasingly skeptical electorate….

Dave Fair
Reply to  Willis Eschenbach
February 20, 2022 12:48 pm

Some time ago Dr. Judith Curry asked for some input to a presentation she was preparing for a group of attorneys. I suggested something along the lines of “Climate models are not sufficient justification for fundamentally altering our society, economy nor energy systems.” She used the idea.

Reply to  michel
February 21, 2022 5:11 am

If its really true that we don’t pick the good ones and throw the others out because we don’t know which are the good ones…? We really don’t know enough to be able to reject any of the 24 in the cited paper?

Apparently it depends on the precise sub-parameter being considered, and AR6 does highlight the use of “expert judgement / assessment” more than the IPCC did back in 2013 with AR5.

Section 1.5.4 of AR6 (“Modelling techniques, comparisons and performance assessments”, pages 1-89 to 1-97) starts with the admission that : “Numerical models, however complex, cannot be a perfect representation of the real world.”

Sub-section 1.5.4.8, “Weighting techniques for model comparisons”, ends (on page 1-97) with :

The AR5 quantified uncertainty in CMIP5 climate projections by selecting one realization per model per scenario, and calculating the 5–95% range of the resulting ensemble (see Chapter 4, Box 4.1) and the same strategy is generally still used in AR6. Broadly, the following chapters take the CMIP6 5–95% ensemble range as the likely uncertainty range for projections, with no further weighting or consideration of model ancestry and as long as no universal, robust method for weighting a multi-model projection ensemble is available (Box 4.1, Chapter 4). A notable exception to this approach is the assessment of future changes in global surface air temperature (GSAT), which also draws on the updated best estimate and range of equilibrium climate sensitivity assessed in Chapter 7. For a thorough description of the model weighting choices made in this Report, and the assessment of GSAT, see Chapter 4 (Box 4.1). Model selection and weighting in downscaling approaches for regional assessment is discussed in Chapter 10 (Section 10.3.4).

– – – – – – – – – –

Box 4.1, “Ensemble Evaluation and Weighting”, can be found on pages 4-21 to 4-24.

The first paragraph “clearly” states :

AR5 used a pragmatic approach to quantify the uncertainty in CMIP5 GSAT projections (Collins et al., 2013). The multi-model ensemble was constructed by picking one realization per model per scenario. For most quantities, the 5–95% ensemble range was used to characterize the uncertainty, but the 5–95% ensemble range was interpreted as the 17–83% (likely) uncertainty range. The uncertainty was thus explicitly assumed to contain sources not represented by the model range. While straightforward and clearly communicated, this approach had several drawbacks.

NB : I’m nor personally convinced at just how “clearly” that particular aspect was “communicated” … especially by journalists, invited “opinion piece” writers, and editors in the MSM.

Box 4.1 also includes the following … “interesting” (?) revelations :

Another important consideration concerns the potential weighting of model contributions to an ensemble, based on model independence, model performance during the historical period, or both. Such model weighting (in fact, model selection) was performed in the AR5 for projections of Arctic sea ice (Collins et al., 2013), but that particular application has subsequently been shown by Notz (2015) to be contaminated by internal variability, making the resulting weighting questionable (see also Stroeve and Notz (2015)). For a general cautionary note, see Weigel et al. (2010). Approaches that take into account internal variability and model independence have been proposed since AR5 (Knutti et al., 2017; Boe, 2018; Abramowitz et al., 2019; Brunner et al., 2020).

There are hence good reasons for basing an assessment of future global climate on lines of evidence in addition to the projection simulations. However, despite some progress, no universal, robust method for weighting a multi-model projection ensemble is available, and expert judgement must be included, as it did for AR5, in the assessment of the projections. The default in this chapter follows the AR5 approach for GSAT (Collins et al., 2013) and interprets the CMIP6 5–95% ensemble range as the likely uncertainty range.

The constrained range of GSAT change is useful for quantifying uncertainties in changes of other climate quantities that scale well with GSAT change, such as September Arctic sea-ice area, global-mean precipitation, and many climate extremes (Cross-Chapter Box 11.1). However, there are also quantities that do not scale linearly with GSAT change, such as global-mean land precipitation, atmospheric circulation, AMOC, and modes of variability, especially ENSO SST variability. Because we do not have robust scientific evidence to constrain changes in other quantities, uncertainty quantification for their changes is based on CMIP6 projections and expert judgement. For the assessment for changes in GMSL, the contribution from land-ice melt has been added offline to the CMIP6 simulated contributions from thermal expansion, consistent with Chapter 9 (see Section 9.6).

Again, you have to read the full AR6 (WG1) report … well, the “Subject to Final Edits” version, at least … to find them, but there are more admissions about the “expert judgements” being made by the IPCC than those so “clearly” stated in AR5.

NB : Not many can be found in the SPM though (entering either “expert” or “judgement” into my PDF file reader application’s “Find … [ Ctrl + F ]” function returned “Not found” error messages for that file).

nobodysknowledge
Reply to  michel
February 19, 2022 3:28 am

I have wondered why models don`t bother to get the surface temperature right, We have learnt that they have a great bias, even the model bunch average. If this is wrong the initial values for calculations of change must be wrong. Temperatures are governing much of the climate processes, such as evaporation, water vapor, cloud dissipation etc.

nobodysknowledge
Reply to  nobodysknowledge
February 19, 2022 5:14 am

Some estimates of measured absolute temperatures and model average and spread. Arbitrary chosen time.
From ncdc/noaa. https://www.ncdc.noaa.gov/sotc/global/201805
«The May 2018 combined average temperature over the global land and ocean surfaces was 0.80°C (1.44°F) above the 20th century average of 14.8°C (58.6°F).»
Global Climate Report – May 2018
This results in an average temperature in May 2018 at 15,6 degC
Eyeballing the 12 models at Clive Best gives the temperatures of approximate 16,6 – 16,4 – 16,3 – 15,7 – 15,5 – 14,9 – 14,5 – 13,9 – 13,5 – 13,2 – 12,9 – 12,7. This gives a model average in May 2018 at 14,7 degC. If this is representative, models are at present about 1 degC colder than measured temperatures.
http://clivebest.com/blog/?p=8788&amp;

Alasdair
February 19, 2022 3:57 am

Most grateful Willis. With my programming knowledge at zilch and at 86 have forgotten most of the maths, I rely on my College Notes which I still have from the days of my training in the RN and steam propulsion. The Navy took great care to ensure their Engineer Officers were well trained before letting them loose on the Fleet.

These notes totally trash any credibility in these climate models, where the Mindset involved appears oblivious to reality, with attached dubious motivations.

The one thing that sticks up like a sore thumb is the fact that the oceans never get much above 30°C in spite of millions of years of relentless solar radiation.
I’m tussling myself to explain that and find that two different math programs produce two different graphics. It’s knocked me sideways; but still stick with my hypothesis that the Hydrological Cycle is the prime influence in the moderation and control of the Earth’s emery balance. Proving it is a very different matter.
After all the oceans comprise some 72% of the Earth’s area and if you include the close water/atmosphere interface in the plant world where the same science applies? you wind up with an area greater than that of the Earth itself.

For info: The engineering toolbox site provides a wealth of information and makes you realise how complex the practicalities are; particularly if one is trying to prove something.

Lars Kamél
February 19, 2022 4:47 am

As a programmer myself, I know that a computer program developed this way and being that large, is probably full of undetected bugs.
It would be interested if someone analysed the code of the Russian climate model, INMCM, the only model that doesn’t seem to be a complete failure. But that code maybe isn’t available?

Forrest
February 19, 2022 5:13 am

Since I actually have to wrote code for the real world – I cannot tell you how often ‘reality’ versus expectation has been different.

Truth is. No matter how the data looks before I decide to act on it, rather than betting the farm that all is well. I TEST IT FIRST.

How do I test. I create a controlled set of potential outcomes based on my model with a limited range of acceptable results and then I see if the test comes back within the ascribed parameters.

I would say right now I am batting around 75% – better than a coin flip but still… Not that great.

Can CO2 increase temperature on the Earth via the narrow band of radiation that is being absorbed? Yes. Is it? That is the more difficult and chaotic question. I could argue that increased use of water for agricultural purposes has a mare damning effect BUT that would not have the same… control aspects from government.

Also – there are a great number of potential solutions to even the issue of releasing CO2 into the air that would at least make sense. Why is it only solar – wind – and geothermal that are acceptable. Nuclear is a viable potential source of energy that is constantly disregarded as a good power source – is it problem free? Nope but neither is wind mills etc and so on.

Curious George
Reply to  Forrest
February 19, 2022 9:30 am

As a guy in charge of numerically controlled machines told me, “Programming is easy. Signing a production order is difficult.”

Brent Wilson
February 19, 2022 7:53 am

Happy Birthday and all the best to you and yours, Willis.

I thank you for all your hard work and voluminous essays. You and the others at WUWT have been an invaluable resource in my, and millions of others, education on all things Climate Related.

My Highest Respects,

Brent

Rick K
February 19, 2022 8:14 am

Willis, this is just a short note of appreciation. Oh, and Happy Birthday, by the way! (Have many more please).

Your posts, among the great ones here at WUWT, are among my most cherished. Not only do I value WHAT you think… but also HOW you think.

You often bring us with you as you approach a problem and though I lack many of your mental skills, I certainly learn from them.

All the best to you and yours.

Dan Hughes
February 19, 2022 8:40 am

Willis, a few quotes and comments:

Quote: For an additional difficulty factor, as with many such programs, it’s written in the computer language FORTRAN … which was an excellent choice in 1983 when the MuddleE was born but is a horrible language for 2022. 

Somewhat of a generalization. What specific aspects of the Reference Specifications for Fortran make it “a horrible language for 2022” ? I think Fortran 2018 (ISO/IEC 1539-1:2018) / 28 November 2018 is the latest release. What specifics in that Standard make it horrible for use in 2022?

Given that FORTRAN was an acronym for FORmula TRANslation you might think its a good approach for industrial strength engineering and scientific computing.

Quote: How much has it grown? Well, not counting header files and include files and such, just the FORTRAN code itself, it has 441,668 lines of code … and it can only run on a supercomputer like this one.

What matters in the choice of a language is determined generally by the application of that language by those who construct the coding. Of course there are higher levels of filtering languages for use; R and Basic, for examples, I think are not good candidates for industrial-strenght scientific and engineering computing. Some of the important aspects of the code as constructed include maintainability, extensibility, and readability relative to independent verification that the coding agrees with the specifications. Well-structured code, with well-considered data-structures, can be written in almost any language. Unusable/unreadable code can be written in a language that promotes structure.

Lines of Code (LoC) in and of itself is a metric that has no merits. A “Supercomputer” is the machine of choice due to matters not associated with LoC. Things like clock speed, parallel capabilities, turn-around time for completion of an analysis, attached storage, . . . 

Quote: • Iterative models are not to be trusted. Ever.

It’s not clear what “trusted” means in this context. For solving non-linear equations, or systems of non-linear equations, there is no other option. Even large systems of linear equations, iterative methods are sometimes employed to handle the matrices involved.

Quote: So regarding programming, I know whereof I speak.

The first four paragraphs filling this statement. I’m not going to make a quote for all those words.

Firstly, not to get bogged down in nomenclature, but ‘iterative’ I think has a specific meaning in numerical mathematics. The GCMs are formulated as an Initial Value Boundary Value Problem. As such, the solution methods generally march in time from the initial time to the final time of interest, using discrete values of the time step. Iteration on the other hand generally implies that a fixed equation, or system of equations, are non-linear and iteration is used to solve the fixed system.

The GCM solution method might be a one-shot through for a time step, or at a time step a systems of non-linear equations might be iteratively solved. I suspect GCMs use the former one-shot through. Even in that case, there might be modeling that requires solution of non-linear equations, and for those an iterative method likely will be used. [ You have already solved all non-linear equations that have analytical solutions while you were in undergraduate school 🙂 ]

In the latter case, there are two iterative processes underway; the method for the general equations and that for a sub-model requiring iteration.

So, whatever we call it, iterative methods and time-stepping methods do indeed use previously calculated information to get the next estimate. However, use of that procedure in and of itself says absolutely nothing about the validity or lack thereof of the calculated results.

The real world being non-linear, it is highly likely that many scientific and engineering computer calculations use iterative methods for all kinds of applications that effect our lives.

There are vast literatures over centuries associated with numerical solutions of equations; I think Cauchy and Euler and Newton and Guass all dabbled in the stuff.

“Iterative” cannot be simply and categorically dismissed out of hand 

Quote: There are a couple of very large challenges with iterative models. First, as I discussed above, they’re generally sensitive and touchy as can be. This is because any error in the output becomes an error in the input. This makes them unstable.

Sensitive and touchy as can be are again so general and non-specific that this concern holds little meaning. The objective of iterative methods is in fact to reduce the difference between the input from the previous iteration and the output from the current iteration. The difference is generally driven down to machine precision, or very close to that; several digits, at least.

This makes them unstable. The use of time-stepping in and of itself does not in any way imply instability. The errors made at a given time step are truncation errors and round-off errors. The former is by far the most important when the IEEE 754 64-bit arithmetic standard is used: 11-bit exponent, 52-bit fraction. That standard includes also special handling of some of the usual pathology situations that can be encountered when finite-precision arithmetic is used. 

If applications indicate that round-off errors are a concern, some Fortran compilers can handle 128-bit representations. Special coding can sometimes also be constructed that minimizes specific identified round-off problems. Round-off error generally does not grow bit-by-bit (in the digital bit sense) as the number of evaluations increase so to get to the point that round-off affects say the 5th or 6th digit generally requires massive numbers of evaluations. Sometimes round-off errors become random in nature so that no fixed growth or decay occurs.

Stability, or instability, is determined by the specific mathematical formulations used for the numerical solution methods; not the use of time-stepping.

Dan Hughes
Reply to  Willis Eschenbach
February 19, 2022 11:55 am

Willis, I focused on numerical solution method errors. Not any of the multitude of unrelated ailments that can inflict software.

You might find the following to be fun exercises.

Dan

A simple direct fun introduction look into truncation and round-off errors.

Here’s an exercise that can be carried out in R or any other language.

Numerical integrate

dT/dx = 1 – T^4

for various numerical integration methods, values of step size, and finite-precision. The explicit Euler method is straightforward and easily coded, for example, or use any of your favs. Or, roll your own in any language and any numerical integration you love.

This equation is interesting because the numerical values of the truncation terms can be calculated. The magnitude of each truncation-error term can be compared with the magnitude of the numerical solution for each x. And also with 1 which represents the constant throughput of the modeled process.

The steady state solution is T_ss = 1. There is an analytical solution that gives T as an implicit function of x: Given x you can get a numerical estimate for T by finding the zero of

x – F(T) = 0

As the step size is refined, the difference between either (1) successive values of T using two different values of the step size, or (2) the difference between the current value of T and the numerical estimate from solution of the above equation will decrease. That’s truncation error.

If R has a facility for setting the finite precision representation of number, check a couple or few of those as well; 4-bytes, 8-bytes, mo-bytes.

What you’ll see is that:

(1) the greatest differences between the numerical and analytical solutions occur near the region of non-linear changes in T. Truncation-error is bigger when the method does not give you a good estimate of the gradient.

(2) for sufficiently small step size and long final end time you might see the effects of round-off kick in. That is, continue to integrate for long times after T reaches 1.0 and observe the value of T. Display lots o’ digits; display all that are consistent with the finite precision. After decreasing as step size is refined, the difference might hit a minimum and begin to increase. How many evaluations are needed to hit the minimum? What does the round-off error look like after becomes visitable? What is the magnitude of the sum of the truncation and round-off errors for many, many many evaluations. What is the number of digits that are not affected by round-off? 

(3) higher precision arithmetic will not change the truncation error, but will delay appearance of the effects of round-off.

(4) calculate the discrete values of x by a) incrementing x like x_now = x_pre + step_size, and b) x = istep * step_size. Do this for different precision; 4-bytes, 8 bytes, extended precision. Note that errors in x will affect errors in the iterative solution of the analytical solution.

(5) what are the effects of the stopping criterion (eria) applied to the implicit analytical solution.

(5) do all of the above using variations of the Euler method, or any other method.

This exercise can be easily carried out for a multitude of ODEs that have analytical solutions, both linear and non-linear (more of the former and fewer of the latter, those being forms that are missing the independent variable like the example). 

Then check out some simple PDEs.

Dan Hughes
Reply to  Willis Eschenbach
February 19, 2022 12:34 pm
Curious George
Reply to  Willis Eschenbach
February 20, 2022 2:56 pm

At the first glance, the twin assignments status = nf_xxxx in lines 21, 22 and 28,29 suggest that a side effect of the nf_xxxx call is being utilised. A very unstructured practice.

c1ue
February 19, 2022 8:42 am

Happy Birthday Willis!

Beta Blocker
February 19, 2022 9:05 am

Back in November of 2021, flooding in Washington State was being attributed by the governor and the press to climate change. Cliff Mass at the University of Washington disputed those claims in an article on his blog:

‘Were the Sumas Floods Caused by Global Warming? The Evidence Says No.’
https://cliffmass.blogspot.com/2021/11/were-sumas-floods-caused-by-global.html

Having spent part of my career in the nuclear industry as a QA auditor, including software quality assurance auditing, I wrote the following two comments in response to his article:

Part One of a Two-Part Comment, posted November 23 2021:
————————————————————————————————-

Cliff Mass said in an earlier article posted on this blog concerning weather whiplash: “I am involved in regional climate simulations, using an ensemble of high-resolution projections driven by an ensemble of many global climate models. This is the gold standard for such work.”

In the nuclear industry, the software and the data used to directly support a technical decision which will be undergoing a safety analysis review by an independent authority such as the NRC must be developed and managed under strict quality assurance guidelines.

For a process simulation model in the nuclear world, the model’s software code — plus the data the model acquires, creates internally, or produces as outputs — are all considered essential components of a single unitary system. It’s all One Thing.

For any single model run which is being cited in a nuclear safety analysis, a snapshot of the entire modeling system which produced that run must be frozen in time and a copy of it placed into a historical archive as ‘record material’ which can be examined later by an auditor.

If an ensemble of model runs is being cited, every individual model run in the ensemble must be archived in a way which allows it to be individually retrieved for later examination, and which allows the original ensemble to be recreated as a whole at some later time.

The material which must be documented and archived for later reference includes:

— The modeling system’s design at the time the specific model run was produced, including a description of the methods used to develop both the software code base and the data which the system processes.
— Copies of the input data plus an inventory of any physical or technical assumptions which might be implemented in lines of software code as opposed to being read as a data input file or being created internally on the fly as the model run progresses.
— The criteria by which any specific model run is being evaluated as either suitable or unsuitable for the purposes it is intended to serve. In other words, do we accept the results of the model run; and if so, why do we accept those results?

Moreover, the suitable-versus-unsuitable evaluation criteria might change from run to run. So it is important to keep a precise record of what specific evaluation criteria is being applied to which specific model run.

As one can imagine, this is an expensive and time-consuming proposition — because the very nature of a software-driven simulation system is that both the software and the data may change as the driving assumptions change. What is being done in the nuclear industry to document these changes is the exception, not the norm.

Now we get to the point of this comment. For the regional climate simulations being done by Cliff Mass at the University of Washington, I as a nuclear type professional — someone whose work situation is heavily influenced by a variety of strict QA requirements — would ask these questions:

1) Do the State of Washington’s records management requirements apply in some way to the software and the data used in UW’s climate simulations?
2) Is there a quality assurance program of some kind in place for developing, maintaining, and managing UW’s climate simulation software and associated data?
3) Is the criteria for evaluating the output of each UW model run being recorded such that a specific set of criteria can be precisely matched to each run?
4) For any specific UW model run which employs the output from global climate models produced by other climate scientists not associated with UW, is that output being archived along with UW’s own climate simulation data and software?

Part Two of my two-part comment will concern the use of climate simulation model runs as experimental observational evidence — in lieu of direct physical observation — for the Soden-Held water vapor feedback amplification theory of global warming.

Part Two of a Two-Part Comment, posted November 26, 2021:
—————————————————————————————————-

Let’s talk about the Soden-Held water vapor feedback amplification theory of global warming. This theory is central to estimating how sensitive the earth’s atmosphere is to increasing concentrations of greenhouse gases, principally CO2. Soden & Held’s theory offers an explanation as to how CO2 can ‘punch above its weight’ so to speak and produce warming effects well beyond CO2’s base effect of a 1.2C – 1.5C increase from of a doubling of CO2 concentration.

Water vapor is the principal GHG in the earth’s atmosphere. According to the Soden-Held theory, increased warming at the earth’s surface occurring as a consequence of CO2’s base GHG effect enables the atmosphere to hold more water vapor than it otherwise would. This has the ultimate effect of amplifying CO2’s base level warming well beyond what an increasing concentration of CO2 could accomplish by itself.

It isn’t currently possible to directly observe the Soden-Held temperature amplification mechanism operating in real time inside the earth’s atmosphere, in the same way we would observe an amplification mechanism operating inside an electronic circuit on a test bed in a laboratory. The presence and characteristics of such a mechanism, if it actually exists, must be inferred from other kinds of observations.

Because their postulated amplification mechanism cannot be observed directly, Soden & Held use output from the climate models as one source of data among several in estimating the theoretical sensitivity of earth’s climate system to the continuous addition of CO2 and other carbon GHGs to the atmosphere. These model runs are being employed as if they were physical experiments. The results of the model runs are being used as if they were physical observations recorded in the course of conducting a true physical experiment.

I’ve previously discussed the rigorous quality assurance requirements which apply to simulation systems used in the nuclear industry.

Because a model run of any simulation system is being employed as if it was a physical experiment, the documentation used for nuclear industry simulation systems is the equivalent of a highly detailed laboratory notebook which records the purpose of the simulation, how it was conducted, what its results were, and the criteria by which the results of the model run were being evaluated as either suitable or unsuitable for the purposes that run was intended to serve.

Cliff Mass: “I am involved in regional climate simulations, using an ensemble of high-resolution projections driven by an ensemble of many global climate models. This is the gold standard for such work.”

The IPCC has a web site which gives their guidance on the proper use of data, and which also includes a short article concerning the limitations of the General Circulation Models (GCMs):

IPCC guidance on the use of data: https://www.ipcc-data.org/guidelines/index.html

The limitations of GCMs: https://www.ipcc-data.org/guidelines/pages/gcm_guide.html

Referring to the IPCC articles, different GCMs may simulate quite different responses to the same forcing, simply because of the way certain processes and feedbacks are modeled. Moreover, the models are often parameterized; i.e., estimates of the physical effects of atmospheric processes are often being employed, as opposed to precisely descriptive process physics. This results in some level of uncertainty in a GCM’s modeled output.

The modeling of clouds and water vapor is an area of uncertainty where relatively small differences in the parameterization values can result in large differences in the model’s results.

So I would ask this question: For an ensemble of model runs, should there not be documentation as to how the various parameterizations used in each component model run compare with each other? Moreover, is the evaluation criteria for the ensemble as a whole different in some way from that used for each individual model run within the ensemble?

==================

Footnote, February 19th, 2022: Only one response was made to my comments. It came from a blog reader who said, “What?!!! Climate simulations are not safety analysis. The nuclear business is building potentially dangerous equipment for which it has control over the design. Archiving is for legal purposes.”

Bill Rocks
Reply to  Beta Blocker
February 19, 2022 11:25 am

 I appreciate your discussion.

Furthermore, I assert that using the output of these GCMs as the reason to destroy much of the world’s energy infrastructure and replace it with unreliable wind, solar and means not yet in existence, is, indeed, a massive safety problem.

Beta Blocker
Reply to  Bill Rocks
February 19, 2022 6:10 pm

In addition to working software QA, a portion of my long career in nuclear — about fifteen years out of thirty-five years — was spent writing software code for a variety of odd and sundry purposes.

So I am familiar with IBM assembler, JCL, FORTRAN, COBOL, BASIC, Pascal, complex SQL queries against DB2, Oracle, MS SQL Server, Sybase, and Informix databases, and 4GL’s such as NOMAD and FOCUS. I play with R occasionally and find it to to be a really fun language to work with.

I’ve seen any number of software development methodologies and philosophies come and go. My favorite was RAD for ‘Rapid Application Development’.

Why? Because it seemed like such a great acronym for use in a nuclear industry software development project.

That said, as long as you are using a disciplined approach for designing and writing software code, and as long as you are thoroughly documenting what it is you are doing, it doesn’t make a whole lot of difference which of these philosophies and methodologies you use.

Peter
February 19, 2022 9:37 am

Happy 75 Willis.

I suspect one result of your article will be a rapid edit from the model of comments using words and phrases such as: fix, keeps the, tuning knob, etc.

Jim Berry
February 19, 2022 10:30 am

Great article. That model looks like a giant make work project. I think it would be more correct if they called them mimics instead of models.
one question- is iterative the correct term for this kind of program? I always thought it was a way to solve complex problems with many equations by using guesses and solving by adjusting the guesses (after moving everything to one side so that all equations equaled zero) until all equations equaled zero. As done in the declarative programming tool TKSolver.

RayG
February 19, 2022 10:51 am

The fundamental problem with the GCMs is that they have never been subjected to Verification and Validation. Those who are not familiar with the process can find an excellent description on the Mitre web site by pointing your favorite web browser at Mitre Verification and Validation of Simulation Models.

The last time that I looked the FAA had over 20 volumes covering the V and V of simulation models used in the design, building and operation of commercial aircraft. It is insane to set societal goals such as “NetZero” and it family based on simulation models that are kluges that have never been put through the V and V wringer.

Curious George
Reply to  RayG
February 20, 2022 2:42 pm

Ray, the CESM model has been “scientifically validated”, whatever it means.

February 19, 2022 10:57 am

Happy Birthday Willis! Thank you for years of enlightening articles – my IQ goes up with every article of yours I read!
You’re a model man of learning; creative, learned and wise, but probably most importantly: humble. Ready to admit mistakes and open to criticism. That’s how science progresses.
Thanks Willis!

Cent’anne!
(My written Italian is horrible, I’m trying to write “100 years!” May you reach 100 years!)

February 19, 2022 11:07 am

Willis, having some experience of programming as well as hardware design myself, I congratulate you on this fine analysis of the climate model codswallop. I have made similar observations myself, albeit not as detailed, and watched people’s eyes glaze over. All the kludges you mention are defined as forcing a solution in math or logic programming. A forced solution is obviously not an unbiased or reliable function — I know you know this, it’s an observation for the general reader. These models are forced to give the pre-determined result that CO² is the cause of all evil things.

The state of climate modeling is precisely the case observed by a notable scientist (I forget who) who commented, “give me 4 variable parameters and I can fit an elephant thru the eye of a needle. ” climate models have way more than 4 parameters. They are based on WAGs, not even SWAGs. Acronym decode: SWAG = Scientific Wild Assed Guess.

Bill Rocks
February 19, 2022 11:37 am

Your analysis is very welcome and appreciated. Your expertise and infectious curiosity are remarkable. I have been curious about the internal workings of the GCMs but not up to the task of looking for myself, at this time.

The next time I am told that they are based upon the physics, there will be this insightful and well-written essay to recommend.

Happy Bday.

This comment from a “dinosaur”: Alcom, Algol, Fortran 4 – circa 1960s.

February 19, 2022 2:10 pm

I have never and never will write a computer program, if only to spite Biden and his inane comments about learning to code.

But thanks for this article pointing just how ridiculous these models are
To respond to clowns like Mann and Dessler maybe you should go on Joe Rogan’s podcast and just spell all these items out onscreen and then invite the Scientologists to point out what you’ve got wrong.

This stuff has to be seen and done in public to make a difference, Rogan has 11 million followers, about 10.5 million more than the cbc here in canada

Steen Rasmussen
February 19, 2022 4:03 pm

Here in the redwood forest, it’s my birthday”

Congratulation Willis! and thank you for sharing so many toughts and fine analysis!

kind regards
SteenR

February 19, 2022 5:45 pm

So I thought I’d wander through the GISS model and see what I could find. 

Willis, do you have a link to the source code?
The ones on the NASA website dont work for me anymore

anna v
Reply to  Willis Eschenbach
February 20, 2022 12:50 am

I seem to be saying this to somebody else so, a repeat:Happy Birthday Willis, may you grow to 100 as the wish is in greece, with all your faculties intact , including the will to find the truth. I have enjoyed your posts through the years.

Reply to  Willis Eschenbach
February 20, 2022 2:28 am

That’s where I’ve been trying to get it from but I’ve been getting a connection refused message.

Mike Edwards
February 19, 2022 8:48 pm

FORTRAN … which was an excellent choice in 1983″

No, by 1983 there were already better alternative languages available. FORTRAN was miserably outdated by then and was not used much by serious programmers. It retained a following in various scientific disiplines mostly due to inertia – it was the language many scientists had been trained in.

anna v
Reply to  Mike Edwards
February 19, 2022 10:42 pm

Happy Birthday Willis, may you grow to 100 as the wish is in greece, with all your faculties intact , including the will to find the truth.

February 20, 2022 2:11 am

Happy Birthday Willis!

ferdberple
February 20, 2022 6:17 am

The climate model are much worse than I thought. Much worse.

Technically, Fortran was a terrible language because it equates zero and null. I once inherited a client with an accounting system written in Fortran that contained one of these errors.

It came as quite a shock to the client to learn their bottom line figure had been wrong for years. They actually asked that I reinstall the error, because the new value looked so bad.

Every procces should halt on error or capture the error in a log for analysis.

Climate Muddle E is not a serious programming effort. It really needs some standards body to take a look at this.

Imagine sending a 10 billion telescope into space, and some programmer hard coding a resset of negative values to zero because they were impossible.

jono1066
February 21, 2022 1:09 am

You missed Jean off your list of languages ?