
Worldwide restrictions during the COVID-19 pandemic caused huge reductions in travel and other economic activities, resulting in lower emissions. Seen here, almost-empty highways in Colombia during the pandemic. Credits: International Monetary Fund
Earth’s atmosphere reacted in surprising ways to the lowering of emissions during the pandemic, showing how closely climate warming and air pollution are linked.
The COVID-19 pandemic and resulting limitations on travel and other economic sectors by countries around the globe drastically decreased air pollution and greenhouse gas emissions within just a few weeks. That sudden change gave scientists an unprecedented view of results that would take regulations years to achieve.
A comprehensive new survey of the effects of the pandemic on the atmosphere, using satellite data from NASA and other international space agencies, reveals some unexpected findings. The study also offers insights into addressing the dual threats of climate warming and air pollution. “We’re past the point where we can think of these as two separate problems,” said Joshua Laughner, lead author of the new study and a postdoctoral fellow at Caltech in Pasadena, California. “To understand what is driving changes to the atmosphere, we must consider how air quality and climate influence each other.”
Published Nov. 9 in the Proceedings of the National Academy of Sciences, the paper grew from a workshop sponsored by Caltech’s W.M. Keck Institute for Space Studies, led by scientists at that institution and at the Jet Propulsion Laboratory in Southern California, which is managed by Caltech. Participants from about 20 U.S. and international universities, federal and state agencies, and laboratories pinpointed four atmospheric components for in-depth study: the two most important greenhouse gases, carbon dioxide and methane; and two air pollutants, nitrogen oxides and microscopic nitrate particles.
Carbon Dioxide
The most surprising result, the authors noted, is that while carbon dioxide (CO2) emissions fell by 5.4% in 2020, the amount of CO2 in the atmosphere continued to grow at about the same rate as in preceding years. “During previous socioeconomic disruptions, like the 1973 oil shortage, you could immediately see a change in the growth rate of CO2,” said David Schimel, head of JPL’s carbon group and a co-author of the study. “We all expected to see it this time, too.”
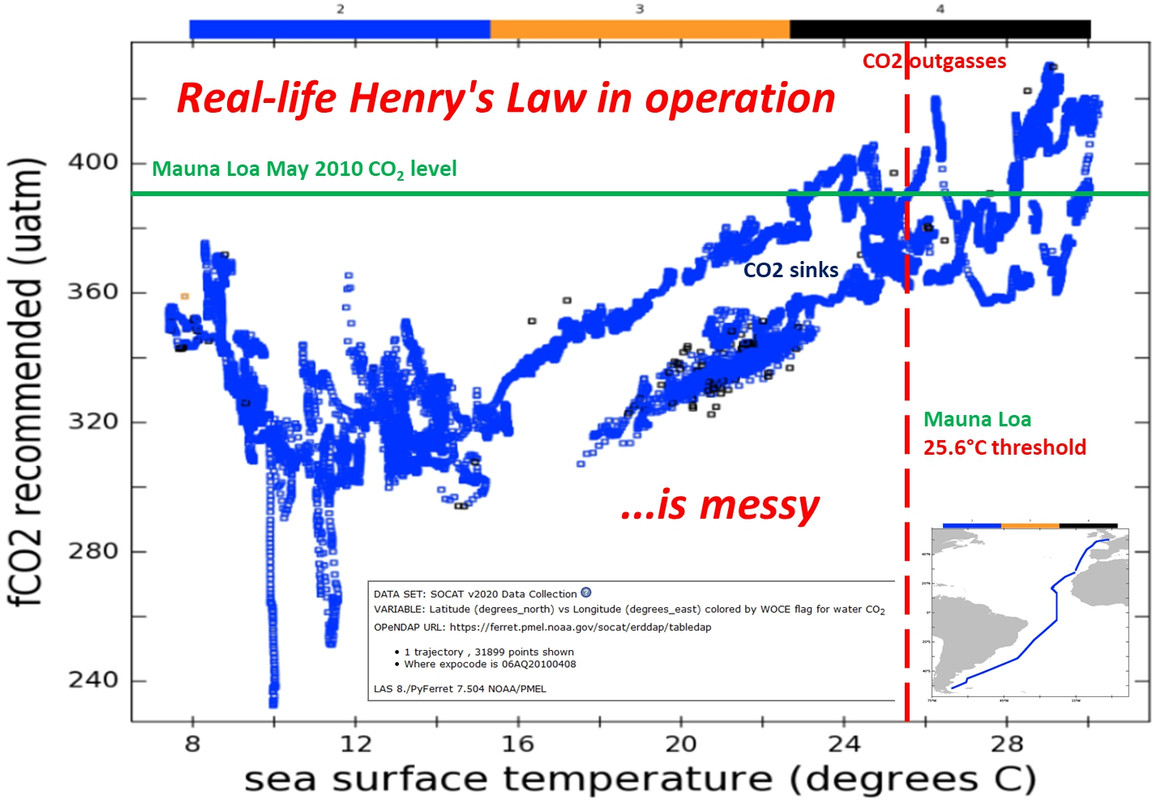
Using data from NASA’s Orbiting Carbon Observatory-2 satellite launched in 2014 and the NASA Goddard Earth Observing System atmospheric model, the researchers identified several reasons for this result. First, while the 5.4% drop in emissions was significant, the growth in atmospheric concentrations was within the normal range of year-to-year variation caused by natural processes. Also, the ocean didn’t absorb as much CO2 from the atmosphere as it has in recent years – probably in an unexpectedly rapid response to the reduced pressure of CO2 in the air at the ocean’s surface.
Air Pollutants and Methane
Nitrogen oxides (NOx) in the presence of sunlight can react with other atmospheric compounds to create ozone, a danger to human, animal, and plant health. That’s by no means their only reaction, however. “NOx chemistry is this incredibly complicated ball of yarn, where you tug on one part and five other parts change,” said Laughner.
As reported earlier, COVID-related drops in NOx quickly led to a global reduction in ozone. The new study used satellite measurements of a variety of pollutants to uncover a less-positive effect of limiting NOx. That pollutant reacts to form a short-lived molecule called the hydroxyl radical, which plays an important role in breaking down long-lived gases in the atmosphere. By reducing NOx emissions – as beneficial as that was in cleaning up air pollution – the pandemic also limited the atmosphere’s ability to cleanse itself of another important greenhouse gas: methane.
Molecule for molecule, methane is far more effective than CO2 at trapping heat in the atmosphere. Estimates of how much methane emissions dropped during the pandemic are uncertain because some human causes, such as poor maintenance of oilfield infrastructure, are not well documented, but one study calculated that the reduction was 10%.
However, as with CO2, the drop in emissions didn’t decrease the concentration of methane in the atmosphere. Instead, methane grew by 0.3% in the past year – a faster rate than at any other time in the last decade. With less NOx, there was less hydroxyl radical to scrub methane away, so it stayed in the atmosphere longer.
Lessons From the Pandemic
The study took a step back to ask what the pandemic could teach about how a lower-emissions future might look and how the world might get there.
Notably, emissions returned to near-pre-pandemic levels by the latter part of 2020, despite reduced activity in many sectors of the economy. The authors reason that this rebound in emissions was probably necessary for businesses and individuals to maintain even limited economic productivity, using the worldwide energy infrastructure that exists today. “This suggests that reducing activity in these industrial and residential sectors is not practical in the short term” as a means of cutting emissions, the study noted. “Reducing these sectors’ emissions permanently will require their transition to low-carbon-emitting technology.”
A number of us predicted that there would be no change of gradient of the Keeling curve as a consequence of the lockdowns etc. Some of us argued that this would be the natural consequence of Henry’s Law continuing to operate. By the way it is rather hard, looking at the Keeling curve for 1973, to find the change in atmospheric CO2 referred to by David Schimel. However, he may be talking about local measurements rather than thoroughly mixed measurements claimed for a remote location like Maua Loa.
I cant see any drop in 73.
The obvious conclusion is that there are undiscovered carbon cycles that dwarf mans production. It is the only answer. We dropped 20% for three months in 2020, 5% in the year. Thats a huge change.
Matthew: There is a little clue in my posting. I suggest you check out Henry’s Law. Sorry about my finger trouble with Mauna Loa.
Peter,
Henry’s Law does not apply to the world oceans due to the basic solution chemical reactions that convert dissolving CO2 in carbonate and bicarbonate ions. At the average pH of Earth’s oceans, (in the range of 8.1-8.2 per https://www.epa.gov/ocean-acidification/understanding-science-ocean-and-coastal-acidification ), these reactions are NOT reversible.
The governing chemical equations are:
CO2 + H2O —> H2CO3
which then forms bicarbonate:
H2CO3 –> (HCO3-) + (H+)
which in turn forms carbonate:
(HCO3-) —> (CO3–) + (H+)
Because Earth’s oceans are highly buffered to remain on the basic side of pH, the H+ ions released in the above sequential reactions are immediately removed by the preponderance of negative-ion species that are present, thereby preventing reaction reversibility.
Reference: https://www.soest.hawaii.edu/oceanography/faculty/zeebe_files/Publications/ZeebeWolfEnclp07.pdf
and its Figure 1 Bjerrum plot.
Henry’s Law of partial pressure (a statement about equilibrium conditions) does not consider chemical reactions between a gas and its solvent.
Yes, and that means that there is more than 50 times the CO2, stored as other ionic species, in parts of the oceans. Admittedly, the whole water column is not in equilibrium with the atmosphere, but there is still a vast store of CO2 in the oceans. The 800 year lag in long term atmospheric CO2 is real, but shorter term changes, as we are seeing now, are lost in the longer, more smoothed CO2 records, as from ice cores.
Gordon,
I think your statement that these reactions are not reversible (as drawn) is misleading, adding reactants to the left hand side of each equation will push the equilibrium to the right but driving an equilibrium by adding matter is not the same as irreversibility. The ocean buffer system is carbonate/bicarbonate, the species that you shown eqns 2 and 3; adding CO2 will increase the concentration of both. I think the ‘irreversibility’ comes about because in addition to the above the carbonate is being withdrawn from the equilibria as insoluble Calcium salts by biological processes.
So the rate of CO2 removal is tied to the basic solution chemical reaction rate. Where does carbon uptake by plankton, etc. fit into the overall CO2 uptake. (It’s never two-dimensional)
“Henry’s Law does not apply to the world oceans…“
Yet measured ocean CO2 does follow Henry’s Law.
Rio is much more believable and honest than the scientistas or researchers that come up with such innuendo spins as portrayed in this article or similar others, as this particular one.
At least Rio is affordable… under the circumstances.
🙂
cheers
WUWT Moderators,
I know that previously it has been stated that WUWT is giving some leeway for Rio to post in the comments section, but now it is wearing thin as it is obviously just repeated spamming for the stated website.
I respectfully request that this spamming be blocked henceforth, as it and its previous appearances under other WUWT articles are in no way postings relevant to the topics at hand.
maybe rio is a paid advertiser?
might explain your statement…
As the saying goes: time will tell.
SCAM ALERT
Spammer is posting this in every thread
“undiscovered carbon cycles”
They’re NOT undiscovered. It’s the terrestrial biosphere. We’ve known it had an overwhelming influence on CO2 levels since 1960, but modelers are convinced man-made CO2 is higher than it is. It must be the deciding factor for Calendar told us so.
“ terrestrial biosphere.” yes, we see the big seasonal change in global CO2 as the NH warms, and life starts to grow, sucking down CO2, we do know about this, is it enough to dwarf mans production though.
Do not forget that water holds about 50 times the CO2 as air, making the oceans a huge CO2 sink and source. CO2 cooks out of warming water at the equator and redissolves in the colder waters near the poles. This is a very dynamic system. We have no effect on this.
“CO2 cooks out of warming water at the equator and redissolves in the colder waters near the poles” Now that is interesting.
CO2 would be a +ve feedback from warming then, albeit slight, since it is ~saturated.
CO2 levels naturally vary by 5 or 6 ppm every year.
The rate at which the average CO2 levels are increasing is increasing by about 1ppm per year.
5% of 1ppm is only 0.05ppm.
Against a backdrop of 1ppm per year, plus noise in the range of 5ppm per year, change of 0.05ppm is going to be invisible.
Since the entire increase in CO2 is attributed to man, a 20% reduction in CO2 over a three month period should show up Mark. There should be a flattening or reduction in the CO2 curve for a quarter of the year, or longer, as even post lockdown economic activity did not return to anywhere near normal.
CO2, NO2, over cities as measured by satellites plummeted.
Yet not CO2.
There are clearly big sinks/sources that are dwarfing mans production. Which means what is the point reducing our CO2 production if it makes no difference?
The ramp-up phase in Winter/Spring is closer to 8 PPM currently. The annual increase is closer to 2 PPM. The “5 PPM” that you are calling noise is actually signal.
Some other of us said the same. But because the number of people on this |Earth continued rising, they contiued eating and farmers continued growing the stuff they ate>
‘some of us‘ continue to celebrate how ‘things are never better‘ because the supply of that stuff went up and continues to go up
Aaaaages ago I tried to do a Henry’s calculation.
By taking, as given by Henry, that every drop of rain that ever falls through any atmosphere containing CO2 (10ppm through 10 million ppm) will hit the ground with a pH of about 5.4
Assuming 1 metre of rain lands on The Ocean every year, I got a figure for rainfall removal of 160 megatonnes per year.
Diddly Squat basically
OK, Visit ebay or your local (fish) pet shop and buy a little pH meter. Also while out-and-about, bring home some bog standard carbonated water.
Put some of that in a clean glass and you will see a pH of about 4.0
Put a loose fitting lid on that glass, keep checking the pH and after 10 days the pH will be exactly pH 7.0
It will. No kidding. Go try it. £5 tops for the pH meter and in the UK, 20 pence for 2 litres of water.
Look what landed here this morning….
https://californiaagnet.com/2021/10/21/measuring-soil-health-easily-and-reliably/
Finally, a nearly flat lappy battery stops me, If water is such a strong GHG, why doesn’t it feed back on itself and roast the Earth
Where is the required negative feedback to stop that happening?
Finally, easy-peasy, strong convection of light H2O vapor plus increasing cloud/albedo = negative feedback!
The same applies to CO2 warming.
Oh, I understand now… winter is due to more clouds.
If no more clouds or less clouds during the winter time, might end up with/as a summer.
“Where is the required negative feedback to stop that happening?“
See Willis’ articles on tropical thunderstorms.
“By the way it is rather hard, looking at the Keeling curve for 1973, to find the change in atmospheric CO2 referred to by David Schimel.”
I was wondering about that. He seemed so sure of himself. I would like to know how he came to that conclusion. No OCO-2 satellite back in 1973.
It merely confirms that increasing CO2 it is not caused by human emissions.
https://scc.klimarealistene.com/2021/10/new-papers-on-control-of-atmospheric-co2/
Let’s go COP-26!
According to the alarmists, the oceans have warmed up by about 0.03C over the last 20 to 30 years.
How much could the oceans have warmed during the past year?
How much CO2 would one years worth of warming drive out of the oceans?
“Also, the ocean didn’t absorb as much CO2 from the atmosphere as it has in recent years – probably in an unexpectedly rapid response to the reduced pressure of CO2 in the air at the ocean’s surface”
So the lack of drop in atmospheric CO2 in the air, is because the oceans didnt absorb as much, because of the drop in atmospheric CO2.
How utterly ridiculous. How can there be a reduced pressure of CO2 with no reduction in CO2.
They literally said, that if there is more CO2 in the atmosphere, the oceans will absorb more of it, while explaining away that a 5.4% drop wasn’t seen. So… where *is* the problem with atmospheric CO2? Seems like it doesn’t exist….
Good catch, Matthew. It makes you wonder who proof-read this report.
You assume that the “error” was unintentional, Ron. More likely just an unavoidable inconsistency in the propaganda.
The author (correctly) assumes that it won’t be detected by most of the low-information, reason-impaired, science-free parasite sheeple targeted for the agitprop.
(Feeling particularly misanthropic today I guess. Thank the universe it’s the sixth day of the seven-day cycle).
You have to be wary of anything written by a journaliist. The direct quotes probably were spoken by scientists. Everything else is a result of how well the writer understood the scientist. That’s why so many stories make scientists look outright incompetent.
In 1973 we were worried about a new ice age. The oceans were apparently cooler and were absorbing CO2. Since then, we’ve had warming and the solubility of CO2 in the oceans has apparently decreased.
The story seems to be less about human emissions and more about Henry’s law.
I also caught that on first reading.
“How utterly ridiculous. How can there be a reduced pressure of CO2 with no reduction in CO2.”
That was my question. You put it better than I did.
Is that a real paper or study????
An example of circular reasoning and begging the question.
” ….. the two most important greenhouse gasses, carbon dioxide and methane; ….. ”
I stopped reading at that point.
If / when they re-write the paper to include H2O I’ll maybe consider their arguments.
I stopped reading until i came to the main indoctrination point i assumed as soon as I saw it’s from the NASA.
“We are past the point where we can think of these as TWO separate problems”
As this is what both global shitshows have always been about.
The merger of co2 and covid to justify whatever.
(which is the merger of corporations and state – corporate owened Biden forces you to take corporate vaccines while the state systematically kills of small businesses with lockdowns and high energy cost until big corporations are the only remaining options )
Crash the economy with co2 as excuse , install tyranny with covid restrictions,
now,as it was planned many years ago, use the ” unexpected effects on atmosphere” as another excuse to extend lockdown restrictions to save the climate and to centralize power towards the UN.
These guys already had all the “unexpected” data from 3rd world regions with low enery output and from 4th world = north korea and isolated regions as Patagonia or Antarctica(considering that corialis forces are said to deflect winds these regions should be very well protected from air pollution especially in the southern hemisphere.
Well, after all, it is “research” from NASA. NASA no longer does science the way CDC no longer does public health. Its politics all the way now.
“Molecule for molecule, methane is far more effective than CO2″ but because its absorption frequency is totally saturated by water vapour it has no effect at all.
If you are stuck in the IR radiation argument then Oldseadog has it right, water vapour is 95% of the story. Methane is a bit player and tends to go to CO2 and H2O quite quickly.
Methane is such a bit player, it shouldn’t even be mentioned in the conversation when it comes to global warming.
I think we should call Maxwell and ask him to take his demon back. You know, the one that selectively blocks one type of molecule from passing between two adjacent areas.
Some mental gymnastics appear required. But the message was clear enough:
“Reducing these sectors’ emissions permanently will require their transition to low-carbon-emitting technology.”
I have begun reading these things from the bottom up.
The conclusions are usually the same as this one, so it saves me time and trouble deciphering the rest.
“The most surprising result, the authors noted, is that while carbon dioxide (CO2) emissions fell by 5.4% in 2020, the amount of CO2 in the atmosphere continued to grow at about the same rate as in preceding years.”
The disbursement of CO2 on our planet (like the Big Bang) is a diffusion problem in physics. Molecules of CO2 are emitted from their source and spread over the entire planet (or universe wrt BB).
I have always thought it obvious that people (or even volanoes) are not the direct source of CO2, because it is so well mixed and pervasive thoughout the entire atmosphere.
The explanation that best fits this diffusion pattern, IMO, is buffered absorption/release of dissolved CO2 from the oceans. And it did not just dissolve recently, it has been there for a very long time.
Wholeheartedly agree. It is what makes CO2 in the atmosphere follow temperature.
earth is 70% ocean, as it warms it releases CO2, makes for very nice dispersion across the entire planet
Seems possible that CO2 emitted from big point sources like power stations is taken up by sinks long before it can get to Mauna Loa.
Seriously, the lockdown observations cause serious doubt about policies that account by CO2 emissions. If you wish to punish a CO2 emitter for harm to the atmosphere, you have to demonstrate CHANGE to the atmosphere.
If a 5% emission reduction for a year cannot be seen to cause change, likewise, a 5% increase for a year will cause no measurable change. That is not opinion, that is inexorable science. Geoff S
I made a similar point on the Guardian. Suggested that the Covid lockdowns having no discernible effect on atmospheric CO2 (linked to Mauna Loa data) means that far stricter lockdowns were needed, year after year after year.
Followed with the point that that’s politically impossible so let’s abandon mitigation and focus on adaptation. We need concrete, steel and cheap energy to make robust infrastructure.
The comment wwas deleted by the Guardian moderators.
I complained and was told that I was a troll.
Appealed up a level and have been ignored so far. Will follow up when COP26 is over to with the point that my comments explained what was going on far better than their ill-informed environmental journalists.
No appeal will help but if I can get the people in the Guardian to think that the house of card is wobbling they may change their editorial line, slowly.
Good luck. I hope you succeed. In the end, the truth will ”find it’s way to the surface.”
This probably goes back ten years. I’ve never seen anything on a follow up.
Some researchers, after analyzing wind flow over the U.S. made measurements of CO2 concentration at the west coast where the air was inflowing from a long trip over the Pacific. They also measured CO2 concentration at the east coast where they expected the U.S. industrial output of CO2 would be highest.
The values were the same at both coasts. They speculated that something, perhaps the central grasslands, were absorbing about the same amount of CO2 as the U.S. is producing, thereby resulting in the net-zero results.
Molecule for molecule, methane is far more effective than CO2 at trapping heat in the atmosphere.
__________________________________________
How long will this bullshit persist? A few days ago:
Watts Up With That
Weekly Climate and Energy News Roundup #478
For current concentrations of greenhouse gases, the radiative forcing at the tropopause, per added CH4 molecule, is about 30 times larger than the forcing per added carbon dioxide (CO2) molecule. This is due to the heavy saturation of the absorption band of the abundant greenhouse gas, CO2. But the rate of the increase of CO2 molecules, about 2.3 ppm/year (ppm = part per million), is about 300 times larger than the rate of increase of CH4 molecules, which has been around 0.0076 ppm/year since 2008. So, the contribution of methane to the annual increase in forcing is one tenth (30/300) that of carbon dioxide. The net forcing increase from CH4, and CO2 increases is about 0.05 W m-2 year-1. Other things being equal, this will cause a temperature increase of about 0.012 C year.
_______________________________________
So The forcing from CH4 and CO2 increases will cause a temperature increase of about 0.012 C per year. And the contribution of methane is one tenth that of carbon dioxide.
In other words, annually, methane will run-up global temperature by about 0.001°C and by the end of the century that might be as much as 0.09°C. And for this the Climate Crazies want to ban methane emissions from cows.
“And for this the Climate Crazies want to ban methane emissions from cows.”
Fits in well with the enviro fantasy to “rewild” the Earth. https://rewilding.org/about-tri/our-mission/
From my file of factoids quotes and smart remarks:
My three goals would be to reduce human population to about 100 million worldwide, destroy the industrial infrastructure and see wilderness, with its full complement of species, returning throughout the world.”
David Foreman,
co-founder of Earth First!
Doubtless he would be one of the first to be eaten because the left are determined to eliminate the second amendment.
I suppose he could beat a pack of wolves off with a passing transvestite though.
Rolling on the floor laughing
Does rewilding include replacing the cattle on the USA with the 60 million bison killed on the 19th century to put thongs back to normal?
Please, Ben – Thongs should never be normal.
Especially on bison!
They are in Queensland!
plse no more, I’m just recovering from hotscot above!
They need to leave the cows alone. Methane is not a problem for the Earth’s atmosphere.
Not to mention that the cows are “carbon neutral” since they eat grass that would otherwise die, decompose and emit…CO2.
Steve,
“This is due to the heavy saturation, etc….”
Please be so kind to explain that in more detail, as that would not be readily understood by lay/naive people, who elect idiot Legislators.
With regard to “ozone, a danger to human, animal and plant health,” I’ve noticed that people are now unknowingly but willingly exposing themselves to ozone through use of UV lights, ionizers and even ozone generators.
These devices are being used to promote health via destruction of pathogens, such as viruses. They also reduce odors by oxidizing offending molecules.
As I entered my dentist’s office it reeked of ozone. I’m guessing that it’s concentration had to be well into the several ppm range. There was an “air purifier” in the middle of the waiting room generating ozone. The poor receptionist had to breath this really contaminated air all day.
Ozone will destroy pathogens, but I believe that many of these devices to do so are being used improperly.
“The authors reason…” is a blatant admission that this entire article is speculation.
Same can be said when you read “used a…model to identify reasons.”
Can someone provide me with the link to the article, please?
Can’t find the study in the aforementioned edition of the journal (Nov 9, Vol 118)
Since man made CO2 is a very small percentage of all CO2 emitted by the earth, how could it have made any difference?
From the article: “Using data from NASA’s Orbiting Carbon Observatory-2 satellite launched in 2014 and the NASA Goddard Earth Observing System atmospheric model, the researchers identified several reasons for this result. First, while the 5.4% drop in emissions was significant, the growth in atmospheric concentrations was within the normal range of year-to-year variation caused by natural processes. Also, the ocean didn’t absorb as much CO2 from the atmosphere as it has in recent years – probably in an unexpectedly rapid response to the reduced pressure of CO2 in the air at the ocean’s surface.”
The OCO-2 satellite has been in orbit since 2014, but strangely, we haven’t heard much about it, or any results it might have gleaned, in all this time.
And I think I detect a discrepancy in the statement above. The claim is that CO2 was absorbed less in the ocean because of a 5.4% decrease in human CO2 emissions, yet the growth in CO2 atmospheric concentrations was within the normal range, so the Earth actually experienced no reduction in CO2, so CO2 absorbtion should have remained the same.
Without seeing the specific source for the claim of the “drop in 1973” being immediately visible in CO2 growth rate, the following is somewhat speculative on my part, but I do think it likely to be a better explanation.
The dominant factor in inter-annual variations of atmospheric CO2 growth is El Niño Southern Oscillation (ENSO). There was a strong El Niño in 1972-73 followed by three years of La Niña events. This shows up as a high CO2 growth rate in 1972, followed by lower growth rates for several years after this. The apparent drop in 1973 was most likely due to the subsequent strong La Niña. For an annual summary of CO2 growth rates at Mauna Loa, see: https://gml.noaa.gov/ccgg/trends/gr.html. The annual data are calendar years and some “smearing” can occur due to a delay in CO2 growth rate change relative to changes in sea surface temperatures and the fact that El Niño peaks are usually around year-end.
For a monthly comparison between the Oceanic Niño Index (ONI is a rolling three month average of sea surface temperatures in the Niño 3.4 region) and Mauna Loa CO2 values (from Scripps at https://scrippsco2.ucsd.edu/data/atmospheric_co2/), see here:
The cold polar waters absorb all that reaches the surface. In the arctic winter this sink is effectively closed and CO2 builds up like waves on the shore. In summer all that buildup is absorbed by the melted ice and the exposed sea water. There is no year-to-year accumulation. The year-to-year increase in concentration is a result from increased natural emissions (IPPC claims does not exist). The relatively small amount anthropogenic emissions does not accumulate in the atmosphere. All the sinks that are sucking up the greater natural emissions are sucking up the lesser anthropogenic emissions as well.
I understand the OCO-2 satellite is in the process of being phased out.
Apparently the replacement is OCO-3 and it’s attached to the international space station.
Haven’t seen anything from that new one, though.
Unexpected? Why they admit they don’t know shit and are just farting insane ideas out their arses?
It looks like they’re building justification for a climate lockdown.
Any time they mention ‘heat trapping’ gasses, my eyes glaze over. That simply doesn’t happen. At all. Any radiative molecule, be it gas, liquid or solid has the same ability to emit as it has to accept a photon. In other words, nothing is EVER trapped. It takes nanoseconds for a photon to be emitted after one is absorbed. No, it is not the same photon. Photons disappear upon absorption. They appear only upon emission.
If it weren’t for so-called greenhouse gases that radiate heat away from earth, the earth would be warmer, since ALL of the atmospheric heat loss would have to happen at the surface of the earth. Heat trapping? EXACTLY the opposite.
Wrong it takes millisecs for a photon to be emitted from an excited CO2 molecule, however at atmospheric pressure that molecule will collide with about 10 surrounding O2/N2 molecules per nanosecond so most of the excitation energy will be transferred to the surrounding atmosphere by collisions.
Unless there is as some unexplained way energy is lost to space (i.e. other than by electromagnetic radiation), all the IR emitted from the surface, whether transferred between molecules through collisions or not, must be re-emitted in order to ever leave the atmosphere. If those photons never leave the atmosphere, the atmosphere must become hotter and hotter.
5 % reduced CO2 emission means there still was 95 % emitted, for instance the same emission as a couple of years ago and the Mauna Loa response will hardly be affected.
As approximately half of the CO2 from fossil fuels are absorbed in the nature (land and ocean) the emissions have to be cut down to 50 % to have the Mauna Loa response to stay at a constant level from year to year.
Kind regards
Anders Rasmusson
Meaning that Carbon neutral can be only achieved by permanent lockdown that is 20 times stricter (and not taking into account the World’s population doubling every 50 years)
You have exposed my cunning plan.
Signed,
Professor Klaus Schwab
CO2 observation from NASA OCO2, is not Maunaloa…
Is clearly stated in this article.
Even these “guys” accept no effect of anthropogenic emissions detected, what soever, during 2020 lockdown.
More facts not in evidence.
An amount of CO2, from fossil fuels, have been transferred into the present carbon cycle. The CO2 amount in this cycle then have to increase by that same amount, primarily in the atmosphere. As we can not find all of it in there then the missing amount have been transferred from the atmosphere to the nature (land and ocean).
Kind regards
Anders Rasmusson
Anders Rasmusson:
There is much more CO2 in the oceans than in the air. Within each year the CO2 in the air increases and reduces (i.e. the seasonal variation) by about an order of magnitude more than the anthropogenic CO2 emission (i.e. the CO2 emission from human activities). The annual rise of atmospheric CO2 content is the residual of the seasonal variation and is equal to about half the annual anthropogenic CO2 emission.
So, the oceans and the biosphere emit and sequester much more CO2 than the anthropogenic emission each year. This enables the exchange to vary the distribution of CO2 between the air, the biosphere and the oceans.
As I recently said in another WUWT thread, the seasonal variation of CO2 in the air at Mauna Loa is about an order of magnitude more than the annual rise and the annual anthropogenic emission. This can be seen at a glance here https://gml.noaa.gov/ccgg/trends/
And the seasonal variation is lowest at Mauna Loa.
The basic assumption of the AGW-scare is that the recent rise in atmospheric CO2 concentration results from the anthropogenic CO2 emissions overloading the natural ‘sinks’ that sequester CO2 from the air. The annual increase of atmospheric CO2 concentration is the residual of the seasonal variation because the overloaded sinks cannot absorb all the anthropogenic CO2. Observations indicate that the assumption is wrong. For example,
(a) the dynamics of the seasonal variation indicate that the sinks are NOT overloading,
and
(b) if the annual increase of CO2 in the air were the amount of anthropogenic CO2 which overloaded ‘sinks’ could not sequester
then
the annual increase of CO2 in the air should relate to the amount of annual anthropogenic CO2 emission.
But if the extra emission of human origin was the only emission, then in some years almost all of it seems to be absorbed into the sinks, and in other years almost none.
Indeed the rate of rise of annual atmospheric CO2 concentration continued when the anthropogenic CO2 emission to the atmosphere decreased. This happened e,g, in the years 1973-1974, 1987-1988, and 1998-1999. More recently, and as the above article says, the rate of rise in atmospheric CO2 concentration has continued unaffected in 2020 and 2921 when Covid-19 lockdowns have reduced the anthropogenic CO2 emission.
I, Harde and Salby each independently concluded that the recent rise in atmospheric CO2 concentration is most likely a response to the altered equilibrium state of the carbon cycle induced by the intermittent rise in global temperature from the depths of the Little Ice Age that has been happening for ~300years.
This conclusion was first published in
Rorsch A, Courtney RS & Thoenes D, ‘The Interaction of Climate Change and the Carbon Dioxide Cycle’ E&E v16no2 (2005)
Subsequently, I provided my understanding of these matters in a paper I presented at the first Heartlands Climate Conference. More recently, Ed Berry has published it on his blog at
https://edberry.com/blog/climate/climate-physics/limits-to-carbon-dioxide-concentation/
He published it because – although the data does not indicate causality of the recent rise in atmospheric CO2 concentration – Berry used suggestions in my paper (that he has colour blue coded in his publication of my paper) to make a breakthrough in understanding that I and all others failed to make. This has enabled him to quantify the ‘natural’ and anthropogenic contributions to the rise. On his blog he has published the preprint of his paper reporting that quantification.
Richard
Richard,
In light of what you have said, can you help me with this query which continues to trouble me.
It deals with the carbon budget.
Pierre Friedlingstein et al 2021 is in pre-print at present.
It is the “Global Carbon Budget” which is published annually.
It follows Le Quere et al 2008 to Le Quere 2018.
Essentially it is the bible for the UN IPCC as the many prominent co-authors of the paper indicates.
It seems to acknowledge a degree of uncertainty for the carbon budget especially for the oceans and particularly for the Great Southern Ocean.
I am unconvinced that the degree of uncertainty is as small as the authors indicate and it may be they are attempting to minimise that uncertainty.
Am I correct in this belief?
In short are the climate scientists still a long way from nailing down the true effect of the sinks in the land and oceans?
Herbert,
You ask me,
I answer, yes.
Please read my paper that I linked for a full explanation of this answer.
Richard
Richard S Courtney : “There is much more CO2 in the oceans than in the air.“
Yes, mass transfer, though, depends on the partial pressures in the gas and liquid phases, be it gas absorption/desorption or distillation operation.
As long as the CO2 average partial pressure is higher in the atmosphere than average in the ocean, there will be a net transfer from the atmosphere to the ocean.
The natural huge CO2 transfer cycle is running in parallel as during thousands of years before the industrial era when the atmospheric CO2 concentration were around 280 ppmv.
Now the natural ocean CO2 desorption to the atmosphere around the warmest ocean surface, is lower. The CO2 absorption into the coldest ocean surface is higher than in the preindustrial era. Net transfer is from the atmosphere to the ocean.
The average ocean surface temperature has increased, resulting in not more than 10 – 20 ppmv/K higher atmospheric CO2 concentration as was the result of the oscillating temperature during the ice ages.
Kind regards
Anders Rasmusson
Anders Rasmussen,
Your response to me rightly says,
Yes, but so what?
Please read my post which you are answering.
I linked to the Mauna Loa data. Please look at it because it shows the seasonal flows of CO2 both in and out of the oceans are much larger than the anthropogenic emission. The seasonal CO2 variations are lower at Mauna Loa than all other measurement sites.
For each year the annual rise of atmospheric CO2 concentration is the residual of the seasonal variation of atmospheric CO2.
Assume the net flow of CO2 of each year is into the oceans. Then the variations in either one – or both of – the oceanic CO2 emission and CO2 sequestration flows could provide the residual to the atmospheric CO2 concentration which is the annual rise of atmospheric CO2 concentration
I also strongly suggest you read my paper which I linked because it explains the complexities of ‘sources’, ‘sinks’ and their interactions which are ignored by the ‘sinks overloading hypothesis’ (aka the ‘mass balance argument’).
Richard
“probably in an unexpectedly rapid response to the reduced pressure of CO2 in the air at the ocean’s surface.”
If the CO2 concentration was constant or continued to rise, then the pressure was not reduced. The concentration is the partial pressure. That’s chemistry 100.
“Also, the ocean didn’t absorb as much CO2 from the atmosphere as it has in recent years – probably in an unexpectedly rapid response to the reduced pressure of CO2 in the air at the ocean’s surface.”
With the oceans, it is not a one-way street! (Is this the state of physics at Caltech and JPL these days?) Here is what they didn’t want to say. The “rapid response” of the oceans to reduced partial pressure of CO2 is not just to absorb less of the gas, but also to increase outgassing of CO2! I laugh (actually, cry) when ‘scientists’ talk about taking CO2 out of the atmosphere as an option. You would end up having to sequester equal volumes that would outgas from the oceans to replace it.
There is absolutely nothing “unexpected” to an old school scientist about ‘what happened’. Look at this as the real report card for your physics and chemistry prowess.
What nonsense. The earth’s atmosphere couldn’t have cared less, and as for the “link” between “climate warming” and air pollution, it is all wishful thinking on their part, as well as propaganda meant to, as usual, frighten people.
Not to mention, the “pollution” was supposedly the “cause” of the “global cooling crisis” of the 1970s. D’oh!
Apparently, whatever changes occur to the Earth’s climate, they’re because of human energy use, which of course must therefore be controlled by our betters, the political classes and the wealthy.
(And through control over energy use, of course, they can control everything. Which is and always has been the goal.)
DO we expect to se a drop in temeratures now? Should I start worrying about an ice age?
NOx cooling, well if going CO2 net zero, that is… or something like that.
cheers
“ “During previous socioeconomic disruptions, like the 1973 oil shortage, you could immediately see a change in the growth rate of CO2,” said David Schimel, head of JPL’s carbon group and a co-author of the study. “We all expected to see it this time, too.””
that because you all DON’T KNOW WHAT YOU ARE DOING …
“The most surprising result, the authors noted, is that while carbon dioxide (CO2) emissions fell by 5.4% in 2020, the amount of CO2 in the atmosphere continued to grow at about the same rate as in preceding years. “During previous socioeconomic disruptions, like the 1973 oil shortage, you could immediately see a change in the growth rate of CO2,” said David Schimel, head of JPL’s carbon group and a co-author of the study. “We all expected to see it this time, too.”
Correlation does not imply causation: During the early 1970s, cooling of the atmosphere and the oceans was taking place. During the past few years, cooling either is small or non-existent. As any beer or soft-drink industry knows, cold liquids can hold more CO2. Trout know that colder water holds more O2. So, perhaps it just so happened that natural CO2 was being more easily absorbed by the oceans during the time of that oil shortage.
Had everything that might pertain to the conclusions been looked at?
Attribution to JPL’s David Schimel and other coauthors of the workshop report discussed in the above article:
In fact, this was only surprising to those of the AGW/CAGW mindset.
As I and others have noted previously, there is not a single scientific paper that shows beyond reasonable doubt (i.e., with consistent scientific, in situ measurements and straightforward logic) that mankind-originated emissions of greenhouse gases (mainly CO2 and methane) have any significant effect on the rise of global atmospheric CO2 concentration.
There is a lot of speculation on this subject, but that does not substitute for hard data.
Moreover, this data point from scientists should be ample warning that the tens-of-$trillions to be spent around the world in just the next 10 years on “fighting climate change” . . . repeat after me, “fighting climate change” . . . via reducing human emissions of CO2 and methane will be nothing more than a great waste of money, material resources, human labor, and (you guessed right) energy.
Let’s please heed the sage advice of physicist Richard Feynman:
“It doesn’t matter how beautiful your theory is, it doesn’t matter how smart you are. If it doesn’t agree with experiment, if it doesn’t agree with observation, it’s wrong. That’s all there is to it.”
Gordon,
I believe you are correct in denying that there are any scientific papers that show beyond reasonable doubt that anthropogenic emissions are the major cause of the annual CO2 increases at Mauna Loa.
However to establish that point you need to successfully critique Pierre Friedlingstein et al (2021) “ Global Carbon Budget”currently in pre-print but following on from the Le Quere et al annual papers since 2008.
This paper seeks to identify the anthropogenic contribution and the various land and ocean sinks and to show how anthropogenic contributions fit into the picture.
If Dr. Roy Spencer is correct in saying that the imbalance in the energy budget occasioning global warming is one part in 600 (or by others one part in 300)but scientists do not know that imbalance with an accuracy approaching one part in 100, then obviously something is wrong with the “Global Carbon Budget” as published annually.
1) I never stated or implied that “anthropogenic emissions are the major cause of the annual CO2 increases at Mauna Loa” (your words). In fact, I clearly stated that there is no credible evidence that mankind-originated emissions of greenhouse gases have any clearly-established significant effect on the rise of global atmospheric CO2 concentration.
2) It is not me, but instead other well-known and credentialed climate scientists with international status (such as Dr. Spencer), that will need to “successfully critique” Pierre Friedlingstein, et al (2021). Or do you really think that what I post here on WUWT will be taken as gospel by international climate scientists, let alone the IPCC? I wish.