Brief Note by Kip Hansen — 6 October 2021
I am engaged in a community education program that includes a great number of climate activists and climate zealots as well as persons who are just curious and interested in improving their community’s response to weather and climate. In the process, I happened to mention in an online training session that Antarctic Ice Mass has been increasing, not decreasing over the last few decades, correcting a point made by the instructor.
The course instructor, a climate activist and educator, took exception to this correction. I was, however, confident in my position, though I had not reviewed the issue for years — thus, was a little unsure of exactly what sources I was depending on. But, I am not the self-doubting sort, so did not back down. I was asked to provide sources for my comment.
As with all things climate — facts depend on one’s epistemological values.
This is what I was able to report to the instructors:
Have I mentioned that almost everything about Science topics is complicated and often complex as well?
Antarctic Ice Mass is an example.
When I said Antarctic Ice Mass has been increasing since the turn of the century, I was quoting a recent NASA reported on this NASA website page: https://www.nasa.gov/feature/goddard/nasa-study-mass-gains-of-antarctic-ice-sheet-greater-than-losses
The study was published in 2015. Real science is always of the past, and studies like these can take years to do right, thus they seem “old” but are in fact often the latest studies available.
The study [ link to original Zwally study ], was reported byNASA here and quotes the study lead author, Jay Zwally, as saying:
“The good news is that Antarctica is not currently contributing to sea level rise, but is taking 0.23 millimeters per year away,” Zwally said. “But this is also bad news. If the 0.27 millimeters per year of sea level rise attributed to Antarctica in the IPCC report is not really coming from Antarctica, there must be some other contribution to sea level rise that is not accounted for.”
The NASA article about the study [repeating the link] says: “NASA Study: Mass Gains of Antarctic Ice Sheet Greater than Losses”
“According to the new analysis of satellite data, the Antarctic ice sheet showed a net gain of 112 billion tons of ice a year from 1992 to 2001. That net gain slowed to [a gain of] 82 billion tons of ice per year between 2003 and 2008.”
Now, here’s the rub, as they say. When one looks at NASA’s Vital Signs web page we are treated to this rather depressing graph of Antarctic Ice Mass losses:

The 2015 Zwally study — “the new analysis of satellite data, the Antarctic ice sheet” — shows precisely the opposite, GAINS in the re-analysis by Zwally and his team instead of the DECLINES shown in the Vital Signs graphic above.
Sorting out these kinds of basic data conflicts takes literally weeks of journalistic research effort. I have not tackled this issue as of yet — but have been aware of the conflicting information — all from NASA — for several years.
It is not really possible that both sets of information are true and correct.
I certainly don’t know. But because NASA publishes contrary data, educators should not be making definitive statements about Antarctic Ice Mass, but rather should clearly say “Some NASA studies show Antarctica losing Ice Mass and some NASA studies show it gaining Ice Mass.”
I whipped up this alternate graph to show both sets of data on the same graph — GRACE from NASA Vital Signs and the gains found by Zwally et al. (2015):

The graph above uses GRACE’s 2002 zero as a common point — with Zwally’s 1992-2002 data to its left and 2002-2015 to the right.
I am aware that Zwally (2015) was sharply contested by the usual ice mass consensus team — but never required correction. Zwally is currently listed as being with the Cryospheric Sciences Laboratory, NASA Goddard Space Flight Center, Greenbelt, MD and the Earth System Science Interdisciplinary Center, University of Maryland, College Park, MD.
Zwally and his team have come back in 2021 with this peer-reviewed study:
Mass balance of the Antarctic ice sheet 1992–2016: reconciling results from GRACE
gravimetry with ICESat, ERS1/2 and Envisat altimetry H. Jay Zwally et al. 29 March 2021 Cambridge University Press
Their latest analysis looks like this:

One sees the seasonal variation clearly at this scale. Although this latest analysis shows a tiny -12 Gt annual loss, I doubt that it is significant given what must be a fairly large +/- 1 SD (had it been shown). Even if the -12 Gt per year was physical and lasted all 9 years from 2012, the cumulative total nine year loss would be only 108 GT, a far cry from the NASA Vital Signs GRACE image’s minus 151 Gt per year offered to the general public as a sign of disastrous climate change.
I would appreciate any and all Ice Mass aficionados weighing in on the source of the disconnect between these two NASA approved Ice Mass calculations.
UPDATE: Reader John MacDonald pointed out that “One data item missing is the total ice mass of Antarctic.” The best guess total ice mass in Gt from the Wiki is 26.5 million Gt.
# # # # #
When there are discussions about the Antarctica mass balance, I often think of those model mock-ups of islands used in WWII for planning invasions. That continent, with its almost infinite dynamic processes can’t be reduced for analysis to one of those plastic mock-ups. Yet, I imagine the public views these questions with the same simplicity, just like most other climate related issues.
Subglacial factors, as you know, are also as important in these conclusions as the snow and ice variability. This from Zwally 2021.
“In the same way that satellite gravimetry measures changes in the ice mass on the Earth’s crust and altimetry measures changes in the ice volume, the respective measurements include the effects of ongoing changes in the mass and volume (ΔM, ΔV) of the Earth under the ice.”
And
“However, the decadal-scale dynamic changes are not all causing increases in mass loss. The M(t) for the AP in Figure 14 shows reduced mass loss for the last several years. Also, as previously noted, the M(t) for WA1 in Figure 13 shows that the marked increase in dynamic loss that began around 2009 reduced some during the later years, possibly related to the solid Earth and sea-level feedbacks modeled by Larour and others (2019). Interestingly, the Kingslake model simulation does not show a post-LGM retreat to inside the present grounding line in the Amundsen Sea sector of WA1, which may have implications regarding the ongoing changes and the possible limited extent of future ice losses in WA1. Also, Barletta and others (2018) note that their finding of a lower mantle viscosity and shortening of the response time to mass changes to ‘decades up to a century … increases the potential stability of the WAIS against catastrophic collapse’, with implications for the stability of the inland WA2 as well”
Trying to deduce any long term trend from analyzing what certainly are dozens of countervailing trends of decadal, centennial and millennial processes seems a losing battle. Further, to mention annual changes borders on the absurd, given the levels of uncertainty of the measuring techniques. And this doesn’t even address the microscopically small levels of changes in the ice as noted above in several comments.
cerescokid ==> Did I mention that it is complicated and complex?
I think you should! 🙂
My only observation on ice mass is that ice is not a steady state product anywhere. It only seems that way to the casual observer. I think that’s why there is so much misunderstanding about it by the uninformed greenies.
The comparison might be the freezer compartment in my fridge and the ice cube trays, which may start with full blocks of water and convert it to ice, but which will also lose ice cube volume as time goes by, if I don’t use those ice cubes. I could run an experiment on that, too, just to get the results. Water ice can sublime into vapor if conditions are right.
Also, since the Antarctic continent has ice sliding into the sea and calving, it’s acting normal so I don’t “get” what the issue or misunderstanding is other than not “getting” that ice and snow mass are seasonal, not perpetual, even in the Antarctic.
We used to get National Geographic. All those Antarctica articles that they published during the IGY period were priceless. I should have snagged that stuff before I left home for good.
There’s no steady state climate anywhere on this planet.
Ice does not have any seasonal cycles of melting or ablation in Antarctica.
The average temp of the entire continent is -70+° F over the course of a year.
Except near the coasts, it never gets even as warm as the inside of a freezer, which is generally about 0°F.
So a freezer is a bad analogy.
And there is another reason besides temp and moisture capacity that invalidates this analogy: Frost free freezers work to stay frost free by periodically warming up for a short time to above freezing, typically a couple of times a day to about 32°F and then draining the water away.
More modern ones do not warm up the entire freezer compartment, but only a portion of the space, and have fans blowing air around to remove the frost that inevitably forms inside a freezer every time it is opened.
It takes energy for sublimation to occur, and also the air must be able to hold moisture at a level which allows significant sublimation ablation.
But there is a lot less free energy at -57°C than at 0°C, and the ability of the air to hold moisture at -57°C (mean annual temp over all of Antarctica) is a minute fraction of what it can hold at 0°F (typical freezer interior temp), and the amount it can hold at 0°F is itself a small fraction of what it can hold at 32°F, which is why warming the temp up periodically to only 32°F inside a freezer removes all trace of frost from inside of frost free freezers.
The situations are not remotely comparable.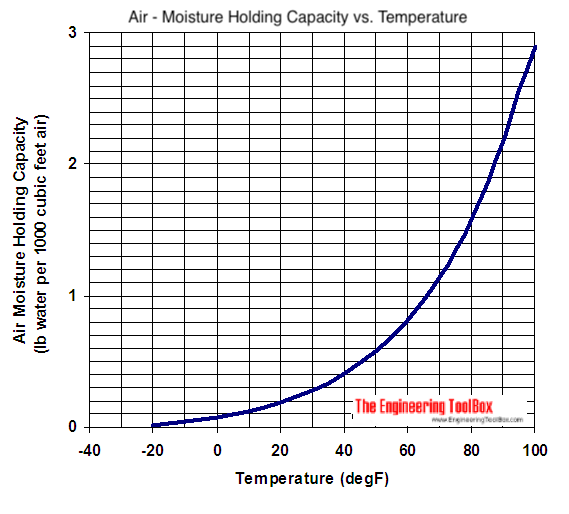
Freezers are cold, yes.
But the difference between a typical temp in the interior of Antarctica is as much colder than the coldest winter day in most of the northern US, than that coldest winter day is from a warm summer evening.
Not only is there far less energy, but the air is not physically capable of holding moisture to any appreciable extent even if when ablation does move ice from the surface into the air.
As soon as the sun gets low enough to cut off ablation from solar photon caused sublimation, the moisture condenses into fog which deposits as rime, or else it deposits directly back to the surface as frost via sublimational deposition.
Note that this chart can not even depict how little moisture can be held in air at Antarctic temps:
The area of Antarctica is 14.2m sq km or 1.42E13 sq m.
1mm of ice across Antarctica is therefore 1.42E10 cu m or approx 13 Gt at sp.gr. 0.91.
When NASA say that the rate of ice gain has slowed from 112 Gt pa to 82 Gt pa, they are talking about a change from 8.6mm pa to 6.3 mm pa.
Satellites can measure sea surface height only to an accuracy of “a few centimetres” (“More recent high quality satellite altimeter missions such as TOPEX/Poseidon (launched August 1992) and Jason-1 (launched December 2001) measure SSH to an accuracy of a few centimetres. These satellites were specifically designed to measure SSH to the highest possible accuracy.” – https://research.csiro.au/slrwavescoast/sea-level/measurements-and-data/sea-level-measurements/) so I doubt that NASA’s numbers are very reliable.
Mike ==> Sea Surface measurement by satellite are spec’d to be accurate to +/- 2 cm . . . .
I would expect ice surface measurement over Antarctica to have a slightly easier time establishing what height they were actually measuring most of the time – would the readings be more consistent then, if not more accurate?
RP ==> Well, at least the surface of the ice is not in constant motion like the sea. But ice mass also depends on the thickness of the ice, which is different everywhere.
Yes but satellite measurements can only tell you the height of the surface above a previously established datum level (as I pointed out upthread). Working out accurate figures for ice mass would require a different method – either a thorough survey to establish the exact depth across the continent, or a rough estimate based on approximate average depths of the ice.
Getting consistent measurements over time of the height of the ice surface above that datum level should at least give us an idea of how the surface is behaving – increasing or decreasing in height for example, irrespective of whose guesstimate on total ice mass is nearest the mark.
RP ==> Look up NOAAs COR project page — they’d need thousands and thousands of Continuously Operating Reference stations, running for a couple of years to determine what the rock is doing as far as Vertical Land movement. Then, for each spot, get a much more accurate idea of the change in altitude of the surface, then . . . . . .
One complicating factor is that areas near the coast get as much as ten feet of snow per year or more.
Areas inland of course get much less.
So, how to account for this?
I think it is impossible to do so over the entire continent.
Probably, only measurements of height of the interior are the only parts in which it is even possible to get useful numbers.
This article is from 2004, and seems to be mostly free of global warming nonsense:
Climate Variability in West Antarctica Derived from Annual Accumulation-Rate Records from ITASE Firn/Ice Cores (umaine.edu)
Y’all know that all those numbers are fart out the @ur momisugly$$ guesses, right.
They are estimates, and I bet, when you read the fine print the range given, is so big that their guess can’t be wrong.
bluecat ==> They go to lot of trouble to calculate and adjust and figure it out. They all take it very seriously and try to do their very best with data not really suited for the purpose.
A for effort. F for accuracy. ?
They are sincerely wrong. ?
They believe in Scientism not science. ?
Or all of the above?
bluecat ==> We don’t know . . . . not for sure . . . . we don’t even agree on the SIGN of the change.
So if WE don’t know, why do THEY keep saying they “DO”?
While most of those here do NOT need to be reminded that the “science” is generally “educated” (I would question event that.) “guesses”, the occasional reader or ignorant skull full of mush might benefit from pointing out that the “facts” being reported are at best estimates.
And, they often include ranges (50% to 100% more/less) that are meaningless.
I’m going to have to find a good quote about “questioning everything”. I might start with “don’t trust anyone over 30” and somehow modify that by changing “anyone” to something like “measurement” or something else.
The MSM deal in absolutes, and climate enthusiasts that give absolute facts rather than an inconvenient truth will be reported and quoted more. There is a Pavlovian reward cycle in giving absolute (although misleading and possibly wrong) information out and not getting punished for it – the more they do it, the more they are rewarded and enjoy it, then the more confidence they have when they keep doing it.
That’s why I’ve started finding the original papers and reading the abstracts.
The headlines and stories report the POSSIBLE “discoveries” as “absolutes” and “facts” when they are educated guesses.
The subscribers of Watss Up are smarter than the average “bear”, and the whole BS campaign regarding covid is waking up millions more to the vapidity of so called “science” “journalism”.
bluecat ==> The MSM is dedicated to pushing the Public Health Messages on Covid — the ever changing Public Health Messages.
It also pushed the Climate Crisis message almost exclusively — their editors get hate mail if they diverge even the slightest fom the IPCC-backed Climate Policy Message.
And I’m sure you remember the “New Ice Age” crap from the 70’s.
Beneath your feet at the South pole lie over 3000 metres (about 9800 feet) of ice, 4000 metres (13,123 feet) in parts, which rests not on the sea but on land. Antarctica is a frozen continent larger than Europe, larger even than the United States and Mexico combined. A massive icecap covers 98 percent of that land, swallowing a continent higher than any on Earth. The length of the polar winter night increases with latitude until at the pole itself, the sun sets just once a year. For a while after it disappears, the setting sun provides aglow above the horizon, and then leaves the polar world in complete darkness for half the year.
The warmth the polar regions absorb in the summer is far less than the heat they lose in the winter. Only in November and December, the very height of the Antarctic summer, does the South pole actually gain heat. The Antarctic is much colder than the Arctic. The average winter temperature in the Antarctic is minus 60 degrees Celsius. Even on a good summer’s day it’s minus 30 degrees Celsius, colder than the coldest winter’s night at the North Pole. Antarctica is the highest continent on Earth, three times higher than any other.
There are larger waves, stronger winds, and more powerful currents in the Southern Ocean than anywhere else on the globe. Icebergs are a real threat to shipping. At times they show up on the radar screen as hundreds on tiny white dots, which in reality could be an iceberg which could easily sink the largest vessel. It is absolutely essential to keep a lookout posted around the clock, and many captains prefer to avoid travelling at night whenever there are lots of icebergs about. On land, cold air from the high continental plateau rushes down the gradient to the sea causing katabatic winds. These can reach over 300 kilometres an hour and add terrifying windchill to the already freezing conditions.
If you sail around Antarctica, you will see mainly white ice. Sometimes it towers over you as mighty ice shelves. Elsewhere great glaciers tumble into the ocean, calving off icebergs which make navigation very dangerous.
The above was written by Alistair Fothergill in his book ‘Life in the Freezer’, published in 1993 before the current climate change hysteria – with a foreward by none other Sir David Attenborough.
Fast forward to the present. Greenpeace on its website states that ‘… parts of the Antarctic are warming three times as fast as other parts of our planet. Scientists recently recorded its warmest day ever – a distinctly not-freezing 17.5°C’ and also that ‘Chhanging ocean temperatures are also important, because they warm the massive Antarctic glaciers from below, making them less stable.’
Quite how changing ocean temperatures are warming the Antarctic glaciers from below given that the Antarctic is a land mass below ten thousand feet or so of ice is not explained – but then, who needs explanations, the scary story is what counts. And where exactly was the claimed temperature of 17.5 degrees measured, and under what circumstances? The British Antarctic survey states; ‘Around the coasts of Antarctica, temperatures are generally close to freezing in the summer (December-February) months, or even slightly positive in the northern part of the Antarctic Peninsula. During winter, monthly mean temperatures at coastal stations are between -10°C and -30°C but temperatures may briefly rise towards freezing when winter storms bring warm air towards the Antarctic coast. Conditions on the high interior plateau are much colder as a result of its higher elevation, higher latitude and greater distance from the ocean. Here, summer temperatures struggle to get above -20°C and monthly means fall below -60°C in winter. Vostok station holds the record for the lowest ever temperature recorded on the surface of the Earth (-89.2°C).
Greenpeace also say that ‘ Glaciers form on the Antarctic landmass as snowfall compresses into ice over time, and they flow under their own weight towards the ocean – like a very slow river. But as these glaciers feel the heat of a warmer ocean underneath them, they speed up their slow march to the coast, causing big chunks of ice to break off into the sea as icebergs at a faster speed. The melting and break down of glaciers into the ocean raises sea levels all around the world. Antarctic glaciers are now losing ice faster than snow is falling to add new ice. The rate at which Antarctic ice sheets melt under increasing temperatures will affect coastal communities globally, whether living in small island states or mega-cities.’
Yet there have clearly always been plenty of icebergs in the Southern Ocean. Greenpeace is yet again telling us fairy stories (to put it politely).
Kip
Try this resource of study.
https://notrickszone.com/category/antarctic/
Regards
Ozone ==> Lots of interesting press links. Not too specific on Antarctic Ice Mass — but thanks!
I’m curious to know what the instructor’s response to the conflicting data was.
Aaron ==> Basically, I was contacted by phone and asked to cease and desist from mentioning conflicting data in the zoom chat function during the presentation. Idle chit chat though would be well accepted.
That is not unlike Yahoo news, which occasionally allows comments from readers about what some movie star or ‘influencer’ is doing, but doesn’t allow ANY comments on anything of substance such as climate stories.
Kip,
I went through almost the exact same kerfuffle with a similarly like minded set of folks regarding NASA and the Arctic.
Wintertime Arctic Sea Ice Growth Slows Long-term Decline: NASA
“This negative feedback mechanism increasing ice growth is unlikely to be sufficient in preventing an ice-free Arctic this century,” Petty and his colleagues concluded.
https://www.nasa.gov/feature/goddard/2018/wintertime-arctic-sea-ice-growth-slows-long-term-decline-nasa
So, “this century” implies by 2100 (79 years into the future)… which means this prediction conveniently won’t expire until long after the initial authors have passed away. So, we have gone from 2014 (Al Gore) to 2100 (Petty).
So, as other commenters pointed out:
Pat from kebob: And this is an estimate(Petty: likely/unlikely)? And we are supposed to worry?
Rory Forbes: So, as “We’re not really sure….” and “we don’t know”
NASA seems to have multiple positions on every issue. IMHO
Zwally should conduct a similar analysis for the mass balance of the Greenland ice sheet.
Renee ==> Write him and suggest it.
The mean thickness of the Antarctic ice sheet is 2.16 km.
https://www.antarctica.gov.au/about-antarctica/ice-and-atmosphere/ice-sheet/
Surface Mass Balance https://www.climato.uliege.be/cms/c_5652669/fr/climato-antarctica
The temperature (from https://www.climate4you.com/ )
Harry ==> Thanks for links — the Belgian mass figures agree with Zwally — ice mass increasing.
Somebody help me out here, please.
Most of the Antarctic never gets above freezing. It’s also very dry because all that cold air holds very little moisture. Some of the interior valleys are snow covered but it very rarely snows there. The little that does fall or crystalize as ice fog and drop out just never melts. So ice accumulates in the interior and really only leaves by sublimation, a very slow process in that cold. The major way that the continent loses ice mass is by coastal glaciers flowing down into the sea and some periodic melting on the West Antarctic Ice sheet, which sticks up into warmer latitudes to the North. Is this not all correct?
The only way the glaciers flow down to the sea is due to pressure from the ice accumulation at higher altitudes on the coastal mountains, correct?
So this whole discussion is about whether the slow accumulation of ice inland is greater or smaller than the slow loss of ice at the coasts, which is caused by a roughly equal accumulation at the same location. Unless somebody can dispute this as the reality then there is just absolutely nothing to see here.
The climate liars making puddles out of ice mountains. Like forest fires and hurricanes being worse and models being scientific facts and treemometers. The Great Politico-scientific grift goes on, fueled by government grant money, hot off the printing press.
JH ==> See the last graph from Zwally. Based on surface height, his team calculates that Ice Mass increases in one season and decreases in another. Snow and Ice do fall there.
You are not the first readers to say that “It doesn’t snow in antarctica”.
See this reference and the study mentioned in it.
https://earth.org/data_visualization/antarctic-snowfall/
However, wind can act like a proxy for heat and supply the energy to strip off molecules from the surface via sublimation.
Even this is not in the focus of this article, this link is important to discussion b/c amount and area of the Sea Ice shows that the Antarctic area has been cooling (at least around of the Antarctica).
Nature 2014: Error discovered in Antarctic sea-ice record
”…sea ice in Antarctica was at first steady — and then began to slowly expand in the mid-2000s”
https://www.nature.com/articles/nature.2014.15605
Harri ==> Thanks for the sea ice paper link.
Warming and cooling of the atmosphere is not the driving factor for either sea ice or the ice land mass — at least not at the range of temperatures seen in this millennia.
It is the AGW-focused crowd that thinks atmospheric temperature measured 2 meters above the ground or sea surface is the control knob of all other geophysical climate related issues.
direct sunlight will melt ice at the poles then in winter it all freezes up again