Brief Note by Kip Hansen — 6 October 2021
I am engaged in a community education program that includes a great number of climate activists and climate zealots as well as persons who are just curious and interested in improving their community’s response to weather and climate. In the process, I happened to mention in an online training session that Antarctic Ice Mass has been increasing, not decreasing over the last few decades, correcting a point made by the instructor.
The course instructor, a climate activist and educator, took exception to this correction. I was, however, confident in my position, though I had not reviewed the issue for years — thus, was a little unsure of exactly what sources I was depending on. But, I am not the self-doubting sort, so did not back down. I was asked to provide sources for my comment.
As with all things climate — facts depend on one’s epistemological values.
This is what I was able to report to the instructors:
Have I mentioned that almost everything about Science topics is complicated and often complex as well?
Antarctic Ice Mass is an example.
When I said Antarctic Ice Mass has been increasing since the turn of the century, I was quoting a recent NASA reported on this NASA website page: https://www.nasa.gov/feature/goddard/nasa-study-mass-gains-of-antarctic-ice-sheet-greater-than-losses
The study was published in 2015. Real science is always of the past, and studies like these can take years to do right, thus they seem “old” but are in fact often the latest studies available.
The study [ link to original Zwally study ], was reported byNASA here and quotes the study lead author, Jay Zwally, as saying:
“The good news is that Antarctica is not currently contributing to sea level rise, but is taking 0.23 millimeters per year away,” Zwally said. “But this is also bad news. If the 0.27 millimeters per year of sea level rise attributed to Antarctica in the IPCC report is not really coming from Antarctica, there must be some other contribution to sea level rise that is not accounted for.”
The NASA article about the study [repeating the link] says: “NASA Study: Mass Gains of Antarctic Ice Sheet Greater than Losses”
“According to the new analysis of satellite data, the Antarctic ice sheet showed a net gain of 112 billion tons of ice a year from 1992 to 2001. That net gain slowed to [a gain of] 82 billion tons of ice per year between 2003 and 2008.”
Now, here’s the rub, as they say. When one looks at NASA’s Vital Signs web page we are treated to this rather depressing graph of Antarctic Ice Mass losses:

The 2015 Zwally study — “the new analysis of satellite data, the Antarctic ice sheet” — shows precisely the opposite, GAINS in the re-analysis by Zwally and his team instead of the DECLINES shown in the Vital Signs graphic above.
Sorting out these kinds of basic data conflicts takes literally weeks of journalistic research effort. I have not tackled this issue as of yet — but have been aware of the conflicting information — all from NASA — for several years.
It is not really possible that both sets of information are true and correct.
I certainly don’t know. But because NASA publishes contrary data, educators should not be making definitive statements about Antarctic Ice Mass, but rather should clearly say “Some NASA studies show Antarctica losing Ice Mass and some NASA studies show it gaining Ice Mass.”
I whipped up this alternate graph to show both sets of data on the same graph — GRACE from NASA Vital Signs and the gains found by Zwally et al. (2015):

The graph above uses GRACE’s 2002 zero as a common point — with Zwally’s 1992-2002 data to its left and 2002-2015 to the right.
I am aware that Zwally (2015) was sharply contested by the usual ice mass consensus team — but never required correction. Zwally is currently listed as being with the Cryospheric Sciences Laboratory, NASA Goddard Space Flight Center, Greenbelt, MD and the Earth System Science Interdisciplinary Center, University of Maryland, College Park, MD.
Zwally and his team have come back in 2021 with this peer-reviewed study:
Mass balance of the Antarctic ice sheet 1992–2016: reconciling results from GRACE
gravimetry with ICESat, ERS1/2 and Envisat altimetry H. Jay Zwally et al. 29 March 2021 Cambridge University Press
Their latest analysis looks like this:

One sees the seasonal variation clearly at this scale. Although this latest analysis shows a tiny -12 Gt annual loss, I doubt that it is significant given what must be a fairly large +/- 1 SD (had it been shown). Even if the -12 Gt per year was physical and lasted all 9 years from 2012, the cumulative total nine year loss would be only 108 GT, a far cry from the NASA Vital Signs GRACE image’s minus 151 Gt per year offered to the general public as a sign of disastrous climate change.
I would appreciate any and all Ice Mass aficionados weighing in on the source of the disconnect between these two NASA approved Ice Mass calculations.
UPDATE: Reader John MacDonald pointed out that “One data item missing is the total ice mass of Antarctic.” The best guess total ice mass in Gt from the Wiki is 26.5 million Gt.
# # # # #
Kip. Good job pointing out the function of discussion in science. And the importance of understanding sources, errors, relevance, and how to draw conclusions.
One data item missing is the total ice mass of Antarctica. That would add a lot of perspective to the anomaly data. People often forget that this sort of discussion occurs on a background of huge numbers that are orders of magnitude greater than the anomaly.
John ==> I’m afraid that there is probably the same mess with total ice mass as gains and loses. I’ll try to find the estimates of total antarctic Ice Mass and post it as an addition to the post above.
John ==> The best guess total ice mass in Gt from the Wiki is 26.5 million Gt.
So, 0.00006% difference?
And this is an estimate?
And we are supposed to worry?
Pat ==> Apparently, NASA would like you to worry abut this. Otherwise they would just publish the conflicting data from their own scientists and say “We’re not really sure….”
“We’re not really sure….” and “we don’t know”
The two most underused statements in post modern science. If even one of those two were used even occasionally it would raise my confidence so much more.
Rory ==> Perfect!
The honest response “We’re not really sure….” is no longer today in the hyper political climate we are in today. It also seems a lot of people cannot admit that. After all “We’re not really sure….” would destroy their grants.
I thought they reinforced the grant funding by using the statement at the end of their conclusion paragraph, “However, further study is required to fully determine the primary contributing factors believed to be causing the anomalies!” Or words to that effect, hoping that is would be sufficient to entice the chequebook out of the providers’ collective pockets!!!
So much of Climate “Science” is like this: obsessing over tiny differences between huge numbers with wide error bars.
Graemethecat ==> Astute observation.
Pat: one too many zeros – 0.0006%
So about 1.2 cm of ice lost on average over the entire continent?
It should be easier and more certain to simply install measuring sticks in several thousand evenly spaced spots over the ice sheet, and see if there is actually ice being lost from the surface over the whole sheet, on average.
In ten years it would have to amount to 12 cm, or almost 5 inches.
A foot in about 21-22 years.
Has the whole continent lost a foot of ice since the year 2000 or not?
Every place we have outposts there, we need to dig them out constantly to keep them from being buried.
So obviously the surface is actually gaining mass.
So any ice loss must be from either water or ice flowing off the edges.
Which should be relatively easy to measure, and far easier to ensure something real is being measured, compared to measuring changes in gravity over an entire large and mountainous continent.
Ice gain on the surface may be easier to estimate by measuring the humidity level of onshore vs offshore winds.
All of the ways the climate liars are going about this question reminds me of measuring ocean heat content and reporting the result in joules, while only measuring part of the ocean to a limited depth and heavily “correcting” the measured temps from each device.
Nicholas ==> The truth is that we don’t really know.
I agree 100%.
If Zwally is correct we could/might/probably be close to a “tipping point”, whereafter, all the water in the world will be taken up by the Antarctic ice sheet. Whichever it is, panic is the only response allowed.
JH ==> The primary point is that whether the ice mass is growing 12 Gt a year, or shrinking 151 Gt a year — it is a trivial amount.
??? doesn’t Zwally’s graph show total ice mass on the y-axis ? Most recently around 1000 GT. Maybe sea ice only? The 26.5 million results from 14.2 million square km of Antarctica times 2km average ice thickness times the density of ice of .95. I don’t think the powers that be have a good handle on that 2km average thickness number they throw around. Mountains ranges stick up here and there, and the number of people carrying around seismic equipment are few…..
DMac ==> Good Eye! It is labelled “Total Mass” but is actually gain or loss total. The original caption reads: “Fig. 15. M(t) time series for Antarctica from ICESat (blue) and GRACE (red). The linear
trends from LQS fits at the midpoints of 2003–2009, 2009–2012 and 2012–2016.3 are also in Table 7a.”
So in this photo of the Transantarctica mountain range, where is the 2 km. thick ice?
DMac ==> Think of it like the ocean — the Hawaiian islands look like that sticking up out if the ocean but “The islands of the Hawaiian chain are the tops of great mountains that rise as much as 29,000 feet from the sea floor”. Your photo shows only the little bit above the ice.
That depth is the average over the entire continent.
What are you suggesting it proves to show a small patch of bare rock on an entire continent covered in miles-deep ice?
The Transantarctic mountains are up to 4.5 km high:
https://en.wikipedia.org/wiki/Transantarctic_Mountains
Thus, I’d say there is easily 2 km of ice in that photo, as the mountains are probably more than half-way covered.
Mountains are tall, really tall.
Except the short ones.
Those ones are not really tall.
🙂
Those are some big mountains, that is for sure.
The estimates for average ice depth are of course…estimated.
And I have not seen where anyone is trying to claim any confidence in an exact figure. 2 km is a number with one significant figure, after all.
There are places that areas known to have zero ice cover, but over the largest parts of the continent, there are domes of ice that are known to be over 13,000 feet thick.
Over 2 and a half miles of ice depth.
These are the places where most of the cores are taken.
Keep in mind that every year some 10,000 people go there to study the place, and over 1000 stay all year around.
Cute! One NASA author using satellite data on Antarctic ice reporting the opposite of what another NASA author was reporting, also using satellite data.
Somebody didn’t get the memo!
Tom, the message is, Satellite data is always right….. 🙂
It’s NASA – of course the satellite’s are correct, they’d be out of a job otherwise!
IIRC the Envisat Altimetry uses radar to measure the surface altitude of the Antarctic ice cap. The depth of the ice is a function of the elevation of the rock underlying which is not measured. It is presumed that the crust under Antarctica is experiencing some of the largest isostatic rebound on the planet, though I do not understand why given the ice is still there. This large isostatic rebound is required to thin the ice. At least that is my understanding or lack there of.
As Jeff Norman points out, any value for Antarctic ice mass has huge uncertainty. I would suggest that ice area, measured from satellite images, is a much better indicator of any trend in the amount of Antarctic ice. I find Ole Humlum’s chart, linked from https://wattsupwiththat.com/reference-pages/sea-ice-page/, a handy reference.
R Taylor ==> I couldn’t find that graph — I did find one of Antarctic Sea Ice Extent.
Maybe you’re speed reading past the first chart on the page, with the three squiggles. Beneath the bottom squiggle, the label says “Antarctic sea ice area”.
Of course, you can go to the original at
R Taylor ==> I think we are talking past one another. This post is about Antarctic Ice Mass (the mass of the land-based continental ice sheet) and not about Antarctic Sea Ice or its extent.
For one thing, if ice is disappearing from the East Antarctic Ice Sheet, where is it going? What mechanism is causing it to decrease?
The temperature in Antarctica almost never goes above freezing, and more than a few miles from the coast, it never does.
The vast majority of the entire continent is many tens of degrees below freezing all year around.
There are two ways for ice to leave Antarctica…calving of glaciers at the coast, and sublimation from the surface of the ice.
Any H2O that sublimates from the ice sheet is overwhelmingly likely to fall back as snow. More moisture in the air goes into the continent than ever leaves.
So…what is supposedly happening to thousands of gigatons of ice every year?
Nicholas, you forget to mention geothermal thawing and in some places a lot of suglaciar volcanoes
Jacques,
“Nicholas, you forget to mention geothermal thawing and in some places a lot of suglaciar volcanoes”
A fair point, if I did forget that.
I did not forget it though…it is why I started out by specifying I was talking only about the East Antarctic Ice Sheet (EAIS), and these processes are not particularly significant over that very large proportion of Antarctica.
But in any case, even if there is melting under the surface over the EAIS, it would only cause net ice loss from the ice sheet if it either flowed to the sea as water, or evaporated into the air and this evaporated moisture then flowed off the ice sheet on a net basis.
The EAIS is an area comparable in size to the entire United States, and most of the volcanic activity is particular to West Antarctica…the part west of the trans Antarctic mountain range:
As far as I know, no one has ever suggested any significant amount of liquid water leaves Antarctica.
Nicholas ==> It is going into the air and the sea — that’s the current understanding.
Kip,
“Nicholas ==> It is going into the air and the sea — that’s the current understanding.”
Yes, of course, and I started by saying just this in my comment higher up in the thread.
And as you stated in reply, and which I agree with…no one really knows, and as you also said, the amount is in any case trivial one way or the other.
But let us consider each possible case on a logical basis.
To go into the sea as ice, requires it to first go from the interior to the coastline, no?
The rate at which this occurring would have to be accelerating for ice loss to be accelerating.
And what would cause such a change?
Could recent warming (if it exists, which is dubious at best) do this?
How long would it take for warming to propagate through ice that is miles deep?
The answer is a very long time.
Ice is a very good thermal insulator. Just ask anyone who lives in an igloo, or has survived frigid temps by digging a snow cave to shelter in.
If it is going into the air, this would have to be because the surface is losing more to sublimation losses, than is being gained from snowfall, or sublimation deposition, or by riming (when fog exists at below freezing temps and small droplets are deposited on a surface as solid ice).
Since over the parts of the East Antarctic Ice Sheet whereupon we have bases, it is well know that they have to be dug out on a continuous basis, or else built on stilts or piers to allow for the accumulation of ice which is ongoing, this seems provably to be a false proposition.
IOW, it aint happening.
I know of zero sites where anyone has documented ongoing loss of surface mass. Which gives me another idea…what about GPS devices placed over a large grid to measure the height of the surface? This should be easy to do, and no one would have to check on them very often if they were equipped with solar panels for power. We build far more complex devices to measure ocean temps.
Personally, I tend to think it likely that any moisture in onshore winds that flow onto the continent very probably winds up deposited onto the ice sheet. A warmer world is a wetter world, a warmer ocean evaporates more water from the surface, and so logically we can expect that more moisture will flow onto the continent and be deposited as ice if we do have global warming.
Climatologically/meteorologically speaking, offshore winds from Antarctica are very surely dryer than onshore winds, being that the winds leaving Antarctica consists of continental air, and onshore winds are marine air. Continental air masses are in every case dryer than marine air masses.
Winds flowing onshore are also forced to ascend to altitude, which is again a process that squeezes out moisture on a net net basis, compared to any offshore flows, which are descending.
There are very good reasons why miles of ice have existed for tens of millions of years on that continent. One of them is that moisture that flows onto the continent only leaves by flowing to the coast very slowly.
We have ice cores that prove ice accumulates there year after year for millennia on end.
After reviewing the literature on the subject, I find that the parts of Antarctica that lose more moisture from sublimation and wind blowing snow away, than falls as snow, are well described and quite distinct. They even have a name which refers to the notable difference in appearance caused by a net loss of mass…they are called “blue ice areas”.
They make up less than 1% of the total area of the continent.
Just like evaporation, sublimation ice loss is proportional to temperature.
Cold air is capable of holding far less moisture than warm air, and when it is very cold, as it is over the ice sheet, sublimation occurs very slowly even though the air is very dry.
Wikipedia has a summary of the phenomenon.
Blue ice areas of Antarctica:
“Blue-ice areas make up only about 1% of the Antarctic surface ice; however, they are locally common and scattered across the continent, especially in coastal or mountainous areas, but not directly beside the coastline.”
They are mostly areas of intense Katabatic winds that blow away any snow that falls.
There is generally no evidence of melting over these places.
And notably, ice from these places is found to be as much as 2.7 million years old.
The real shame in all of this is that global warming alarmism prevents any real science from occurring, since nearly all funding is reserved exclusively for research that is designed to support a predetermined proposition.
Blue-ice area – Wikipedia
Note that none of these places exist over the vast EAIS interior.
Which is where the vast majority of the total ice exists on that continent.
For comparison, it is thought that if all ice were to ever melt from Antarctica, sea levels over the globe would rise by some 200 meters, but if the West Antarctic Ice Sheet were to collapse, the sea level rise from that unlikely event would be “a few meters”.
IOW, to reiterate, the vast majority of the ice is over the parts of the EAIS where there is a net gain of surface mass every year, and where the temp is tens of degrees below freezing every day of the year.
Loss of ice from Antarctica is just like every other facet of global warming alarmism. It consists of weak and at best inconclusive data, is more of an idea than a thing for which evidence exists, is very difficult to make even a theoretical case for, and which is all probability is not only not happening, but the opposite is.
The strongest case for the possibility is that no one can prove that it is categorically not occurring.
Correction:
“ it is thought that if all ice were to ever melt from Antarctica, sea levels over the globe would rise by some 200 meters”
I should have written that the amount would be some 200 feet.
Not meters.
The best evidence that claims of ice loss from Antarctica are at best science by assertion, and at worst pure malarkey in opposition to the truth is our old friends, the tide gauges.
They show no increase in the rate of sea level rise over the period of time we have records from them, which in some cases is over 150 years.
Actual photos do not show any provable sea level rise that can be discerned by eye, and this is confirmed by an absence of any actual locations that have been inundated by a rising ocean, except in cases where it can be shown the land has dropped.
Extrapolating from the well evidence fact that the alarmists have been and continue to be 100% wrong about every single thing they have ever asserted ort predicted, we should all likely infer that it is overwhelmingly likely that Antarctica is getting colder and gaining ice…fast.
And that sea level is not actually rising much if at all.
It would not surprise me one bit if it turns out the estimate for total ice mass and average ice depth are stats of the sort which someone took a wild ass guess at one fine day, and everyone since then has looked at the number, and with no way to contradict it, and no desire to go to the trouble to make a different WAG, has simply been repeated as if a fact ever since.
Aren’t there radar methods that could actually sort this out?
Captain, the Vostok ice core was 3.35 km long (deep) and did not reach bedrock. You could utilize the numerous ice core data as a check against a variety of geophysical methods to make a more refined estimate of Antarctica ice thickness, but the 2 km looks reasonable.
Captain ==> Satellites are not scales capable of measuring mass at a distance. Just like trees are not thermometers.
Give a think to what kind of data can be collected from space about a 3 dimensional, multi-layer, surface.
Satellite’s though, when properly calibrated and checked against atmospheric conditions, should be able to give good data on surface levels compared to an established datum level – if you can establish the depth by other means below that level then plotting the positive or negative changes should then be relatively straightforward. Not easy for sure – I’m willing to bet an ice depth survey across Antarctica is way down everyone’s list of achievable projects, but it could be useful in the long run.
RP ==> It is because it is complicated and complex and they are depending on an indirect measurement that has a lot of “slop” (that’s a technical term)…so they all use the same data sets and come to differing conclusion — they don’t even agree on the SIGN of the change.
didn’t we just learn that it was record cold in antarctica? i’m banking on ice loss.
So cold in Antarctica it’s freezing it’s ice off.
Doc ==> Cute!
The NASA Vital Signs report is obviously full of holes … Ice Holes
Bryan ==> I see what you’ve done there . . .
You could apply the IPCC method of averaging the competing sources, then calling the average “a scientific consensus” 😉
Eric ==> Ah, either that or just declare their preferred answer to be Settled Science.
Or, God forbid, admit there is conflicting evidence, and we don’t really know what happening.
Tom ==> I agree with you — “We don’t really know…” is the correct answer to many science questions.
Like this?
Mr. ==> Clever . . . .
On average, they are all completely full of crap.
“ANTARCTIC SEA ICE EXTENT LARGEST SINCE 2015, AND GROWING” Per June 2021 analysis.
It must be noted that all “recorded history” only dates back to 1979 when we we told a new ice age was at hand. Of course it’s warmed since then and with sea ice extents expanding in both the Arctic and Antarctic in recent years tied to our projected entry into a Grand Solar Minimum, it stands to reason we can continue to see expanded sea ice extents into the foreseeable future. Probably not a straight line but certainly a trend reversal back to 1979 levels or greater.
John ==> That is Sea Ice Extent — this piece is about Antarctic Ice Mass.
My bad!
John ==> No worries –the press forever mixes them up too.
No wonder, it’s logical that the greater the mass of ice in Antarctica, the greater the extent – regardless of stupid melting ice cream cone analogies.
Given that anything NASA says, on the subject of “climate”, must be taken with a very large ‘grain’ of salt (owing to their propensity to be “creative” with the truth), I’d guess anything they publish might be exaggerated by at least an order of magnitude … subject to change at any moment.
I get it, it’s that “very large ‘grain’ of salt” that is melting all the ice. 😉
Now that’s funny.
More like made up from whole cloth than merely exaggerated.
I think you’re right. It isn’t just half truths. They’ve entirely forgotten where they put the truth.
Do you think the Denver mint would miss a few quarters?
Scissor ==> Took me almost an hour to get your comment — Antarctica losing a few or few hundred Gt is trivial.
Sorry, I was looking for some quarters for a car wash earlier and thought that of the millions in the mint, they couldn’t possibly miss a few.
But nature, I think, will and does give the Antarctic more and less ice. I doubt that any mint employees decide to throw in a few of their own coins into the vault.
Scissor ==> Yes, every year Nature adds snow which packs down into firn which packs down into ice. This has been happening for a very long time.
“Antarctic Ice Mass – Gaining or losing?”
YES. It does both. If there is a pro-longed drought in antiarctica then it will lose ice for years. It certainly isn’t melting at the surface.
Also, measuring gravity is yet another proxy. They assume it is measuring ice, but it also is measuring any other mass – like magma near the surface. If a magma chamber loses pressure and drains it will show up as a mass loss and they assume it is Ice. Maybe it is, maybe it isn’t. That is the problem with proxies – their result are always complicated because natural systems are complicated.
Robert ==> Yes, of course, the GRACE satellite does not actually weigh the ice on the continent of Antarctica. So, perhaps you are right — and i tend to agree with you. Zwally and his team are reanalyzing the satellite and other data sets and come up with entirely different answers.
Thus, it may be that the methods and procedures are so different that they find opposite results.
I’ve often wondered that – since Antarctica is practically always below freezing, any warming in the rest of the world would increase water vapour in general, with some of that ending up in the South Pole, where it would immediately freeze out. Antarctica, the world’s dehumidifier, would grow in a warmer world.
PCman ==> Did you ever leave a tray of ice cubes in the freezer for months and months? Did you notice hat the cubes grow smaller and smaller over time?
Isn’t that called sublimation? I mentioned that in a discussion several weeks ago on Antarctica and was roundly criticized. Wasn’t that what they found was causing ice loss on Mt. Kilimanjaro, two decades ago … extra low temps and drying winds?
Rory ==> 10 out of 10! Exactly right — sublimation. Any cold weather sailor is familiar with the terrible skin drying effects of freezing winds — can be far worse than desert sun!
Kip, sublimation is analogous to evaporation, in that it depends on the temperature in relation to the relative humidity.
It is always very cold there, and air at that temp can hold very little moisture.
So not only is there very little energy for sublimation to occur, there is very little capacity for the air to hold any moisture.
It is very likely than depositional sublimation exceeds ablational sublimation almost all of the time over almost all of the continent.
Than is how 2″ of average annual precip have resulted in miles deep ice existing for millions of years, despite it constantly flowing to the sea.
See here in this chart, and consider that the average annual temp of the interior is -57°C:
Here is a better way to look at it, in the mass of water able to be held in air at various temps: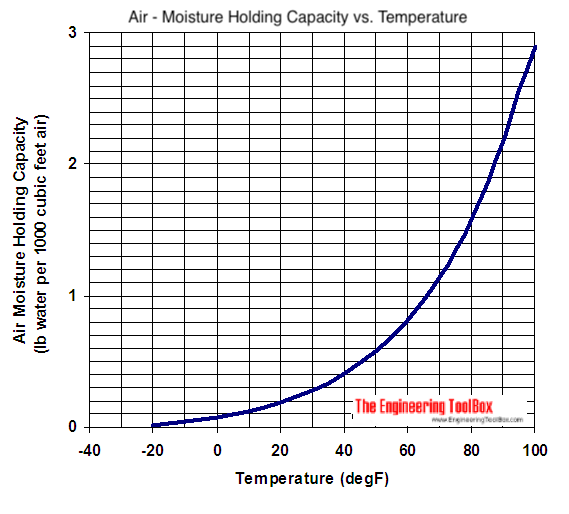
Ablation by sublimation proceeds at a glacial pace in Antarctica.
Which is why it has miles of water even though it is among the driest of deserts.
Rory
The katabatic winds where the atmosphere flows off the continent at very high speeds cause sublimation due to dryness, they are then followed by onshore moist atmospheric flows.
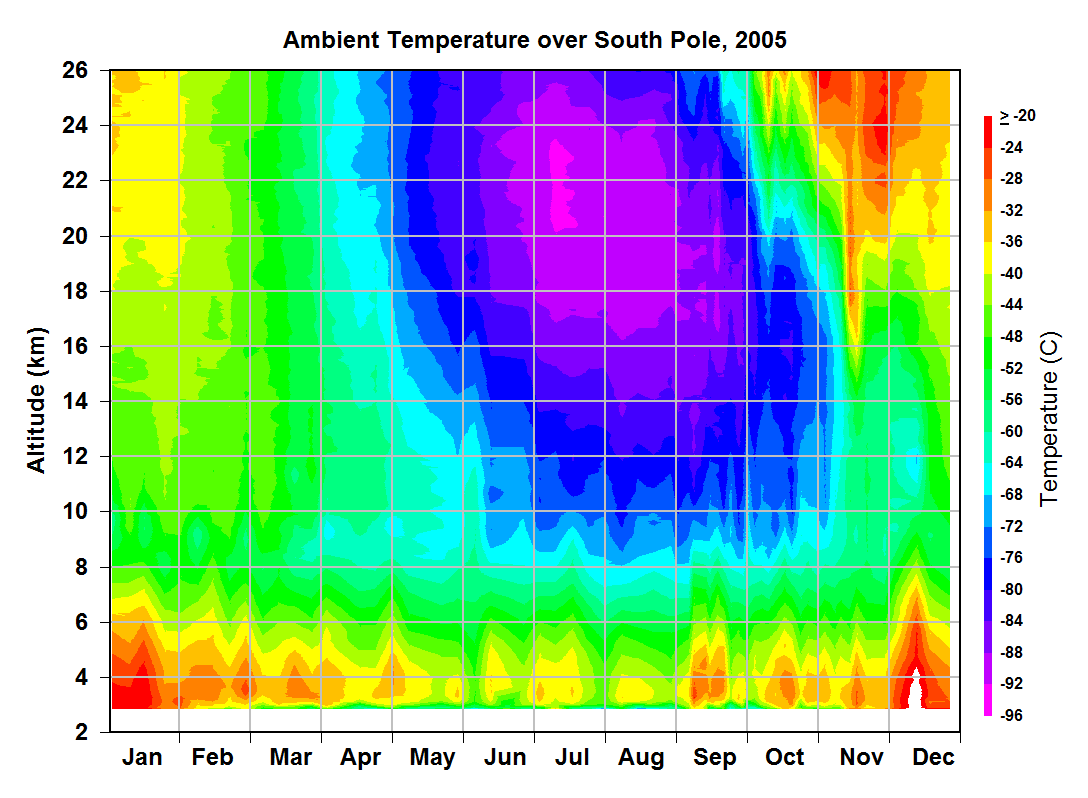
Look at the temperature pulses in the chart linked below.
The huge volume of very cold air flowing off the continent assists in sea ice area formation, which is disturbed and reduced by circumpolar winds, which have increased in speed this century. The Ying and yang.
Note that the temperature profile all the way up the vortex changes, most notably during winter and spring during the temperature pulses.
Regards
Antarctica is a beast, the most powerful and influential area on the planet. Indirectly it controls the global average temperature, and along with other atmospheric dynamics, Arctic amplification.
So I was right. That was basically what I wrote before and was soundly berated for believing such nonsense. Thank you for taking the time to provide details.
Look at the comment from Angech, below … as well as the others appearing to argue against sublimation and frost free freezers as an example.
Old time refrigerators, along with smaller “apartment” size models are still plagued with ice build-up. Have you never enjoyed the thrills of defrosting a freezer?
TonyL ==> Not in a long time . . . . but my childhood freezer was a nightmare.
Yes, but a home freezer doesn’t have a steady influx of warm, moist air from the rest of the world.
Leave the door open a crack and you might have something more analogous to the Antarctic.
Well the freezer is opened every now and then in our supermarket age and warm moist room air enters = build up of ice eventually needing defrosting. Pretty analogous I would say.
Kip Hansen
Did you ever leave a tray of ice cubes in the freezer for months and months? Did you notice that the cubes grow smaller and smaller over time?
I see this comment from time to time and worry about its application as any sort of analogy.
Basically if you took it to its extreme there would be no ice in Antarctica.
May I suggest we leave the analogy in the fridge where it may or may not belong?
angech ==> The fridge is an example most people have experienced, thus apt. The REAL case is in areas with snow in which snow disappears over time without melting — it sublimates away.
https://en.wikipedia.org/wiki/Sublimation_(phase_transition)
Actually sublimation creates water vapor which refreezes on the sides of the freezer.
Jim ==> Or excapes into the room when you open the freeze. Sublimation in the real world (outside of our kitchen’s freezers) happens with snow and ice on the ground.
Depending on where one lives, and the season, opening the door to the freezer may introduce water vapor. I would imagine that the air in a very cold enclosed space is going to be quite dry after any available moisture refreezes on the coldest surfaces.
CS ==> Yes, in my area, frost develops in the freezers mostly from opening the doors as we have very high humidity in the summer.
The ice build up in a freezer is because warmer air gets in and condenses but in doing so raises the temperature in the freezer compartment causing the refrigerator to work harder to keep the temperature down. With Antarctica surely any increased snowfall ( rare) caused by moisture laden warm low pressure systems would raise the continents temperature, which isnt happening
Lawrence, what you are sure of does not sound like a sure thing to me.
Antarctica is not cold for the same reason a freezer is cold.
How much will the average temperature of the whole continent increase if the air flowing onto the continent does not get any warmer on average, but the humidity rises such to cause it to hold 50% more moisture, thus causing average annual precip to increase from 2″ to 3″ over the whole continent?
Please be specific and show your work.
Mostly clouds and snow or rain cause the temp to decrease, and also to lower barometric pressure, which likewise results in a decrease in temp.
Sublimation refers to ablation and deposition.
What really matters is the temperature of the air.
The air there is very dry, but mostly because cold air has extremely low moisture capacity.
The lack of energy due to low temp, and lack of carrying capacity of air which is that cold, add up to ablation being almost nonexistent, net net.
Moisture evaporates from the ground in mid latitudes during the day, but at night what happens?
It condenses back out as dew, fog, and frost.
Same thing occurs re sublimation…there is ablation at times, but mostly there is deposition, either by sublimation or by riming of fog.
IOW, it is not necessary for snow to fall to get ice accumulation in Antarctica.
I think applying sublimation to the Antarctic needs a few qualifiers. Ice sublimates *if* the cold air contacting the ice is dry enough. This is often the case in a place like Texas, where some really cold air heats up and can now hold more water vapor in it. The temperature may go from 20F to 30F – still too cold to melt the snow, but the snow starts disappearing.
However, if the air is saturated with water vapor and continues to get colder you will get ice and snow out of it. A good way to create a mass of colder air is either to mix it with colder air or to lift it up over a mountain range.
So, a mass of air moving from a warmer ocean environment to the Antarctic might drop a lot of snow, then as it passes over a mountain range it becomes dry enough to sublimate some ice and snow on the other side. The chances are it will drop more water (from the oceans) then it takes away (through sublimation), so you end up with a snow covered Antarctica.
If you think about this process as it regards ice cores…you suddenly start wondering just how accurate the ice cores really are in recording amounts of snow.
Robert ==> Ice cores are accurate at representing Ice Cores…..period.
I have never left any out in a room that was pitch black for half of every year, and averaged -57°C(-70.6°F), no.
If we use the worst Grace data and hell lets even apply stupidly high acceleration then the ice is all gone in a million years.It’s a climate emergency and we need to act now.
LdB ==> Actually, it would take 175,496 years (175.5 millennia) if no more snow fell and no ice was added. That is still a long way from an Emergency, I agree.
At Zwally’s calculated rate of -12 Gt/year, it would take 2,208,333 years. or 2,208 millennia.
No one should hold their breath.
But . . but . . if you don’t hold your breath, aren’t you emitting more CO2 and adding to whatever problems that causes?
Peter ==> Yes, some climate zealots (Extinction rebellion?) believe the solution is to eliminate all animal life — starting with humans.
If the plan is to eliminate all animals, and you begin with humans, who is left to execute the rest of the plan? Trained monkeys?
Me thinks the Extinction Rebellion ought to go back to the drawing board. It is obvious they have not thought this entirely through. ROFL
Who can tell us if humans will even be around in 175 thousand years, let alone 2 million years!
CS ==> Are you asking for a scientific answer or a religion/philosophy answer?
Steve McIntyre had a good (but very long) analysis of Zwally 2015 and competing studies here:
Antarctic Ice Mass Controversies « Climate Audit
I haven’t had a chance to give it a good re-read, but I remember it was excellent.
Ed ==> Steve does a vary admirable job analyzing the conflicting reports at the time (2015). But, of course, there is no real conclusion. Zwally (2021) sticks to his guns and so the Ice Wars continue.
Hadn’t read it before. It is excellent, thanks for the link.
And herein lies probably the biggest schism between pro and anti AGW sides. Who’s data do you believe? But non of the contested data answers the AGW question of “where’s the proof” even if we settle on a data set. Natural climate variations have the history so you’d think that would be enough/only “proof”.
markl ==> Epistemological Values — differing.
According to GRACE the Antarctic continent is losing ice at a catastrophic rate of 150 cu km per year.
Since the Antarctic ice cap contains about 2,650,000,000 cu km of ice, it means it will all melt away by 176,668,688 AD. We should panic immediately.
Just imagine how many generations of stampeding snails there’s be trying to escape the ensuing flood.
LOL… That is hilarious. Stampeding snails.
Well, if your time of arrival estimate is correct, Antarctica may just have moved northwest and taken Tierra del Fuego with it… OR it might split into two continents, due to the activities of Mt. Erebus and its cohort of new volcanoes (that might rise) and move build new land masses. It would be interesting to find out what happens by that time.
Bruce ==> Yes, try to imagine creating a graphic that illustrates the loss rate.
From the study: “−12 ± 64 Gt a−1 by 2012–16.”
First off – hate this ‘a-1’ business – what’s wrong with “/a”?
Second – I would have failed grade 9 science if I did any kind of graph or report without error bars, like the graphs above.
Third – +-64GT on -12GT? Why bother printing the results? I wouldn’t waste a dollar on a ultrasonic tape measure that was +-1cm let alone +-10m – which is like the error on these measurements of ice loss/gain, using multi-million dollar satellites.
Climate “Science” is unique in its use of numbers which are dwarfed by their error bars.
Actually, that probably explains why error bars are so rarely used. And, when they are, they are typically 1 sigma rather than the more common 2 sigma in other disciplines.
CS ==> Sigmas, of any variety do not, of course, represent the possible blunt measurement errors involved with the data — how likely it is to be the correct actual physical value. That metric is Measurement Error.
PCman ==> One would think that with all the standardization in scien e notation that this one would be the same in all the journals. I have always used “so-much/yr”.
I suppose we should all notice carefully that the GRACE Ice Mass graph is absolutely error free! (like most CliSci graphs, includes no error bars. Neither does Zwally.
Fourth – is this one standard deviation (68% confidence) or 2 sigma (95% confidence). Not stating error range AND confidence level of same shows lack of basic science training. Should it be +/- 128 GT (95% CL)?
Rick ==> Where are yo finding these numbers? Which study?
I was referring to PCman999’s comment: “From the study: “−12 ± 64 Gt a−1 by 2012–16.””
I’ve seen a lot of climate science papers that include a +/- error value without clarification of it’s origin. Often it turns out to be a “1-Sigma” value. This is not standard scientific or statistical practice. If there’s such a thing as a “default” error statement it is the 2-Sigma or 95% confidence level.
Rick ==> SD requires that the distributions are NORMAL — almst no real-world data is normally distributed.
The best notation, in my opinion, is real Original Measurement Uncertainty — real Error Bars.
Kip: The numbers are quoted from Zwally 2021 reconciliation paper. I did a search of the paper for any explanation of how the +/- error was derived. Nothing. The terms: Sigma, confidence, uncertainty, standard deviation, do not appear in the paper. Suggests that the authors are unfamiliar with the ISO G.U.M. or simply ignoring the practice of clearly stating measurement uncertainty when reporting numerical quantitative results. As Willis might say, “bad scientists, no cookies.”
Rick ==> I will review Zwally 2021 on this issue. May include it in a follow-up post.
Kip, a few thoughts.
In my opinion , GRACE is garbage. First let us understand that Antarctica ice-loss and GRACE Sea Level Rise are intimately linked. What Grace says about SLR impacts GRACE ice loss levels.
Other commenters here have noted that Antarctica is undergoing a very high rate if rebound.
Actually, the rebound is *estimated* from GRACE data. Here is the story:
The GRACE people *assert* that for every ton of ice loss, there is a ton of mantle rock which flows in to replace the lost mass. In a trivial case, your net mass change is 0.000, and you can claim any crazy ice loss you like, with the mass replaced by rock migration and crustal rebound.
And this is what we find in the GRACE analysis of the data. GIA, or glacial isostatic rebound is a critical component of both the GRACE ice loss and SLR. Then we find out that the GRACE SLR estimates conflict with reality with what is known as the “closure problem”.
Rud Istvan covered this topic in one of his ebooks. One more reason I need to get those ebooks and keep for reference.
TonyL ==> Antarctic Ice Mass is a Scientific Controversy, a Science War, with two sides, both within NASA. Because it touches on CliSci it is hopelessly partisan. Both sides think they are right, of course. One side may be thinking that they MUST conform to the Climate Crisis meme.
Somebody:
## Global warming requires sea rises, we can’t find it anywhere else so let’s blame it on something immeasurable where nobody can check
** Actually, in real life, consuming Kool Aid would actually do that – or any other beverage containing large amounts of sugar. Is the US still on a 3 cans per day ‘habit’ And, yes it is A Habit in the contemporary vernacular
Here’s a nice little BBC story that is Wildly Off Topic but simultaneously Madly On Topic. ‘madly’ being the operative here
Headline:”Stink bug discovery raises fears of threat to crops”
here
What would anyone, in their usual mad rush these days to earn money, mind the children, eat mush, glue themselves to the road and pay tax, make of that story?
Read it and you find
‘Hundreds of these bugs gather in your house’
Yeah right, thousands of spiders and flying critters do so every Autumn here in the UK. With perfectly no problemo signor
Don’t bother them and they won’t bother you
‘Only one single bug has been captured’
Yet this is front page BBC News and has ‘raised fears over food crops‘
‘Stink bugs attack peaches and nectarines’
On nooooohh, cue picture of The Scream. That’s certainly the end of UK Peach & Nectarine Industry.
No mention of how huge and important the UK peach industry actually is.
“Zero” and “Not” being the answers in case you wondered
See the connection?
World Science and all who sail in her have completely lost their heads/minds – and the whole shebang is now in flat-out headless chicken panic mode.
Thereafter putting all our (scientifically/technically illiterate) Western politicians into a similar state and they then project that, via the MSM, onto the general populace. (++)
As Mencken said/predicted
++ See how it was/is a Government funded organistion that found the stink bug and the BBC, reporting it.
Compared to The Science, it’s perfectly obvious that these critters are among the most sweetly & delicately fragranced things that God, Nature, Gaia whoever, has so far created.
Bless them for pointing it out
Peta, I’ve had visits from stink bugs for a couple of weeks as we slide into Autumn over here in the NE corner of my state. They land on the screen, spook my cat, and annoy me because they won’t leave unless I spray them with a degreaser like Fantastik, which they hate. But they do go away. They only want in because it’s chilly outside and they don’t like that.
Once we have a frost, they’ll be gone.
Sara ==> Unfortunately, they’ll be over-wintering in the cracks and wall cavities in your home and come back out in the Spring.
Eeeeewwwww!
Sara => Yes, sorry. In my area, ladybugs also congregate over the winter in the walls of my home — those that are too close to the interior emerge too soon into the warmth of the home. we have to sweep them up several times through the winter.
Indeed they do, I’m fighting off the incomers as we speak!
Peta ==> The brown marmorated stink bug is also found in rural New York State where is congregates in homes over the winter and then reappears in the spring. If you crush one between your fingers, the smell lingers for hours and is very hard to wash off — I use bleach, which leaves its own unpleasant odor.
So given the magnitude of the possible error it looks like the answer to whether Antarctic ice mass is increasing or decreasing is “no one knows for sure but they’re trying to figure it out”.
Which is unacceptable to the indoctrinated and the dogmatic but that’s the way scientific discovery works. There are a lot of things we don’t know but are trying to understand. It’s so hard for some people to say “we don’t know”. Try it yourself and see if it hurts you. If it does, you just may be dogmatic.
This is exactly the same situation that Galileo ran into.
The Vatican were quite happy for astronomers to do their calculations ‘as if’ the Earth was going round the Sun – because they got more accurate answers that way.
They just wanted it publicly stated that the Earth was static in the middle of the Solar System, because a large amount of religious dogma depended on that.
So long as the public kept accepting their religion, they didn’t care what the truth was, and were quite happy to let the scientists do what they wanted. What they did not want was the money to cease rolling into the Church coffers.
You will find that The Climate Change supporters are quite happy with the idea that the mass balance is complex. They just don’t want it publicised that their Articles of Faith are wrong. And one who does that gets put under house arrest , or cancelled in modern parlance, for rocking the boat and threatening the income flow….
Zwally has twice upset the apple cart and both times has been ignored.
My feeling is that he is a warmist based on previous Antarctic work but is also a scientist who follows not fudges the facts.
He was supposed to update his paper but has not done so to date [3 years?].
The Grace studies were crimped by a satellite conveniently going out of action after an uptick in Greenland ice [5 years ago??]
The mechanisms of assessing ice volume by gravity changes is extremely arcane to say the least.
Huge standard deviations capable of far outweighing the observed changes
Because of the large degree of uncertainty it is very easy to adjust a parameter slightly in the assessment and put a finger on the scale.
When the new Grace readings were done Greenland continued on it’s downwards course ignoring the blip year.
The Antarctic was also reported as losing a lot more ice as above until Zwally’s second study.
The jury is out.
Zwally could settle matters with an update but of course it might be him that has to change his figures.
The only reliable figure is sea ice and this has shown enormous variation recently suggesting that natural variation is also alive, well and a lot bigger than anyone is willing to give credit to.
angtec ==> The last graph in the post is from Zwally’s 2021 update. The link to the study is given.
Published on WUWT a few years ago, I believe by someone who frequently publishes here, was an examination of the publishing of one alarmist blathering about so many Giga tons of ice having been lost from Antarctica over the previous 25 years. He (or she?) listed (with links) the 4 most recently published estimates (by supposedly responsible parties, such as NASA, NOAA, and some academics) of total Antarctic ice mass. There was quite a bit of difference between them.
Then, taking the difference between the smallest and the largest as a reasonable measure of uncertainty of those published estimates, showed that this claim of 25 years sum of ice loss was, as the general saying goes, not even a rounding error of the uncertainty in total ice mass.
Andy ==> It is difficult, complicated, complex, and amounts to a lot of guessing.
Actually, dividing the range by 2 would be a better estimate of the 2 sigma uncertainty.
The one and only point of the analysis was that the ice loss claims were ridiculously unmeaningful.
I have a question:
Can gravity measurements of Antarctic mass fluctuate due to seismic activity under the ice ?
Thank you for any clarification.
Gravimeters are routinely used to monitor volcanoes. The Antarctic Peninsula has several volcanoes, some of which are completely under the ice. The volcanoes are part of the Pacific Ring of Fire and some are quite active. So the answer is yes, you will see changes using locally installed gravimeters.
Ireneusz Palmowski ==> Don’t know. Ice surface height (altitude) fluctuates as the land moves up and down — Vertical Land Movement — due to GIA and other geological forces.
Where do ice mass measurements in Antarctica show the most variability? Are these changes related to changes in sea current temperature, as in Greenland?
Ireneusz Palmowski ==> If you follow the links to the various studies, or Google Antarctic Ice Mass, you will find lots of colorful map of ice mass loss and gain.
I would have guessed that changes in sea current temperature might affect sea ice extent around Antarctica and Greenland but would be far less likely to affect land-based ice loss or gain?
RP ==> Less likely to affect land ice sheets, but can erode the frontal edges of glaciers that are sliding into the sea.
I think troposphere temperature can only affect Antarctic ice during La Niña and El Niño periods, and only during the summer season.
http://ds.data.jma.go.jp/tcc/tcc/products/clisys/STRAT/gif/zt_sh.gif
Ireneusz Palmowski ==> Read Zwally’s 2021 paper — lots of interesting stuff in there.
How much time and effort is put into the study of Antarctic ice? Why are there no equivalent amounts put into the study of human adaption and how we can improve? Speaking scientifically – not politically – this should be getting as much media attention if not more because of the huge benefits shown.
Michael ==> They study antarctic Ice Mass because of doomsday prediction from climate zealots that all the ice in Antarctica will melt and flood the whole world.
That is a totally nutty idea, of course, but some take it seriously.
There is some infinitesimal “chance” that Antarctic glaciers will begin flowing faster, putting more land ice into the seas, causing more rapid Sea Level Rise.
Part of the poorly supported theory is that a loss of the floating ice shelf will eliminate a buttressing effect at least as large as the friction between the glaciers and bedrock and allow the glaciers to speed up.
Kip – please don’t disrespect the theory. Just because it’s core system relies on invisible alien spacecraft with massive heat rays and blowtorches to enable the melting process that doesn’t mean that it couldn’t feasibly happen. Credit where credit is due, please! sarc (because some people still don’t get the humour).
RP ==> CliSci is full of magical thinking and theories that depend on magical effects.
If it ever was deemed necessary and a good idea, we could always pump water from the coastal seas in Antarctica, to the interior, and let it freeze.
Set up a nuke power plant and use the entire output to pump sea water inland.
How much could be pumped this way?
I bet someone here could do the math.
With both Antarctica and Greenland ice, the total mass is never mentioned to put things in perspective. Every single time they mention an anomaly, we need to point out the total and how little has shed, and how long it would take a linear process to do anything meaningful. We will be long dead and gone before anything important has melted, and God knows, into the next ice age.
Captain ==> I am a Captain too.
Mankind will have emigrated to other planets long before the ice sheets on Greenland and Antarctica melt.
As I recollect, the last time I extrapolated the rate of ice loss for Greenland I got a number of about 15,000 years for the ice to be gone. Might we possibly be into another glaciation episode before then?
So, according to their own data they don’t know what is happening. Only fact in actual evidence is the Antarctic is still 100% frozen and no possibility it will become unfrozen anytime in the foreseeable future. Oh, the horror!