Guest Post by Willis Eschenbach
Let me invite you to wander with me through some research I’ve been doing. I got to thinking about the surface radiation balance. The earth’s surface absorbs radiation in the form of sunlight plus thermal radiation from the atmosphere. On a global 24/7 basis, the surface absorbs a “downwelling” flow of about half a kilowatt of radiative energy per square meter.
I investigate science in pictures. The raw numbers mean little to me. So I made a global map of variations in the absorption of total energy. Figure 1 shows that result.

As you might imagine, the most absorption is in the tropics. The least is up on the Antarctic Plateau. And you can see the light line above the equator in the Pacific. That’s the location of the ITCZ, the “intertropical convergence zone” where the atmospheric circulations of the northern and southern hemisphere meet. It’s an area that gets thunderstorms most days, which reflect lots of sunlight back out to space.
But that’s not what first caught my eye …
I often start researching my way down one road and then I get sidetractored into a different path … in this case I eventually noticed an oddity of that graphic. Most curiously, the total energy absorbed by the the surface in the two hemispheres is exactly the same …
… moments like this are when I’m happy that I’m an independent unfunded researcher, free to follow my monkey mind. So now, as I’m in the process of writing this up, I want to know if this exact equality between the total downwelling surface radiation in the northern and southern hemispheres is a coincidence, or whether it is stable over time. So hang on while I go take the annual averages … OK, Figure 2 shows the annual surface radiation absorption by hemisphere.

Now, this is most fascinating … despite the fact that the southern hemisphere has 30% more ocean than the northern, despite different cloud patterns and weather formations, despite one pole being a seasonally frozen ocean and the other a 5,000 foot (1,500 m) ice-covered stony plateau, despite the annual average amount absorbed in different places ranging from 120 to 670 W/m2, despite the hugely changing absorption due to the seasons, despite all of that, every single year the amount of energy absorbed by the surface is split evenly, to within half a percent, between the two hemispheres. Cries out for an explanation …
… my guess is that it’s the result of thermoregulatory emergent phenomena, but that’s a topic for another time. See, this is what my research is like. No straight lines. I prefer to wander side-trails I’ve never trodden. So I’m as surprised as you are that the absorption is almost exactly 50/50 north and south and that that is so stable … but I digress, that’s a topic for another day.
To return to the theme of the post, at the same time that the surface is absorbing half a kilowatt per square meter of downwelling radiation, the earth (like all solid objects and most gases) is also constantly emitting a certain amount of thermal “upwelling” longwave radiation. The amount that gets radiated is a function of temperature. So you can calculate the temperature from the amount of emitted radiation using something called the Stefan-Boltzmann equation. It’s how IR stand-off thermometers work.
The amount of radiation that is emitted is almost always smaller than the amount absorbed, because:
• some energy is lost from the surface as “sensible” (feel-able) energy
• some energy is lost to evaporation as “latent” energy in the form of water vapor, which releases energy when it condenses.
• some energy is “advected”, meaning moved horizontally from one point to another.
Figure 3 shows another global map, this time of upwelling thermal energy emitted from the surface.

So in rough terms, the surface receives 500 W/m2 of downwelling radiation, and only emits about 80% of that, 400 W/m2, in the form of upwelling radiation. The rest leaves the surface as sensible and latent heat.
From this, an interesting question arises—if the absorbed radiation goes up or down by one W/m2, how much does the emitted radiation change? Naively we might assume that since the amount emitted is 80% of the amount absorbed, for each additional watt per square meter of absorbed radiation, we would expect an increase in emitted radiation of 0.8 W/m2 … but does it work like that?
There are several ways that we can look at this question. Let me start with a gridcell by gridcell time series analysis. Here are the 1° latitude by 1° longitude gridcell short-term (monthly) trends in 21 years of records of upwelling vs. downwelling radiation at the surface. This is looking at monthly changes in both variables after the removal of seasonal variations. Let me call this the “Monthly Analysis”.

The most unexpected part of Figure 4 is that unlike the rest of the world, in the warmest areas of the ocean, when radiation absorbed at the surface goes up … emitted surface radiation goes down.
This is quite odd. If we take say a block of steel at steady-state, the more radiation it is absorbing, the more radiation it is emitting. And as we would expect, over most of the earth’s surface, and over all of the land, the absorbed radiation controls the emitted radiation. As is true for a block of steel, the more radiative energy that is absorbed, the more energy is radiated away. It’s just “Simple physics”, as mainstream climate scientists like to say.
But in the blue zones in Figure 4, the reverse is true—above a certain threshold, the more radiative energy that is absorbed, the less is radiated. “Complex physics”, as I like to say …
I say that this is because of the combined action of tropical cumulus fields and thunderstorms. These cool and remove energy from the surface in a host of ways, and in their wake leaving lowered temperatures and less energy to be radiated. Here’s a movie about how thunderstorms chase the hot spots.

Thunderstorms are unique in that they are not simple feedback—particularly over the ocean they are able to drive surface temperatures down to below the thunderstorm initiation temperature. This accounts for the fact that as absorbed surface radiation increases in those tropical areas, the amount of radiation emitted decreases … but again I digress …
The reality is clear from Figure 4. We are looking at a very complex system. There is no one single simple linear relationship between emitted radiation and absorbed radiation. Depending on the location and the nature of the surface (land vs. ocean vs ice vs …), it ranges from an additional 0.8 W/m2 of surface emissions per one additional W/m2 absorbed, down to a decrease of – 0.2 W/m2 of emissions per one W/m2 of additional absorption. Not only are they not of even approximately the same size, they’re not even of the same sign.
As Figure 4 shows, the short-term area-weighted global average trend is only an increase of about a quarter of an additional watt per square meter of emitted radiation for each one W/m2 of additional radiation absorbed.
The various areas do act as we might expect. For example, there’s a greater response in land radiation emitted than in the ocean, due to the ocean’s temperature changing more slowly because of its greater thermal mass. And the tropics show the least change from a one W/m2 change in absorbed radiation.
But Figure 4 only shows short-term, month-by-month changes. And because it take time for earth and ocean to heat up and cool down, these short-term changes will be smaller than the long-term changes. For longer-term changes, we have to look elsewhere.
My insight on this was that we have some 64,800 gridcells in each of the maps above. Over the centuries, they’ve settled into a slow-changing steady state. Each of these has a long-term average absorption of total radiation, and a long-term average emission of thermal radiation. After many, many years, these absorption and radiation levels have incorporated and encompass all feedbacks and delayed responses. We know this because the average of the first half of the CERES data is almost indistinguishable from the average of the full dataset. Figure 1a below shows the same analysis as Figure 1, except for the first half of the data.

So … consider several adjacent gridcells in mid-Pacific or somewhere. Each one has slightly different long-term averages of absorption and emission of radiation. This lets us know what we can expect to happen in that area of the world if the absorption changes by say a watt per square meter. We can know that because in some adjacent gridcell, this is actually happening.
For Figure 5, for every individual gridcell, I looked at a 5° latitude by 5° longitude square area, with the individual gridcell located at the center. Utilizing two of these 5×5 patches of cells, one patch showing emission and one showing absorption, I used standard linear regression to calculate the local change in emission from a one w/m2 increase in absorbed radiation for that small area. Since this is using local data from adjacent gridcells, let me call this the “Local Analysis”.


Figure 5. Local Analysis. Two views (Pacific and Atlantic centered) of a different way to measure the longer-term change in surface upwelling radiation as a function of the absorbed radiation.
There are some interesting things about Figure 5. First, overall, as we’d expect, over the longer term the surface responds more to absorbed radiation than is shown in Figure 4, which is looking at month-to-month variations. In Figure 5 it averages about 0.4 watts emitted per watt absorbed, almost double the value shown in Figure 4.
However, the areas of negative correlation (blue areas) are all in the same location, in the tropical ocean above and below the equator. And the ocean still is changing less than the land, and the tropics is still changing the least.
Moving forwards, there’s a third way and separate way to calculate the long-term response of the surface to absorbed radiation. This depends on a scatterplot of the amount emitted by the surface as a function of the amount absorbed, as shown in Figures 7 to 9.
To begin with, Figure 7 shows the scatterplot for the entire globe. Note that this uses exactly the same data as in the two previous analyses, the “monthly” and “local” analyses. In all cases, I’m using the CERES 21-year gridcell-by-gridcell average values for the surface radiation absorbed and emitted.

Now, the general trend that we’ve been looking at in the two analyses above, the change in emission for a one watt per square meter increase in absorbed radiation, is given by the slope of the yellow line above. And it shows something quite curious …
Most of the data shows a pretty linear relationship between absorption and emission. From ~ 100 W/m2 to ~ 275 W/m2 of absorption, it’s pretty much a straight line. And the same is true, although with a somewhat lesser slope, of absorption from ~ 275 W/m2 to ~ 600 W/m2 of absorption
But once the average absorption (longwave plus shortwave) goes above ~ 600 W/m2, there is no further increase in emission. In other words, all of the additional incoming energy simply is lost as sensible, latent, and advected heat, and the emission doesn’t increase … and of course, “no increase in emission” means no increase in temperature.
Remembering that in the monthly and local analyses above, negative trends almost entirely occurred over the ocean, I split the data into land and ocean gridcells and looked at the two responses. Figure 8 shows the response over the land.

Now, this is much more what one would expect to find. As in the aforementioned steel block, as absorption increases, emission increases. Everywhere we look on the land, when absorption goes up, emission (and thus temperature ) goes up. “Simple physics”.
But this is just the land … what about the ocean?

Here we can see what we saw in Figure 1—there are areas of the ocean where, when the absorbed radiation increases, the emitted radiation decreases … which also means that the temperature is decreasing.
How much does this affect the trend worldwide? We can use the data above to get the trends for each gridcell with a given amount of absorbed radiation. Figure 10 shows that result. Let me call it the “Global Analysis”. Of course, since it is looking at global averages it doesn’t have the fine detail of the other methods.

But it does give the same general pattern, with land emissions all increasing with increased absorption, and with large areas with tropical Pacific emissions moving in the opposite direction from the absorption.
So we have three different estimates of the changes in surface emission resulting from a 1 W/m2 increase in surface absorption. The first one, the “Monthly Analysis”, is short-term so it doesn’t include any feedbacks or slow changes. Thus it gives smaller results than the other two methods.
The other two include all of those slow changes, because they are based on two-decade averages showing the long-term steady-state conditions. Here is a comparison of the three methods.

As you can see, because it’s showing short-term variations, the monthly analysis (blue) gives smaller answers across the board. However, it is closer regarding the land trend, because the land changes temperature faster. The other two methods are long-term and are in reasonable agreement. I would say that the local analysis method is the more accurate of the two longer-term methods. It is location-specific as opposed to absorbed radiation-specific, and so it captures finer detail.
Steady-State
“Steady-state” describes a condition where variables don’t change much. For example, over the entire 20th century the globe warmed by something less than one kelvin. The average temperature of the planet is about 288 kelvin. So over the 20th century, the total change in temperature was about a third of one percent. This is steady-state, where on all levels energy absorbed is generally equal to energy out.
Suppose we took a cold world, dropped it into orbit around a nice warm sun, and watched what happened.
It would warm up … but it won’t warm up forever. The warmer it gets, the more loss from the surface occurs in the form of sensible, latent, and advected heat. Eventually, it will hit a balance point where the surface will neither heat nor cool appreciably.
For the earth, this occurs at the point where on average, for every watt per square meter absorbed by the earth’s surface, about 0.8 watts are emitted.
However, and this is the important point, for excursions around the steady-state, the surface emits much less radiation for every watt per square meter absorbed. After the effect of all short- and long-term losses and feedbacks, the surface only emits an additional ~ 0.4 watt/m2 for every additional watt/m2 absorbed.
Discussion
Why is all of this important? It’s the lowest-level, simplest, and most straightforward part of a larger question. That question relates to the central paradigm of mainstream climate science, which says that the change in temperature (∆T) is a linear function of the change in top-of-atmosphere (TOA) downwelling radiation (“radiative forcing”, ∆F). Mathematically, this is expressed as:
∆T (change in temperature) = lambda (“climate sensitivity” constant) times ∆Ftoa (change in downwelling radiation at top-of-atmosphere), or
∆T = λ ∆Ftoa
Me, I think this equation is fatally flawed, in part for the reason visible in the graphs above—even within just the surface itself, there is no constant lambda “λ” that relates radiation emitted (a measure of temperature) to radiation absorbed. Instead, it varies widely by location and surface type, in both the short- and long-term trends.
In fact, to the exact contrary of the idea of a linear relationship, in large parts of the tropical ocean when absorbed radiation goes up, emitted surface radiation (which is to say surface temperature) goes down … the climate, my friends, she is very complex, and not “simple physics” in the slightest.
More energy is absorbed by an object and in response, it cools down? Say what? “Complex physics” at its very finest.
My best to all,
w.
The “site is too dumb”? If you gave data, studies, and citations for your claim YOU would look a whole lot less dumb.
w.
Your climate balance is complex only because you have a big gob of hocus-pocus nonsense in the middle of it.
Attached is a graphic depicting how everyday HVAC and heat exchanger mech/chem engineers model energy leaving a heated surface.
Simple, straight forward, verified by millions of performance tests and no hocus-pocus.
The sun heats the surface, the surface heats the atmos – like this.
You accuse my work of containing a “big gob of hocus-pocus nonsense”.
What scientific units are used to measure “hocus-pocus nonsense”?
“Science”. Google it.
w.
PS—Nothing in your “simple, straight-forward” explanation explains the fact that in parts of the ocean, when absorbed radiation increases, the temperature goes down … nice try, though, it looks all so sciency and everything …
Willis, as usual, your presentation is clear, the facts and data fairly presented, and reproducible.
Always fascinating to follow you through the math and the logic.
A lot of scientists missed being the one to discover fission because they noticed that when they left film out while bombarding targets with x-rays, the film fogged, and their answer was eminently practical, they simply put the film inside metal boxes. They never asked WHY film that was behind the emitter was fogging. Only Ernst Rutherford was curious, and asked how it was that such a massive particle was reflected by such a small target… The equivalent for him of a cannonball being deflected by tissue paper.
Obvious in retrospect, perhaps, yet many brilliant scientists missed the implications.
Rutherford had an intense curiosity about everything, and it didn’t miss many details. He spun off experiments like a short order cook serves up fries, and handed them off to mentees left and right… Resulting in the unequalled achievement of mentoring 9 (if I recall correctly) Nobel Laureates in Physics (his own, to his lasting amusement, was in Chemistry).
I think, when it comes to that bump of curiosity, you and Ernst Rutherford are much alike.
Thanks again for a fantastic perspective of the subject of climate…
“PS—Nothing in your “simple, straight-forward” explanation explains the fact that in parts of the ocean, when absorbed radiation increases, the temperature goes down … nice try, though, it looks all so sciency and everything …”
If ocean is cold, it can absorb a lot energy and not emit much energy.
Or cold swimming pool can take a week to warm up and then heat up the the environment “more” than paving around the swimming which heats up quicker cools down a lot before the sun sets.
Pavement may get hot in day, but doesn’t cause global warming.
Global warming is caused by the ocean and the Atmosphere. Not concrete
or steel.
The greenhouse effect theory is pseudo for number of reasons, but major reason
is it’s just about atmosphere and not the Ocean.
Or huge chunk of reality is missing from it.
That there is no author of it, is minor part of why it’s pseudo science.
It’s got so many things dead wrong about it.
“The sun heats the surface, the surface heats the atmos”
Perfectly put, Nick. BS free.
leitmotif September 12, 2021 2:12 pm
And so profound … well, except for the part where some of the surface energy goes directly to space, and the part where the atmosphere directly absorbs ~ 70 W/m2 of sunlight, and the clouds play funny buggers all around, and the part where the atmosphere returns some of the energy back to the surface … and … and …
leit, you and Nick are free to believe that the climate is as bozo-simple as you are both claiming.
Sane folks, the ones not consumed with hating me or lost in green fantasies, think differently …
w.
Only up to a point.
Which is what Willis is explaining.
Right, but sun mostly heats the surface, the surface heats atmos.
Sunlight heats clouds and got the Ozone layer and whatever.
Sunlight is directly warming tropical waters creating water vapor, etc.
The statement “the sun mostly heats the surface” is not correct.
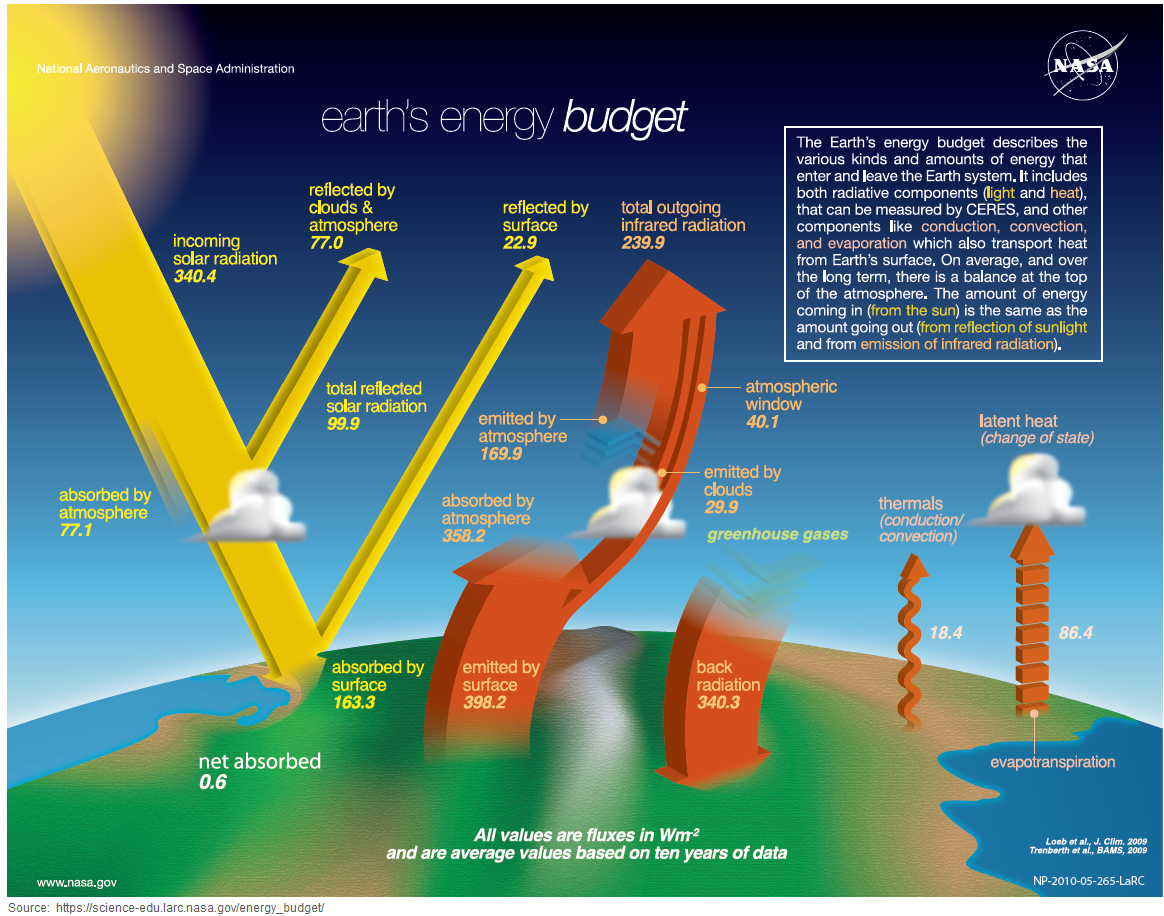
If one consults the K-T “balance” of averaged power fluxes, running from solar input all the way to Earth’s reflectance of solar plus direct radiation of LWIR, one finds the following values:
— continuous total incoming solar at TOA = 341 W/m^2
— continuously reflected by clouds and atmosphere = 79 W/m^2
— continuously reflected by (Earth’s) surface = 23 W/m^2
— temporarily absorbed by (Earth’s) atmosphere = 78 W/m^2
— temporarily absorbed by (Earth’s surface) = 161 W/m^2
— outgoing longwave radiation (from Earth’s surface and atmosphere) = 239 W/m^2 (which includes the temporarily absorbed
Note that 79 + 23 + 78 + 161 = 341 W/m^2, so net “outgoing” is equal to net “incoming” under (assumed) steady state conditions.
Also note that 78 +161 = 239 W/m^2 so the temporarily absorbed power in atmosphere and at Earth surface is really converted, over time, via redistribution of this power by surface-atmosphere interactions, ultimately to being the source of the noted 239 W/m^2 of outgoing LWIR.
From the above one can conclude that the Sun’s direct heating of Earth’s surface amounts to only 161/341 = 47% of its total incident radiation at TOA . . . that is less than half (50%) thus not qualifying for the adverb “mostly”.
“The statement “the sun mostly heats the surface” is not correct.”
Of course it’s correct. The statement was not the surface absorbs all the sunlight reaching it’s cross section.
Rather it’s of what the sun heats {in regard to Earth] it is mostly the earth’s surface.
Or saying the sun mostly heats directly the atmosphere is wrong.
In terms of what mostly the atmosphere, it’s mostly the ocean and Land surfaces which have been heated by the sunlight.
And ocean surface covers most of surface, the ocean absorbs more sunlight than the land {even if Earth was 50% land] but the ocean covers 80% of tropical zone and tropical zone has more sunlight reaching it than 60% of the rest of the surface of world.
So of the Earth surfaces, Ocean absorbs about 80% and land surface about 20%.
And because ocean absorbs the most, Earth emits a high amount 240 watt of the total which could be absorb of 340 watts – it would absorb if it was an ideal thermally conductive blackbody.
No other planet comes this close to the ideal thermally conductive blackbody model.
Because other planets lack an ocean. Put earth similar ocean on Mars, and Mars will absorb more sunlight.
So I could correct my statement, the sun mostly heats the Earth’s ocean surface.
Happy?
Oh, my bad,
the sun mostly heats below the Earth’s ocean skin surface.
Or if want to think the ocean is a black body, it’s blackbody below the
ocean skin surface- it’s more like blackbody cavity rather than surface.
But blackbodies are suppose to be vacuum, and we are in atmosphere,
and cavity full water not same as vacuum cavity.
Or bad idea to consider earth as black surface or cavity, but in comparison to something absorb all sunlight reaching it- Earth being planet rather than a model of the impossible, then earth absorbs a lot the sunlight- because it has an ocean.
You make me laugh.
In the basic sense of heating, the Sun “mostly heats” deep space, which has an average temperature of 3 K.
The solid angle subtended by the diameter of the Earth at its average distance from the Sun is 5.7E-9 steradians.
Thus, Earth intercepts only about 4.5E-8 percent of the energy emitted by the Sun, and even 30% of that is just reflected away.
And in thousand years and human population of 1 trillion, it’s very unlikely we would absorb as much as 1% of the sunlight
I was not aware that the human population was a significant absorber of sunlight.
That is something I’ll have to consider.
Ok, done.
Ocean is different than land.
If ask climate scientist [cargo cult scientist as that all which
available]
If Earth was made colder than it is now {or it was colder than it was “suppose to” be] Earth warm up until it reached equilibrium temperature. It would absorb more energy than it emits.
And cargo cult imagine they know what the equilibrium temperature is {and they don’t, apparently}.
I would say {and I am NOT climate scientist] that Earth equilibrium temperature is basically, the temperature of the entire ocean- or about 3.5 C. And there isn’t really equilibrium temperature, it’s just whatever the average ocean temperature is,
and Earth ocean’s have be 25 C and 2 C- which is not their idea of what an equilibrium temperature is.
So, I would say Earth’s equilibrium temperature by mere chance,
is close to what an ideal thermal conductive blackbody of 5 C would predict. Or there nothing wrong with ideal thermal conductive blackbody, model as a approximation of objects at around 1 AU from the Sun.
Anyways, with ocean it does not warm up by sunlight in a short period of time. Whereas a land surface may take a few days.
Land a few days, and with an ocean a few thousands years, isn’t
enough. Or an ocean is always absorbing more than it emits, at least it is during an Ice Age.
Or the ocean warms, and land cools.
So the explanation for why, near coastlines, there are typically off-ocean winds at daytime but off-shore winds at nighttime is all wrong? (ref: https://www.ndbc.noaa.gov/educate/seabreeze_ans.shtml )
You need to inform NOAA immediately of the needed correction.
warmest ocean surface is around 30 C and warmest land surface is about 70 C. As I was saying is land heats up quickly and Ocean does not.
If land surface is wet, it also takes longer to heat up, and highest temperature of a ground surface is dry ground surface. Do you imagine a wet ground is not absorbing as sunlight as dry ground surface?
And if morning is cooler, the surface does not get as warm in mid day or if have cool day in summer, it tends to take days to warm up to “normal” summer time highs. Or what control daylight high is how warm the atmosphere “starts with”. So ocean doesn’t get as cold as land does, therefore higher global temperature allows land to warm up, and land warms up quick and the ocean does not warm up quickly, but absorbs more heat and keeps that heat during the night.
Or tropics is warmest region on Earth, it’s warmest because it a high and uniform, day and night temperature. And tropics does not get the hottest day time temperatures.
And are you arguing tropical warmed waters is not warming Europe.
Global warming is all about region which season, summer, fall, winter, and spring and topic is the whole year’s average temperature and night and day temperature- that is the average global surface air temperature.
A hotter land will directly radiate more energy to space than a less hotter land- ocean warms, land cools.
its the center piece of the emergent phenomena.
It should be noted that the entity “T” (incl. T’hot/cold) in the radiation equations does not exist for the earth as such.
That makes these kinds of illustrations difficult (or useless) for energy balance calculations.
A little elaboration of my statement…
Radiative power from an object is dependent on “T” in fourth order. Which implies using average values of T for the earths surface, will be fundamentally wrong. Calculating radiative power from the earth would have to be done for extremely high numbers of surface areas.
This also implies that “a little” redistribution of temperature over the earths surface easily could balance increased heat input (from CO2 or whatever minor perturbation) by increased emissions, without increasing the earths average temperature (or the other way around, for that matter).
The common (by most people) understanding that increased heat input for the earth must result in increased average temperature, is not correct.
Global Average Temperature does *not* tell you what is going on with the Earth. It doesn’t allow you to differentiate between rising minimum temps, rising maximum temps, or a mixture of the two. Without knowing this there is no way to actually tell what is happening with climate.
As Freeman Dyson once noted, climate is a holistic measure, it is not just temperature. Climate scientists telling us they can tell us about climate based solely on some phantom “GAT” is like trying to sell us snake oil out of the back of a horse drawn wagon! Their models don’t do anything with plant growth, food growth, rain, the actual temperature profile at any measurable location, wind, hunidity, etc. All of these factors determine “climate”, not just temperature.
GAT is an excellent indicator of the heat energy changes in earths system When the GAT increases, it tells us that the energy in earths system has increased. and the reverse.
Really?
How much would GAT have to change for that statement to be true?
True for any change in GAT
Not at all, and the climate crisis hype is based on lots of such flawed perpections.
Tim Gorman has given you some key words when it comes to air enthalpy. And considering the “earth system” most of the energy is elsewhere.
So you suffer from the same misuse of the word ‘Enthalpy’ as he does.
H = u + pv. Delta h = delta u + delta (pv). Since delta pv ~ 0, delta H = delta u, and therefore changes in the earths heat content is indicated by changes in GAT.
“Indicated by”, is another story, but rather valueless for the required precision here.
For a constantly changing (time and space) mixture of air and water (vapor and liquid) enthalpy is much more complicated than temperature alone.
And GAT is not a sufficiently precise measure of space/time distribution of temperature.
And additionally, considering the “earth system” most of the energy is elsewhere.
“enthalpy is much more complicated than temperature alone.”
Correct.
For humid air enthalpy is:
H = Cp(T-T0) + wA where w is the absolute humidity. How many places on earth have zero absolute humidity? How does humidity vary among locations on earth? How can you legitimately use temperature alone when humidity is such an integral factor in enthalpy?
Nevertheless, GAT is the primary indicator of Earths energy, fo rate humidity angle you describe is interact only for regions, not the overall planet for which GAT and energy content trend together. EG:
I think you need to re-read about enthalpy.
dU = delta-Q – delta-W
delta-Q = T ds – p dV.
You cannot make the assumption that p dV is zero when you are speaking of a gas. And since volume is related to absolute humidity it is also an important factor.
Thus using temperature as a proxy for enthalpy gives a poor metric. it ignores the contribution from pressure and volume.
From an engineering standpoint
dH = (C_p)dT where C_p is the heat capacity which can be read from the steam tables.
If you will H = (C_p)(T-T0) + wA where
H = enthalpy
C_p is the specific heat of humid air
w is the absolute humidity
A is the vaporization enthalpy at T0
go look it up!
Your thinking of local regions. dpv for the entire earths system is ~ zero.
Heat content is measured by the metric known as enthalpy. Temperature is a poor proxy for enthalpy. Enthalpy depends on pressure and humidity as well as temperature. That’s why the enthalpy of a parcel of air in Miami is different than the enthalpy of a parcel of air in Kansas City even if the temperatures are the same.
GAT is a poor, poor indicator of heat content, i.e. heat energy, since it does not include the independent variables of pressure and humidity.
Enthalpy = internal energy + pv
Pv doesn’t change. So enthalpy change varies as U, which is a function of Temp. So any change in GAT indicates a change in Enthalpy
Nope. See my other message.
For humid air:
H = Cp(T-T0) + wA
where w is the absolute humidity of air and A is the vaporization enthalpy at T0.
If you leave out Cp, w, and A then T by itself is not a good proxy for the enthalpy of humid air unless w = 0.
Do *you* live where absolute humidity is zero?
Do you think overall humidity for the globe is in flux? Nonsense. The total amount of water vapor in the planets system is almost entirely a function of GAT, per Clausius Clapeyron. Varies mostly by region, not for the planet.
For the earth overall, GAT is one excellent indicator, because those factors you mention dont vary much for the planet’s bulk properties..
Willis,
Your segmented “movie” of the variation in cloud tops shows that, excluding the two months of February and March, cloud tops in the Earth’s northern hemisphere are higher than cloud tops in the southern hemisphere. The maximum altitude ratio noted is for September with average values of 4.8 km for NH versus 3.2 km for SH.
It is logical to assume cloud top altitude can be loosely-but-directly correlated to cloud areal extent, isn’t it?
These differences (with resulting differences in Earth’s integrated albedo over the course of full year) tells me that it is impossible—well, actually statistically nearly impossible—that the average total downwelling radiation power flux absorbed by Earth’s surface over two years would balance out to be exactly 508.7 w/m^2 in both NH and SH, as stated in the upper text block of the image you present as Figure 1.
While I readily accept the Earth can, and does, have thermoregulatory emergent phenomena that can stabilize Earth surface temperatures within a rather narrow band, there is no way that I believe such regulation achieves w/m^2 NH-versus-HS average radiation absorption to 1 part in 5,000 or better over a timespan of 2 years.
There is the smell of “data adjustment(s)” in the sources of data that you employed in your article . . . NOT due to anything you did, mind you.
The “adjustment(s)” might be a simple as the ceres.larc.nasa.gov data providers using the well-instrumented/monitored NH data to “fill in” corresponding lat/long grids sections in the SH that have little or no measurement data over specified time period.
No, the symmetry is not due to “data adjustments”. There are larger forces at work. See e.g. The albedo of Earth.
Best regards,
w.
Hi Willis,
Consulting the abstract of “The albedo of Earth” article that you linked to, I find the following exacts words (with my underlining emphasis added):
“Joint analyses of surface solar flux data that are a complicated mix of measurements and model calculations with top-of-atmosphere (TOA) flux measurements from current orbiting satellites yield a number of surprising results including (i) the Northern and Southern Hemispheres (NH, SH) reflect the same amount of sunlight within ~ 0.2 W m−2.”
Do you not find that including model calculations in the path to this stated conclusion admits the possibility of “data adjustments”?
Also, do you not find it strange, assuming an incoming TOA solar power flux of 341 w/m^2 (+/-), that Earth’s average albedo over two years would be balanced to the point of only ± 0.1/361 = ± 0.028% variation between NH and SH, especially when considering the NH/SH differences in the component of albedo arising from Earth’s surface due to land-vs-ocean areal percentages between these two hemispheres?
The K-T diagram “accounting” has about 23 w/m^2 (or about 7% of the incoming TOA solar power flux) being reflected off Earth’s averaged land & sea surface area. Just a 2% difference between NH and SH in this 23 w/m^2 reflectance (surface albedo) value would amount to 0.46 w/m^2, more than twice the value stated in the above-reference article’s conclusion.
Sorry, IMHO, this claim just does not pass the smell test for reasonableness, especially considering the inclusion of “model calculations”.
As gentlemen, we can agree to amicably disagree in this matter.
My best, sincere regards to you, and thank you for all of your just-excellent postings,
— Gordon
Solar SW 441 comes from the sun, the 527 longwave also comes from the sun. 32 comes from UV radiation. 90% of 527 w-m² absorbed by the surface. Stored in the oceans and lands in the tropics and transported northwards. Heating the air through convection, latent and sensible heat (84%), 16% radiation escape to space. Antarctic average isn’t 215 (summer) but 175 watts(equinox). And Arctic at around 263 watts. Earth at zenith is 500 watts and receives 1000 watts from the sun of which 750 escapes mostly in the hemisphere where 23° latitude has no sunlight. And 750 watts is absorbed in the hemisphere where sun is 23° more over land with dry air.
Now all you need to do is support that conjecture with some evidence.
As far as I can tell, “this site” is not sentient nor does it make observations.
but more sentient than some trolls!
Thank you for demonstrating once again the truth of that golden nugget of knowledge buried in the glossary of the IPCC AR5 report from 2013:
Predictability
Because knowledge of the climate system’s past and current states is generally imperfect, as are the models that utilize this knowledge to produce a climate prediction, and because the climate system is inherently nonlinear and chaotic, predictability of the climate system is inherently limited.
What can be stated with confidence is that the climate has been remarkably stable over Earth for billions of years. That is despite all the changes in orbital geometry, geothermal, surface and atmospheric transformation due to various life forms and direct physical impacts from foreign objects. Earth still exists in its.
Willis writes “ I get sidetractored “
There is no English word “sidetractored”
Try using “sidetracked.”
True indeed. I made the word up myself, because it describes my feeling of being pulled strongly in another direction.
I don’t work for the English language, I make it work for me. Or as Lewis Caroll wrote:
― Lewis Carroll, Through the Looking Glass
Humpty gets my vote …
w.
lame
Figures you’d vote for an imaginary character.
For an imaginary ambassador?
Thanks, Willis,
Your post gives me the best explanation yet for the meaning of the phrase “climate change”, with a tip of the hat to Lewis Carroll.
Apparently everyone except you understood that!
Clyde loves Humpty Dumpty
While he lacks any good points, he does have a rounded personality. Almost any joke will crack him up.
One can certainly see where the deserts are, like the Mojave and Sonoran deserts.
Terrific analysis and graphic images, Willis!
Willis, a few random comments:
Figure 1 and similar, when the sun is above the horizon, there are three sources that contribute to the total: 1) IR emitted toward the surface by the atmosphere (wavelengths > 4um), 2) direct solar radiation (wavelengths < 4um), and 3) sky radiation, scattered out of the direct radiation by Rayleigh and aerosol scattering. Obviously, over a year, there are lots of times when the sun is below the horizon so #2 and #3 go to zero.
The surface-absorbed radiation is by necessity quantified as being on a horizontal surface; as such, each ray of the total is reduced by the cosine of the angle of incidence. However, the incidence angle of source #1 is constant, while those of solar radiation are always changing. To a first approximation, the equator-to-pole variation in Fig. 1 is just latitude, i.e. the average solar position in the sky over the course of a year.
(Sky radiation, especially that of aerosol scattering, is too complex to say much about it here.)
Looking at N Amer. and Asia, it is evident there is an altitude effect that reduces the total, this is likely just a reflection of cooler air.
Figures 7-8-9: It might be interesting to see if there is a way to remove the strong latitude dependence from these; maybe a normalization of the Fig. 1 data of some kind? This might require separating sources #2 and #3 from #1, unfortunately.
The delta-T equation: the climatologists made a really bad choice of variables here, to anyone versed in solar radiation (and tons of other physics), lambda means wavelength, which is certainly not how they are using it here.
Direct solar radiation (visible) < 4um, 527 watts infrared radiation ( > 4um) of sunlight. 32 watts of UV. We feel the sun’s radiation when we are directly under the sun. Sun’s radiation in tropics can heat surface (desert) w/o convection up to 80°C. Convection reduces that by 20% through emitted infrared radiation. Compression of air increases temperature. This can be worked out as every 1591 newton force per degree Celsius. Global average insulation.
The linked paper will help you understand the process of convective instability that kicks in when atmospheric water reaches 45mm:
http://www.bomwatch.com.au/wp-content/uploads/2021/08/Bomwatch-Willoughby-Main-article-FINAL.pdf
As atmospheric water rises above 45mm, the cloud persistency increases; initially cumulus at the onset of instability but then cirrus as the convective potential recharges. That provides a sharp surface temperature cut-off at 32C with present day atmospheric pressure and an annual average maximum of 30C.
The Atmospheric Water Cooling Coefficient can be positive or negative over monthly intervals. Over an annual cycle, it is slightly positive, meaning that atmospheric water provides a net cooling.
Where climate models fail is not recognising that water exists in three phases and they cannot be treated independently as they are in the models. So parameterising clouds and precipitation as being unrelated to the surface temperature is a fatal flaw.
All the ocean regions on your plots marked in blue (-0.4W/sq.m) will have atmospheric water 45mm or higher. That is the TPW where cyclic convective instability kicks in.
The AWCC goes negative, meaning warming, for November, December and January. For all other months the AWCC is positive meaning the atmospheric water is cooling the ocean surface.
There is a 23 day lag between ocean surface temperature and the AWCC. But atmospheric water is a thermal regulator that works both ways. The warming or cooling mode pivots around 45mm TPW.
Sorry, Rick, but your claim about all the dark blue areas being over 45mm of total precipitable water (TPW) is simply not true. I suspected as much, because if you had actual evidence of your claim you’d have posted it up.


Note that the ITCZ just above the equator has MORE total precipitable water, and despite that has LESS negative correlation.
TPW from RSS.
Regards,
w.
Do that same analysis month by month rather than the annual combined.
This is all we need..
Quote:”Me, I think this equation is fatally flawed, in part for the reason visible in the graphs above—even within just the surface itself, there is no constant lambda “λ” that relates radiation emitted (a measure of temperature) to radiation absorbed. Instead, it varies widely by location and surface type, in both the short- and long-term trends”
Monkton might call it a ‘Reductio Absurdio”
IOW: radiation does not control climate.
Incoming solar kicks it all into gear, gives it some juice, but thereafter it’s out on its own
Random bits:
How does a Sputnik, whatever hundreds of miles up in the sky, measure the energy flow down onto the surface (without making some truly epic assumptions or sparsely recorded data)
Some sums:
Preamble: For folks messing with photovoltaic panels, it is generally taken that the very max incoming solar power they will ever see is 1,300 Watts. This being at solar noon on the equator under a clear sky.
Because Sol follows a sinusoidal path, the ‘average’ actual power (RMS power) will be the peak power divided by square-root of (2) = 919 Watts
But Sol is only up for half the time so we divide that by 2 to get 460 Watts daily average incoming solar energy under clear Equatorial skies.
But Ceres Sputnik tell us 670 Watts = an extra 210 Watts – coming from where exactly?
Assuming an ‘object’ in the sky with unity emissivity, that gives said object a temperature of minus 26 Celsius
What is this thing – is it an iceberg? (Could be, that’s what clouds are effectively)
Trouble is, anything radiated from something of that temp is not going to be absorbed by anything with a higher temperature.
This is the Carnot Heat Engine at work, which every matter/energy interaction is.
No work can come out of that engine if its exhaust (average Earth temp of 15°C) is warmer than its input temp, minus 26°C in this case.
It gets a bit tricky because the ‘work output’ is measured/observed as temperature but that’s what temperature is, the actual physical motion of the energised particles, atoms molecules.
Last bit: The energy absorbed/radiated conundrum = the ‘what’ moment
Fairly easy really when you’re dealing with water – and here is where some of the huge assumptions that the operators of the Sputnik are making.
(If you search for IR thermometer, they tell you what those assumptions are)
Assumption 1
Shiny things (metals classically) tend to have low emissivity. Thermometers *basically what Ceres is) assume emissivities of greater than 0.9. some have ‘adjustment’ dials.
Ain’t that just dandy?
But water can be very shiny or very black.
At very low angles of incidence, it becomes a perfect mirror = total internal reflection and is how rainbows work
(Wrecks the notion of Polar Amplification also)
At perfectly normal (90°) incidence, it is a near perfect black body
At angles less than 90 but greater than 20 (ish), the absorbance is determined by the polarisation of the light = hence why polarised sunglasses became popular for beach-goers – the glare coming off the water is horizontally polarised light while the water absorbs all the vertically polarised light
What happens when the water is not perfectly still?
Where/how does the polarised light go.
What amount is totally reflected?
How does Sputnik account for glare – does it wear polarised bins?
But then we meet the real killer, the horrible sweeping assumption that radiation controls temperature and climate
What happens with waves on the water?
because the Sputnik is assuming the water it totally flat, totally absorbing and ignores the polarisation when looking at the power and then assuming A Temperature. or vice versa.
But waves massively increase the surface area of the water and that correspondingly increases the convective heat loss from the water – while the Sputnik, viewing radiation from a Flat Land persepective, sees no change.
That is the Reductio Absurdio – thank you Willis for pointing it out – you have demonstrated/elucidated that convection controls the temperature, not radiation and is thus what knocks the legs right out from under the GHGE.
Not just clouds in the sky, waves on the water need to be accounted for.
They haven’t a hope in he11 have they?
It fits nicely with the thunderstorm emergence idea. The Sputnik could be looking at ocean water through a clear sky and assuming zero reflectance, an albedo of near zero and unity emissivity.
While a thunderstorm 10 miles away is kicking up big waves on that piece of water and for reasons I’ve just outlined, completely trashing all the/those assumptions that the Sputnik is operating under
You are making a fundamental error that the sunlight is sinusoidal about the zero value over a 24 hour period.
The peak daily solar insolation over a flat surface on Earth currently occurs at the South Pole during the day of the austral summer solstice. In fact the sun shines the whole of December at the pole. The average for that month for 2020 was 564W/sq.m. It will be a little higher on the day of the solstice.
As an aside, in 2020, the June average for the North Pole was 529W/sq.m.
In 10,000 years from now, the June average will be 533W/sq.m at the North Pole and down to 525W/sq.m at the South Pole in December.
There are two factors here. The sun’s incidence angle and the period of insolation. Both are cosine functions, one based on time and the other on latitude. This makes the whole equation rather complex and I sincerely doubt if the climate models accurately handle this situation.
Of course they don’t, all the modelers care about are averages.
It is not particularly complex and not difficult to model precisely. The input for the orbital mechanics and solar constant are agreed across modelling groups.
Models fail because they treat the phases of atmospheric water as being unlinked and disconnected from the surface temperature.
Water is actually a net cooling agent in the atmosphere. It can warm and cool in a way that regulates the ocean temperature to a very narrow range.
Atmospheric water currently acts as a warming agent during November, December and January but a cooling agent for all other months.
So is atmospheric water the most powerful “Greenhouse Gas” or “Bi-modal Liquid” or “Cooling Solid”?
Climate models do not even worry about mass balance of atmospheric water. If precipitation minus evaporation is integrated over a number of annual cycles it can result in negative atmospheric water. Sort of meaning the atmosphere is able to create vast quantities of water from the hydrogen and oxygen present and do it continually.
Willis, you said:
My first reaction is to question the veracity of the CERES data. Something like 96% of the southern hemisphere is dominated by specular reflection off the water and diffuse reflectance from clouds over the water. The northern hemisphere is dominated by diffuse reflectance from vegetation, soil, and clouds, with a minor amount of specular reflection from water. The two hemispheres are very different and the fact that the CERES data gives the same result strongly suggests to me that the absorbed radiation is calculated improperly.
I have previously questioned whether the numbers given for ‘albedo’ are a proper characterization for what happens with water. Once again, I think that the ‘albedo’ for water is a lower bound for the actual reflectivity, which is used to calculate the energy absorbed.
Willis performs a broad brush stroke analysis on broad brush stroke data. He is using Ceres data because that is the best available. He doesn’t go into the accuracy of it.
I agree with you about diffuse reflectance and specular reflection. Many people don’t get the idea of radiation hitting the surface and not reacting with it.
I understand that CERES is the best we have. I’m questioning whether, like so much of climatological data, it is really fit for purpose.
It may be fit for purpose. I just don’t know what that purpose is.
Dealing with averages without also dealing with the variances can be so misleading. At best it can lead one to ask why, but can’t deliver answers without more in depth research. Variances will add. When the variances also vary based upon some sine and/or cosine function there are simply too much variation to use averages.
As measurements go, isolating 1watt/m^2 out of 1350 is pretty precise measurement capability. That is about 0.074% accuracy. Ummmm?
Something else unique about the ocean is the presence of rapid biogeochemical cycling. Specifically, zones of nutrient rich upwelling oceanic waters and ‘radiatively relevant’ algal blooms which may (or may not) impact CERES emission and absorption estimates.
Emergent algal blooms tend to occur in warmer waters – most persistently in the tropics on an annual average basis. Conversely, algal blooms tend to be associated nutrient rich upwelling zones in open ocean and (relatively) cool water from depth. These areas may roughly correlate spatially with convective cloud locations.
MODIS products include chlorophyl-a estimates – a useful proxy https://modis.gsfc.nasa.gov/data/dataprod/chlor_a.php
If nothing else these factors are worth eliminating if the intent is to demonstrate a forcing from cloud effects. Do photosynthetic and surface-shading-VIS-IR-reflective effects of algae impact emission and absorption estimated from CERES?; and, how might tropical oceanic divergence-upwelling zones correlate spatially with CERES estimates?
Here we see the mechanistic modelling of such matters is, indeed, infinitely (perhaps needlessly) complicated.. It’s worth considering that all the apparent complexity of covariables here may not be relevant other than for, say, academic inquiry – such that this may be a condition of not seeing the forest for the trees & getting caught up in the noise.
Are these details of absorption and emission at all relevant; do they force the climate system? Or, conversely, are these details of absorption and emission a product of the climate system itself? A matter of perspective I suppose – a limitless collection of non-linear covariable phenomena miraculously arriving at an observable energy balance, or, some-thing more fundamental to the system as yet unacknowledged?
It is in simplicity that the people will be convinced.
Willis Compliments on furthering the evidence for your thermostat model. You state: “The average temperature of the planet is about 288 kelvin.” Since your title is “Surface radiation balance” and you said “I got to thinking about the surface radiation balance” I infer you refer to the Earth’s surface temperature. Please confirm. PS (You had noted an “effective radiation level (ERL) blackbody temperature of -18.7°C” in your post Effective Radiation Level (ERL) Temperature – Watts Up With That?) NASA posted “Earth’s effective temperature—the temperature it appears when viewed from space—is -20° C” Climate and Earth’s Energy Budget (nasa.gov)
Willis,
Given some 21 years of data, is there any discernible trend in the proportion of emitted radiation to absorbed radiation over time as CO2 levels have increased some 10%?
Paul, with heat engines, we have what’s called “parasitic loss”. This is all the input energy which doesn’t go into increasing the temperature. Regarding the surface, some incoming energy heats the surface, and there is also parasitic loss in the form of sensible and latent heat loss.
Here’s the record of the surface parasitic loss.

“Discernible trend”? Nature is never that simple …
w.
Willis,
There’s a lot more to this then you think and I’ve solved the why. You just need to connect the dots.
More remarkable is that the ratio between surface emissions and the planets emissions is also the same between hemispheres, as you noticed in the past in response to a comment of mine, However, you failed to understand the importance of what you noticed relative to my hypothesis that this ratio is quantifiable mathematically as the consequence of the chaotic self organization of the atmosphere by clouds such that changes in entropy are minimized as the system changes state (i.e. its temperature). In other words, the goal is to maximize the efficiency of solar energy relative to heating the surface where I’ve been able to derive the strange attractor as the golden ratio. You’re just noticing other consequences of my hypothesis that I’ve also noticed in the past.
You’re repeating much of what I did that led me to arrive at my hypothesis and the math that supports it, albeit with a different data set, which to me is independent confirmation of my hypothesis.
You might also want to look at the relationship between average cloud coverage and the local temperature averages. This was the clincher for me as it became unambiguously clear that average cloud coverage adapts the system towards its goal by compensating for the albedo effect from surface ice and snow.
The math almost always precedes the physics and I’ve shown you the math, Here is yet another way to derive the strange attractor in the context of replacing fatally broken feedback math with math that actually works and gets the right answer.
http://www.palisad.com/co2/docs/newfb.pdf
I do not find this fact especially surprising:
tl;dr:
1. I think we can assume that there’s little net heat transport between the two hemispheres.
2. They get exactly the same amount of sunlight, and
3. In the wall murals the two hemispheres appear to have similar overall average albedo.

So they should have about the same total radiant energy absorbed at their respective surfaces.
Quantifying details:
The biggest difference between the two hemispheres is that the NH is only about 60% water, and the SH is about 80% water. That 80% – 60% = 20% difference seems like the most likely source for a possible difference in average albedo, since albedo of water is basically the same everywhere, except when it’s frozen.
Land has higher average albedo than water, but really not all that much. Land albedo averages about 15% (meaning it absorbs 85% of incoming sunlight), and ocean albedo only about 7% (meaning it absorbs 93% of incoming sunlight, except when ice-covered), so that would seem to give the SH a slightly lower average albedo then the NH. An 8% difference in amount of sunlight absorbed, for 20% of their surfaces (the difference in land coverage) would suggest a 1.6% difference in amount of absorbed sunlight.
So maybe, very roughly, there could be a 1½% difference in average absorbed sunlight, between the two hemispheres, due to differing amounts of land area, with the SH absorbing slightly more than the NH.
Additionally, the Arctic sometimes has a lot of open water, and Antarctica is always just ice. The SH also gets a bit more sea-ice than the NH does, and at less extreme latitudes. Those factors slightly lower NH albedo compared to SH albedo, and thus slightly reduce the difference between amounts of sunlight absorbed in the two hemispheres.
Also, on average, the ocean is cloudier than the land, but cloudiness varies with latitude, too, so I don’t know how that affects the two hemispheres’ average albedos.
The biggest factor affecting albedo is cloud cover, but I could not guess which hemisphere has more cloud cover; they look similar in the murals. But if they’re not the same, it seems like that could easily exceed a 1½% or less albedo difference due to differing percentages of land vs. ocean.
What’s more, “albedo” quantifies the average reflectance of visible light, and most of the radiation absorbed at the surface of the Earth is not visible light. About 2/3 of the radiation reaching the surface is said to be downwelling LW IR from radiatively active gasses in the atmosphere, not sunlight.
So divide that “1½%” difference which we estimated, due to albedo, by three.
If the two hemispheres have similar average air temperatures, then their average downwelling LW IR should be similar, too. However, the Earth is not uniform “color” or absorptivity, neither at visible wavelengths nor invisible wavelengths, such as LW IR. At some wavelengths the differences between land and water (or between clouds and cloudless, or between ice-covered and ice-free surfaces) are more pronounced than at others. So it would be a mistake to assume that the albedo difference between land and water also applies to the reflection vs. absorption of LW IR. Unfortunately, I don’t know how they differ.
My simple solution for the ‘equal albedo’ for both hemispheres is the following. Temperature regulates albedo in the following way:
· When the hemisphere is warmer (NH) more tropical clouds (white) will develop, diminishing insolation and keeping the hemisphere closer to ‘the average temperature’. A warmer hemisphere has less albedo from ice, snow and sea-ice.
· When the hemisphere is colder (SH), more surface area will be covered by ice shelves, snow, and sea-ice (all white), enhancing the albedo while compensating for less tropical clouds. Covering sea ice will diminish ocean cooling, keeping the oceans of the hemisphere closer to ‘the average temperature’.
A warmer hemisphere will show a shift in albedo from sea ice to more tropical clouds. A colder hemisphere will show a shift in albedo from tropical clouds to more sea ice. Both changes result in keeping the hemisphere closer to ‘the average’ while not changing the hemispheric albedo. A wonderful and well-balanced system with (again) the H2O molecule at the center of the thermo-regulating system. The whole system is programmed to remain near ‘the average for a specific geologic and orbital setting’.
Albedo controls temperature. And temperature determines the kind of extra or less albedo: more tropical clouds (when warmer than ‘average’) and less sea ice or the reverse: more sea ice (when colder than ‘average’) and less tropical clouds. The system is stabilizing temperatures of both hemispheres and also of the Earth as a whole, each near ‘their own average’.
I’ve often wondered if the 3 million of so miles between the perihelion and the aphelion made much difference in the sunlight reaching the Earth during the summers in the different hemispheres.
Yes it does; it modulates the solar radiation by 2-3% during the course of a year.
Actually about 1/2 of the sun’s radiation is near infrared, not visible light. H2O absorbs a substantial amount of this radiation. And, remember it is higher energy radiation than far infrared.
Dave,
“I don’t know how they differ.”
Given the 80 W/ m^2 difference in solar energy between perihelion and aphelion and the rough correspondence of the peak during the N hemi winter solstice. the profile of the solar energy, relative to seasons, is quite different, especially in the N, where peak solar also corresponds with peak surface reflectivity from ice and snow.
Given this variability, we should expect the S hemi summer to be much warmer than the N hemi given the claim of 3-4C of warming per W/m^2 where in peak summer, the S receives an average of 20 W/m^2 more solar input and over 10 W/m^2 more averaged across the whole summer.
BTW, a significant error found in a lot of analysis is using AU normalized solar data, rather than the solar variability dictated by Earth’s orbit. This is usually to avoid having to explain why there are no differences given our significant orbital variability.
In addition, non radiant energy needs to be removed from the radiant balance, as only radiant energy can leave the planet and to the extent that a Joule leaving the planet can trace its origin to latent heat, a Joule of radiant energy originating from the surface that would have been emitted into space must be returned to the surface to offset the lost latent heat. In other words, whatever effect non radiant energy plus its offset to the surface has on the system is already completely accounted for by the surface temperature (the state) and its corresponding SB emissions.
Sorry, I meant 3-4 C per 4.7 W/m^2 (the presumed equivalent of doubling CO2).
co2isnotevil September 14, 2021 8:34 am
It is not widely appreciated that the northern hemisphere receives exactly the same amount of TOA incoming solar radiation as does the southern hemisphere.
Yes, it is true that the instantaneous intensity of the incoming solar varies significantly over the course of the year, due to the earth moving nearer and then further from the sun.
But what else changes is the speed at which the earth is traveling—faster when it is in close to the sun (and receiving more energy), and slower when it is further away (and receiving less energy).
This means that the earth spends less time where the sun is hotter and more time where the sun is cooler.
And because both light and gravity fall off as the square of the distance, these two effects cancel each other out completely … and both hemispheres receive the same amount of total solar energy.
w.
Willis,
Yes, they receive the same amount of Joules across a year, but it’s the distribution across seasons that’s neglected when using AU normalized solar data. For the S to get the same solar as the N, not only do it’s summers get more during the faster portion of the orbit, the winters get less during the slower part. The reverse is true for the N for a total of at least 8-10 W/m^2 average solar input difference between their respective summers and winters after accounting for albedo.
The S hemi summers should then be about 5-7C warmer than N hemi summers and winters should be about 5-7C degrees cooler according to the IPCC’s ECS. This is not evident and in fact, the temperatures are roughly the same despite little, if any, net transfer of energy between hemispheres, and a whole lot would be required. The difference in distribution between land and ocean makes some difference, but not that much.
The surface adjusts rapidly to changes in solar energy, otherwise we would not see seasonal variability, much less diurnal variability. The extra long time constants claimed by the IPCC are complete BS, even for the oceans.
Given the effects of the assymetries that are expected, but not evident, it raises the qustion, is this just a coincidence or is there an underlying physical reason that normalizes the response? When it comes to physics, I don’t accept that any unexpected behavior is just a coincidence and ultimately, it must be explained.
As I suggested earlier, look to see how cloud behavior counteracts the asymmetries.
co2isnotevil September 15, 2021 8:31 am
Sorry, but none of that is true. The SH is overall cooler than the NH. In addition, there is far less summer/winter swing in the SH, because there is far more ocean in the SH than the NH (NH is ~ 1.5:1 ocean to land vs. SH, ~ 4:1 ocean to land), and the ocean warms and cools much more slowly than the land.

As I said … the climate, she is complex …
Regards,
w.
Nice graphic.
To add: there is more swing over the NH because of the relative lack of water vapor over Land. Lower water vapor over Land enables a stronger cooling of ‘Land’ during nights, during winter and during a glacial, but lack of water vapor also enables a stronger warming of Land during moments of insolation. The relative lack of water vapor diminishes absorption of Sun energy by the atmosphere over Land (less absorption of near infrared by less water vapor) and in this way enables more Sun energy to reach the surface of Land to be absorbed. This lack of atmospheric water vapor enables a higher rise of surface temperatures over Land.
Over oceans the abundance of water vapor prevents a higher uptake of energy by oceans because the atmosphere already absorbed that energy. As the uptake of solar energy by the atmosphere is about the same as the reflectance of solar energy by clouds, atmospheric absorption is a huge (and dynamic) factor in regulating surface absorbed energy. Not getting the attention needed.
Request: Willis, could you produce a graphic like the one above but not with temperatures, but with the monthly content of water vapor over both hemispheres?
Also very interesting would be to know the estimated monthly quantity of water vapor for the Earth as a whole, in Gt of water vapor. It will be interesting to see the large yearly fluctuation in the quantity of main greenhouse gas water vapor which is not really disturbing the general stability of climate, while a little change in the quantity of Gts of CO2 between years is supposed to cause ‘disasters’.
Monthly temperatures for the Earth as a whole are quite different for January and July – and so the quantity of atmospheric water vapor. Nearly nobody realizes.
Willis,
“Sorry, but none of that is true. The SH is overall cooler than the NH. I”
Apparently, you failed to get my point. According the IPCC ECS summers should be much warmer and winters should be much cooler then the N and they’re not. More specifically, land temperature.
The amount of ocean doesn’t really affect the average temperature, but just affects the p-p temperature swing over the oceans. The fact that the S average is cooler, is not explained by the amount of ocean in the way most people think.
What causes the lower average is that the lesser amount of solar in the winter has a larger effect on the average than the greater amount of solar in the summer for 2 reasons. First, is that ocean summer tempertures are clamped at about 300K when evaporative cooling is sufficient to offset additional solar energy. Second is the T^4 relationship between W/m^2 and T.
Yes, I agree the low level mechanics of how the climate achieves it’s steady state is a complex, chaotically driven process, but this complexity doesn’t affect the final averages which are more easily determined from first principles thermodynamics applied to the bulk system.
the location and extent of the convergent zone define the WE emergent phenomena and although unable to work it out that looks to be the balancing force for both temperature maximums and hemispherical temperature equality.
The reflectivity of water varies with the angle of incidence for sunlight, reaching 100% at the limbs. With 20% more water in the SH, there is more of the high reflectance water, so the SH should be reflecting more sunlight than the NH. However, I don’t think that CERES is capturing it.
Actually, as with many things natural, it’s more complex than that. First, overall the sea surface albedo is quite small, with a global average of about 7%.
Second, in addition to solar angle, the albedo depends on the roughness …

SOURCE: The Climate Near The Ground, Geiger, 6th Edition, p. 15
My best to you,
w.
Figure 9: Scatterplot Ocean temperatures, Radiation emitted and Radiation absorbed
WR: Oceans have an average temperature of about 18 degrees. This corresponds with 532.9 W/m2 absorbed (fig. 1). The figure shows a strong correlation between ocean temperatures and surface absorbed energy.
To raise ocean temperatures by several degrees, tenths of W/m2 of extra absorbed energy are needed.
Just 3.7 W/m2 extra by double CO2 ‘cannot do the work’. Only extra H2O over the poles could create a big change in downwelling radiation. But for that, the oceanic circulation should be drastically changed or even reversed as proposed for the Hothouse situation: https://wattsupwiththat.com/2018/06/15/how-the-earth-became-a-hothouse-by-h2o/
Wim Röst September 13, 2021 7:39 am
Wim, good to hear from you, but I don’t understand your point.
• Over parts of the ocean, as you say, there indeed is a “strong [positive] correlation between ocean temperatures and surface absorbed energy”. When one goes up the other goes up, and vice versa.
• Over other parts of the ocean, there is very little correlation between ocean temperatures and surface absorbed energy.
• And over yet other parts of the ocean. there is a negative correlation between ocean temperatures and surface absorbed energy.
That’s the curiosity. There are parts of the ocean where when the absorbed radiation is going up, the temperature is going down.
Go figure …
w.
Hi Willis,
My remarks were inspired by your figure 9. I know about the regional and local differences and about the many different processes involved, you showed many of them. But if ‘just radiation’ warms the oceans and also would be able to warm the Earth by many degrees (as is said by mainstream) then you need a lot of W/m2 for even one degree rise in ocean temperatures. From 0 degrees Celsius Ocean temperature to 20 degrees some 10 W/m2 of absorbed energy extra or so would be needed – if there would be such a straight relationship.
But like you, I don’t think such a straight relationship exists. To understand the thermoregulatory system of the Earth we should know and understand everything of the H2O molecule and its role in the climate system of the Earth. And we are not that far. Perhaps some smart guys behind the IPCC understand its role: that is why they don’t talk about H2O, about its regulating mechanisms and don’t talk about the H2O cooling system as it functions for the surface of the Earth. H2O is keeping ocean temperatures between around zero and thirty degrees Celsius, whatever the radiative input.
As usual your post was very interesting and informative. Thanks!
“The amount of radiation that is emitted is almost always smaller than the amount absorbed”
A tiny bit smaller in the polar and sub polar regions, and a lot smaller in the tropics.
Why is the average total absorbed downwelling in the horse latitudes in Fig 1, greater over the oceans than over land? and coupled with greater upwelling in those land regions, e.g. in Australia and in the Sahara.
Sam Best September 13, 2021 4:13 am
“Specialty”? I have no “specialty”, I leave that to folks like you. I am a generalist. See here for details.
I’ve worked at more different jobs than anyone I know. My last job was the Chief Financial Officer for a company with $40 million in annual sales … and the job before that, I was the Construction Manager on a $7 million tropical resort buildout.
On your planet, do those disqualify my scientific views as well?
The truth is, Sam, my qualifications and certificates and employment record and the like are MEANINGLESS in the world of science—either my claims are true or they are not. Period.
And you whining about my having worked as a massage therapist doesn’t falsify a single one of my claims.
Best regards,
w.
When you’ve published any of your ‘research’ in a peer reviewed scientific journal Eschenbach, you’ll enjoy some credibility. Until then, your pointless, circular, and undisciplined musings are a waste of time for anyone who wants to know reliable science about the climate.
“Published any”? I’ve published six articles in journals, which have garnered over 150 citations … and once again, you’re unable to falsify a single one of my claims, so you are resorting to personal attacks.
Pathetic.
w.
Not one in a peer reviewed scientific journal, Willis. Thats a lie. You cant produce even one.
I’d say thunder storms are a consequence of hotspots rather than they chase them.
Willis:
“…the central paradigm of mainstream climate science, which says that the change in temperature (∆T) is a linear function of the change in top-of-atmosphere (TOA) downwelling radiation (“radiative forcing”, ∆F). … Me, I think this equation is fatally flawed”
I agree. I got a contrarian paper on global warming published recently that discussed this issue. I found that for a linear model, solar forcing does not explain all of the observed global warming. However, for a nonlinear model, it does.
Here is the abstract of my paper:
ABSTRACT
Previous studies have reported that human influences are required to explain the observed global warming using a linear model that relates change in solar forcing DF to change in global mean temperature (GMT) DT given by DT = lDF. This model has the shortcoming of assuming a given DF causes the same DT irrespective of the value of the initial global warming rate (dT/dy)i. Analysis of the GMT data showed that this warming rate has been increasing linearly since steady state ((dT/dy)o = 0 for year yo = 1864.5) as given by dT/dy = (dT/dy)i + aT(y-yi)$, where $aT = 7.1954´10-5 oC/year2 is the secular GMT acceleration and y-yi is the number of years of the change. The secular solar forcing due to 18% of the 11-year solar cycle forcing of 0.19 W/m2 (0.08% of Total Solar Irradiance) was expressed as DF = 0.18´0.19(y-yi)/11. Defining the climate sensitivity as l= D(dT/dy)/DF = aT/(0.18´0.19/11) = 0.023143 oC/year per W/m2 removed the shortcoming of the linear model and integration of the model for dT/dy above and then simplifying gave a secular GMT-solar forcing model given by DT = (dT/dy)i(y-yi)+( l2/(2aT))(DF)2 that explained all of the observed global warming and increase in atmospheric CO2, sea level and ocean heat content. Therefore, for this nonlinear empirical model, invoking human influences to explain climate change was not required. The annual GMT model predicts a pause in global warming until 2040.
http://dx.doi.org/10.1029/2019EA001015
Willis:
“…the central paradigm of mainstream climate science, which says that the change in temperature (∆T) is a linear function of the change in top-of-atmosphere (TOA) downwelling radiation (“radiative forcing”, ∆F). … Me, I think this equation is fatally flawed”
I agree. I got a contrarian paper on global warming published recently. I found that for a linear model, solar forcing does not explain all of the observed global warming. However, for a nonlinear model, it does.
Here is my paper:
http://dx.doi.org/10.1029/2019EA001015
And here is the Mathematica code I used to analyse the climate datasets:
https://bit.ly/3EdEBf3
<img src=”https://agupubs.onlinelibrary.wiley.com/cms/asset/95bf2ce2-ad45-4b56-b709-9a6b5aa21973/ess2907-fig-0010-m.jpg” alt=”30-Year GMT trend”>
Good Evening Willis:
Re your statement: In fact, to the exact contrary of the idea of a linear relationship, in large parts of the tropical ocean when absorbed radiation goes up, emitted surface radiation (which is to say surface temperature) goes down … the climate, my friends, she is very complex, and not “simple physics” in the slightest.
I am very pleased to see you remark upon this phenomenon.
There is a simple explanation.
Ocean surface temperature is a function of the downwelling/upwelling process that varies with wind strength. Best example is the instance of the waters south of the Galapagos Islands in the region known as ENSO 1+2, where sea surface temperature is a function of the difference in surface pressure between the region of high atmospheric pressure in the Eastern Pacific adjacent to Chile and surface pressure in the area north of Australia and Indonesia. As the difference in surface pressure between these locations increases, enhanced upwelling brings cooler water to the surface in the east of the Pacific. And the Chilean fish canneries start working overtime.
Upwelling /downwelling occurs everywhere in the ocean. As a result the variation in global temperature is closely related to the temperature of the waters south of the Galapagos. This relationship between local temperature and that in the Galapagos is not confined to the tropics or just the Pacific Ocean. It’s everywhere.
The increase in the pressure differential across the Pacific is produced by a shift in atmospheric mass from the Antarctic Trough, the Aleutian Low or the Icelandic low. The most variable of these three is the Aleutian Low that is energized by latent heat of precipitation more than the others. The lowest surface pressure by far is produced in the Antarctic Trough. The season of most intense activity is winter.
The cyclones that generate the shift in atmospheric mass are energized at Jet stream level and propagate to the surface. These cyclones aggregate ozone rich air and lift it to the top of the atmosphere. The Antarctic trough has a cold point in the upper stratosphere at about 30hPa in middle and late winter, supporting convection that overshoots to the 1hPa level. What goes up must come down. The descending circulation is in the mid latitudes. Ozone descends into the upper troposphere warms the air and eats the ice cloud away. The jet stream brings ozone rich air directly to the mid latitudes. The warming due to ozone affects the air to an increasing extent above 500 hPa. The secret to the potency of ozone is its uneven distribution, the low partial pressure (unlike CO2) and therefore the work it does increases with atmospheric density. It downloads energy instantly to anything at hand.
A climactic warming of the stratosphere occurred between 1976-78. The gradual cooling of the stratosphere that occurs as surface pressure over the Antarctic continent gradually recovers bringing in air from the mesosphere containing oxides of nitrogen that chemically attack ozone was interrupted in the latter half of the last solar cycle.
The point is this. The loss of ice cloud is conjunctional with the increase in the pressure differential across the Pacific, and the simultaneous increase in the pressure differential between Highs and Lows everywhere. This delivers more solar radiation to the ocean that absorbs it to depth at precisely the time when the upwelling of cold waters is most energetic.
The time when the globe is most susceptible to an addition to its energy budget occurs when the sun is vertically overhead the tropic of Capricorn, its radiation is 6.4% more intense due to proximity, the orbit of the Earth around the sun being elliptical, and more than 90% of the surface that is illuminated is ocean. Add to this unique set of circumstances the fact that global cloud cover peaks in December when the continents of the northern hemisphere radiate the least amount of energy into the atmosphere and you have a recipe for invisible global warming that will reveal itself as the pressure differential falls away and La NIna upwelling becomes less vigorous.
The ocean gives no evidence of what is happening as it absorbs the energy to depth. The evidence lies in the manner in which the temperature of the air above 500 hPa moves independently of that at the surface and in concert with the temperature of the air above Antarctica with elaborations on the Antarctic pattern, by the Aleutian Low creating the surface chop that delivers high variability in upper troposphere air temperature across the globe in January.
The corollary, is that sea surface temperature data is not a reliable guide to what is happening to the Earths energy budget.
Another observation: If we think that weather is something that happens in the thing we call the troposphere, if we don’t understand the role of the stratosphere we will never understand the processes that determine surface temperature and the Earth’s energy budget.
The pressure differential across the Pacific has been increasing for seventy years, enhancing upwelling sufficient to nicely balance the increase in ocean heat content in January so that, for the southern hemisphere as a whole, surface temperature is no different today, in the month of January, than it was back in the decade after 1978. And that suggests to me that the mooted ‘greenhouse effect’ is insubstantial, if it exists at all.
And the physics is not that really that complex. It has nothing to do with back radiation.
The mystery to be solved is why surface pressure has been falling in the Antarctic trough for seventy years. A pattern of increasing velocity in the westerly winds in the southern hemisphere is discernable in the sorts of sediments deposited in lakes over one thousand years or more. Enhanced westerly winds corelate with warmer temperatures globally. See a recent article here: https://www.nature.com/articles/s43247-020-00059-6