Guest Post by Wim Röst
ABSTRACT
Water, H2O, determines the ‘General Background Temperature’ for the Earth, resulting in Hothouse and Ice House Climate States. During geological periods the movement of continents changes the position of
continents, oceans and seas. Because of the different configurations, a dominant warm or a dominant cold deep-water production configuration ‘sets’ average temperatures for the deep oceans. Changing vertical oceanic circulation changes surface temperatures, especially in the higher latitudes. During a Hot House State, higher temperatures in the high latitudes result in a high water-vapor concentration that prevents a rapid loss of thermal energy by the Earth.
These three processes, plate tectonics (continental drift), vertical oceanic circulation variability and variations in atmospheric water vapor concentration and distribution, caused previous Hot House and Warm House Climate States. A change in the working of those mechanisms resulted in a transition from the previous Hot House Climate State to the very cold ‘Ice House State’ that we live in now. That change was set in motion by the changing configuration of continents, oceans and seas.
Introduction
The Earth has known Hothouse periods because of two things. The Earth warmed because of storage of thermal energy in the oceans (H2O) and because a higher quantity of water vapor (H2O) in the air (especially at the poles) prevented the Earth from cooling.
The Earth has known Ice House periods because of a lack of storage of thermal energy in the oceans and because the resulting loss of atmospheric water vapor (especially at the poles) accelerated the cooling until the Earth reached an Ice House State. That is, more thermal energy can be radiated to outer space from the polar regions if they have a lower concentration of water vapor.
In three ways the changing Earth created Hot House Climate States. The first and the most important was the creation of [relatively] warm deep oceans. The second important mechanism was a reversal of the vertical water circulation that resulted in a far more effective distribution of absorbed sun-energy over all latitudes. The third mechanism was the rise in the quantity of water vapor, the main infrared radiation absorbing gas of the lower atmosphere, a rise that prevented strong night and winter cooling especially at the high latitudes. All together the three mechanisms resulted in much warmer average global temperatures during Hot House climate states with far more evenly distributed temperatures over all latitudes. During Hot House (and Warm House) climate states, the whole Earth became lush and green, from the tropics to the poles.
All changes were due to water, H2O. Physics did do the work, no humans involved.
Timescale
On a geological timescale, the configuration of ‘continents’ and ‘oceans’ determines the general climate state: warm or cold. Continents gave shape to different combinations of oceans and seas. Different configurations of oceans, seas and continents caused the production of warm or cold deep-ocean water.
The temperatures of the deep-ocean set the ‘general background temperature’ for the Earth during different geological periods. Creating warm and cold climate states. Now we are living in an era of long glacials and short interglacials, our present era is an era within an Ice House Climate State.
The temperature of the deep ocean is the main factor. Deep-ocean temperatures from -1 to +3 degrees Celsius, as we have now, keep the Earth in an Ice House State. Slightly warmer deep-oceans with temperatures from 6 to 10 degrees Celsius* bring the Earth to a Warm House or a Hot House Climate State. The underlying system for this switch is characterized by three mechanisms, as discussed below.
1. Warm deep oceans
Warm House and Hot House Climate States were characterized by ‘warm’ deep oceans. ‘Warm’ has been warm in a relative way: as compared to our present ice-cold deep oceans of -1 to +3 degrees Celsius, the ‘warm’ deep oceans of the past probably had average temperatures of 6 to 10 degrees Celsius. As we shall see, this relatively small temperature difference had huge consequences for the global average surface temperature of the Earth and for the Earth’s climate state.
In oceans and seas certain water goes down and other water wells up from the deep oceans, both in huge quantities. Think in terms of a million or more cubic kilometers a year. For the final temperature of the
deep-ocean it is important which water wells down: relatively cold or relatively warm water. Present seas like the Mediterranean, the Red Sea and the Arabian Gulf demonstrate that it is possible to produce warm deep water: in arid regions the local evaporation produces high salinity surface water that is that dense that it goes down (‘sinks’) as warm salty water. After welling down, the warm and now ‘deep’ water is covered by less dense ocean water.
In this way, even in our present Ice House State, the above-mentioned seas produce warm deep water of
around 12 degrees Celsius and more. When the warm deep-water flows back into the oceans, it sinks to depths of 1000 to 4000 meters, depending on the salinity and the density of the local deep ocean. The deep warm and saline water is produced at latitudes where evaporation is higher than rainfall, often around 30 degrees North. Sea surfaces at 30 degrees contain very saline warm water that is still able to ‘float’ because of high water temperatures. But during wintertime this saline surface water cools and sinks.
Shallow, enclosed seas like the Mediterranean still produce warm, deep water, but only have a small surface area. Too small, to get the Earth out of her present Ice House State.
But in the geologic past, fifty- to one-hundred million years ago, those shallow and nearly enclosed seas were very extended at latitudes where they could produce warm deep-water: around 30°N, See Figure 1.
Figure 1: The position of continents, oceans and shallow seas 100 million years ago, according to Christopher Scotese, as shown in this animation.

Because of their large total surface area, these shallow and nearly enclosed seas produced huge quantities of deep warm water. That warm deep-water production warmed the deep oceans that characterized Warm House and Hot House periods, like the Cretaceous.
During those Warm House and Hot House periods there was no dominating cold deep-water production. The poles were cooler than the tropics, but not frozen, because of upwelling warm deep-water. Because of the still relatively low temperatures at the poles, evaporation was low and was exceeded by rainfall, which resulted in relatively fresh surface waters in the polar seas, a freshness that became further enhanced by (fresh) poleward river runoff. Because of the freshness of the surface waters, their density was low. Low density waters don’t sink. Because of that, there was no massive cold deep-water production at the high latitudes during Warm House and Hot House states. This was the second reason why warm, deep water production dominated. Warm, deep oceans were the result, see Figure 2.
Figure 2: Warm and cold deep-water production 100 million years ago, same figure as figure 1, red and blue squares added. In red: the areas around 30 degrees with a supposed massive warm deep-water production. In blue: present cold deep-water production areas, not functioning 100 million years ago: surface waters were too fresh.

2. A reversed vertical water circulation
In our present Ice House State, we find a massive sink of cold water at the higher latitudes. This sinking water is replenished by warm and saline surface water, transported over the surface. Currents like the warm Gulf Stream do the work. However, the present poleward transport consists of a current over only part of the total width of the ocean and using only a minor layer at the surface. Currently, the quantity of warm water transported to the poles is far less than the warm, deep water transport during Warm House and Hot House periods. This is shown below in the figures 3a and 3b.
Figure 3a: Present oceanic transport in the North Atlantic, over latitude 40N, schematic. The red block represents the poleward surface transport by the Warm Gulf Stream. The depth of the surface layer is exaggerated.

Figure 3b: Hot House oceanic transport in the North Atlantic, over latitude 40N, schematic. The big block with relatively warm water represents the deep ocean, transporting warm water pole ward. The volume of warm-water poleward transport is important. In a hot-house scenario it is ocean-wide and ocean-deep. The moderate water at the surface flows from the north pole to 30N, to replenish the sinking waters at 30N. The depth of the surface layer is exaggerated.

Warm, deep water was transported to the poles where at that time deep water was welling up (Golovneva 2000**). The warm water prevented formation of polar ice and the poles stayed ice free, even in winter time. During the winter half year, at the North Pole cold land areas were bordering the relatively warm Arctic Ocean, resulting in a high temperature gradient between the two. The high gradient resulted in strong winds that caused the upwelling of warm deep-water.
The warm polar upwelling and the downwelling at 30N together resulted in a reversed vertical ocean circulation, when compared to the present one. Our present vertical oceanic circulation is shown in figure 4a.
Figure 4a: Present (Ice House) vertical oceanic circulation. North-South transect, simplified, schematic. South Pole at the left (90°S), North Pole at the right (90°N), equator (0°) in the centre.

Present cold deep-water production at the poles dominates the deep oceans. Our present deep oceans are ice-cold, and that cold water is welling up at lower latitudes, cooling the warm surface layer. After upwelling, cool surface waters (shown in orange) are warmed in the tropics and transported poleward over the surface by warm currents.
But, in a Warm House or a Hot House State, the vertical water circulation is the reverse of the circulation as shown in figure 4a. See below, figure 4b.
Figure 4b: Hot House vertical oceanic circulation. North-South transect, simplified, schematic. South Pole at the left (90S), North Pole at the right (90N), equator (O) in the centre.

Warm saline waters went down at 30°N, filling up all the world’s deep oceans. The upwelling warm water at the poles had to flow back to the downwelling areas at 30°N to replenish the downwelling waters. Because surface waters at the poles became fresh and less dense, polar water stayed at the surface when it flowed back to 30N. As compared to the present situation (figure 4a), the vertical circulation in the oceans was reversed during Warm and Hot House periods (4b).
Deep, warm water was not only transported basin-wide and basin-deep but had the advantage that it was not cooled at the surface. For these reasons, this deep redistribution of tropical thermal energy was superior to the present ‘Gulf Stream like’ thermal energy transport over the surface. It was the perfect way to transport absorbed tropical/subtropical energy over all latitudes. The results were higher average surface temperatures and a more uniform climate from the poles to the equator. That is, a smaller pole-to-equator temperature gradient, see Figure 5.
Figure 5: Temperatures per latitude over the Northern Hemisphere for the Maastrichtian period, 72- 66 million years ago. The graphic below is fig. 2 from Golovneva, 2000, see the abstract at the end of the post (Golovneva 2000)**. From the paper: “Temperature gradients for present (continuous line, after Barron (1983)) and the Maastrichtian stage (dotted line).” The dotted line is based on fossil plant evidence.

Source: (Golovneva 2000)
Only a reversed vertical oceanic circulation can create the pole-to-equator gradient that is shown in the figure above, for the Maastrichtian. Notice the lower temperatures around the equator during the Maastrichtian (Warm House) period, as compared to the present period.
Much higher temperatures than todays were not only found at and around the North Pole, but also in Antarctica (Francis and Poole 2002). ***
The very different and more uniform distribution of surface temperatures over the latitudes of the Earth as caused by the oceans had important consequences for the role of water vapor, our main surface infrared radiation absorbing gas.
3. Water Vapor effects
Together, the warm deep-water production and the reversed circulation created temperatures at the high latitudes that were much higher than today’s minus 30 to minus 50 degrees Celsius during winter time. During Warm House and Hot House periods, even in winter time temperatures above zero were normal at the poles and for summer time, moderate temperatures were found (Golovneva 2000)**.
The much warmer poles and middle latitudes lifted the average temperature of the Earth.
As surface temperatures rose, the rate of evaporation over the oceans at the higher latitudes rose exponentially, resulting in a huge rise in water vapor content in the regional lower atmosphere. Water vapor is by far our main infrared radiation absorbing gas. Because of the warm deep-water production and because of the reversed circulation during Hot House periods, water vapor became also abundant over the middle and high latitudes. Reducing the speed of heat loss to outer space. And resulting in higher surface temperatures than could have been caused by only polar upwelling of relatively warm deep-water. Especially during night time and during the long dark polar winters, the water vapor effect enhanced the polar temperature increase that is initially caused by the reversed circulation and the relatively warm deep-water.
Figure 6: Water vapor content over latitudes, in our present Ice House State (on the left) and water vapor in a Warm House / Hot House State (on the right). North Pole on top, the Antarctic at the bottom of the figures.

Clearly, the Earth loses more energy in an Ice House State because of the lower content of water vapor over the middle and higher latitudes, resulting in a strong cooling for the Earth as a whole. Therefore, our present average temperature for the Earth as a whole is low.
The massive heat loss at the poles in combination with the poleward transport of very saline surface water results in the massive production of ice-cold, deep water that has been filling the present deep oceans. Elsewhere, upwelling deep cold water cools the surface, even far from the poles. Lowering average temperatures.
During a Hot House / Warm House State, a large quantity of water vapor over the high latitudes prevents the fast loss of thermal energy at the poles, leading to a higher temperature level for the poles and for the Earth as a whole. The higher temperature level at the poles also prevents ‘Ice and Snow albedo cooling’. A Hot House / Warm House State was the result.
Warm periods are characterized by a high stability. During Hot House periods climates were also very equal over most of the surface of the Earth. A warm Earth meant a stable, equal and in general moderate Earth.
During Hot House / Warm House climate states, the higher water content of the atmosphere over the middle latitudes also enhances rainfall over the poles, creating lower salinity ocean surfaces at the high latitudes that prevent cold deep-water production.
Fresh polar waters stabilized the deep-warm water heating system over the whole Earth as thermal energy was absorbed by the oceans at low latitudes. Water stores and transports huge quantities of thermal energy, especially if distributed ocean-wide and ocean-deep. Even if transport is very slow, it results in a huge redistribution of thermal energy over latitudes.
Because of the role of water vapor, deep, warm oceans did not need to be very warm to create ice free poles. A moderate rise in deep-water temperature and a reversed circulation were enough to create the right circumstances for an important rise in water vapor content over the middle and high latitudes.
Altogether, the ‘Triple H2O System’ prevented a strong heat loss at the poles and created a big rise in temperature, which resulted in higher average temperatures for the Earth as a whole.
3 x H2O + 1: Water vapor creates ‘weather’
The far more evenly distributed temperatures over all latitudes together with the enhanced water vapor content at the higher latitudes also changed the whole atmospheric system of Warm House and Hot House eras. Low- and
high-pressure systems, wind direction, wind speed, evaporation, convection, clouds and cloudiness, etc., all hanged. All were acting completely different as compared to our present atmospheric system. The more equal circumstances over latitudes reduced the pole-to-equator temperature gradient.
Together with ‘temperature’, it is water vapor, H2O, that creates the daily and seasonal variations in the atmosphere that we call ‘weather’. And because ‘climate’ is defined as the average of 30 years of ‘weather’, it is the water vapor molecule, H2O, that changes climate.
Water vapor creates differences in the density of air, like salinity creates differences in the density of ocean water. Both water vapor and salt create the movements in the two ‘fluids’ that create our weather and our climate, the oceans and atmosphere. Water vapor and temperature rule convection in the air and salt and temperature rule convection in the oceans.
In short, the system of ‘weather’, ‘climate’ and ‘climate states’
Oceans create ‘climate states’ and in the atmosphere, ‘weather’ is created by water vapor. ‘Orbit’ creates seasons. Slight differences in orbit create glacials and interglacials in our present Ice House State. Stadials (or glacial periods) start when the temperature of the oceans cools enough that snow and ice can start enhancing the Earth’s albedo. The lower temperatures cause much lower water vapor concentrations in the higher latitudes. Less water vapor in the air cools the poles during night time and during the winter, enhancing ice and snow effects and increasing the pole-to-equator temperature gradient. Weather changes, and climate changes.
All this happens in a certain setting of continents and oceans and each specific continental configuration for every geological era results in a set of possibilities for weather and climate. This set of possibilities is limited by a ‘general background temperature’ that mainly depends upon the temperature of the deep oceans.
Warmer deep-ocean water, a reversed vertical oceanic circulation and a far higher quantity of atmospheric water vapor over the higher latitudes, together create Warm House and Hot House Climate States. ‘Water’ is the main constituent of the three mechanisms: H2O, H2O and H2O.
Conclusions
Another positioning of continents and oceans in previous geological eras enabled a dominate warm deep-water production. Nearly enclosed seas and shallow seas at 30N produced warm and very saline water that, because of its high density, filled the deep oceans. Over the poles, a higher rainfall than evaporation caused fresh polar surface waters, this prevented massive, deep cold-water production. Warm deep-water production dominated.
Warm deep-water production at 30N resulted in warm upwelling at the poles and in a reversed vertical water circulation in the oceans. Higher temperatures at the poles and the mid-latitudes were the first result. In Warm and Hot House climate states, the poles stayed ice-free and polar winter temperatures became very moderate.
Over the higher latitudes, during Hot House periods the quantity of the most important infrared radiation absorbing gas in the atmosphere, water vapor, increased because of higher polar surface temperatures. That polar water vapor prevented a large heat loss for the Earth as a whole, warming the Earth. Water vapor also kept the poles and the higher latitudes warm. And because of the strong poleward rise in temperatures, the average temperatures of the Earth rose to what we know now as the higher average temperatures of Warm House and Hot House Climate States.
Because of those three H2O mechanisms Hot House Climate States developed in periods when the positioning of continents enabled a dominant warm deep-water production and prevented a massive production of cold deep-water. Nearly all the past 250 million years were [much] warmer than the Ice House State of the last 3 million years. The disappearance of warm, deep-water producing seas was the cause, in combination with the geologically recent development of a system of deep-cold-water production near the poles.
Simple physics did the work. All natural. Triple H2O.
With regards to commenting: please adhere to the rules known for this site: quote and react, no personal insults.
In commenting: please remember you are on an international website: for foreigners it is difficult to understand abbreviations. Foreigners only understand words and (within the context) easy to guess abbreviations like ‘60N’ or ’SH’.
About the author: Wim Röst studied human geography in Utrecht, the Netherlands. The above is his personal view. He is not connected to firms or foundations nor is he funded by government(s).
Andy May was so kind as to read the original text and improve the English and text where necessary. Thanks again Andy.
* According to this Bill Illis, graphic:

** Source of the data:


(h/t Philip Mulholland)
*** Cretaceous and early Tertiary climates of Antarctica: evidence from fossil wood
Francis, Jane and Imogen Poole
Abstract
Fossil wood is abundant in Cretaceous and early Tertiary sediments of the northern Antarctic Peninsula region. The wood represents the remains of vegetation that once grew in high palaeolatitudes when the polar regions were
warmer, during former greenhouse climates. Fossil wood is a unique data store of palaeoclimate information. Analyses of growth rings and anatomical characters in fossil wood provide important information about temperature, rainfall, seasonality and climate trends for this time period in Antarctica. Climate signals from fossil wood, supported by sedimentary and geochemical evidence, indicate a trend of cool climates during the Early Cretaceous, followed by peak warmth during the Coniacian to early Campanian. Narrower growth rings suggest that the climate cooled during the Maastrichtian and Palaeocene. Cool, wet and possibly seasonal climates prevailed at this time, with tentatively estimated mean annual temperatures (MATs) falling from 7°C to 4–8°C respectively, determined from dicotyledonous (dicot) wood anatomy. The Late Palaeocene/Early Eocene was once again warm, with estimated MATs of 7–15°C from dicot wood analysis, but conditions subsequently deteriorated through the latter part of the Eocene, when cold seasonal climates developed, ultimately leading to the onset of Cenozoic ice sheets and the elimination of vegetation from most of Antarctica. Source.
Works Cited
Francis, Jane and Imogen Poole.2002. „Cretaceous and early Tertiary climates of Antarctica: evidence from
fossil wood.” Palaeogeography, Palaeoclimatology, Palaeoecology 182 (1-2). https://www.sciencedirect.com/science/article/pii/S0031018201004527.
Golovneva, Lena. 2000. The Maastrichtian (Late Cretaceous) climate in the Northern Hemisphere.” Geological
Society, London, Special Publications 181: 43-54.
http://sp.lyellcollection.org/content/181/1/43.short.
Unfortunately the graphics don’t show up, at least not on my computer. I will ask Andy to have a look at it.
OK, there they are. Thanks Andy!
Sorry about the problems. The fonts in the post do not work well with the new site host Pressable, I’ve tried to fix them as best I can. Using default fonts is best. The figures in the original post were not graphics files, but addresses, which I couldn’t see were missing until I posted it. I had to upload the files manually and put them in the post in the Pressable editor. Finally, I’m encountering some incompatibilities between our software (Open Live Writer) and the European version of Word. I had the same problem with Javier’s last post. Lot’s of extraneous CR/LF’s. If anyone has some tips on these issues, I’d like to hear them. I used a completely different process when we were on WordPress.
Looks fine here Andy. Only anomaly I saw was that when I first looked at it about 20 minutes ago, you were the author, but now the author is Mr Röst. Thanks for your efforts
I’m seeing a blank frame just below the “Bill Illis graphic.”
It’s there on my tablet.
You are right, it seems the graphic again disappeared. I will ask Andy once more to make a correction.
It is still blank on my display.
He is rightly saying the oceans govern the climatic system.
What governs the oceans? I say it is the amounts of energy they absorb from the sun.
Changes in light intensity in the UV /NEAR UV light range influences to a great degree how much energy the oceans ultimately receive.
When the sun is in an extreme state of minimal activity like it is now, this results in overall surface oceanic cooling which is what we have now.
Overall oceanic cooling now going on for a year and it looks like this trend will be continuing as we move forward.
Interesting climatic times. I say this year is the transitional year and it will be if my theory is correct which is, it is the sun modified by the geo magnetic field which governs the climate not CO2.
Interesting times, indeed. I am following the actual developments, but I notice that the time scale used in the post is a different one. On the time scale of millions of years the movement of continents govern climate states. And they do so, at least to my opinion, by the three mechanisms mentioned in the text above.
Another fine essay Wim, thanks. I feel a link to one of your earlier essays will help some readers who may have missed it:
htpps://wattsupwiththat.com/2017/08/13/cooling-deep-oceans-and-the-earths-general-background-temperature/
Thank you WBWilson, good idea.
Below I will put a complete list of my posts at WUWT until now, for our new readers. I hope the links still work, otherwise the titles and my name if put in the ‘Search WUWT’ box on top of the page (on the right) must be enough to find earlier posts with extra information.
2017
August 20 Oceanic Downwelling and our Low Surface Temperatures
August 13 Cooling Deep Oceans – and the Earth’s General Background Temperature
August 1 Warm is stable – Cold is change
July 17 The Role of ‘Ocean Upwelling’ and ‘The Deep Ocean’ in the Glacial Cycles
January 26 ‘Warming’ and ‘The Pause’ Explained By Wind, Upwelling And Mixing
2016
December 26 Warming by [less] Upwelling of Cold Ocean Water
2015
December 3 IPCC ≠ SCIENCE (2) A SEPARATION OF POWERS
November 29 IPCC ≠ SCIENCE ↔ IPCC = GOVERNMENT
“geo magnetic field which governs the climate not CO2.” Why that can’t be right from a political view. Governance can’t tax water vapor. Or, should I say, governments don’t know how to tax water vapor – yet.
No need ! They already “TAX” the LIQUID STATE of water…………..
or don’t you pay your connection charges and water and sewerage rates ?
Perhaps you get exemption as an “old construction worker ” ???
An interesting speculation as to the cause of the intermittent hot house and ice house states of the earth. The basic key appears to be the location of continents and seas. It is feasible that a small change in the shape of continents can make a large change in ocean currents – this is analogous to the difference in the note played by a wind instrument, where the metal of the trumpet remains constant (as it did in early trumpets) but the note is changed by the small changes of the player’s lips.
The question is, what was responsible for the temperature changes within the current ice house state, such as the Younger Dryas and the Eemian Climate Optimum. Is the system generally constant for any distribution of land and sea or is it a two state variable, such that temperature generally warms until an automatic flip occurs, when it reverts to a cooler state, to resume warming? A sort of ‘flip-flop’ system?
“Is the system generally constant for any distribution of land and sea or is it a two state variable, such that temperature generally warms until an automatic flip occurs, when it reverts to a cooler state, to resume warming?”
WR: The system must be a ‘many state variable’. Water, H2O, is influenced by a lot of forces and we need to study all those forces to know which variable is influencing the oceans (and water vapour), at what moment and why.
We should start with studying all (!) movements in the ocean in detail. We should know for every cubic kilometre of water (there are 1.3 billion cubic kilometres of ocean water) how it is moving through the oceans. And we should register that for decades and more. Only when we know the oceans and when we know all forces that are moving the water in the oceans, we could start to make any prediction about the future of our climate.
When satellites were suggested to be important to oceanography over a half century ago, there was skepticism among the old, and some new, guard that they could not replace in place measurements. Collecting data at sea is often not fun, but the argument was that it was necessary despite improvements in technology. My main problem was having to wear glasses at age 30, others had it much worse. There weren’t many oceanographer types then, hardly any degrees, but they were important because of their service in WWII and the then current world conditions.
https://www.bizjournals.com/portland/news/2018/06/12/osu-gets-88m-to-develop-second-ocean-research-ship.html
Satellites can only guess about salinity and temperature at depth. We need very exact measurements of salinity and temperature from top to bottom, measured continuously and every time at the same place, measured by super calibrated instruments (pressure corrected, ask Pat Frank). Density differences in the deep ocean are very, very subtle. And we need to know exactly which water goes to what place to know the trends in the movements of ocean water, cold and warm. Vertically and horizontally. Our oceans have a surface area of some 360 million km2. https://hypertextbook.com/facts/1997/EricCheng.shtml
How much fixed buoys do we need?
Why not start with an investment in deep water research with an amount comparable to the investment for a handfull of windparks at sea? A couple of billions. The result will be that we (decades from now) finally will know what changes in climate we can expect. Without knowing the oceans we will never be able to predict.
From all this, am I to understand that the warm Gulf Stream current actually is part of a system which is causing much colder temps at the poles? That feels counter-intuitive.
It also means that if the Gulf Stream thermo-haline current stops, that would lead to a warmer world, contrary to what the disaster movie depicted. Of course, getting from one state to the other state would be ‘interesting.’
“From all this, am I to understand that the warm Gulf Stream current actually is part of a system which is causing much colder temps at the poles? That feels counter-intuitive.”
WR: I got the same feeling when I discovered the Hot House circulation system. We all learn that the Gulf Stream system is transporting high quantities of energy poleward, by currents and by air (that took the energy from the oceans). I even read that the system of poleward heat transport ‘is working at the max’ (an article about the Carnot cycle if I remember well).
But as soon as a dominant warm deep water production appears, and a reversed circulation system, then you know that our present system is but childish compared to the previous Hot House and Warm House Systems. Those systems were really redistributing energy over the latitudes. They really created a stable and equal climate system. Nice warm and not too hot. Lush and green.
But, unfortunately, such a system develops over a period of millions of years, more or less with the speed the continents move….. So, a simple stop of the thermohaline circulation – if possible – is not bringing us such a nice system.
The best we can have is something like the moderate warming we have now. For the Dutch the moderate warming is not enough: during summertime they flee by the millions to ‘warm countries’. The real climate refugees: southward.
The worst we can have is a cooling into the direction of the next Glacial. It will be more gradual than the sudden rise in temperature at the start of the Holocene, but it will be unpleasant. Not only because we don’t like ‘cold’, but also because agricultural production will be affected, rain will diminish and rain systems will change etc. And variation from year to year will grow, inherent to ‘cold states’.
I am not going to be alarmistic. We have got time enough to register what is happening and after that, to take our measures. As far as I can see. And future possibilities to take the right measures will be much better than we have now. If only because we will know with more certainty how things work in ‘climate world’.
very good article. Would be on the top 3 of a year compilation.
Too bad it isn’t at scientific standard. The claim is very plausible, but it should be backed by much more reference and evidences to be peer-reviewed and published, as it deserves
Despite this shortcoming, this article brings a missing piece in my puzzle, that’s why I find it so good.
Seems obvious to me that Earth is eating up its heat capital stored in the ocean, getting colder and colder as time goes, because cold water sink and warmer water resurface. And this article explains how it could be, and actually was, the opposite.
Well written article. I agree with most of it.
[Nearly all the past 250 million years were [much] warmer than the Ice House State of the last 3 million years. The disappearance of warm, deep-water producing seas was the cause, in combination with the geologically recent development of a system of deep-cold-water production near the poles.]
Three million years ago the Isthmus of Panama closed, blocking Pacific Ocean water from entering the Atlantic near the equator…that had to have some effect.
“Three million years ago the Isthmus of Panama closed, blocking Pacific Ocean water from entering the Atlantic near the equator…that had to have some effect.”
WR: During tenths of millions of years the oceans have been cooling.
The disappearance of shallow and nearly enclosed seas at 30N has been the main cause for that cooling. But an important role has also been played by the opening up of the Atlantic itself. In present times, we find the most saline surface water of the world in the Atlantic Gyres. Those gyres did not exist nor function in this way 50 million years ago: the Atlantic had a much smaller width, see the animation of Christopher Scotese. Because of that, the salinity of the surface waters of the gyres could not have been that high that 50 million years ago already cold deep water was produced in large quantities.
The closing of the Isthmus of Panama must have ended the disappearance of already saline Atlantic surface water to the Pacific: before, the Trade winds from the east were pushing surface water westward through the Isthmus. The closing of the Isthmus has kept that saline surface water in the Atlantic, enhancing salinity especially in the North Atlantic. And enhancing the production of Arctic Bottom Water: more saline and so denser Atlantic water became available in the northern subpolar regions.
“The closing of the Isthmus of Panama must have ended the disappearance of already saline Atlantic surface water to the Pacific”
Also, while it stopped the export of saline surface water to the Pacific, it probably decreased but did not stop the net export of fresh water in the form of rain evaporated from the Atlantic but falling over the Pacific or west of the continental divide.
Great article. 100% agree.
My chart above is just noting that there are lots of temperature reconstructions that you see on the internet but many of these are miscalibrating the proxies. I think this is deliberate because the original sources of the data were clear about how they should be used. So, when Hansen provides his temperature numbers for the Cretaceous or the Eocene, he is giving you estimates that are two or three times too high. He knows how they should be treated and why but he doesn’t make the corrections. Why would he provide estimates that are miscalibrated? Because he is an alarmist.
Thanks Bill. And thanks for bringing clarity in the (mis)use of proxies.
Only with the right facts a correct reproduction of past situations can be made. And correct conclusions can be drawn. Thanks to people like you we get the right information. Thank you for that!
And Wim, even the chart you used in the comment just before this one, is actually using the miscalibrated proxies.
Eocene temps were +6.0C , not +12.0C. If one used the same methodology (as the 12C) and went farther back in time using the same database of proxies, temperatures end up at +50C at 500 Mya etc.
Yes, you are right. I realised that the temperatures were not right, but the graphic above showed clearly the long downgoing trend in temperatures that I wanted to show. With all that fear mongering it is very difficult to find the right well calibrated graphics…..
Bill: thank you for that chart, it explains a lot, after reading your explanatory comment about the misuse of proxies. The orange (ish) line showing that an equilibrium climate sensitivity (ECS) of 3.0°C per doubling of CO2 leads to temperature anomalies well in excess of the observed (well; calculated from proxies) is most enlightening. Just by eyeballing, it appears that Hansen was implying a much larger ECS of 7° to 8°C per doubling, without actually saying so.
It would be great if you could show us a plot with more of those lines using ECS values of 0.5°, 1°, 2° and a value that approximates the Hansen temp-anomaly line.
If what you wrote about the misuse of proxies is true (and can’t be challenged by anything approaching a reasoned argument), that falsified temperature reconstruction is an astonishingly blatant example of falsifying data. Egregious, even by the elastic standards of climate science. Right up there with the hockey stick.
When I back-fit the temperature line to the same times as the CO2 estimates were available from (3200 individual estimates of ECS), the result was any number in +/-40C with just a random distribution between the numbers. Maybe the average average was around 1.0C per doubling but with the overall distribution, I would say that Wim’s original article proposition was really the only important factor. Continental alignments and ocean currents and water vapour are the factors that affect the Earth’s climate.
I still don’t understand the mechanism that can drive massive ice formations on the continents during an ice age. It must have taken a massive amount of heat to vaporize that much of the oceans which seems inconsistent with water freezing on the continents. If it were to become gradually colder today, would we not expect the ice-caps to simply extend from the poles towards the equator? Why wouldn’t the oceans simply freeze in place?
I just don’t understand these things.
Cold oceans result in cold atmospheres. A cold atmosphere results in a loss of water vapor. A loss of water vapor results in a cooling Earth. As temperatures are that far down that large surfaces of snow and ice can develop (during winter time), a lot of sun energy is reflected, cooling the Earth even more.
The loss of water vapor also lead to less clouds. Less clouds, especially over the tropics, result in more sun rays reaching the surface and result in a higher absorbance of sun energy by the tropical oceans. I suppose that this warming and balancing mechanism prevents (together with other factors) a further cooling at a certain point, possibly / probably preventing a Snowball Earth.
Cooling means more reflection of sun energy at the poles, but less reflection in the tropics.
Very interesting; to me most of this is new.
And, although I’m unable to vet this post myself, it appears head and shoulders above most I’ve recently seen here; it’s one of the very few to which I’ve assigned a bookmark.
Many thanks.
jhborn, thanks for the compliments!
I myself I have been learning a lot by the articles at this (and other) blogs and also by the comments and all the information that has been provided in the comments. The same for the critical view of the commenters: everything ‘sharpened’ my mind. A word of thanks to all of them.
There has ever been a commenter at this site (sorry, forgot the post and the name) who said something like: ‘(you skeptics) you all have critics about everything that is produced by climate science. But, if their theory is not right, what is YOUR theory?’
I thought that to be a very interesting question. This post can be seen as a result of that question. And without all the posts and comments of everyone at this and other blogs it would never have been produced.
My thanks to all and especially to Anthony who created this site for good discussions and for great information. A great job! Thank you!
Interesting comment about, “what is your theory?” It gets to the crux of CAGWers trying to abscond with the null hypothesis. The null hypothesis is that we are living in an ice age and the climate is going to revert to a glacial period in the next ~5000 years, regardless of how much CO2 is in the atmosphere. It would take some compelling physical evidence to upend that, and nobody has presented that yet. Great article.
Good review of oceanic influences on climate.
Obviously, these relationships have to be studied, but then I would be more relaxed if sudden warming did not happen.
Mihaly Malzenicky: “but then I would be more relaxed if sudden warming did not happen”
WR: I feel quite relaxed with the present situation, having had a look at all the facts of climate and having studied many facts about the Earth. Last century warming has been very moderate if compared to what happened at the start of the Holocene. I am also realizing that, given the very low temperatures of the oceans, the present surface temperatures must be near the top of what the system of the Earth can produce. Average surface temperatures over a 100.000 year period are degrees lower than today’s, thanks to our ice-cold oceans: only the most favourable orbital circumstances permit us our present temperatures. Let’s enjoy any warmth, as long as it is possible!
Y.y….y…y.y…y’mean it’s not all about CO2?
I’m shocked! Shocked I tell ya!
All this time, I thought it was ALL about CO2!
Mommy!!!
– Justin Trudeau, in conversation with Climate Barbie, June 15, 2018.
I say: H2O
Methink JT certainly doesn’t call her Mommy. Rather Mistress, so that would be
her 1: (crawling on the ground)Punish me, mistress
her 2: STFU, you scum DB, how did you come to know it was H2O?
her 1: (licking her 2 boots), Yes mistress, I confess, I read WUWT
her 2: And how did you let it that known?
her 1: I FU, mistress, I am so sorry, so very sorry
her 2: (slapping her 1 browless face with a stick) I said STFU. All you had to do is to have it censored for being a misogynist racist WASP. And you couldn’t, useless impotent little rascal Now return to your geol.
Your comment adds nothing to what is otherwise an erudite discussion. In fact, it’s childish. There’s lots of negative things you can say about Trudeau and whatshername without resorting to that kind of nonsense. Grow up or shut up. Please.
Hello Smart Rock,
While paqyfelyc took my jest in an unfortunate direction, I suggest that this “climate change” nonsense is indeed worthy of satire and ridicule, because it is the most ridiculous and outrageous abuse of science in recent memory, and certainly the greatest scientific fraud, in dollar terms, in all of human history.
If you insist on serious comment, here is one of my recent posts. However, the average citizen (voter) does not have the education to follow this argument – but he is much more likely to be swayed by ridicule, and the fact that so-called “green energy” is costly and unreliable, is driving up the cost of everything, and destroying jobs and our economy.
https://wattsupwiththat.com/2018/06/11/nasas-jimbridenstine-has-reversed-his-position-on-climate-change-and-can-no-longer-be-trusted/#comment-2376151
I’ve added a few points to my 2008 and 2015 papers that “close the loop” on my observed ~9 month LAG of atmospheric CO2 AFTER global temperature.
Regards, Allan
The overall discussion makes sense. What does not make sense is the curve showing a 3 degree C per doubling of CO2, which is NOT an established number—certainly not from data.
I agree MS
“3 degree C per doubling of CO2″is far too high – this is a warmist fantasy based on huge positive feedbacks that do not exist – TCS/ECS is no more than approx. 1C/(2xCO2), and is probably less than 0.5C/doubling.
Excellent article, particularly considering the difficulty necessitated by the long time frames and use of proxies which can be interpreted variously and therefore spun to support one’s leaning. But all that aside, with 70% of the planet’s surface covered to an average depth of over 12000 ft, only a fool would ignore water as a primary regulator of climate.
Thank you JimG1. I would even say: “water as THE primary regulator of climate”. As the article shows, you don’t need anything more than just water, H2O, to change all climates of the Earth to even the situation of a Hothouse State.
Would it be different nowaday?
Wim,
“the ‘warm’ deep oceans of the past probably had average temperatures of 6 to 10 degrees Celsius.”
I don’t buy this. As long as there’s ice at the poles, there will be cold water and cold water, being denser, sinks. For the deep ocean to be this warm, the poles would need to be even warmer. As long as the Earth is tilted, the Sun disappears for months at a time during the polar winters and ice will surely form. Water vapor alone will not stop this from happening.
“As long as there’s ice at the poles, there will be cold water and cold water, being denser, sinks”
WR: co2isnotevil, before I started to have a close look to what happens in the oceans, I thought so too. That we think so is because we know the situation with fresh water. Colder fresh water (up to 4 degrees C), sinks. But in oceans it is different. In oceans it is the total density that causes sea water to sink or to float and that density is dependent on both temperature and salinity.
The present situation in the Arctic shows you colder water at the surface (around 0 degrees Celsius) and warmer (!) Atlantic water below: normally around 2 degrees, but after recent inflows of warmer Atlantic water – that recently melted the ice in the Arctic – even subsurface temperatures up to 3 degrees Celsius have been measured. But that warmer Atlantic water has a higher salinity and for that, it is situated below the fresher and colder top layer. Recent experiences with diminishing Arctic ice after the inflow of warmer Atlantic water of 3 degrees Celsius (in the nineties and the early 2000’s) proves that water of only 3 degrees C can keep polar surface water ice free. It only has to be mixed enough with the water above which happens as enough depressions enter the Arctic.
Think also about the ‘import of warmer air’ from the warmer mid latitudes at that time. And the cooling polar surface waters became transported over the surface southwards to replenish the sinking waters at 30N.
If you read the article of Lena Golovneva (p. 52) you will read that remnants of Hesperornidids are found at high latitudes, a bird that is found near seas with a high productivity. We find a high productivity where we find upwelling deep water, which has a high content of nutrients. Other findings confirm winter temperatures above zero during the Maastrichtian.
It looks strange, but a high upwelling of saline water of 6 to 11 degrees C prohibits the formation of sea ice. We are thinking about temperatures at the poles of minus 30 or less, but the upwelling warmer deep water and the higher content of water vapor at that time kept temperatures much higher.
Igor V. Polyakov wrote several articles about the recent influx of warmer deep Atlantic water in the Arctic, causing sea ice melt. For example: https://journals.ametsoc.org/doi/abs/10.1175/2010JPO4339.1 Arctic Ocean Warming Contributes to Reduced Polar Ice Cap (2010)
There is also another article from 2017: http://science.sciencemag.org/content/356/6335/285
Greater role for Atlantic inflows on sea-ice loss in the Eurasian Basin of the Arctic Ocean
“Other findings confirm winter temperatures above zero during the Maastrichtian.”
And remember the Paleocene alligators on Ellesmere land. That means that the temperatures cannot have gone below frezzing for long periods in winter, even just 800 miles from the Pole.
Certainly, the oceans are more influential on the planets temperature than any GHG, but that influence is largely limited to the top few 100 meters. An ocean or Antarctic impact event, or very large volcanic event will temporarily perturb the system, but it will eventually settle back into a steady state based on available solar energy, relative to its distribution on the surface as modulated by orbital and axial variability and as affected by hemispheric asymmetries.
While we don’t think of water as being an insulator, even copper at a sufficient thickness can insulate hot from cold. No material has either an infinite or zero thermal resistance. The thickness of the thermocline is dependent on the temperature difference between the deep ocean cold and warm surface waters. As the planet warms/cools, the boundary between the thermocline and deep ocean cold migrates up/down as the upper boundary with warm surface waters remains relatively fixed. The lower boundary has to drop more than an order of magnitude deeper than it currently is, and then some, to achieve deep ocean temperatures that warm. You should compare the temperature profile of the ocean with the temperature profile of a wall insulting a cold exterior from a warm interior (or visa-versa). The thermocline is that insulating wall.
The thermohaline is driven by cold water sinking at the poles, pushing up from the bottom in the tropics to replace water lost through evaporation and rain/snow transporting that water towards the poles. As a result, there’s always a pool of dense (cold) water at the bottom of the deep oceans, even in the tropics. There’s a push and pull going on here, the push is as cold sinks at the poles and the pull is as water evaporates from the surface in the tropics. The pull part of this equation is not a obvious, but equally important.
In a Hothouse period the ocean was warmed by downwelling water. Even right now, downwelling very salt and warm water from the Red Sea is going down to 3000 – 4000 meter in the Indian Ocean, warming ice cold ocean water at that depth.

More about downwelling in this post: https://wattsupwiththat.com/2017/08/20/oceanic-downwelling-and-our-low-surface-temperatures/
The only way to warm the enormous mass of the oceans is not by conduction but by a massive deep warm water production at 30N or 30S. It is the mass of water in the (deep) oceans that warms or cools the Earth, by her (reversed) vertical circulation, by upwelling at specific places and by the effects of the whole ocean system on water vapor, especially at the high latitudes. That quantity of water vapor at the higher latitudes can stop the Earth from cooling, creating a Hot House, in case its presence is abundant: as the oceans are warm and are warming the poles. And a lack of sufficient water vapor at the high latitudes (caused by cooling oceans) will cool the Earth further. Right now we have a lack of water vapor at the high latitudes and most time in our era we are living in a glacial.
Look at the quantity of total precipitable water in the atmosphere. Click on the map (link below) and the quantity of water in the atmosphere is shown on the left: right now 200 gram per m2 total air column at some places in Antarctica to around 70 kg per m2 at some places in the tropics, now in the Chinese Sea. Compare with the temperatures on that places: click “Earth” and click ‘Temp’. Higher temperatures, caused by warmer seas, result in a higher content of precipitable water.
https://earth.nullschool.net/#current/wind/surface/level/overlay=total_precipitable_water/orthographic=340.47,-83.99,508/loc=72.461,-82.644
The whole process is set in motion by the continents that create seas that produce warm deep water or make them disappear. About the disappearance of these deep warm water producing seas an interesting story might be told. Later I will publish a post about that. The interesting thing is that both India and Antarctica played an important role in the cooling of the Earth to the Ice House State that we now are living in. Nearly in the same period.
It is H2O that rules the Earth’s temperatures. In the ocean and as water vapor in the atmosphere.
That’s pretty easy to test. The question is:
What’s the salinity difference required for a 10°C water to sink down below a 0°C ?
What is need is a two dimension density diagram for water, with salt content in an axis, and temperature in the other. Or this calculator
http://www.csgnetwork.com/h2odenscalc.html
Baseline: 22°C, 39g/l, d = 1.027
cold: 0°C, 39g/l, d=1.0313
warm:10°, 39g/l, d= 1.0301
SO:
You only need 1.3g/l for the 10°C water to sink below 0°C water, and line up the ocean bottom. That’s nothing.
Basically, I suspect that, to return to warm house climate, all you need is the amazon to discharge through Rio de la Plata (34°S) instead of close to the equator.
Pressure is also important. At the pressures of the deep ocean, salinity has far less influence on density and temperature dominates the water density profile.
co2isnotevil: “Pressure is also important. At the pressures of the deep ocean, salinity has far less influence on density and temperature dominates the water density profile.”
WR: Density at depth is often corrected for pressure to compare it with the density at surface level. Pressure at depth has influence on the volume of water and influences the measurements of salinity and temperature. For that you need calibrations of instruments that are measuring at depth that are rather costly.
I wander whether after correction for pressure the role of temperature and salinity in density is different.
pressure is certainly important, but I see no reason why it would change the salinity Vs temperature density profile
Sorry Paqyfelic, it is all a bit more complicated.
Paqyfelic: “you only need 1.3g/l for the 10°C water to sink below 0°C water”
WR: You are looking at density (d) in your example, not salinity. You get the same density of (for example)1024.790 in the following cases:
Case A: 10 C and 32197 mg/L
Case B: 0 C and 30860 mgl/L
So to let A sink below B, you only need to add 1 mg/L to A: 32198 mg/L will be sufficient.
To let B sink below A, you only need to add 1 mg/L to B: 30861 mg/L will be sufficient.
A little drop in temperature has the same effect: the one that cools sinks.
Your idea of the Amazon river:
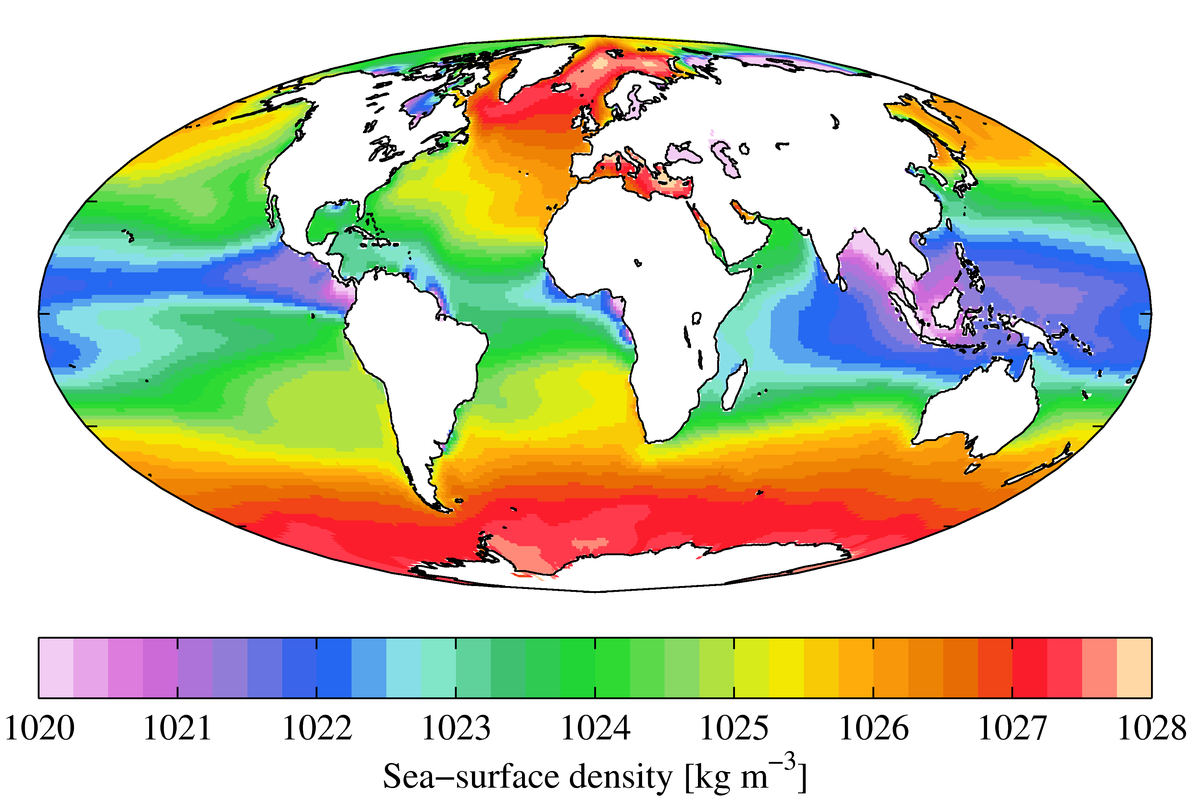
The ocean surface (!) density map looks as follows:
As you see warm surface waters around the equator will not sink easily: their density is too low, even after removal of the fresh water of the Amazon. But having the Amazon discharged through the Rio de la Plata will probably result in warmer and much fresher subantarctic surface waters with a density to high to form Antarctic deep water. A smaller ice cold deep water production would indeed enhance deep sea temperatures after some time, because the production of warm deep water at some other places continues while polar deep water production diminished.
My idea of the Amazon Vs Rio de la plata is that it makes a difference if the fresh water, which will float above the more salty ocean, reach the ocean in an area of high evaporation, as it currently does, or lower evaporation.
In the first case, this fresh water is the first to be evaporated in the carribean and produce a relatively low salinity hot water which will not sink.
In the second, evaporation there will proceed on salty water, producing higher density hot water that can sink; the sinking heat will not fuel convection as it currently does, resulting in less storm and hurricane not heat hurricane, produce less rain. Meanwhile in the Rio de la Plata area evaporation is smaller and more mixing would occur, reducing the average density against which the salty hot water compares.
paqyfelyc: “In the second, evaporation there will proceed on salty water, producing higher density hot water that can sink”
WR: Clear. Agree. Salinity will rise. But how dense will the water be? Looking at the map above, I wander whether the density would be considerably above the density of the surface waters we find now east of Saudi Arabia, in the Arabian Sea. In that case, the density at the surface would still stay far behind the density of the eastern Mediterranean, a density needed for a deep (!) sink into the depth of the oceans.
On the other hand, any extra sink of warmer surface water will raise the average temperature of the oceans. Even if it is only a moderate downwelling. And that will have its consequences for the climate system of the Earth.
Actually it is the present situation with very cold deep oceans that is remarkable, considering that the deep ocean has warm water on top and hot rock underneath. And there is really no doubt that the deep ocean has normally been a lot warmer (and also more oxygen-poor). There are several proxies which show this.
Proxies can be misleading, especially going back millions of years. For example, an oxygen poor environment alone could alter the delta o18 proxy of temperature. Inaccurate and/or presumptive reconstructions of continental drift millions of years ago and where any part of the surface was, relative to the prevailing sea level at the time can also introduce bias. I have trouble believing any proxies calling for temperatures 10’s of degrees higher than today. The only way that this could be possible is if the Sun got significantly stronger. Large positive feedback isn’t enough.
In that case do you believe in the warm, deep water that is produced even today in the Mediterranean and The Red Sea?
Also the periodic episodes of hypoxic or even anoxic deep oceans in the past are essentially impossible unless deep water temperatures were much higher than now.
tty, it is the lack of deep downwelling water that causes anoxic situations in the deep sea: there is no refreshment. Anoxic situations were possible both in warmer periods and in cold periods as far as I can see. The ending of a deep downwelling is enough to cause an anoxic situation after some time.
In icehouse climates downwelling waters are highly oxygenated. There has never been any deep ocean anoxia during such periods.
tty, in general you are right. But imagine that present deep ice-cold water production (oxygen rich) would stop, for whatever reason. In case no other deep dense water production should replace the cold deep dense waters below (in case only intermediate deep water is formed), after some thousands of years the oxygen in the deepest water would have been used and the deepest ocean would become without oxygen, with anoxia.
co2isnotevil: ” I have trouble believing any proxies calling for temperatures 10’s of degrees higher than today”
WR: I was glad that Golovneeva (see the link in the post) used tree leaves and bones of animals to estimate temperatures.
co2isnotevil: The only way that this could be possible is if the Sun got significantly stronger
WR: The interesting thing is, that in the last 100 million years became circa 1% stronger (a considerable number of W/m2) and that at the same time the Earth cooled down (!) from a Hothouse State to an Ice House State.
Only the change in the positioning of the continents with her effect on deep warm water production, vertical circulation and water vapor at high latitudes are able to explain this contrary movement of sun energy and average temperatures. Showing the power of H2O and the mechanisms described.
Thanks Wim, great article. Bear in mind that ocean core 18O data and tillites on several continents indicate a “brief” ~200kyr glacial episode in the mid Turonian.
I saw the straight Turonian dip in the Phanerozoic Global Temperature Curve from Christopher Scotese, accompanied by a question mark. It looks like a specific anomaly due to a specific event. Is there an explanation for that anomalous dip?
This is interesting and it takes us beyond the idea that all changes in past global surface temperatures were caused by changes in atmospheric co2. How much co2 do we have to add to the atmosphere to account for the hotter past temperatures? It also gets away from the idea that we can rank the parts of the Earth, the oceans are most important and nothing else is important, The Earth functions as a whole and it does not recognize our categorizations of it and there relative importance, importance is a word we use in social science.
You are right, climate science could have chosen ‘the wrong molecule’. Some remarks.
You can heat up the surface of the ocean by an extra influx of sun rays (for example by less clouds) or by less mixing of the upper layers (with the colder deeper surface layers) or by less upwelling of (cooling) ice-cold deep ocean water into the surface layer.
You can heat up the deep (!) ocean by a more massive sink of warmer water with a high salinity. I don’t know any mechanism by which a trace gas like CO2 (which is rather evenly dispersed over the surface and in height) would be able to produce more warm high saline water at some place, water that will sink into the deep ocean.
I cannot imagine a situation in which the atmosphere can heat up more, without a warmer ocean surface. More water vapor is needed, but without warmer oceans it is not very probable that more water vapor will be produced. I think we are already at the top of atmospheric temperatures given our present ocean temperatures. Every tenth of a degree cooling of the oceans will diminish water vapor and enhance the total daily cooling of the Earth.
An eventual influx of cold (!) Atlantic subsurface water into the Arctic region (see also comment Wim Röst June 15, 2018 8:18 am above) could easily reverse the recent warming trend in the Arctic region and so reverse the warming trend of the Earth. Again: actor H2O. As also was the case by recent Arctic warming: caused by an influx of warm subsurface water, H2O.
Plants (fossil wood) seems to be used as a reference only as relates to them as end products & not as actors. Heading “Water vapor effects” right diagram of hothouse earth elaborates high water vapor as equivalent to low cooling in most parts. My following comments are not extended to author’s global water circulation ideas, of which I feel unqualified to address.
Under high light flux mist evaporation provides evaporative cooling for plant leaf surfaces. That relative humidity not only reduces air temperature, but also ameliorates the water vapor deficit (dryness) at the leaf boundary layer. Plant stomata can then perform more conductance (at stomata) under strong light without losing turgor. The increase of leaf transpiration means more nutrients coming up the vasculature & more CO2 at the leaf boundary layer with air able to be incorporated into plant matter.
In essence mist cools, boosts stomatal conductance under light & improves CO2 levels where leaf gets to use it. This is different than droplets of water, which since do not evaporate wets the leaves/soil & is not the same as evaporative cooling (likewise when the leaf temperature is below the dew point high relative humidity mist creates droplets & not evaporative cooling). If the fossil plant growth when hot house earth occured thanks to more CO2 (whether use efficiency as described above, or more ppm) then the down-stream fine root development & their subsequent turnover would provide more soil carbon for soil micro-organisms to further down-stream result in higher ambient CO2.
Although original post elaborates a systemic water dynamic for hot house earth, my point is we do not know the form of water indicator plants (fossil wood) created growth during that time. I can not refute an assertion that high water vapor meant low cooling in regards to where/how/why author stated; nor do I think he is neccessarily wrong. Instead my comment is that possibly at the plant-air interface mist form ( more than droplets) of water may have been prevalent part of the time/place author calls hot house earth & thereby (mist) cooling at that level (leaf boundary). Aside from the dynamic itself, down stream side effects may be one (am not saying all or grading impact) reason elevation in ppm CO2 lags records of temperature having gone up. {{Unedited, pardon any errors.}}
A high content of water vapor at the poles diminishes the loss of heat to space for the Earth as a whole. That is how ‘cooling’ in the article is used in relation to the role of water vapor at the higher latitudes.
I am curious what the effect of having a land mass at the poles has in regards to the earth’s temperature?
I see 4 different scenarios.
1) Both polar regions being ocean with no land.
2) Both polar regions being land with no ocean.
3) The north polar region being land and the south polar region with no land.
4) Today’s configuration of land masses.
I am not sure if it matters which polar region has land while the other has no land so it may be there are only 3 scenarios.
The questions I have are, have all 4, or 3 scenarios existed in the past and what was the average temperature of the earth during each scenario?
Another permutation is that our present Arctic Ocean is largely enclosed preventing mixing with warmer waters and maintaining ice cover year round. Together with an ice covered Antarctic this should increase albedo and act to cool the planet. Still h2o.
Yes, but another factor would diminish cooling. Ice cold deep Arctic water is cooling the deep oceans of the world. A situation that that cold Arctic water could not reach the other oceans existed until some million years ago. The subsurface Greenland -Scotland Ridge was that high, that deep Arctic water was kept in the Arctic ocean itself. The lowering of the Greenland -Scotland Ridge made that cold Arctic water continuously disappeared into the Atlantic and the other deep oceans, cooling the world oceans and cooling the Earth. After that, Greenland got a huge glacier and the Pleistocene was coming ……. Again: H2O.
Ad 3). If the Arctic would be land and all continents would stay in present position, there would be no warming of the North Pole by ocean water and more ice and snow would be formed on the Northern Hemisphere. Snow and Ice would enhance the albedo (reflection of sun rays directly back into space) and the resulting low temperatures would cause a very low water vapor content in the air over large surfaces. A strong further cooling of the Earth would be the result.
2) has never happened as far as known. It might well result in a “snowball earth”.
1) Is also unusual. It probably happened in the late Triassic-Early Jurassic.
“more thermal energy can be radiated to outer space from the polar regions if they have a lower concentration of water vapor”
Why is this? Lower water vapor enables surface IR to radiate directly to space. However, more water vapor just causes IR radiation to occur from higher atmosphere. Energy loss should be same (assuming no difference in latitude circulation).
Higher water in forms of clouds can cool by albedo.
“water vapor became also abundant over the middle and high latitudes. Reducing the speed of heat loss to outer space”
And why is this? Simply more water vapor in the lower atmosphere does not significantly change warming, just because there are more IR absorptions and emissions. It is the distribution of water at altitude approaching the emission heights that counts. Water tends to condense (or freeze) in colder upper atmosphere, which actually lowers its warming effect compared to what it would be otherwise. Possibly the different temperature distribution over latitude changed the water distribution with height?
For the temperature at the surface the water vapor content at the surface (!) is the most important. Warm seas evaporate. Warm seas at higher latitudes evaporate at higher latitudes and create a high degree of moisture in the lower layers of the atmosphere at high latitudes. Nearly all absorption of radiation takes place in the lower atmosphere: see the article of H Douglas Lightfoot and Orval A Mamer as described in http://notrickszone.com/2017/07/31/new-paper-co2-has-negligible-influence-on-earths-temperature/
Therefore the quantity of water vapor in the lowest atmosphere is of the utmost importance for the surface temperatures.
And the present lack of absorption of infrared emissions at the higher latitudes is directly caused by the present low quantity of water vapor molecules in the air. See figure 1 in the link above.
In the same figure it is well visible that a slight rise in water vapor at the higher latitudes has huge radiation absorption effects. Much more radiation is captured by the water vapor, raising temperatures at the surface and preventing a direct heat loss to space.
For the enormous variety in water vapor over latitudes and the direct relation with (ocean) temperatures: see the link for Nullschool in my comment of June 15, 2018 10:31 am (above).
For this all, the system of redistribution of [by the oceans] absorbed energy and changes in that system are of the utmost importance for the whole climate system of the Earth. And for eventual changes in the climate system. They were during a Hot House climate state and they still are.
Adding more water vapor to the current lower atmosphere does produce more absorptions, but it is not the cause of atmospheric warming by water. What occurs at the water vapor emission height determines warming.
{Many persons seem to ignore this. IR absorption and emission in a gas occur on timescales like millisecond, and collisional energy transfer to other atmospheric molecules (at STP) on times of microseconds. Even with many absorptions and emissions, the total delay time for IR photons before escape is only a small fraction of the warming produced.}
If water vapor increases at the emission height, the emission height is forced upward into colder regions and by T^4 relationship IR emission from water decrease, until the atmosphere below warms to restore energy balance.
The warming produced per molecule of H2O vapor is considerably less than the warming per molecule of CO2. The main reason for this is the fact water frequently condenses below its emission height, and adding more water vapor produces a lesser increase in H2O at its emission height. (The tty comment in quotes below.) If H2O molecular density at its emission height does not increase, the emission height does not change, and little additional warming occurs.
Water is much more important than CO2 and CH4 in producing warming because H2O molecules are much more abundant and absorb across a broader IR wavelength. But, the condensable character of water renders the details of greenhouse warming by water much more complicated.
To tty: Latent heat is a major source of heat transfer from surface to atmosphere, but most of that energy transport is to altitudes below the H2O emission height.
Donb, the quantity of water vapor must be the controller for the heat loss by the lower atmosphere. I will explain.
Long wave infrared radiation is a function of temperature. The higher the temperature, the more outward (to space) directed infrared radiation.
If the outgoing infrared radiation is blocked by a high content of water vapor in the atmosphere, the net shortwave radiation (sun rays, incoming) minus the longwave radiation (infrared, outgoing) will show a yearly net influx of radiative energy: red in the following figure. The data show a high net influx for the wet tropics. The Sahara with her dry lower atmosphere, has a high incoming shortwave (solar) radiation, but nevertheless shows a net outflux because the outward going infrared is not blocked by water vapor. Visible in blue. The present poles also show a large outflow of energy: their very low atmospheric water vapor content does NOT prohibit the large disappearance of long wave radiation into space. See the map below with the yearly net radiation flow.
http://planet-terre.ens-lyon.fr/planetterre/objets/Images/bilan-energie/bilan-energie-fig01.jpg
Source; http://planet-terre.ens-lyon.fr/article/bilan-energie.xml
In cold Antarctica only 7.2% of the upwelling radiation is (in clear sky conditions) absorbed by water vapor as is shown in the following graphic by Willis Eschenbach. In the wet tropics the number is 32 – 40%.
Figure 3. As in Figure 1, showing the distribution of water vapor, but this time shown as the percentage of upwelling surface longwave radiation which is absorbed in clear-sky conditions. Contours are at intervals of 2%, highest contour is 40%. Contours omitted over the land for clarity.
Source: https://wattsupwiththat.com/2014/03/24/water-vapor-feedback/
There is a direct relation between the average temperature and the percentage of upwelling long wave radiation that is absorbed by water vapor. See the next figure.
Figure 4. Scatterplot of 1°x1° gridcell average atmospheric absorption and average temperature. The green data points are land gridcells, and the blue points show ocean gridcells. N (number of observations) = 64,800.
Source: https://wattsupwiththat.com/2014/03/24/water-vapor-feedback/
If something like a warm deep water production and/or a reversed circulation (as described in this post) is changing the temperatures at the poles, both the quantity of water vapor in the air and the percentage of long wave radiation that effectively is blocked will rise.
We find a high net emission of energy by the Earth when temperatures are low. Then there is a high loss of energy at the poles. Our present situation.
During Hot House eras, a lot of water vapor nearly everywhere over the surface prohibits a quick loss of energy, raising average temperatures. Leading to a Hot House State.
We find water vapor mostly near the surface. Higher atmospheric levels normally are colder and we know that colder air contains less water vapor. For that, a high content of water vapor in the lowest part of the atmosphere is the main factor in prohibiting the loss of energy by infrared radiation from the surface.
But, what is the exact role of water vapor? My take is the following. We must look at what happens at the molecular level. Of the utmost importance is what already is written by you above:
Donb: “IR absorption and emission in a gas occur on timescales like millisecond, and collisional energy transfer to other atmospheric molecules (at STP) on times of microseconds”.
WR: For a radiation absorbing molecule it takes only microseconds to transfer absorbed energy to other molecules, while re-emission would have taken a thousand fold more time: milliseconds. Before being ready to re-emit the absorbed energy, the energy absorbing molecule already lost that absorbed energy to other (mostly non-emitting) molecules by collisions with thousands of them. If this is what is actually happening (and I think it must be so), no re-emission will take place
The extra energy of the ‘energy absorbing molecule’ is conversed to ‘sensible heat’, dispersed over thousands of other molecules, mostly non-emitting molecules like N2 and O2. By the transmission of energy during collisions, the kinetic energy of the colliding molecules is raised, and so the temperature of all colliding molecules.
By that simple fact – the dispersion of energy over thousands of gas molecules – the whole process of outward energy transfer from surface to space experiences a strong delay. As a result of the absorption of energy, the atmosphere warmed. We measure that warming by measuring higher temperatures at our measuring points at the surface.
Important: if also re-emission would have taken place, the atmosphere would have had to deliver the needed energy and because of the loss of energy, the atmosphere would have cooled again.
What happens when the atmosphere after absorption has warmed? Instantly (!) cooling processes are activated. Warmer air results in a higher convection: energy is transported upwards into the direction of the level from where final emission will take place: high in the atmosphere. That process takes time, while non disturbed infrared radiation ( = non absorbed radiation) would have traveled directly into space with the speed of light.
Because of the above, water vapor H2O causes a delay in the loss of [part of the] by the surface of the Earth radiated energy. And for that, a higher content of water vapor is the cause of a higher temperature near the surface, while a lower content of water vapor causes a lower temperature at the surface because the lower content permitted a higher percentage of infrared energy to disappear into space.
Water vapor near the surface of the Earth acts like clothes on infrared emitting people. As you see in the picture below, the higher temperature of the skin emits more infrared radiation than the lower surface temperature of the clothes. Clothes prevent energy to pass quickly outwards. They delay the process of energy loss and are raising our body temperature. Water vapor, H2O, causes a comparable delay in heat loss in the lower part of our atmosphere.
The cause of the delay is the rapid transmission of absorbed energy to non-radiating molecules after absorption of infrared radiation. After that, the slower process of convection has to take place, resulting in a slower heat loss for the Earth as a whole. Raising temperatures.
” Water tends to condense (or freeze) in colder upper atmosphere, which actually lowers its warming effect compared to what it would be otherwise.”
That is putting it mildly! The condensation liberates the latent heat of vaporization at high altitude where it radiates away to space. This is actually the most powerful form of heat transport from the surface to TOA, considerably more important than IR radiation.
The polar regions receive no sunlight during the winter therefore no albedo effect from clouds but they do still send infra red radiation received from the surface back to the surface keeping the polar regions from cooling
One complaint is that you didn’t go over the Panama area closing, allowing draw up of the cold waters. When there is many areas for water to remain on the surface, the thermocline strengthens and warm water everywhere on the earth. Currently we have a strengthening thermocline. More warm water on the surface means more water vapour and a warmer world. When the ice ages were raging the wind on the surface pushed the waters and cycled up more cold water. If we had continuous water cycling through it would be a warmer world. If the world starts to get colder and it’s becoming an issue we could put in a very large channel through there, shouldn’t take more than 20 years if we really wanted to do it.
My takeaway from this is that hothouse / icehouse depends on the area of shallow seas near the equator. Interesting.
Great article Wim, illuminating as always.
And with an abstract too – all WUWT articles especially substantial scientific ones should have one.
Compared to the dominant radiative effect of water vapour, that of the trace has CO2 is insignificant. Any positive feedback between the two is a wishful fiction. CO2 plays no role in climate.
Suck it up and like it, it is what it is.
“Compared to the dominant radiative effect of water vapour, that of the trace has CO2 is insignificant”
WR: From the abstract of the above already mentioned Lightfoot and Mamer paper: Back radiation versus CO2 as the cause of climate change, http://journals.sagepub.com/doi/10.1177/0958305X17722790 :
“Water vapour content measured as the ratio of the number of water molecules to CO2 molecules varies from 1:1 near the Poles to 97:1 in the Tropics”
Logic says, that the only place where a higher quantity of CO2 could play a substantial role is at the coldest place on Earth (Central Antarctica, ratio 1:1), but over there nobody lives. Everywhere else H2O outnumbers CO2 by far or, as in the Arctic, any small temperature rise results in a huge rise of H2O molecuels that outnumbers any CO2 rise by far.
Plus, H2O is abundant at the surface and that is exactly where absorption of the surface emission of infrared radiation takes place. CO2 is by any rise of CO2 also more present at higher elevations up to 80 km, where water vapor lacks and from where [extra] CO2 is able to emit [extra] radiation into space.
For surface temperatures (!) it is water and water vapor, both H2O, that is important. Three simple but massive mechanisms do the work, as explained in the article above.
I think the Milankovitch cycles have an effect, also. But, yeah, plate tectonics opening or closing the polar regions, creating or eliminating large shallow seas are likely the main driver between the major climate modes of Earth.
Milankovitch cycles operate on timescales of millenia. Hard to see at shorter times. The Khmer Vert crow that each of the last 3 or 4 decades has been warmer than the last. But since the Holocene optimum 9000 years ago, every millenium has been colder than the previous. That’s the Milankovitch signature.
The Milankovich cycling is always there and has a noticeable effect on climate. This is well known to geologists who use the cycles for dating sediments. However it is only under icehouse condition that the cycling causes glaciation which vastly reinforces their effect by albedo feedback.
Wim,
You have presented a compelling hypothesis. There are, however, a few things that I want to comment on. You stated,”… these shallow and nearly enclosed seas produced huge quantities of deep warm water.” This seems contradictory. Did the warm water(s) pour out into the deep ocean(s) through narrow outlets? Then how were the “enclosed seas” replenished with new water? What was happening on the side of the globe opposite the continental plates? Lastly, what mechanism do you see that brings us out of a ‘snowball’ state other than major realignment of the continental plates?
Hi Clyde, yes, the shallow seas that were producing warm deep water had an outlet into the oceans like the nearly enclosed seas like the Mediterranean had:
(from: https://wattsupwiththat.com/2017/08/20/oceanic-downwelling-and-our-low-surface-temperatures/)
At Gibraltar there is a rather shallow entrance for the fresher Atlantic water. The deeper more saline water flows outward below the entering water, in the same time. A huge waterfall, some 100 times the Niagara falls or so tumbles down into the Atlantic. Germans used those contrary flows to enter and leave the Mediterranean without using the motor of their submarines. Upward: in. Down: out of the Mediterranean.
If there is an entrance/exit, the densest water will leave and fresher water will enter above the denser water. And as you see in the graphic, indeed the dense warm water pours down into colder (Atlantic) water.
Clyde: “What was happening on the side of the globe opposite the continental plates?”
WR: I suppose you mean ‘continents’. Everywhere else than in the nearly enclosed and/or shallow seas at 30N and eventually 30S, water density was lower than in the warm deep water producing areas. But, the above (in the post) is a simple model. In reality there is also intermediate water produced and it is even so that downwelling water does not need to well down to the bottom but may ‘stop’ sinking at every place where it meets her own density. So, reality is more complicated, which is one of the reasons that we must measure the behaviour of every cubic kilometer of ocean water. We even don’t know exactly how much cold water is going down in our own era, all are but ‘estimations’.
And your last question, how to get out of a possible ‘snowball earth’, I partly answered this question in my comment above of: June 15, 2018 5:45 am. Other things to think about is that, when more water is captured in ice sheets on land, the oceans become more saline, preventing a bit the formation of sea ice. As Ice shelves grow, continents are pressed down, which makes sea level rise which results in a melting contact between oceans and ice shelves. As precipitiation is low because of the low temperatures, sublimation will play a larger role: the direct evaporation of water from the ice. It will bring dust to the surface of the ice, diminishing albedo. Also, volcanism has played a larger role in previous times, another factor. And as oceans stop transporting saline water to the poles, that will be another reason: no deep cold downwelling will take place. And more warm downwelling could develop, somewhere where waters became more saline. Therefore, the most important stays the repositioning of continents that whether caused extra volcanism and/or prevented cold deep water production or stimulated warm deep water production. As most times show warmer deep ocean water than we have now, the chance to continue a snowball Earth (if it ever happened) during a long time is not that big. And, as long as there are tropical oceans absorbing a lot of sun energy, the oceans themselves will not disappear. Which is something that is needed for a real Snowball Earth.