Reposted from the NoTricksZone
By P Gosselin on 27. August 2021
Summer snows hit northern hemisphere…
Many parts of Europe have not had much a of a real summer, having seen much cool and wet weather this year.
Days of snow forecast down to 2000 meters in the Austrian Alps
Today the Austrian site heute.de here reports “snow flakes have colored many mountain regions of Austria white overnight” even though we are still in the summer month of August. A low pressure system over Central Europe and is feeding cold air from the north into the Alps.
Heute.de also reports that last night’s mountain snowfall is not just an unusual one-day freak weather event, but that snow will be around over the coming days. “At least until the end of next week, the temperatures will hardly break through the 20-degree mark anywhere.”
“Winter feeling”
According to heute.de: “In large parts of the country, unsettled and cool weather will continue over the weekend. Especially from the Tyrolean lowlands to Mostviertel and Mariazellerland the clouds will dominate and rain will fall frequently. For the first time, winter feeling could arise again, because on the mountain peaks above 2,000 meters snowfall is possible again.”
The summers of 2019 and 2020 were particularly hot and dry across Europe, and climate alarmists boldly professed that the hot weather was climate change. But this year the alarmists have been silent.
“Big news” from Greenland
Meanwhile Greenland snow mass balance reached a “historic level for this time of year”, reported the European Institute for Climate and Energy (EIKE):

Source DMI.
These amazing gains are in addition to those observed in recent years. The tide has turned in Greenland. And this growth trend has accelerated in 2020 – that’s BIG news. This is how glaciers build up. This is also how ice ages begin.
UK had a year with virtually no summer, excluding 3-4 days of what might be considered to be ‘hot’ weather and that was it.
As Germany too, much rain, always cloudy, as the cooling years in the 70′ started.
Not sure where you got that from? Met Office says that if UK temperatures remain around averag for the rest of August then summer 2021 could be within the top ten warmest summers on record for the UK (starts 1884).
https://blog.metoffice.gov.uk/2021/08/26/notably-warm-summer-so-far-for-uk-but-not-for-everyone/
These are met office data
https://www.metoffice.gov.uk/hadobs/hadcet/cet_mean_est_2021
Met Office data for CET, not the UK.
So yo recon that Scotland, Wales & N. Ireland where it always rains, will make this UK’s summer warmest ever ?!
Don’t remember saying that? I linked to an article by the UK Met Office saying 2021 could be inside the top 10 warmest summers in the UK record. Whereas you said there was ‘virtually no summer’ in the UK this year, providing no evidence at all.
Could be ??? LOL
“… if UK temperatures remain around averag [sic] for the rest of August” – how many days left in August?
You linked to a blog, not the official news channel.
And you believe a (gov) agency that managed to be 100% wrong every year out of 6…..making statements & forecasts that were the EXACT OPPOSITE of what happened?
The met office might as well be a direct pipe from princess nutty in Downing street, that have become part of the continuous LIE package voted into the UK parliament.
hey with Bojo as mayor of London he managed to do the EXACT OPPOSITE of what he claimed he would do when elected….only problem being conmen in Met office can’t be kicked out or re-elected when they fail!
Uk summer this year 2 weeks of warm fine weather in July two days of hot weather, this last week of August warm and fine ,cold at night unusually cold, feels like end of September. So thats 3 weeks of what a normal person would consider summer weather.
Not a summer that I would call a summer, grass has been slow growing only one silage cut , farmers are making the most of this last week in August, not the best month for sugar content
As for the met saying ” Met Office says that if UK temperatures remain around averag for the rest of August then summer 2021 could be within the top ten warmest summers on record for the UK (starts 1884).,”
That to me sounds like a desperate attempt to say no global warming this year guys ,
The furthest you can be from the sea in England is 69 miles. CET data is representative for the entire country, it is tiny.
Where did he get that from. Probably like me going outside and experiencing the weather, very poor summer in the UK.
That’s like me saying ‘it was very warm where I live in the UK, therefore the whole of the UK was warm!’
South east England had below average temperatures, but Scotland and N Ireland have had way above average summer temps so far.
Here in Scotland the weather has been crap except for the odd sunny day.
Let us all pray for record snow in Glasgow in November.
With all the airports closed.
Amen
The average human has one testicle.
Actually, less than one as there are more women than men.
Even less, Australian politicians don’t have any.
You have no monopoly on that! Do you think either the President or Vice President of the US have any?
Isn’t the Met Office located in Exeter? Not in Kent, or Scotland, and not far from the Cornish Riviera?
What the Met office says and what their data say, are rather different in these woke politically correct COP26 days…
Does that go for UAH too? Warmest June over land areas between 20-90N since satellite records began. 2nd warmest July. Is Roy Spencer suddenly ‘woke’ (whatever that means)?
What happened before satellite records began?
Over land areas between 20-90N.
And to think you complained about someone else only talking about Great Britain. Hypocrisy to the max.
UAH?
UAH does global anomalies. Current through July.
Their anomalies for Northern Hemisphere are:
Warmest evah? Not even in alarmist delusions.
Massive misuse of ‘averaging’ by Slingo’s woke Met. office.
MET-Office data download site : https://www.metoffice.gov.uk/research/climate/maps-and-data/uk-and-regional-series
“Rank ordered” option, Region = UK, Parameter = Mean temp.
Their “sum” column is for “summer” (the “June + July + August” average).
sum : year
15.76 2018
15.75 2006
15.74 2003
15.70 1976
15.62 1995
15.38 1933
15.29 1947
15.29 1899
15.25 1983
15.15 2013
Unless 2021 reaches 8th place (15.3°C) it won’t even beat the 19th century’s “record high” …
… and it’ll have to get into the top three to beat the 20th century …
Mark,
Thank you.
I note, from the figures you gave, that the warmest three years are all less than one-sixteenth of a degree warmer than 1976.
No doubt temperature readings are now taken and recorded to the nearest thousandth of a degree . . .
Auto
1.003 times smarter then the smartest rock.
And that third digit after the decimal is completely meaningless, with the hundredths not far behind.
Same for Portugal. This year the global worming caused cold weather here…
It has been cool in northern Portugal, not very summery at all. Last year was also on the cool side. But more alarming than a coolish summer is that we got freezing temps along the coast in the winter! Night temps of 0 C and below, are simply not done here!
Coastal night temperatures rather cold… not often, but not extreme…
I always lived in Lisbon or its neighbourhood. until ca. 50 years ago I remember a few days when lakes and fountains in Lisbon public gardens were covered with a layer of ice, clear as glass, early in the morning. In the last half century I’ve been living in the best climate in the world (joking: I live at Oeiras), known by its amenity all over the year. Very seldom we have extremes, though we have seasons that are colder, or hotter, or wetter, than usual. We got a very shy snowfall twice and, as far as I remember, no July/August was as cold (better to say, “less warm”) as this year’s.
In my professional life, I had to go very often (sometimes, everyday) to several places in a range of 150 km from Lisbon to the north, mainly in the range of 30 km from the coast. I remember reaching my car to return home at around midnight and having its windshield covered with ice in some years. I have this experience, which prevents me from a common mitake of the people who live in urban heat islands: there, the cold weather is not as extreme as it really is, that is to say, a few km outside the big cities. (But the hot weather there usually tends to be hotter than outside).
CET Daily Maximum Temperatures degrees C 1st June to 27th August 2021
CET only covers, as its name suggests, Central England. The UK as a whole has been much warmer than average this summer. Northern Ireland set 3 consecutive daily record max temperatures over a 5 day period in July. Scotland has also been much warmer than average this summer.
And one 3 day period, unlike a swallow, makes a summer?
Whatever happened to ‘weather, not climate’.
And ‘records going back less than a hundred years mean diddly squat’
The point being made is that the UK has had a warmer than average summer. In some cases record breaking warmth. UAH satellite data show land areas 20-90N as the warmest on record in Jun, second warmest in July. Yet because it was a bit cloudy in some places there’s a new ice age starting??
Listen to the farmers and crop growers. They will tell you just how the summer was.
Besides that, 5 days out of how many summer days total make a record hot summer?
Nobody is saying there has been a ‘record hot summer’. What the Met Office is saying is that average summer temperatures in the UK have been much higher than normal and may even be inside the top 10 warmest since their record begins in 1884. This flies in the face of claims made by some here that the UK has been colder than average this summer. That’s all.
That you griff? Lying again?
“What the Met Office is saying is that average summer temperatures in the UK have been much higher than normal and may even be inside the top 10 warmest since their record begins in 1884”
NO, the Met Office is saying the climate is very stable, here’s 249yrs of Met Office data. the blue line is 2021 …

What is “normal”? Temperatures in the early 19th century? late 18th century, 5th century, 1st century, 1st century BC, 25th century BC?
You’re talking bollox….. what about the freezing delayed late spring and early summer in MAY??
This year is COLD. I don’t care what happened in June!
Heard of “flaming june”?
Ok, “close to a record summer”, how does that make any difference. And, “may be in the top 10” doesn’t yet eliminate the chance that it may be a record!
One of the problems with averages is that a couple of outliers can shift the mean significantly, in contrast to a mode or median. People probably subjectively perceive a mode for their assessment of weather.
Making averages and drawing straight lines encompasses the entire range of climatologists’ math skills.
Lately, it seems that some have added software to add Loess fitting to widely scattered points on a graph.
Cool!
I’ve been all around the UK this Summer. Take it from me: it’s been rubbish.
Not in Wales its been cool with little crop able grass till late July late August, 3 days of so called record breaking temps in NI do not make a warmer than average UK summer, your talking nonsense, a apologist for no global warming this year,
Edit, as for grass growing however much fertiliser, slurry we have put down its barley had any effect till late July when the right combination of warmth and moisture have seen a increase in grass growing, its been a cool summer in the farming world , with rain and not much warmth , the cows were given supplements till well into June.
No, not in Wales. In the UK as a whole.
Where? Just where? You’re posting nonsense.
You can’t even reply in context to your own post, your playing playground games distraction.
So far we’ve established various parts of the UK, for example Wales Central England (I can confirm that) and parts of Scotland (as confirmed by my brother), have had cool summers. I would say this has been similar to summers forty years or more ago. Dull, not much sun and no hose pipe ban.
For the average to be warmer than normal some places must have had a very warm summer. Where are they?
hose pipe ban=watering restriction.
Looked it up, so don’t need clarification.
Thanks! That totally threw me.
It’s been especially warm this summer in the Sierra foothills of eastern California. Does that help?
In the Pacific Northwest of the U.S. it was very hot the end of June and first part of July. Now — not so much. In fact the Canadian Geese are already bestirring themselves for flying southward much earlier than normal.
Maybe Trenberth’s heat that was hiding in the oceans escaped our planet for outer space, now leaving us much cooler!
Far too “general” re the Pacific Northwest… I am intimately familiar with Stevens County in WA. State, and SINCE THE END OF FEBRUARY 2021, our twenty acres in the hills has received almost exactly 2-tenths of an inch of precipation… that’s six months and counting (for those of you in Rio Linda). Along with that, the (constant) temperatures have been HOT! Only very recently have daytime temps been in the 80’sF. rather than in the 90’s and on into the 100’s. There… doesn’t everyone feel better?
Uh… you’re forecast for 85 today, 81 tomorrow, and then back to the 70s. Hot summer, yes. But not baking hot.
There’s no question that you’ve partaken in the serious hot-weather the PNW got. But accuweather has you day-by-day for the whole 2021 summer, and… it’s not been steady heat.
Cry does include Heathrow!
The Met Office claims are based very dodgy data
CET is the only long term record there is from the mid 17th century. If you say central England, that implies only the English Midlands, when in fact it is a triangle from London to Bristol to Lancashire according to the Hadley Centre. Also why is it strange that some areas have experienced warmer than average temperatures, by definition there will be some areas where it is cooler than average and others where it is warmer.
“by definition there will be some areas where it is cooler than average and others where it is warmer.”
Nope. “Average” is Climatalogical average – a 30 year period, not daily average.
2020 compared to the last 30 years, the warmest in that 30 year period.
Oh look, there’s Allan Macrae’s cooling, it’s begun, in Antarctica, ok, on a tiny patch near Antarctica. And doesn’t the North Atlantic cool patch show up well these days as, um, as reassuringly unwarmed.
How convenient! 30 years does not a climate make. 30 years is the minimum to define a significant change from the previous 30 years. Why don’t you compare it to the last 150 years to see if there were comparable periods?
In other words if the previous 30 years were cool, of course the current 30 years might appear warm. That doesn’t mean the “climate” has changed. It means there may have been random temperature variations whose cause is currently unknown.
Wouldn’t 3 consecutive daily record max temperatures be over a 3 day period? It sounds to me like you are mocking the English language to make your alarmist point.
“Scotland has been much warmer than average this summer”
Balls.
I live here. It’s been 5-7 deg C cooler than “average” for August.
My mum grows tomatoes every year. Usually she has masses to give away. This year none of them ripened. Lots of courgettes mind you.
I do a lot of off-road cycling; 80-100 miles a week. Tracks which are bad in the winter have remained bad all summer. Horses continue to churn bridleways up when normally they would be rock hard.
It’s been very wet and colder than usual in the SE of England.
There has been a dearth of various fruits this year, raspberries are currently more expensive than steak. We’ve had few on our canes at home. Tomatoes are sparse, despite being in a greenhouse. Strawberries have been relatively plentiful as has rhubarb and courgettes. This is in the East Midlands. We had an early warm spell and then it was cold in May which basically put the garden back a couple of months.
Here in N E Wales tomatoes (in Greenhouse) only just sparsely appearing and even been able to go three weeks without mowing the lawn!
We had a few warm days in May and the odd hot day now and then since but cold nights for most of the summer.
But sly news and al ja beeba insist its the warmest evah…..
Same here in Ventura – we still have “June Gloom”, and it’s really not even pushed 80 much at all. Low-mid 70s every day, about 5 deg cooler than normal summers.
Earth started natural cooling circa 2020. Told you so, 19 years ago. Nailed it.
See Electroverse.net for hundreds of extreme-cold events worldwide.
Global warming alarmism is a 50-year-old fraud – wolves stampeding the sheep.
Regards, Allan
In 2002, co-authors Dr Sallie Baliunas, Astrophysicist, Harvard-Smithsonian, Dr Tim Patterson, Paleoclimatologist, Carleton U, Ottawa and Allan MacRae, P.Eng. (now retired), McGill, Queens, U of Alberta, published:
https://friendsofscience.org/assets/documents/KyotoAPEGA2002REV1.pdf
1. “Climate science does not support the theory of catastrophic human-made global warming – the alleged warming crisis does not exist.”
2. “The ultimate agenda of pro-Kyoto advocates is to eliminate fossil fuels, but this would result in a catastrophic shortfall in global energy supply – the wasteful, inefficient energy solutions proposed by Kyoto advocates simply cannot replace fossil fuels.”
Allan MacRae published in the Calgary Herald on September 1, 2002, based on communication with Dr Tim Patterson:
https://wattsupwiththat.com/2009/01/10/polar-sea-ice-changes-are-having-a-net-cooling-effect-on-the-climate/#comment-63579
3. “If [as we believe] solar activity is the main driver of surface temperature rather than CO2, we should begin the next cooling period by 2020 to 2030.”
MacRae updated his global cooling prediction in 2013, based on cold events that occurred starting circa 2008 near the end of Solar Cycle 23:
https://wattsupwiththat.com/2013/12/02/study-predicts-the-sun-is-headed-for-a-dalton-like-solar-minimum-around-2050/#comment-1147149
3a. “I suggest global cooling starts by 2020 or sooner. Bundle up.”
________________
THE REAL CLIMATE CRISIS IS NOT GLOBAL WARMING, IT IS COOLING, AND IT MAY HAVE ALREADY STARTED
By Allan M.R. MacRae and Joseph D’Aleo, October 27, 2019
https://wattsupwiththat.com/2019/10/27/the-real-climate-crisis-is-not-global-warming-it-is-cooling-and-it-may-have-already-started/
The 50-year-old climate fraud is an unscientific falsehood, a scam concocted by wolves to stampede the sheep for political and financial gain.
Here is the evidence.
A key test of scientific competence is the ability to correctly predict – and for 50 years the global warming alarmists have been consistently WRONG in all their very-scary global warming predictions.
Following is the dismal predictive track record of the global warming gang – A LITANY OF CONSISTENT ALARMIST FAILURE.
Evidence:
CLIMATE CHANGE, COVID-19, AND THE GREAT RESET
A Climate, Energy and Covid Primer for
Politicians and Media
By Allan
M.R. MacRae, Published March 21, 2021, Update 1e published May 8, 2021
https://thsresearch.files.wordpress.com/2021/05/climate-change-covid-19-and-the-great-reset-update-1e-readonly.docx
Excerpt:
Rode and Fischbeck, professor of Social & Decision Sciences and Engineering & Public Policy, collected 79 predictions of climate-caused apocalypse going back to the first Earth Day in 1970. With the passage of time, many of these forecasts have since expired; the dates have come and gone uneventfully. In fact, 48 (61%) of the predictions have already expired as of the end of 2020.
Climate doomsters have a perfect NEGATIVE predictive track record – every very-scary climate prediction, of the ~80 they have made since 1970, has FAILED TO HAPPEN.
Fully 48 of these predictions expired at the end of 2020. Never happened! Never will!
What are the odds at 50:50 per prediction? 3.6*10^-15 = 0.0000000000000036 That is one in 281 Trillion!
There is a powerful logic that says no rational person or group could be this wrong, this utterly obtuse, for this long; they followed a corrupt agenda, and they lied again and again.
The ability to predict is the best objective means of assessing scientific competence, and the global warming alarmists have NO predictive track record – they have been 100% wrong about everything and nobody should believe these fraudsters – about anything!
HISTORIC SNOWFALL HITS SOUTH AFRICA, RARE SNOW BLANKETS CHILEAN DESERT, “DISAPPOINTING” TEMPS BESIEGE EUROPE, LA NIÑA WATCH ISSUED, + CME UPDATE
August 30, 2021 Cap Allon
A number of South African towns, such as Drummond and Killarney, are reporting their first wintry showers (sleet and snow) in recorded history…
Looking ahead, much of the South American continent should brace for additional waves of late-season cold. These September freezes will impact already devastated crops in the continent’s key growing regions, Brazil and Argentina. Looking ahead, much of the South American continent should brace for additional waves of late-season cold. These September freezes will impact already devastated crops in the continent’s key growing regions, Brazil and Argentina.
Cool weather is setting in across central Europe now, said BBC Weather’s Chris Fawkes, “and temperatures are disappointing for August, with only 18 degrees Celsius (64.4F) in Berlin and 16 degrees Celsius (60.8F) in Copenhagen.” This cool-down is actually forecast to intensify as the week progresses. By Thursday, much of central and eastern Europe, as well as the Iberian Peninsula, will begin copping fall-like temperatures. By the weekend, eastern Europe is set to suffer temperature departures some 16C below the summer norms,
And if we follow that mass of polar chills eastwards, we see that a large portion of transcontinental Russia will also be affected. As will Kazakhstan, by Sept 11.
The summer growing season has been cut short, just at the intensification of a Grand Solar Minimum foretells.
The Climate Prediction Center has issued a La Niña watch for November 2021 through March 2022. A strong La Niña event arriving in line with the historic drop in solar activity we’ve witnessing of late will only intensify the global cool-down documented since 2016–with Earth’s average temperature down some 0.7C since then:
I think this Winter in Europe, Asia and North America will be very cold, and my following prediction from 2013 will begin.
Extreme cold events are already happening in the Southern Hemisphere and, to a less extreme extent, in the Northern Hemisphere.
Regards, Allan
https://wattsupwiththat.com/2013/10/31/blind-faith-in-climate-models/#comment-1130954
An Open Letter to Baroness Verma
[excerpt]
So here is my real concern:
IF the Sun does indeed drive temperature, as I suspect, Baroness Verma, then you and your colleagues on both sides of the House may have brewed the perfect storm.
You are claiming that global cooling will NOT happen, AND you have crippled your energy systems with excessive reliance on ineffective grid-connected “green energy” schemes.
I suggest that global cooling probably WILL happen within the next decade or sooner, and Britain will get colder.
I also suggest that the IPCC and the Met Office have NO track record of successful prediction (or “projection”) of global temperature and thus have no scientific credibility.
I suggest that Winter deaths will increase in the UK as cooling progresses.
I suggest that Excess Winter Mortality, the British rate of which is about double the rate in the Scandinavian countries, should provide an estimate of this unfolding tragedy.
As always in these matters, I hope to be wrong. These are not numbers, they are real people, who “loved and were loved”.
Best regards to all, Allan MacRae
“Turning and tuning in the widening gyre, the falcon cannot hear the falconer…” Yeats
Not sure on that one? Scotland and especially the west drier and sunnier than average. Temperatures about average though😉
Eek! I’m off to a conference there at the end of the month, better pack some winter woollies and a brolly.
And your skis.
No summer in Belgium,Holland and Luxembourg this year either.Well below average for nearly 2 months now.
UAH_TLT data doesn’t specify Europe, but their ‘NoExt – Land’ data covers land areas between latitudes 20N-90N. Both June and July 2021 had well above average temperatures for that region, according to UAH. In fact, at +0.68C above the 1991-2020 average, June 2021 was the warmest June on record over land in that region. At +0.67C above average, July 2021 was the second warmest July.
https://www.nsstc.uah.edu/data/msu/v6.0/tlt/uahncdc_lt_6.0.txt
So if some land areas over Europe have had cooler than average conditions so far this summer, then obviously this has been more than offset by much warmer than average conditions over land elsewhere within those latitudes. If UAH is to be relied upon, that is.
Exceopt it hasn’t been. The records are are all single day single locations in July. The average has been lower.
Whatever happened to weather is not climate?
And 0.67°C above average is well within error bars and 2 sigma. Cant read anything into it anyway.
You’re asking me that in a comment to an article that suggests August snowfall in the Alps is the prelude to an Ice Age?
Your misleading again ,were as the article does state “This is how glaciers build up. This is also how ice ages begin.” Which is a correct statement in no way did the article imply this years early build up in August is a prelude to a ice age, prelude was a word you added to make it appear the article was inferring this.
Barack, is that you, throwing out the old Red Herring?
No it wasn’t the second warmest july,stop following the narrative and actually listen to people who live in these places and experience it for real.It has been below avg for 2 months in the “lowlands”,with a few days of on or above average temps.Like i mentioned Belgium,Luxembourg and Holland have been below average for months.Seriously stop trying to change reality with their crap data sets who are doctored into oblivion.
UAH6 has its long term (42 years) average at 0.14C/decade, a period of significant growth in atmospheric CO2 concentrations. Even assuming all warming is manmade, we are looking at extremely minor increases in global temperatures in the future consist with increased trends in the past. I don’t follow short term UAH6 ups and downs.
0.67 degrees above average? I defy you to notice a difference that small. It’s a miniscule difference.
This is just getting silly.
Agreed. It’s as silly as presenting a single “average” number covering a large area, or the globe.
You pick the warmest anomaly on the month of July 2021 line, make extraordinary claims about what it represents and completely ignore that the anomaly has many higher anomalies in other months for the same location.
You also ignore that the anomalies for NOEXT Land and NOEXT Ocean anomalies are +0.26 and +0.03 . One wonders what was averaged into that NOEXT +0.67?
It worth pointing out that while your cherry picked anomaly was +0.67, the Globe is +0.2 and the Northern Hemisphere is +0.33.
Both locations temperature anomalies are far lower than many of their preceding temperatures.
Warmest evah? Absolute BS.
All specious bafflegab.
You cherry picked and spouted nonsense and ended up with a meadow muffin instead of a cherry pie.
Do you have the UAH data for 1930 through 1978? That’s what you should be looking at. “Warmest on record”. When the record only covers half of the weather cycle, it’s not really useful.
In the UK we have seen high twenties but nothing so high as 2020’s thirty six centigrade. Nights have been much, much cooler and the hotspots moved to parts of Scotland in August. It is typical weather for the British Isles with the range of highs to lows for summer 2021 being very similar to temperatures in the 1960’s.
What I have noticed is the UK Met Office appears to be spiking both high and low temperature forecasts by a few degrees above those offered by other weather record providers … is this a new trend in manipulation of people’s minds as in it’s hotter than you think.
Yes. Been happening for some time. The uber record temp in Cambridge – 20 miles away – was recorded by local airbases and indeed Cambridge airport as somewhat lower. On the rural airbases significantly lower
The temperature gauge in question is deep in the urban area and very accessible to the public. Cambridge is full of climate activists.
UK Met office is governement funded and toes the political line.
That sneaky MagicMolecule™️ is very clever. So Don’t be fooled, climate science says all conceivable outcomes are attributed to The MagicMolecule™️. It’s science.
Don’t be a science denier!
Ah. A fellow Dilbert fan.
Groundfrost end June and early July, same Alpine snow, same mid/end August in Germany, even 2m frost the last days in eastern Germany, snowstorms down to lower than 2k m, where the warming is hidden, causing so much damage ?
Why doesn’t CO2 it’s work as always claimed to be responsable ? 😀
Back in January of 1987 I flew to Innsbruck, Austria, for some cross-country skiing through the Alps. Instead of snow-capped peaks I was greeted with green everywhere and daily temps well above freezing. Even in Munich, exiting the airport, the time/temp sign announced 22. That sounded great until I remembered it was Celsius and actually quite warm, just like Portugal this summer…. Back in the USA, JFK Airport was closed by snow and Steamboat Springs was experiencing ideal skiing. Weather, all weather…but a year later Hansen was proclaiming disastrous global warming on the way.
That’s a frequent weather phenomenon here in Austria called “Föhn”. If bad weather fronts approach the Alps (from North or South) the clouds get blocked by the mountains and offload their load as snow or rain. The condensation of the precipitation sets energy free, heats the air/wind up and on the respectively other side of the mountains by going downhill the heat-up effect of the wind even increases. So you have poor/snow weather on one side of the Alps and dry warm air on the other. Some times this “Föhn” effect ist really strong and the temperature is jumping in the middle of the winter from freezing temp to +15°C-+20°C over night and melting away the snow quite quick (dry and warm air is a snow eater). Can be some big disappointment for kids, if there was snowfall some days before Xmas and then 2-3 days before Xmas Föhn is coming spoiling “White Xmas”. This effect is very well known and even electric hair dryers here in Austria are commonly just called “Föhn”.
But nowadays all ski ressorts are equipped with plenty of snow cannons. So a let-down as you had it in 1987 doesn’t happen anymore. Especially not in Innsbruck/Tyrol which is the hotspot for winter tourism.
Foehn (Austria) and Mistral (France) are warm katabatic winds, aka downslope or falling winds. The heat spike in Canada this summer was caused by a combination of a blocking high, in itself good for a warm spell, and a katabatic wind from the Rockies, adding another 10 degrees to that. The event disappeared as abruptly as it arose.
Mistral can be very cold.
That’s what I thought. When I lived in the south of France, the mistral heralded the start of winter. It tends to loosen a lot of small branches, which are great for kindling, so we collected as much as possible.
Hi Ed. I think you confused something. You are right about the Föhn-effect also occurring in the Rocky Mountains -> there it is called Chinook
But Föhn and Chinook are no katabatic winds, they are rainshadow winds and warm. Katabatic winds (like the Mistral) are cold winds, driven by gravity (heavier cold air pushing down).
In 1342, the biggest evvah flood afflicted central Europe. 1342 marks the beginning of te Little Ice Age, also marked by the global Plague pandemic.
Just sayin…
Calm down. One swallow does not a summer make and one year does not an ice age awake.
Tis ye weather. No climate be it be.
All ice ages start with a single snowflake that doesn’t melt.
Yes, a cooler late summer in parts of N Europe and at higher elevations… but that doesn’t mean we have an ice age coming or that this is unusual weather…
But earlier heatwaves across Lapland, E Europe and Russia, Spain through to Turkey, 40C plus, new records, a truly extra ordinary rainfall in Germany, in line with other recent hotter summers and rain events, THOSE are the real pattern. The rest is just weather.
Yes, cold is hot and the climastrologers predicted this except when they didn’t and RAIN!!! OMG sometimes it rains except when there is a drought …and…anyhow…
If the grifter did not exist we would have to invent him just for comic relief,
ain’t that the truth!
The real pattern have been, years of dry weather the last 3 years, now a very wet year with 1 summer week, can’t see a real trend, weather changes as it always did.
Telling us what is usual weather and what is not show us that you are full of bias and is not more than laughable 😀
You always don’t talk about about cold records, the actual in the SH, the last winter and early spring in the NH. Your narrative is sooo laughable 😀
You are so wimpy in climate/weather subjects, unbelievable.
Not hardly! It may be “extra ordinary” in the context of recent years or even your lifetime, but has been exceeded many times in history. Once again, you are seeing what you want to see.
“THOSE are the real pattern. The rest is just weather.”
HaHaHaHaHaHaHa
What a dipstick comment. When one place conforms to your criteria it’s climate, when it doesn’t, it’s weather.
Do you even realise how st00pid you appear to everyone?
Appropos
He does and he likes it. He’s a martyr of the cause.
Don’t forget the tsunamis griff!
Over 380 extreme, once-in-a-century, events occur in a statistically average year. The fact your list is so short shows climate is getting milder. If CO2 is the cause, than we need more of it in the atmosphere.
You’ve been called on this lie before, griffter. The record high temp in all those places except Spain was set decades ago. Lapland, for example, in 1914.
You haven’t figured out that if you lie you’ll get called on it. Your reputation for lying is so bad that if you stumbled upon the truth no one is going to believe you.
Once again, griff declares that cold events are just weather, while every hot event is proof that CO2 is going to kill us all.
You’re a clown. Heatwaves in Spain, Turkey, and Eastern Europe are most common summer weather events.
So: anything hot is climate armageddon, but anything cold is just weather.
Griff, for the love of god, pack it in would you squire?
Griff is a nutter.
Only nutters keep repeating the same stuff over and over again to themselves.
It’s the first signs of dementia.
You forgot the /sarc tag. Nobody could be so stupid that they would seriously say cold is weather and hot is climate, especially to a group of people that understand weather and climate.
It’s not heute.de, it’s heute.at
The Anschluss ended in 1945.
For the interest of the other commentators. Here is the webpage of the Austrian Weather/Climate institute (ZAMG):
Especially the climate monitoring section: http://www.zamg.ac.at/cms/de/klima/klima-aktuell/klimamonitoring
Data ist available going back to 1961 with all possibilities to check and compare temperature and precipitation by annual average, seasonal, monthly and daily and by monitoring station. The stations marked as triangle on the map are situated on the top of mountains, the others in cities.
Yeah, recent days where quite cold. Stating -4.4°C in average for 27th of August compared to 1981-2010 average with some parts of Austria even -7.5°C below and this cool temperature already lasting since middle of August (with 4-5 warm days in between). June and July had summer temperature, but spring was also cold. Normally you can jump into the lakes here for swimming by the end of May, when they exceed +20°C but this year it was end of June. So far the average of 2021 is with +0.3 just a small amount over the average of 1981-2010 but clearly the coolest since 2010.
Quite an appropriate typo
Webcam Zugspitze
https://www.bergfex.de/zugspitze/webcams/c6130/
Where are all the people sun tanning, frozen under that blanket of snow?
“Melting” Greenland

“Melting” Greenland
You’ve posted surface mass balance graphs. How can you tell without looking at the total mass balance graph?
Krishna is correct. Greenland is losing mass through calving. It is not melting.
We have to offer a dictionary to Loydo 😀
Loydo doesn’t read, he only parrots back what the programmer injects into his “brain!”
At least a parrot can learn new things, a wind-up doll only has one line.
Ok then I agree with you, you are not a parrot
A dictionary where you see that “wächst weiter” means ‘is gaining mass’ or ‘is growing’?
As Javier pointed at: Greenland ice sheet is currently loosing mass, since glacier outflow (and basal melt) outweighs surface mass balance gains.
Read the Polar Portal pages where the graph is explained.
You mean: “As Loydo pointed at: Greenland ice sheet is currently loosing mass…”?
Javier says “It is not melting.”
“Read the Polar Portal pages where the graph is explained.”
Indeed. The SMB graph gets posted here every other day with the insinuation Greenland is not melting. Misinformed at best, but it confirms the bias so doesn’t get a second look.
You are incorrect. Greenland is losing mass through calving and melting.
SMB “does not include the mass that is lost when glaciers calve off icebergs and melt as they come into contact with warm seawater.”
Total Mass Balance

“The updated total ice mass loss trend for the GRACE period (May 2002-October 2017) is -282 ± 15 Gt yr-1. “
https://arctic.noaa.gov/Report-Card/Report-Card-2019/ArtMID/7916/ArticleID/842/Greenland-Ice-Sheet
“Melting” Greenland
You’ve posted surface mass balance graphs.
Weather is what happens at the surface.
Below surface in places like Greenland is geology, not climate.
And West Antarctica BTW.
He was disputing whether Greenland melts are you?
The NSIDC fixates on melt extent for some reason. Trying to figure out what useful purpose that metric serves. It certainly doesn’t inform anything about mass accumulation/loss, but it does (falsely) make it look like Greenland is experiencing anomalously high melting.
For those of us unfamiliar with “melt extent”, “%” of what?
I too am unfamiliar with the term and can’t find an adequate definition anywhere. I suspect it means area subject to melting or rain on a given day (how much or for how long I don’t know) and I suspect % means percent of Greenland’s land mass.
Area.
Much of the melt subsequently refreezes.
It can do so on the surface, or it can soak into the upper layers and refreeze, or it can drain down to the deeper layers and refreeze.
Melt is only lost from the ice sheet if it runs all the way to the coast, or evaporates.
This raises questions about the reliability of measurement extracted from ice cores. This isn’t the first period of time that widespread melting has occurred.
You guessed correctly in your last sentence.
Make of this what you will >>> Headline:”World winter barley yield record broken”
What I see is A Record being set by a wide margin, for a crop historically grown on Greenland- a place most especially noted for its balmy tropical weather
I do like this bit:
Quote:”The success came growing the KWS-bred two-row feed variety Tardis using 250kg/ha of nitrogen fertiliser, a five-spray fungicide programme and multiple use of micronutrient foliar feeds.”
How many see what I see in the last 3 words – how many see ‘Soil Erosion’?
PS Of course it will never happen= Admission of Gaia and that ‘she’ lives in all of us.
Because what those temperature graphs should be doing is averaging/weighting the ‘summer’ according to the number of people in whichever ‘climate affected’ region – the Population Region, not ‘Political Region’
Any good Data Miners out there, is anyone up to it?
Somehow I suspect ‘no’
Not for the lack a Data Miners but for the lack of Data
And who has got or not-got the Data good enough to do that analysis?
Answer my own, Wunderground does but otherwise the words ‘Lying By Omission’ spring to mind
edit to PPS
The farmers spray that nutrient stuff on ‘most everything round here.
Don’t imagine the reason the farmers do it has anything to do the insane number of mentally disabled children in the local village?
Are the people also ‘Nutrient Deficient’ – if so, Why?
We were having such a nice, pleasantly cool summer up here in the Midwest and then it just went sour and turned hot, like someone flipped a switch. Humidity levels went up, which doesn’t help at all and my brand new air conditioner has turned out to be inadequate to battle a heat wave.
So you guys over across The Pond stole all that nice, cool weather that made summer pleasant? And it’s snowing in Austria, too?
Could you just send it back over here where I live? I’m melting!!! Oh, well, it’ll end tonight, if NWS is on the money (and they usually are).
Here is a look at the flow which brings that heat to the north. … https://earth.nullschool.net/#current/wind/surface/level/overlay=total_cloud_water/orthographic=-84.88,39.74,2399/loc=-98.488,40.936
The blue curve shows the current season’s surface mass balance measured in gigatonnes (1 Gt is 1 billion tonnes and corresponds to 1 cubic kilometre of water).
The dark grey curve traces the mean value from the period 1981-2010.
The light grey band shows differences from year to year. For any calendar day, the band shows the range over the 30 years (in the period 1981-2010), however with the lowest and highest values for each day omitted.
http://polarportal.dk/en/greenland/surface-conditions/
Thats the surface, what about the total?
The high temperature of the Gulf Stream with the drop in temperature in the stratosphere will already bring heavy snowfall in Europe in autumn.
Yes, but what about Greenland’s total mass balance?
You have to go under the ice.
No you don’t need to scoot down a burrow-hole, you just need to post the graph of it. Oh @ur momisugly#$% it I’ll post it for you.
The surface mass balance graph is misleading. Greenland is experiencing higher precipitation but is not gaining mass.
Building up ice on the surface increases the ground pressure necessary for clalving.
However, calving is restricted to the coastline.
Thats the surface, what about the total?
Weather is what happens at the surface.
Below surface in places like Greenland is geology, not climate.
And West Antarctica BTW.
The total is that the ice sheet is between 1.2 and 1,9 miles thick, depending on location.
And it will stay that way.
Yes, three feet of slush isn’t much of an impact on 10,000 feet of ice.
Are you suggesting that there is no correlation between the surface area and the volume?
How does the climate affect anything below the surface without affecting the surface? Is there some kind of commando heat that sneaks below the surface and melts the ice? Loydo, you really need some education, not just a list of talking points.
La Niña in November will also provide snow in eastern North America.
“This is how glaciers build up. This is also how ice ages begin.”
Lol. Maybe next month.
Or actually maybe not for a few thousand years.
Heat content graph from Rhein et al., 2013
2013 ? 😀
Where is the relevance ? Any idea ?
What does the top graph show? The temperature of your families bowels since 1890? I don’t see a label that means anything. And don’t tell me they knew the world average temperature before 1900.
Sorry to break the news, Loydo, but: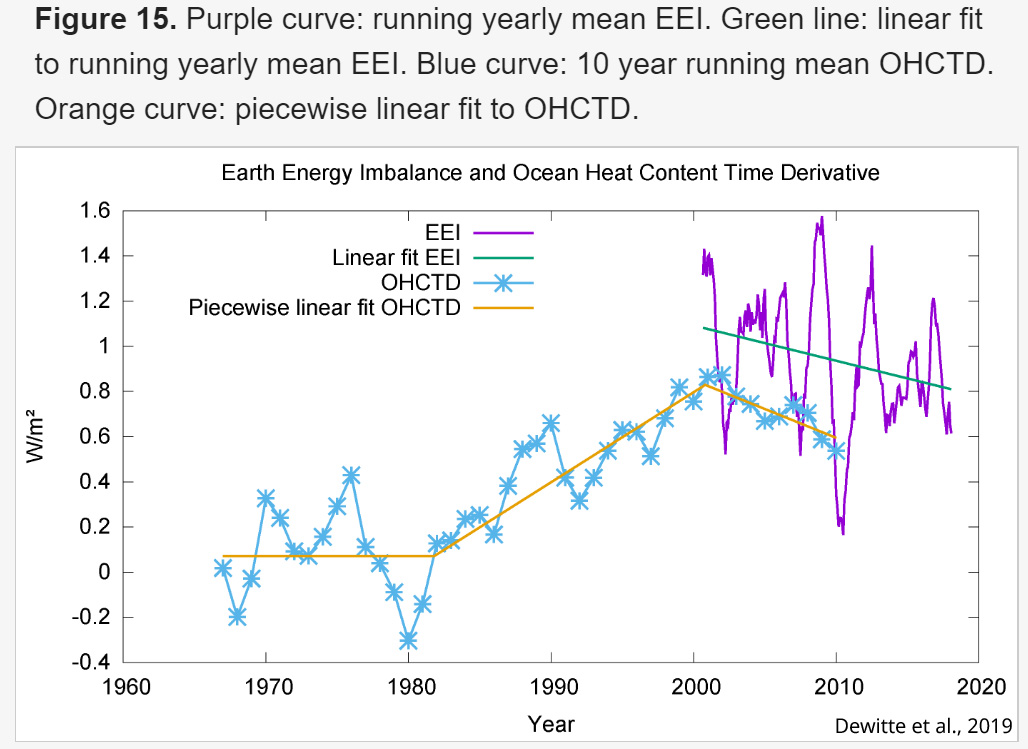
Ocean Heat Change Rate And Earth’s Energy Imbalance In DECLINE Since 2000
From Dewitte et al. 2019
Over the past 14 years I have been telling you all that the year 2000 was when I started to notice the jet stream tracks becoming more meridional compared to the zonality of the previous warming period.
Thats a brief, noisy period you’re courageously pinning your hopes to, I’m reminded of Monkton’s pause. However this is not even a pause – positive ERB and OHC anomaly since the early 80s. And a lot can happen in such a short time.
https://agupubs.onlinelibrary.wiley.com/doi/10.1029/2021GL093047
Oh, look, its waggled back the other way. Lets pin tour little Chihuahua tail flick onto the end of this graph for context.
OHC rise is accellerating and while it does atmospheric temperature rise will therefore continue to accellerate too.
Sorry to break the news, Javier, but: a dog’s tail is not the dog.
Please give the ocean temperature measurements upon which the OHC figures are derived. Thousandths of a degree C are always worth a hoot.
Your deluded. Javier’s OHC “measurements” above were fine while they were confirming your bias, now they aren’t – there a hoot. Here, I’ve indulged your delusion: the Ishii et al. (2017) data with error bars.
The light (dark) blue area shows the annual mean for the global integrals of 0 to 700m (700 to 2000m) ocean heat content relative to 1955, respectively. The dot-dashed lines indicate a 95% confidence level for ocean heat content above 2000m.
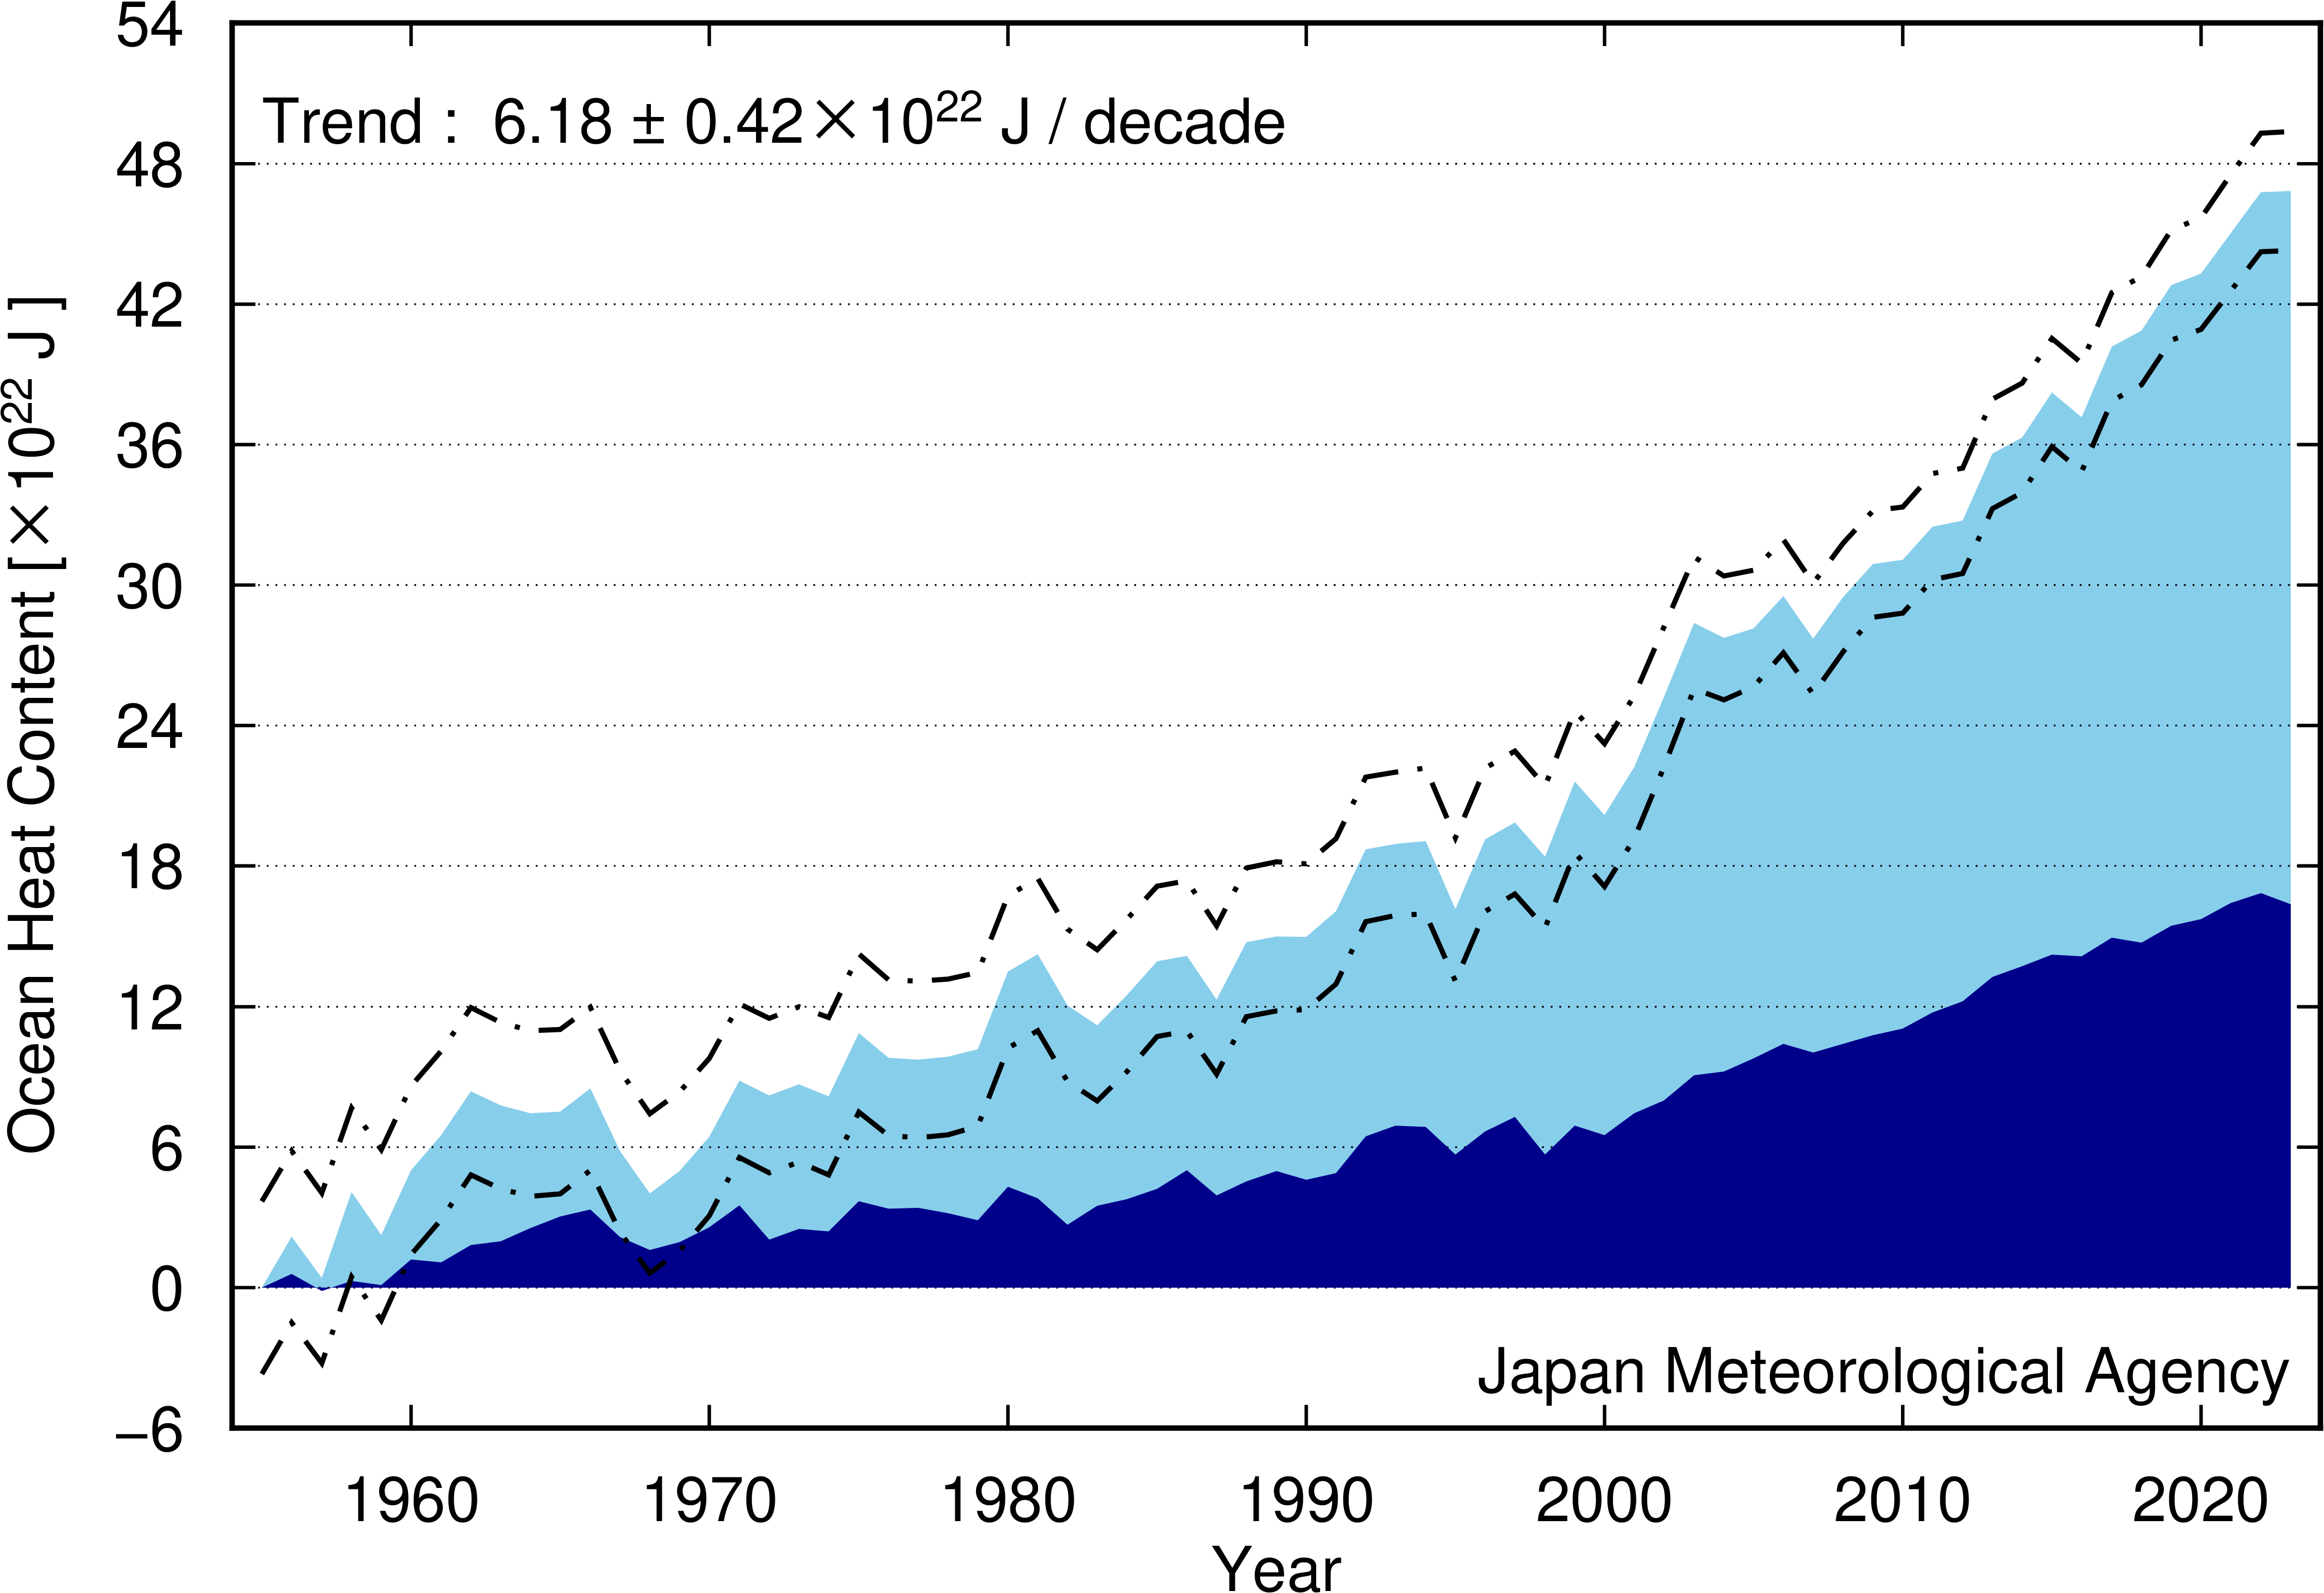
From here: https://www.jma.go.jp/jma/indexe.html
Go on, keep disputing the obvious trend.
JMA: “A rise of 0.020 ± 0.001°C per decade in the globally averaged 0 to 2000m ocean temperature accompanied the OHC increase.” Assuming continued warming, we could see an approximate 0.16C increase in deep oceanic temperatures by 2100.
Over an approximate 60-year period of generally rising oceanic temperatures (from natural and manmade causes) we see an equivalent centennial trend of about 0.20C, assuming a measurement accuracy of a thousandth of a degree C. Count me unimpressed.
BTW, 10^22 Joules aren’t much.
“an approximate 0.16C increase in deep oceanic temperatures by 2100”
Now instead of the average temperature down to 2km deep, what about surface? What will it be in 2100? Double that for land.
The average SSTs and land temperatures in 2100 will be about what they are today. If anybody says differently, make them prove it. It is fun watching people try to prove a future.
“Thats a brief, noisy period you’re courageously pinning your hopes to”
So are all the graphs you posted. Any “climate change” in a human lifespan is pretty meaningless. Just blips. You also can’t compare them to any proxies, because the proxies wouldn’t even catch such a short time period.
Re-lax.
The ocean heat content increased by 500% from 1980 to 2013? Seems like that would be palpable. It’s not.
I hate to break it to you, but until, or if, the absolute ice temperature exceeds the melting point of ice, there will be no loss at all. Therefore, the anomaly air temperature is not a good predictor of current melting.
Also, ocean heat content is a poor predictor of ice melt because ice melts at a specific temperature, not a particular heat energy level. The high specific heat of water means that the changes in water temperature as only a fraction of air temperature changes, and only significantly impacts the ice that is floating in the water.
The Arctic ice minimum is going to be one of the highest in the last ten years
That doesn’t sound nearly scary enough. If you want to make it sound really scary, try “The highest evah!”
However, you can’t because that is probably claimed by 2012 — 9 years ago. Even 2020 was much lower than this year. It appears that there may be a change in the trend.
OMG! At 0.56C/Century, in a hundred years it will be … 0.56C warmer!
Thats average SST. Its the dog. The atmosphere (the tail) gets flicked around much more, now marching towards 0.2C/decade.
Thats the average, some places its double that.
The bulk atmospheric temperature trend from 1979 is 0.14C/decade. With the ending of the latest Super El Nino, the trend could reasonably be expected to decline somewhat.
Where do you get the atmosphere “marching towards 0.2C/decade?” BTW, your “Thats [sic] the average, some places its double that.” requires a number of places to be much less than that.
It’s probably already 0.2C/decade.
According to NOAA’s 2020 Annual Climate Report the combined land and ocean temperature has increased at an average rate of 0.13 degrees Fahrenheit ( 0.08 degrees Celsius) per decade since 1880; however, the average rate of increase since 1981 (0.18°C / 0.32°F) has been more than twice that rate.
CO2 emissions are accellerating, SST increase is accellerating, where else can an atmospheric temperature rise go?
“…requires a number of places to be much less than that.”
Brilliant work. The point is warming is not homogenous.
And the average rate of increase from 1915 to 1945 was about 0.16C/decade, IIRC. Show me something unusual in the late 20th and early 21st Centuries; something different from the early 20th Century. Additionally, UAH6 42-year trend is 0.12C/decade over the oceans.
According to ARGO, SSTs are not accelerating. Do you even understand what accelerating means in terms of a temperature series? Get a grip.
According to ARGO? Are you quoting from https://argo.ucsd.edu/ or using a Mk1 eyeball?
The ARGO record, by itself, is a bit too short to say whether there is accelleration or not. But show me any other data record that doesn’t have a telltale upswing.
Looks linear to me. Anyway, OHC is absolutely unreliable before about the 1980s. Even since then, it is a crapshoot before ARGO.
It’s warmed up half a degree since the bottom of the Little Ice Age.
Now I’m terrified.
The sea surface has warmed that much in 50 years.
Magnificent, isn’t it.
Hilarious. Some people are totally disconnected from reality.
How do ice ages begin? Negative snow/ice balances? Did he say a positive snow/ice balance means an ice age is starting, or that a positive balance is a sign we would see in the early stages of an ice age?
Didn’t we learn anything from the Ice Age Cometh scare of the late 60’s? Twenty years of cooling and ice growth mean nothing. And we have, what? 6 years of modest (0.2ºC) cooling?
Considering that the main climate cycle is the 1000-year cycle, I guess we would need at least 750 years of cooling to know one glaciation is coming. Once we have that he will convince me.
I think you are being harsh.
He didn’t say glaciation is starting, just that this is what it would look like when it does start.
And it will start someday even though you and I and everyone alive today will never know for sure if and when it happens.
Which is completely opposite to what the scientologists say we are supposed to be seeing.
No, I am not. Alarmism towards cooling is not the answer to alarmism towards warming. Glaciations don’t start one year, not even one decade, probably not even one century. Glaciation is a very protracted process that takes several millennia. Talking about how ice ages start within the context of an annual weather discussion is ALARMISM in the first degree.
Ok, you are right in the specifics of course, but I disagree with the interpretation of the comment
Glaciations in the Northern Hemisphere begin with extreme snowfall, and that is now increasing year over year.
The FMI/GCW SWE Tracker is a product of the Finnish Meteorological Institute (FMI), based on GlobSnow snow water equivalent (SWE). It was developed as part of the GCW Snow Watch project. It illustrates the current Northern Hemisphere snow water equivalent relative to the long-term mean and variability. The current SWE Tracker is shown below. NOTE: The SWE retrievals can be unreliable in summer between approximately late May and early October. Therefore, the plots might not be updated during that period.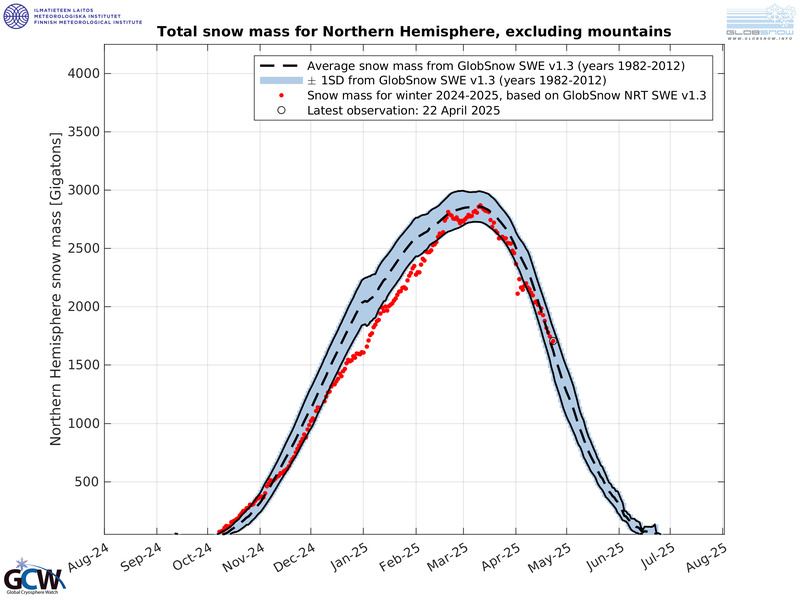
and ends with “extreme” melt.
http://wgms.ch/data/faq/_FAQ_RefGlac_Regional_Cum_MB.svg
Put it into perspective, Loydo. How many gt of ice are there in those locations? I’ll bet you wouldn’t even notice.
Ok so you noticed a trend in the data, well done.
Where did I say that?
Why don’t we look at a meaningful trend, say 20k years.
“How do ice ages begin?”
No one knows.
According to JAXA N. H. ice cover data as of Aug 27 2021 we now have 20 years of data for this date 2002 thru 2021
10 years have less ice cover and 9 years more ice cover.
https://moyhu.blogspot.com/p/latest-ice-and-temperature-data.html#ice
You can make it 10/10 2022 is going to be high
Although summer temperatures here in the UK have been above normal ie about 16.5
it has not felt that warm, mainly because of lack of sun, especially in August, I suspect cloudy nights
have helped push up the mean temperatures.
As a keen gardener, I will remember 2021 as a remarkable cold spring, especially April and May
Minimum temps for April were 1C , which was the coldest for over a 100 years.
On checking the warmest summers 1976 still ranks the hottest at 17.77C and 1826 the 2nd warmest
at 17.60
Snow in August in Austria? The IPCC will declare it the warmest August ever recorded.
“Extreme Weather” – the grifft that keeps on griffting. If it didn’t exist, they’d have to invent it.
Oh wait….
To Griff
EXTREME
“I don’t think that word means what you think it means”.
Inigo Montoya
InconTHievable!!!
Met Office failed to calculate the CET (Central England Temperature) properly for over 160 years, until few years ago when someone who post here under name Vuk did show them how it should be done, btw it was documented here on WUWT.
Link?
Hi Clyde, I’m a bit to busy to search WUWT but you are welcome to search WUWT Jan & Feb 2015 (vukcevic CET)
Here is copy of email I received, when I enquired why they did not contact me before or after publishing new data.
From: “…., Tim” <tim……@metoffice.gov.uk>
To: ‘vukcevic’ <vukcevic@……com>
Sent: Wednesday, February 4, 2015 9:52 AM
Subject: RE: CET annual data records
Dear Mr Vukcevic,
We have indeed altered the way we calculate annual-mean values of CET, so it is no longer a straight average of the 12 individual monthly values, for the reason you describe.
So, as you say, looking at the individual monthly values back to 1659, it will be seen that none of the values have changed. However, the annual values have all altered slightly, mostly in an upward direction.
At the same time, we have re-calculated all long-term averages in the same way, so that quoted annual anomalies remain consistent. This ensures that no artificial trends or discontinuities appear in our historical series.
Tim
Met Office never acknowledged it directly, but as you can see from the above admitted indirectly receiving my email (describing the method used) some time earlier in 2014.
They adjusted them “mostly in an upward direction”? Oops.
Good thing, too. Otherwise we’d still be freezing.
Stop being so scared of nothing.
Good engineer needs to know accurate numbers whatever they happen to show. I told them that fact that’s why MO wasted no time and re calculated all their records and published in just few weeks.
Ok I jested before. Well done that’s impressive.
I find it a little strange that I should get several down votes for asking for information. Perhaps it is my ‘fan club.’ Thanks for letting me know that I’m being effective enough to trigger an emotional lash-out. My efforts aren’t in vain if that is the best you can do.
Weather charts for north Europe and the Arctic show that throughout Europe’s “cold in July” cool summer, there have been continual cold air outbreaks from Greenland which have been depressing temperatures in north west Europe. This will continue into Autumn at least:
(5) Dry for the next 7 days, then potentially Low Pressure comes back in? 27th August 2021 – YouTube
The mountains west of calgary are white, month earlier than normal
Tropical cyclones (otherwise known as hurricanes or typhoons depending on location) are claimed to be examples of extreme weather caused by the only thing that causes anything in climate – CO2. (Despite the fact that a warmer world has less equator-pole temperature gradient and thus less – not more – thermodynamic potential energy but never mind that for now.) However another overlooked fact is that tropical cyclones cool the ocean surface due to the vertical mixing they induce. Cold deep water is brought to the surface. This mixing also fertilises the sea surface with upwelled nutrients, increasing plankton primary production. First year oceanography.
This new paper shows that in the last three decades, increasing tropical cyclones have (a) cooled the tropical sea surface by 0.05 C per decade and (b) increased surface concentration of chlorophyll a by 3.7 e-3 mg/m2/decade.
Looks like a negative feedback to me. As a result tropical SST is falling not rising and plankton primary production is rising not falling.
https://agupubs.onlinelibrary.wiley.com/doi/abs/10.1029/2021GL092574
Another recent study revisits two ocean sites where surface warming was prominent during 2003-2013, namely, the southeast Indian Ocean and southern Pacific Ocean. During 2013-2019 this warming has reversed to cooling:
https://agupubs.onlinelibrary.wiley.com/doi/abs/10.1029/2020GL090889
It’s looking increasingly like the recent warming phenomenon is a north hemisphere thing, driven largely by interhemispheric heat piracy occurring in the Atlantic, connected with the AMOC. But even that is weakening now.