Reposted from NOT A LOT OF PEOPLE KNOW THAT
AUGUST 27, 2021tags: extreme temperature, Extreme weather
By Paul Homewood

Discussion of “extreme temperatures” tends to revolve around highs rather than lows. In a warming world, high temperature extremes will inevitably become more common, just as lows get rarer. But is there any sign that the former will outweigh the latter?
In other words, are temperatures really becoming more extreme?
As far as this country is concerned, we can check out the Central England Temperature series.
ECAD provide a useful tool, which shows the number of days each year when temperatures were either below the 10th or above the 90th percentile since 1900:


https://www.ecad.eu/utils/showindices.php?vja6445tvtc64ahlbfhkdv5iog
As we would expect, the number of warm days has increased, and the number of cold ones declined.
When we add the two together, we find that if anything the trend has declined since 1900. The most extreme year was, by the way, 1947, with 1919 in second place:

Somehow, I doubt whether the Met Office will tell you this!
Probably could have been described more clearly.
“As far as this country is concerned, we can check out the Central England Temperature series.”
Met Office failed to calculate the CET (Central England Temperature) properly for over 160 years, until few years ago when someone who post comments here under name ‘Vuk’ did show them how it should be done, btw it was documented here on WUWT.
Just few weeks later on 1st of January at 00.00 hours all historic CET annual temperature data was republished using the correct method, without any acknowledgement of the change until an eagle eyed WUWT reader spotted difference and brought it to attention of the WUWT readers. Met Office has maintained the correct method of calculation since.
Good work Vuk.
Not surprising, given the corruption and bias of the Met Office and its equivalents in other countries, that amateur scientists are leading the correct analysis and prediction of climate.
There is NO real dangerous human-made global warming crisis. CAGW has been a leftist fraud for ~50 years.
“Met Office failed to calculate the CET (Central England Temperature) properly for over 160 years…”
Quite an achievement considering the CET didn’t exist 160 years ago.
Hadley seem to disagree:
That’s when the data begins, not when it was created.
I think what you have to consider is the method and accuracy of measurement in the 1600s and on, compared to today’s methods, they leave such room for error between the different technologies that it becomes meaningless. Pretty much the same as some modern, debunked theories on old temperatures. At some points, results from different methods are bolted together to give a specific result.
Other factors include station siting through the ages, location, elevation, environmental surroundings, skill of technician, condition of the equipment, regularity of data collection, etc. All introduce errors.
I judge by the real world. I mentioned earlier in another post on this thread that our central heating was still on at the beginning of June, and it was turned back on today. To me, that is a cold summer.
‘for over 160 years’ of data
May I remind you that the Met Office didn’t exist 160 years ago either.
Now you know everything you need to know. Have nice day.
It actually existed for 166 years. Now that fixed everything
https://www.metoffice.gov.uk/about-us/who/our-history
has anyone looked at the Armagh in Ireland observatory figures recently? or do they not count any more?
You mean England didnt have a center 160 years ago! What was it, a massive lake?
Let’s put all this in perspective.
In the Last 45 years we had only 5 months either July or August (but never both) exceeding by a fraction of a degree C, previously hottest month recorded in July 1783.
See graph attached below.
We do know that in the recent decades the HadCET has been ‘homogenised’, more traffic and more active airports near many weather stations.
All in all nothing to write home about!
I think only crazed warmshista are considering warmer winters as a global climate change disaster.
As perverse their arguments are, they can’t see that warmer winters need less heating fuel, good for poor people, and after all less CO2 emitted and that should please them, but apparently doesn’t.
In 1783 it was 0.6C below the line think that blows apart the nonsense touted by the Met office about warming being the criteria for hot days!
The world has warmed by about 1C since the end of the Little Ice Age. Big Whoop-De-Do!
You forgot the additional 1/10th of a degree Celcius making a massive 1.1 degree rise over 150 years, or three abouts, & as I’ve advised here a little while ago that makes an annual temperature rise of 7 thousanth of a degree per year since!!! Even bigger Whoop-De-Do!!!!!
The chart highlights the thermal capacity of the oceans and the influence of ocean temperature on England.
Since 1660, the ToA sunshine over London has increased by 1.4W/sq.m in April, 1.2W/sq.m in May but actually reduces 0.7W/sq.m in July and 1.4W/sq.m in August.
There is a good deal of thermal inertia in the oceans.
Would be interesting to look at November and December peaks.
The only thing that will convince the CAGW crowd that we can escape a burning hell on earth is the onset of the next Ice Age, wait for it.
And when there are indications that is occurring and they can no longer hide it with their temperature data “adjustments,” you can bet your last dollar that they will brew up another pseudo-scientific explanation of how THAT is our fault, too – and of course that it is our evil fossil fuel use that is the root cause.
Just like the last time temperatures were cooling for a few decades.
“Global Warm…ahhh we really meant climate change all along” Is all about creating the second hand harm that allows the central authoritarians to step in and take control. The justification being that their “experts” have determined that your behavior is deleterious to innocent bystanders.
It matters not the temperature. This is the children’s fable of Goldilocks without a measurement for just right. If it is too warm or too cold. If it rains too much or not enough. if the wind blows or dies. It is climate change and it changes because you are free to do as you please and the only way to get to “just right” is to turn over control to the Central Authority backed by experts aka Big Brother.
BTW if you get an itchy feeling they were cutting their teeth with COVID you should scratch that itch. The pandemic was a practice run for what comes next.
I think that they didn’t invent COVID. The Chinese might have, but it all looks like a bit of a copckup to me.
Of course once they realised that we would all be good little citizens and lock ourselves away for 18 months, they were quick to see the implications of that.
The pandemic was a practice run for what comes next.
What comes next?
You tell us. And Lloydo doesn’t think think we landed on the moon…yikes.
One of the greatest lessons philosophy has to teach, is summarised as ‘The Problem Of Induction’ .
Which stated simply says that there is a one-to-many relationship between what has indisputably happened and what might have caused it.
But that there is never any absolute certainty: Scientific ‘truth’ is a chimera. And whilst it is a convenient shorthand to regard scientic theories as descibing ‘facts, in the world’ , this is in the end extremely dangerous. Because it leads to the ability to tag anything as ‘science’ and then use the common misconceptions to render it then as inalienable fact, as real as the keyboard I am typing on.
If the general public understood this basic point of philosophy, no one could ‘believe’ that ‘science proves climate change’.
Marxists use this predilection of the human mind to confuse a point of view, or a model with the one and only truth, to beguile people into thinking along predetermined lines – by setting the stage, so to speak, whilst pretending that it is not the stage that is the issue, but upon which side one is of it.
In the climate change narrative, the unspoken stage is the extent to which human activity modifies Nature away from some supposed romantic idyll of nature before human existence, where only 99.999% of species became extinct, so as to focus on the 0.001% that have become so since humans appeared.
The salient features of this narrative are that
But the narrative isn’t there to solve the problems, it is there to place these issues as salient, because no matter what methodology is used to tackle the problems, it ensures that strong central government will be the agency of implementation!
What the Marxists are doing, in philosophical terms, is to mess with the public mind, and its metaphysics. If you are a dialectical materialist and an atheist, you have no rational grounds for making any moral distinctions at all! Without a God, what does it matter if man destroys the world, or the world destroys man? Yet the metaphysics of politcal correctness and the ‘woke’ and the ‘green’ mentality all rely on the assumption of overarching moral principles that ought to be applied. And no one ever questions why.
Marxism doesnt want to do away with God, it seeks to usurp God as moral arbiter, and put Marxist generated theories in it’s place. The faux concept of social fairness can be promoted to create discontent in populations when a moment’s reflection shows that someone who is e.g. born disabled is unfairly disadvantaged by nature. And no human being can ever put that right. It’s tough, but it’s real.
And sadly the success of science as an arbiter of relaible knowledge has been usurped by it, to generate an irrational emotional narrative – but apply to it, the reliability of science.
And even more sadly the antidote to this cynical manipulation of the public Mind, is going to come at the expense of public trust in science itself. Once science is seen to be not a revealer of truth but as simply a purveyor of models that actually work (as against ‘climate science’ as models that clearly don’t work, and social science as a purveyor of models that seem mostly to destroy social cohesion and move us towards centralised government, very successfully) then people are going to ask, and quite rightly:
‘But how do we know that any science is true?’
And the correct answer is, ‘we don’t, and worse, we can’t. BUT it works’.
That is, we have to educate the public from the insistence in believing in the Truth of knowledge, as passed down by techno-shamans from whatever passes from God these days, and educated it simply in its utility.
Unfortunately the techno-shamans – the scientists – dont want to relinquish this religious power. And the black magicians, who are now all employed in PR consultancies and marketing companies, don’t want to throw away their biggest tool either – the expert in the white coat who knows stuff that you don’t, and you’d better believe it!
Explanations are free and infinite in number. Explanations that might fit the facts are free and infinite in number. Even explanations that might fit the facts, are testable and when tested still fit the facts, are infinite! As are explanations that clearly don’t fit the facts at all!
The only way to discriminate between them and arrive – not at the truth, because the problem of induction prevents that – but at least of the elimination of explanations that don’t explain anything (“God did it”) or are clearly wrong (“the dominant cause of late 20th century warming is atmsopheric carbon dixide increases”) is public education, not in what to think, but in how to think.
Naturally the Marxists who overwhelmingly run the public education system have ensured that is not the case…
“Marxism doesnt want to do away with God, it seeks to usurp God as moral arbiter, and put Marxist generated theories in it’s place.”
I suggest that Marxism doesn’t want or seek anything at all. That it can’t want or seek anything at all. It’s insensate . .
And, that “God did it” CAN explain why you tend to “see” the world as you do in this regard. In this something seeks to usurp God as moral arbiter, manner.
Consider please, IF a Creator HAS informed us (for our potential edification), of our situation, our relative ignorance and our inherent “gullibility”, which you characterize as “the induction problem”: THEN we should be able to detect an Explanation for it, in the Information, which coincides with what we (as individuals) experience.
Which is to say, in this case, an explanation which “covers” your own propensity to “frame” your/our geopolitical predicament in terms of something seeking to usurp God as moral authority. You “know” of course, that an ideology cannot seek anything, but, I surmise, you can and do (essentially) run experiments on yourself, and can “see” that something in the nature of your overall intelligence system, leaves you (and others of like you), vulnerable to “falling” for an illusion (which can appear in our imagination, our mind’s eye, so to speak) that what we are attracted to/by, is good for us to “seek”, as though we are like God, and can rightly usurp God as our own moral authorities.
And, lo and behold ; ) in the beginning, in the garden, we see just such an explanation/exposition of that very something;
… “And the serpent said unto the woman, Ye shall not surely die: For God doth know that in the day ye eat thereof, then your eyes shall be opened, and ye shall be as gods, knowing good and evil.
And when the woman saw that the tree was good for food, and that it was pleasant to the eyes, and a tree to be desired to make one wise, she took of the fruit thereof, and did eat …”
“ suggest that Marxism doesn’t want or seek anything at all. That it can’t want or seek anything at all. It’s insensate . .”
Marxism is determined by what the Marxists want. And the Marxists see God as a competitor for power over the people. Therefore God must be eliminated and humanism substituted in its place.
Well, as there is no God (or Gods) that’s not much of a problem. God is already eliminated, by dint of not having existed in the first place! Seriously, you must get past these ridiculous Bronze Age fairy tales! And what exactly is wrong with ‘Humanism’? You know, what with us being Humans and all. You’ll be telling us next that Globalism is bad because we don’t live on a globe! Humans, living on a globe, no God – heresy, I tell you!
And we are to believe your claim that there is no God and never was, because why? Faith in your knowledge maybe? Let’s see your concrete proof AM.
You have the liberty to have your faith that there is no God. Why don’t you want to grant others the same liberty to believe what they wish?
Humanism always ends up just like what you state — My way or the highway (generally to a gulag!). Power to the people — who can seize it and to he!! with everyone else. Right?
But then the new CAGCooling crowd
will be claiming a global cooling crisis is coming
… so you STILL must do everything they say without question !
A few scientists tried that in the mid-1970s.
But like a stopped clock, this time they will be right about the cooling crisis, the next glacial stage will be a big problem, and it WILL come.
So time to start building the nuclear reactors now, with 100+ year design lifespans, so we will have plenty of “energy” to provide for the lives and health of the world population.
Well we have delayed that by centuries…
Climate change: CO2 emissions ‘will delay next ice age by 100,000 years’ | The Independent | The Independent
Is that a bad thing griff? Too bad it’s nonsense because in my book, preventing the next glaciation is the only existential crisis humanity truly faces. Cold k!ills. Warmer is better.
In which time period would you prefer to live your life?
[__] Benign low CO2 1675-1750
[__] “Dangerous” CO2 1950-2025
How exactly is a few tenths of a degree supposed to do that?
Will you live in an ice age ? 😀
I won’t 😀
You do right now (it’s just an inter-glacial).
I think you know what I mean 😀
We are living in an Ice-Age now, the Earth has two geological states, Ice-house conditions, & Tropical conditions, we are are in Ice-house conditions as we have ice at the poles, it has been the alternating case for millions of years!!! With the Sun entering into what appears to be Grand Solar Minimum, an interesting experiment of a scale unimaginable by modern Humans, is underway!!!
Why not 100,100 years? Why not 99,900 years? Why not 10 years?
What an utterly ignorant and asinine thing to say. People who make unsupportable assertions like that need psychiatric help.
This interglacial is already long in the tooth and temperatures have been gradually falling since the Holocene Thermal Optimum. The current mild warming since the Little Ice Age is typical of the several other fluctuations. It is unlikely that the present interglacial will last more than a few thousand more years … and maybe much less.
griff, I am imagining you covered by a terminal moraine. Look it up.
The maximum effect CO2 can have is under 2 degrees. That is less than the change in an ice age.
The Independent???? That’s the last thing that rag is, independent, it’s merely a more intellectual version of The Guardian, which is written for, including spelling mistakes, for the peeps, The Independent is for the ruling intellectual elites, or at least those who think/believe they are such entities!!!
Also Griff, still awaiting a response to me question quite a while back now, about why when the atmosphere had 19 times as much CO2 than it has today, that the Earth was smack bang in the middle of an Ice-Age, please respond ASAP!!! ;-))
That,s effectively saying it won’t happen. Meanwhile Arctic
polar ice mass is at a 7year high for mid-summer and the first snows on the Alps from 2000m first time for many years in August.
What an idiotic statement you made since we are ALREADY in an Ice Age and has been for around the last 2.6 million years.
Not only that it has been cooling for around 5,000 years now, which means we are slowly leaving the Interglacial phase for a Glaciation phase that will take its place.
The current cycle of glaciation began in 1585. That is the last time that perihelion occurred before the austral summer solstice.
Northern hemisphere is now experiencing more sunshine in spring. There is less sunshine in autumn and early winter. The warming spring results in more precipitable water in the atmosphere ahead of cooler winters. That means more snowfall. Eventually the snow accumulates again at lower altitudes on the land surrounding the North Atlantic north of 55N.
The process should be obvious this millennium but probably not this century.
Probably the best thing is this data has been in the public for so long it can’t be fudged like all the other temperature data with the exception of the UAH datasets.
When I took PChem many years ago, everyone chuckled at the joke that “f” stood for “fudge” factor when discussing fugacity. Everyone implicitly knew that not everything could be derived from first principles and there was an uneasiness about it but at the same time an acknowledgement that honesty was not only the best policy, it was the policy.
Fast forward, it’s disturbing that social engineering has crept into the physical sciences and dishonesty to promote a certain agenda is not only tolerated but has become standard practice. So we now have graphs beginning at certain dates, contrary data being withheld and “adjustments” to inconvenient data. Not that long ago, such things were considered cheating.
Ahh, yes. Just like the pre-exponential term in the Arrhenius Equation. Which translates to “that’s the number you change to make the data fit the theory”.
“Not that long ago, such things were considered cheating.”
“Not that long ago, such things were considered fraud.” There all fixed!!!
Yes, 300 years of UK data…
All of the top-ten warmest years for the UK in records back to 1884 have occurred since 2002, and, for central England, the 21st century so far has been warmer than the previous three centuries.
Sounds like you’re a Little Ice Age denier.
No he’s a Natural Climate Variability Denier.
That too. They go together like jock itch and toenail fungus.
“All of the [alleged] top-ten warmest years “
Occurred during the pause.
God help you if the temperature rises into the 20s griff. Better shelter in place and put on a couple of masks, just to be safe.
In which time period would you prefer to live?
[__] Benign low CO2 1675-1750
[__] “Dangerous” CO2 1950-2025
So bloody what? The little Ice Age was the coldest period for ~8000 years. There were only two things the temperatures could do … increase or decrease. Luckily for us they increased. Natural variation is like that … it’s variable. CO2 has nothing to do with it. Temps were already on the rise long before there was any increase in CO2.
Aren’t Inter-glacials wonderful??? ;-))
griff, you clearly have no idea what “random” really looks like. To put this into perspective, the India cricket captain, Virat Kohli, has lost 9 out of the last eleven coin tosses in England. According to you this means the coins must have been tampered with. Of course, they haven’t been. It’s just how randomness works.
Put simply, if the top ten warmest years in the UK going back to 1884 have all occurred since 2002, so what? There’s nothing to suggest this is anything other than random and natural.
You’ve fallen into the trap of believing you know what “random” looks like. Nearly everyone does, which is why claims such as the one you’re making might seem convincing. In reality it means absolutely nothing — it’s just a trick of the brain.
As for the centuries claim, again, so what. What you’re saying proves absolutely nothing.
Can,t be random. Change the coin and allow for UHI effect, eg taxiway at Heathrow beloved of the BBC.
You bring up a good point. The very definition of random means you can not forecast the next point in time. You may get 10 heads in a row, but it is folly to say that the next toss must be a tail because there has been so many heads in a row. It is a trick of the mind. Each random throw is independent and mutually exclusive.
What do you think the probability of getting 9 or more wins in 11 coin tosses? I make it just over 3.3%. And assume 9 out of 11 wins would be considered equally unlikely, so the chances of getting 9 or more wins or losses in 11 tosses is around 6.5%. That is not statistically significant, and given that there are 1000s of such runs going on all over the planet, things like that are going to be happening all the time.
“Put simply, if the top ten warmest years in the UK going back to 1884 have all occurred since 2002, so what? There’s nothing to suggest this is anything other than random and natural.”
The odds of 1 given year being in the top 10 out of 140 years, assuming it was just down to chance would be 1/14 (I’ll call it 10% for simplicity), not at all like the 1/2 for a coin toss. So now the question is how likely it would be if 10 out of the last 18 years would be in the 10% band. Check this, but I make the odds of getting 10 or more 10% chances out of 18 is 0.0002%. There’s no comparison.
This appears to be a binary choice. Either the year is hotter than the set point or it isn’t. Just like a coin toss. If it is random then it is random. Next year isn’t dependent on last year. The current year isn’t dependent on the prior year.
I take it probability is another concept that wasn’t covered in all your engineering courses.Consider this binary choice – either I win the lottery next week or I don’t, just like tossing a coin.
Since next weeks group of numbers will be different from this weeks group of numbers, and therefore independent and mutually exclusive, yep, the end result is either you win or you don’t. What happened last week, or the week before that is immaterial as to whether you win next week or not.
What is the chance of your winning an individual lottery? That’s a different issue.
You just can’t refrain from displaying incomplete knowledge can you?
Not being omniscient it’s difficult to display anything other than incomplete knowledge, but I think you are missing the point. I’m not saying anything about one result being dependent on the previous one. Indeed the calculations are based on the assumption that each result is independent. The issue is very much about the odds. You are more likely to win 9 out of 11 coin tosses than you are to win 9 out of 11 lotteries.
I could equally say all odds are 50/50; either something happens or it doesn’t.
By how many degrees?
You simply dont believe 1984 is a true prophecy!
.
Over 50% of the world’s popualtions now live in a city, surrounded by man made artefacts. It is natural for them to not only be completely out of touch with what is happening outside their cities, but to assume that the whole world is as man made as a city is.
So if the mass media shows them floods, tells them that the sea lavel has risen a foot, and this is all because instead of eating cheap processed veggyMuck they insist on eating expensive unprocessed delicious meat, they simply believe it!
We are being lied to more than at any time in the worlds history simply because that vast majority of people are more in touch with propaganda, than the real world.
We have all seen online sources modified to support the cliamte change narrative, while new narratives of ‘colonial oppression’ are invented to support political positions.
That the propagandists, for profit and power, are setting a massively dangerous precedent, does not seem to have occurred to them.
. covid loves the cities
No sun exposure =no vitamin D = unmoderated immune response
Warm is good. Cold is bad.
When the temperature “trends” start heading in the opposite direction to a degree (pardon the pun) that cannot be concealed, the Climate Fascists will suddenly discover this fact.
But they will still blame it on human fossil fuel use, you can bet the house on it.
But they won’t.
Human CO2 has effectively delayed the next ice age/cooling period or any effect from a Maunder minimum for centuries
For shame.
See, you discovered a limitless positive.
If we have actually delayed the inevitable next glaciation then we are saving billions of lives as well as other species.
If.
It’s all speculation as there is no firm data of our effect on climate.
None
All of us north of New Jersey are depending on it, Pat. Certainly Canada will be one big Nunavut if the next glaciation comes.
Keep up your nonsense griff. Otherwise you won’t get paid.
You so prefer the cold? I guess we can infer your answer to the question you refuse to acknowledge. It was mighty cold in the 1690s
In which time period would you prefer to live your life?
[__] Benign low CO2 1675-1750
[__] “Dangerous” CO2 1950-2025
Is that what today’s talking point memo tells you to believe?
A couple of articles ago you agreed that global warming is eliminating droughts, now it preventing the next ice age! Way to go Griff, but you left out helping the feed billions
No !
There are better predictions about the future than yours.
Your claim is that human released CO2 will change the celestial mechanicsof the solar system as described by Milankovitch cycles.
I seriously doubt your claim has any basis in fact.
Please go infect some other website.
They will blame it on whatever narrative suits their political agenda at the time.
That is the reason that “global warming” suddenly morphed to “climate change”. They were pre-planning for the failure of their first hypothesis.
“Climate Change” is an appeal to ambiguity … a logical fallacy and always intended to be equivocal. They were hedging their bets from the outset and nobody really believed human GHG emissions are controlling the climate. The idea is utterly absurd. It’s a useful narrative.
Up to a point!
“Moderation in all things.” — Aristotle
Agree completely. However the warming of the last 200 years has a long way to go before it can even be called moderate.
“except beer!”
Socrates (allegedly)
H/T Monty Python
40c plus heat in place with little air con = bad. Days of rain in 24 hours = bad.
40c plus heat in place where people have no access to air con because scientologist electricity generation practices make it unaffordable = bad.
You’re welcome
-20c cold in a place where unreliable weather-dependent power is the only source of heating = bad
People who hydrate properly in 40c do not die. People who are exposed to sub-zero temperatures for extended periods do die.
In which time period would you prefer to live your life?
[__] Benign low CO2 1675-1750
[__] “Dangerous” CO2 1950-2025
Good or bad doesn’t matter, since neither is in any way outside of normal.
Both regular occurrences even in the LIA and MWP.
Neither necessarily a bad thing, just part of nature being nature.
Does it ever get that hot in Britain? I have the impression those guys would wilt if it reached 30c in midsummer.
Days of rain in 24 hours=Prince Rupert or Ocean Falls
Ain’t that the truth. I remember waking up one morning in Holberg after it had rained 12 inches over night. Fortunately it was a float camp or we wouldn’t have got breakfast.
Bad but nevertheless normal variability.
Griff offering his pointless fears and silly opinions … even worse.
O! M! G!
I grew up in 40C degree weather with no air conditioning. I even worked in the hay fields in such temperatures. I worked chasing down 100lb hogs and holding them while the vet castrated them. I don’t know of anyone who died from the hot temps. We knew how hydrate (lots of unsweet tea) and knew what fans were for.
You are a citified pussy who has been spoiled by modern technology.
Yep! Meat is grown in the back of the grocery store. Vegetables are grown in a greenhouse by gnomes. Processed food is made by magic from elves. Drugstores have witches in the back stirring pots of chemicals. Clothes are made by fairy godmothers.
Oh, now I understand you. You grew up in this unspoiled, hard-workin, church goin, god fearin, inbreedin environment.
Don’t you know that inbreeding can fix traits like intelligence!
Well, I’m not entirely sure…
In my area I get that heat around 15 days a summer on average and around 30 more days over 35C, use the Swamp Cooler it is easy to handle it.
The thing to note about historical “extreme” cold or hot weather spells is that back then, clothing and housing wasn’t nearly as appropriate or comfortable as we enjoy today.
If we could get our forebears’ take on how current generations respond to inclement weather spells, they’d probably say –
“PUSSIES!”
I saw a BBC description of extreme heat and they said 25 to 28 deg C for 3 or more consecutive days is extreme. I don’t know what they would call 29 deg C.
Britons believe that garbage thrown out by BBC, …
…BUT…
… they still come to holidays in Algarve (Portugal) and Spanish Levant, where 35 deg C or more is fairly common!…
Some do. Most don’t. The boy buggering communists have cried wolf a few times too many.
I’d call it almost perfect weather for a summer day.
Our average high temperature where I live for all of July and part of August is 32C and as I type this it is 31C on its way to 35C. Same for tomorrow and Monday, then a break mostly due to the hurricane about to slam Louisiana. The humidity is up there as well. You basically get used to it.
A Met Office heat warning is triggered when a part of the UK is forecast to have a 70% likelihood of exceeding a heat threshold, defined by the average summer climate of each UK region, for two days consecutively and one night in between.
Here’s the confusing part. This definition of an extreme heat event is different from the Met Office scientific definition of a heatwave originally: when conditions exceed the average for three days in a row and two nights in between.
The revision is important because extreme heat affects health before it has been long or hot enough for conditions to be classified a heatwave.
exceeding a heat threshold
Which this year meant a warning if it got over 23C
The only people affected by “above average” temperatures are those unable to afford air conditioning due to the rising cost of electricity thanks to scientologist generation solutions
Gawd griff, you’re such a wuss. How can any self-respecting person whine in public about unbearable heat in the 20s?
In which time period would you prefer to live your life? (hint: first one is during the Little Ice Age)
[__] Benign low CO2 1675-1750
[__] “Dangerous” CO2 1950-2025
Please untangle your neurons (if you got any).
Then you will understand (if you wish to understand; and what a big “if”!) that the normal temperature of one place and the temperature that harms health are two different values!!!
Lancet showed that extremes of heat and cold are NOT the dangerous temperatures. They proved that 20 times more people died from cold than heat and it was NOT the extremes that were the most dangerous.
https://www.thelancet.com/journals/lancet/article/PIIS0140-6736(14)62114-0/fulltext
Summary:
Cold weather kills 20 times as many people as hot weather, according to an international study analyzing over 74 million deaths in 384 locations across 13 countries. The findings also reveal that deaths due to moderately hot or cold weather substantially exceed those resulting from extreme heat waves or cold spells.
This, from an over paid taxpayer funded organisation (allegedly organised) who are still reeling from a gross failure to accept that a hurricane was about to hit Britain just over 40 years ago!!!
As I pointed out a few days ago, Michael Fish was misquoted. He was talking about the Caribbean, before switching back to the UK forecast.
More fool him for doing so, however he was a good sport as he appeared in the title sequence of a comedy show on BBC Two a little while later taking the micky out of himself!!!
Heat waves should be defined based on what is normal for an area. In places like New York, they start opening shelters when the temperatures get above 90F. On the other hand, in Phoenix, they don’t start taking off the sweaters until the temperatures get to 90F.
I lived in Taiwan a number of times over the past quarter Century. People put on jackets and gloves to ride on their scooters when the temperature drops below 20° C. I often would drive to work in the morning with the AC off to enjoy the cool 25° C morning air.
When I used to visit the UAE, I asked my taxi driver why the building workers were wearing jackets in 40C temperatures. He replied that they take them off when it gets to 50C. They import labour from Central Africa who are used to the heat.
They come from where humans evolved.
Cue the Yorkie…
https://www.metoffice.gov.uk/hadobs/hadcet/cet_info_mean.html If you look at the CET chart the anomaly for the UK rose by about 1.7C from 1680 to 1730 then it cooled for 291 years to 1980 then it warmed to 2000 then cooled then warmed to the same level in 2021 then cooled by about 0.1C which means its 0.5C warmer than in 1730.
When I put this to Grahame Madge at the Met Office questioning the veracity of its 2020 Climate Report which they published a few weeks ago very conveniently after the NW America and Western Canada heat wave, subsequent wild fire, the floods in Germany and China and a high temperature of 48.8C in Sicily influenced by UHI and the 2000F temperatures of their wild fires Grahame Madge responded by declaring Met Offices own CET chart as grey literature and made the same reference to NOAA USCRN charts for America. I have the emails.
The Met Office Climate report was authored by a hydrologist whose profession at the Met Office is information presentation. What the CET chart shows is that since 2000 the UK has cooled by 0.1C whilst in the report they attempt to link 1C of warming to wild fires floods one high temperature which the WMO most likely will not verify – it did not verify the previous high for Sicily of 45.8C – to impose the belief that their really is a link between Co2 temperature climate and weather when the chart shows the UK cooled from 1730 to 1980 whilst Co2 was rising then when Co2 peaked at 419ppmv the UK cooled.
Because it has not warmed by 4C or 6C every individual who has parroted crisis because of Co2 knows catastrophe is not beckoning so to save their reputations and legacy are now pinning their hopes on the hysterical misrepresentation of weather and natural disaster to push their strife torn Titanic over the line.
Thanks for this post. But what is “grey literature”?
Westerns paperbacks by Zane Grey.
e.g his covid themed book ‘Riders of the Purple SAGE’
(Joke for UK readers…)
Yes, you are a joke, griff. But not only for UK readers.
In which time period would you prefer to live your life?
[__] Benign low CO2 1675-1750
[__] “Dangerous” CO2 1950-2025
I hear there are 50 shades. Sounds like shady stuff.
Grey literature refers to a wide range of publications that are not books or journal articles
Grey literature should be included in a thorough or systematic review of the literature as it can reduce positive publication bias provide a wider range of information, especially from those who do not publish in academic journals…
https://www.lancaster.ac.uk/library/resources/grey-literature/
Thanks for the answer, and the link.
Isn’t the ‘grey’ part a reference to intelligence sources? The classifications are; white sources as open source or publicly available, grey as restricted source or not generally available and black as classified or secret information. Presumably the climategate emails and Mann’s code are black information! Hmm first they are religious zealots now they are paranoid spy film/book afficionado’s.
If the IPCC uses non scientific papers from Greenpeae as they had to confess they did. 😀
I left out the most important detail. According to the Met Office whilst they continue foment hysteria about warming and climate change the average temperature anomaly for the UK shows it has not warmed for 21 years since 2000 it has cooled not warmed.
https://www.metoffice.gov.uk/hadobs/hadcet/cet_info_mean.html
That’s not what they are saying.
The UK’s climate has continued to warm, with 2020 the first year to have temperature, rain and sunshine rankings all in the top 10.
The latest analysis of the UK climate, State of the UK Climate 2020 published in The Royal Meteorological Society’s ‘International Journal of Climatology’, has shown that climate change is already being felt across the UK. All of the top-ten warmest years for the UK in records back to 1884 have occurred since 2002, and, for central England, the 21st century so far has been warmer than the previous three centuries.
The last 30-year period (1991-2020) has been 0.9°C warmer than the preceding 30 years (1961-1990). The warming trend is evident across all months and all countries in the UK.
Blimey griff you keep saying the same thing over and over again and you get nowhere because it’s fantasy
It woz the pause wot did it
The MO are stuck for a heatwave – they kept saying it was coming this August and it never did.
I think the forecast heatwave has now become an Indian Summer during September.
I’ll believe it if it ever materialises
OH. MY. GOD!
Indian Summer?????
Seriously?
Ben! You realize how hurtful that sort of rayciss trope is?
What makes it “Indian”? Because it’s false, not the genuine summer? A lie? Not as good as the real thing? Are you referring to Indians or First Nations people? Who are you slandering exactly?
I didn’t think such h8 mongering would be allowed here!
🤪
They started the heatwave hysteria in May, then June, July, August and are now saying it’s coming in September. At this rate they’ll still be predicting it in December – maybe we’ll christen 2021 “the year without the Met Office heatwave!”
America 1936 Dust Bowl 12,000 died in one week. China 1887 flood 2 million died. Germany Christmas flood 1717 14,000 people died. UK 1976 Looking back at the record-breaking 1976 UK summer heatwave where temperatures soared to almost 36C (thesun.co.uk) High temperature 35.6C Above 32C for 15 consecutive days.
No it has not continued to warm look at the CET chart. The UK warmed by 1.7C from 1680 to 1730 when Co2 was about 290ppm. then it cooled for 291 years to 1980 when temperature rose by about 0.9C to 2000 then it cooled to 2010 then rose again to the same temperature as in 2000 then it has cooled by 0.1C. Warming since 1730 is 0.5C. No big deal at all. From 1998 for 18 years and 9 months the temperature of the lower troposphere plateaued paused remained flat despite the emission of 100 trillion tons of Co2 more than one third of all Co2 ever emitted. Weather is not climate. This happened at 290ppmv: Australia. Marble Bar 1924 160 consecutive days above 38C. Cloncurry 1889 53C. Longreach 1901 51.7C. Walgett 1878 52.8C. Charles Sturt 1828 53C. Thomas Mitchell 1845 53C. Euston 1897 51.6C. Mildura 1906 50.8C. Wilcanela 1939 50C. Oodandatta 1960 50.7C. Coolgardie 1901 51.1C. You and the BBC must think we are completely bloody stupid. Your illicit grotesque morally repugnant vile scaremongering needs to stop. The BBC does not report weather it broadcasts criminally misrepresentative obnoxious vexatious propaganda. If you watch the BBC long enough they would have us believe that before 1970 when the BBC said that Co2 was about to cause another ice age that weather didn’t happen. In January 1896 a savage blast “like a furnace” stretched across Australia from east to west and lasted for weeks. The death toll reached 437 people in the eastern states. Newspaper reports showed that in Bourke the heat approached 120°F (48.9°C) on three days (1)(2)(3). The maximumun at or above 102 degrees F (38.9°C) for 24 days straight. By Tuesday Jan 14, people were reported falling dead in the streets. Unable to sleep, people in Brewarrina walked the streets at night for hours, the thermometer recording 109F at midnight. Overnight, the temperature did not fall below 103°F. On Jan 18 in Wilcannia, five deaths were recorded in one day, the hospitals were overcrowded and reports said that “more deaths are hourly expected”. By January 24, in Bourke, many businesses had shut down (almost everything bar the hotels). Panic stricken Australians were fleeing to the hills in climate refugee trains. It got hotter and hotter and the crowded trains ran on more days of the week…To get a feel for how widespread and devastating it was, read through just one report in one paper (there are scores more). The Warwick Examiner, Jan 29, 1896.
The 0.9C is the same 0.9C since 1880. Climate Change by numbers BBC. O.85C since 1880 95% proxy data tree rings crustaceans mud and ice core samples with 5% of thermometer data. All of which lack accuracy and precision. The base core surface temperature remains about 15.2C.
We have had 7 El Nino events since 1979. Data from six pairs of NASA/NOAA/Metop weather satellites record a trend since 1979 of 0.14C/decade or 1.1C by 2100. 4,000 ARGO buoys in the oceans record a trend down to 2000m or 0.02C/decade or 0.16C by 2100. The pristine USCRN surface temperature recorded administrated by the NOAA records now warming since 2005. American lower troposphere data records no warming for 505 months the same for Australia North and South Poles.
Strong Demand For Jackets…Northern Europe Sees Very Little Midsummer Warming Over Past 2 Decades (notrickszone.com) “A common assertion is that global warming is an existential threat to humans and the Earth in general. This is often explained as the Earth will become like Venus, with a surface temperature of 464°C (or 250°C as Stephen Hawking once incorrectly asserted) and barren of life. James Hansen once called this the runaway greenhouse effect. The truth is that neither the Earth nor Venus are “runaway.” Further, the Earth has oceans and Venus has almost no water. 99.9% of the Earths heat capacity and thermal energy is stored in our oceans. Less than 0.1% of the Earth’s thermal energy is stored in the atmosphere. The Earth’s surface has five times more stored thermal energy than the surface of Venus. We have a lower surface temperature, because the thermal energy is nearly all in the oceans and they have an enormous heat capacity. The Earth’s oceans alone store much more thermal energy than the whole surface of Venus at a temperature of 464°C. If our oceans continue to exist, there is no way our planet’s surface could reach a dangerous temperature. They would have to completely boil away, and the water vapor would have to be ejected to outer space. No greenhouse gas could ever accomplish that.”
Every day is a school day. BBC Climate Change by Numbers the planet has warmed by maybe 0.85C since 1880. In 2021 Europe had its coldest 6 months for 60 years. Its snowing in Australia and then there is this https://youtu.be/NsXJjJu5VAA. Then you need to know what a temperature anomaly is CO2 Coalition | The Global Mean Temperature Anomaly Record The global satellite temperature anomaly data from six pairs of NOAA NASA Metop satellites records a trend of 0.14C/decade or 1.1C by 2100. 4,000 ARGO buoys in the oceans record a trend of 0.2C/decade or 0.16C by 2100. What exactly are you trying to prove? Yes it has warmed a bit, yes Co2 has risen a bit. In the 1300’s the planet struggled to feed 350 million now because of a miniscule extra amount of Co2 subtle warming of 0.85c nitrogen fertiliser from methane the planet now produces enough food for 10 billion. Would you prefer to live during the Little Ice Age when humans scratched around to find a dead rat for succour?
Snowing in Austria and Australia.
We already knew that, in the “3Rs” your “aRithmetics” is kind of low; now we can see that you also hobble in another “R”, for “Reading”, because David made not a comparison with the years before 2000: he just stated that since 2000 the UK has cooled, not warmed.
Your comment has nothing to do with what David wrote. You have not seen the difference, which is an alarming sign; you should see your doctor about that.
Am I understanding this correctly. Number of hot days are increasing and number of cold days are decreasing, but the two are cancelling each other out. Isn’t this just telling us that England is getting warmer, and wasn’t the same author saying England wasn’t getting warmer a couple of days ago?
It’s very much cooler – summer took a year off this year
Much to the annoyance of a he MO, BBC etc etc
But the graph illustrates hit days are becoming more common, with last year having the most on record.
But nothing
That is the fact of the matter
All of the top-ten warmest years for the UK in records back to 1884 have occurred since 2002, and, for central England, the 21st century so far has been warmer than the previous three centuries.
griff you never put out any links to verify your “facts”..
Adjustments are useful things to be sure
These alleged hottest years occurred during the pause.
The MO claimed “Notably warm summer so far for UK”
https://blog.metoffice.gov.uk/2021/08/26/notably-warm-summer-so-far-for-uk-but-not-for-everyone/
Notably hyping things up, more like. But nature doesn’t do a narrative…
“UK Met Office scientists are forecasting that 2021 will be a little cooler around the world”
https://www.bbc.co.uk/news/science-environment-55365414
They might get it right one day, eh.
It’s been a very cool summer in England.
“It’s been a very cool summer in England”.
No it hasn’t (at least for June/July)
The MO are not credible
Which bit of England are you in?
Those charts are meaningless noise
“The MO are not credible”
North Lincolnshire.
And I know weather (retired UKMO Forecaster).
(cue ridicule – coz we know that them that know stuff here (the science) have the most ridicule heaped on them).
So the UKMO routinely alter everyday data to make it warmer?
In this case as you say it’s been “very cool”.
So for me they will have been reducing daily maxima and minima by around 1C, have they?
Truly amazing.
There’s no talking to anyone who thinks the “world’s out to get them”.
At some point there needs to be common-sense for dialogue.
OK, Prove it then.
Get out of your rabbit-hole and sniff reality, rather than having your bias confirmed here and when confronted with the facts – saying things like “the Met O is not credible”.
That is the statement of someone seriously inflicted with conspiracy ideation – for which there is (of course) no proof necessary.
What YOU say is not credible.
The GWPF and the Great Snake-oil salesman M’Lord haven’t
rumbled the Met O and neither have you … except in your own mind.
And while I’m at it

More corrupted data for you (sarc) ….
That’s one hell of a big dropoff at the end there – what happens if that drop-off becomes a new trend? One of the reasons I find it difficult to trust recent (mostly the last couple of years) Met Office data is that their predictions beyond about 2-3 days have been utter failures. I get that each of the predictions have a probability rating that gives a likelihood of that event happening but to get every single prediction made this year for heatwaves so completely wrong is painfully inadequate – not something I expected to see in a professional organisation.
“That’s one hell of a big dropoff at the end there – what happens if that drop-off becomes a new trend? “
You’re taking the piss aren’t you?
And you believe we didn’t land on the moon …crazy indeed
You call me crazy yet you spend your time concocting and spreading elaborate lies about people you’ve never met?
Get a life.
Why shouldn’t it become a trend? Neither you, nor he, nor anyone else, knows.
It’s been a very cool summer in England.
To be fair, only in southern England. Now whether they’ve done their normal sort of trick by “interpolating” data in places out of sight, who knows?
Griff, as others say you rarely post any links to your words.
So if I say none of the top ten warmest years for the UK in records back to 1884 have occurred since 2002 and, for central England the 21st century has so far been cooler than the last three centuries, then my words carry as much weight as yours.
Pay attention, griffter….the UK does not determine the world temperature. Again, you refer to previous centuries when ….CO2 was lower…you are saying temp started up centuries ago while CO2 was lower…how did that happen?
Exactly, Mr Bellman – the number of hot days has increased but the annual averaged temperature hasn’t. Which means that the other days of the year must have been a little bit cooler than previously – in other words, more hot days but lots more cooler days. Now do you understand?
Nobody is understanding the weather correctly, Bellman.
And we never will.
(a non-linear, chaotic system governed by fluid dynamics)
Ask Bellman how he forces uncertainty to zero in his linear trends.
Does it involve whips and hot wax?
What linear trend? I was talking about the graph in this posting. Maybe you are thinking about Christopher Monckton’s pause trend line.
Reading failure…
He is countering a different argument. Namely, the weather is getting more extreme. You see, large wealthy countries like Canada, Russia, Scandinavia and yes, the UK could see an overall benefit to a few degrees of warming all other things being equal:longer growing season, fewer deaths from exposure, etc. so, activists have argued that the weather is more extreme: more storms, floods, droughts, heat snd cold events. But the weather is not getting more extreme in the UK temperature-wise, it seems.
He’s arguing it’s getting more extremely hot and less extremely cold. Three days ago he was saying “If anybody thinks the British climate is changing, they should mail their brains to Brains4Us and ask for a refund!”
If you tried reading for comprehension rather than reading to find something to disagree with, you might have found this little jewel.
At no point in the article was the claim made that the two trends you list cancel each other out. Nor was it even implied.
Surely someone as smart as you believe yourself to be, would be able to figure that out without having it explained to him.
Thanks for clarifying. So to be clear, the graph we should be concentrating on is the one that adds hot and cold extremes and shows essentially no trend. But that doesn’t show hot and cold cancelling each other out.
No bellman, it says that there are some time periods with more variability than others—years with both unusually high temperatures and unusually cold temperatures. There are also years with unusually hot temperatures but not unusually cold and vice versa.
Surely you could understand this if you wanted to understand it.
I might consider that was his argument if he actually said it anywhere.
All he says is “As we would expect, the number of warm days has increased, and the number of cold ones declined. When we add the two together, we find that if anything the trend has declined since 1900.” No mention of changing variability, and certainly no analysis to test the claim.
The point is that the incidence of both extreme highs and extreme lows have been decreasing in recent decades. Which is precisely the opposite what a large number of warmistas have been proclaiming.
Am I understanding this correctly.
No, as usual.
It’s the magnitude of the accusation that counts not the actual weather. And there has been a lot of magnitudes going on.
But don’t extreme claims require extreme evidence?
I have a hard time caring about high temperature records when they are merely a record for an “August 7th” for example. It may have been as hot or hotter on an August 6th, or an August 13th, even three different August 1sts, but NEVER on an August 7th!
365 days in a year, 150 years of records maybe, you do the math what’s the likely hood that any day will have an all time high or low or some form of “extreme” weather in any given place in the world. It’s almost a certainty that there many on any given day.
The major observable climate impact on the UK is it is getter wetter… 6% wetter than 30 years ago, with more extreme rain events, floods…
Record-breaking rain more likely due to climate change – Met Office
but it is also getting warmer
Climate change continues to be evident across UK – Met Office
There are no extreme rain events to to date
There are some above average, which is why we have averages.
He has a vivid imagination.
I doubt we know what the actual, total rainfall for all of England was today or 30 years ago, within 6%.
Beyond that, the records go back a lot further that 30 years. Why not look at what the entire record tells us, not just the tiny fraction that confirms your religious convictions?
You could weigh the nation daily and subtract all elements that are not water to get a daily water weight then any day to day increase would be from rain.
Example. Here in calgary in June 2013 we had a flood, can’t now remember if the scientologists called it a 500 or 1000 year event. A statistical artifact.
Later that year, the Calgary Herald published a story about research from the U of Calgary showing this was only the 5th worst flooding in the Bow River basin in the 130 years of good records.
This shows how you scientologists use $100 words to try and hide the truth.
Ps, no flood since then despite continuing climate emergency
I really wonder if you are as incandescently stupid as you make yourself out to be griff.
Actually nobody could really be that dense.
When it is high tide, do you also say that sea level is much higher than it was 6 hours ago as if that were relevant to anything? Quit with the cherry-picking and look at the whole record to see that there’s nothing unusual.
In which time period would you prefer to live your life?
[__] Benign low CO2 1675-1750
[__] “Dangerous” CO2 1950-2025
Please send all that extra rain to the drought-stricken American Southwest.
Koonin described this clearly in his new book
The climate scientologists published a paper that showed the ratio of cold to hot records has increased, aka climate emergency
But when digging into it, hot records had decreased but cold records had decreased even more.
So it was just a Scientology ploy to make something benign and actually beneficial (less cold records) look scary.
As always, if the scientologists had a real case they wouldn’t have to resort to such obfuscation.
Paul, has the Met Office ever tried to manipulate the CET series like happens in so many other countries?
They get their hottest days courtesy of a weather station located close to the northern runway at Heathrow airport.
All that tarmac and jet exhaust guarantees a winner.
Heathrow isn’t in the CET series.
“The Central England Temperature series (HadCET)
Your lying yet again banton “These daily and monthly temperatures are representative of a roughly triangular area of the United Kingdom enclosed by Lancashire, London and Bristol.” Taken from the hadcet web site, you say
“Heathrow isn’t in the CET series.”
” These series are representative of an area from the south Midlands to Lancashire.”
So you omit London you omit Bristol, for some one who brags you worked MO
On every website you visit you lie about were the data is recorded if it isn’t Heathrow banton ( which i think it is) were in London is the data gained.
The amount of times I’ve caught you lying banton I think you should be banned your a disgrace.
Mr. Banton may simply be unaware that the Met Office has previously admitted to using either Kew gardens station or Heathrow on occasion. Unlike when Manley compiled the earlier data and used the same 4 stations, the Hadley Centre uses an arbitrary set of temperature stations selected from the daily record, seemingly on their whimsy.
Considering banton has been in and out of the MO web site for weeks on this thread earlier threads and elsewhere on the Internet, I’m not buying ” he may be simply unaware”
He also lied on a thread last week describing a paper as a opinion,
He’s a lier and a deceiver, typical warmest.
May I remind you what WO say about the data area’s they use
“These daily and monthly temperatures are representative of a roughly triangular area of the United Kingdom enclosed by Lancashire, London and Bristol.”
Theres no on accasion as above daily and monthly.
From David Parker and Brion Horton’s
UNCERTAINTIES IN CENTRAL ENGLAND TEMPERATURE 1878 – 2003 …
So bellman the data stops 2003 it includes data collected even further west, and does not contradict the MO own statement,
“These daily and monthly temperatures are representative of a roughly triangular area of the United Kingdom enclosed by Lancashire, London and Bristol.” TODATE
What on earth are you on about? The data doesn’t stop in 2003. The table shows the stations used from 2004 onward. The data is representative of an area, it does not include readings from Heathrow.
OK my mistake, in my defence it does not say to present. The locations give one in London and one just outside London so thats two in the southeast , as the WO site states London I’m not convinced Heathrow is not used when it suits. Its also good of you to confirm London data is indeed used in HADCET data
As I mentioned above, the station they use in London is Kew Gardens, the one just outside is Heathrow. The Met Office (not the Hadley Centre) admitted they use one or the other on occasion, but not both. Interestingly enough, when you compare the temperature readings for both sites, Kew and Heathrow have warm days at different times – rarely both at the same time; which may account for why the Met Office pick one or the other, depending on which one is most agreeable to them on that day.
Do you have a reference for the MO saying they use Kew or Heathrow for CET?
I did – I found a reference to it in a pdf online but I can’t flaming well find it now. That’s damned irritating.
“He also lied on a thread last week describing a paper as a opinion,
He’s a lier and a deceiver”
How about you apologise.
I’m not sure which of those locations you think is in London.
Use the interactive map ,there are 10s of weather stations within London they can pick and choose what temperature data they use
https://www.metoffice.gov.uk/research/climate/maps-and-data/uk-synoptic-and-climate-stations
But they don’t because the only stations used in the CET are those I’ve already listed
First you claim that Heathrow is used in CET, and call A Banton a liar for pointing out it isn’t.
Then when I provide a source to the actual stations used, you claim one of them is London.
Then when I ask which one, you just point me to a list of stations in London and say any of them could be used.
Your ignoring this bellman
“These daily and monthly temperatures are representative of a roughly triangular area of the United Kingdom enclosed by Lancashire, London and Bristol.” TODATE
On the CET web site ,I provide a link with 10s of data recording stations
So bellman you should be looking at which ones they use clearly what you provide contradicts CETs own web site .
Banton is a liar ,your being argumentative and distracting from the facts
You also need to provide the first image of two which you omitted you only provide ed no2 of two which does not cover all
I haven’t ignored it. I’ve pointed out that there’s a difference between being representative of an area and using stations from specific locations in that area. I would also point out that being enclosed by a city does not mean that city is part of the area.
“You also need to provide the first image of two which you omitted you only provide ed no2 of two which does not cover all”
Oh good grief! If you click on the image I posted it says it’s 2 of 2. Is that what you are wittering on about? Those numbers are for all the images posted to this web page. If you want to see the first image click on the left arrow, it will show you a graph posted by Vuk.
Read it again bellman
“These daily and monthly temperatures are representative of a roughly triangular area of the United Kingdom enclosed by Lancashire, London and Bristol.” TODATE
Have you got it yet this is the data they use which you deny it says they use the data as synoptic and climate ALL stations are used for both types of data London is used as a specific location ,read their own web site , they use Heathrow, kew and no doubt any that gives a max temp which suits their purpose.
Let me try to help you by highlighting the important word
“These daily and monthly temperatures are representative of a roughly triangular area of the United Kingdom enclosed by Lancashire, London and Bristol.”
You have lost the plot bellman this is what banton said,
“The Central England Temperature series (HadCET)
These series are representative of an area from the south Midlands to Lancashire.Series are produced for maximum, minimum and mean temperature ”
He was completely wrong he lied he missed out London and the southwest
MO CET uses representative data for LONG term temperature data a specific location is just that it represents that location they pick and choose what they use.
Oh dear, still no actual Thermodynamics and still the relentless confusion, deliberate and otherwise, of heat with energy with temperature.
No matter
Gotta laugh at the Indy telling us that the next Ice Age is delayed by 100,000 years. What happened to The Authority on Climate, IPCC and UN, would told us in 2015 that we were gonna run out of dirt inside 60 years
What that means is that the dirt runs out of
Soil Organic Matter
leading to
No more rising atmospheric CO2 levels
also
Low to Zero water retention in the soil
leading to
Wildly erratic weather patterns (desert weather)
leading to
Massive soil erosion (e.g. why Rome is now so far inland)
also
Higher than normal atmospheric temps
meaning
Lower Soil temperatures (the energy can only be in one place at a time)
also
Greater heat loss from earth to space (as above)
leading to
Colder nights
and
Longer winters
meaning
Ice advance from poles towards Equator
equals
Ice Age
Starting in the 2075 (##)
You were warned (**)
Check with anyone who has familiarity with deserts.
They will assert that:
“Deserts are Cold Places”
** We are dealing UN IPCC here, methinks they Gilded/Painted The Lily
THAT is the monster, coming from beneath (does the UN monster come from New York) our feet while we gaze upwards at the Dancing Angels, Phlogiston and smartly attired Emperor.
The Met Office have also warned us just now, as Vuk linked to.
They say that this year, in the UK, might be the warmest inside the last 10 years
Surely Shirley, does that not give a complete and perfect lie to the idea of Global Warming (how much has CO2 risen in that time) but especially of the (laughable otherwise) Code Red warning we’ve all just been given
## No it won’t happen as in the film. it will be a slow gradual thing extending over 2 or 3 centuries.
A good number of folks actually do know how to avert it, controlling CO2 and people are not how they are doing so.
They use this
In itself that stuff will not slow the ice, but understanding the reason why farmers use it, will.
It is also available at any nearby dormant volcano, ancient Basalt lake or newly created mountain range. e.g. The Rockies
In England they think 82 is unbearable heat. In the US Midwest, we think it is a nice spring day.
Of course, they think that warm pond scum is a beer. Not a decent ice cold pilsner in the entire country. And an ice cold coca cola? Fuggedaboutit!
Oh we refer to your beer by the proper term – lager, which is fine for drinking on hot days in America, I imagine. Beer or ale is a magnificent drink, perfect for quenching ones thirst in Britain’s climate. Each to their own.
Walter, you’re dead on.
I’m in the U.S. Midwest and it’s been a typical Summer. We’ve been at 30 to 34 C for the past 6 weeks or so. That’s a only trifle unusual. We usually get a break in higher Summer temps here and there throughout the Summer. Not so much this year.
I’ve only seen this pattern 3 or 4 times in my ~65 years in the area. Often, it’s w-a-a-a-y hotter and most years we bounce around a bit more ( a LOT more) in the temperature and rain categories. Then there are those few years where it is w-a-a-a-y cooler. Not many, but some.
Sooo… wait up! Haven’t I just described the vagaries of weather in the Midwest?
Hmmmm… I believe I just did.
Welp, the Met Office ought to know that high temps are usually a temporary thing, as are very low temps, and they tend to go away. It’s hot here, too.
So what? It’s summer, there’s a hurricane trying to make landfall down south, and the humidity level is atrocious. Big deal. It’s weather, and you just deal with it.
Is August extremely cold in England this year? I have just switched the heating off for the night, but this is not the first day this month we have used it.
It’s definitely on the cool side – I haven’t needed the heating on yet but I’m starting to wear long sleeved shirts rather than tee’s now. I wouldn’t usually expect this weather before the beginning of October.
30 days? It looks like the 90 percentile for the whole year but the 90 percentile for maximum temperatures in January is not even the mean for Summer. Only a climate scientist would call two more days over the 90 percentile for January a catastrophe.
England has warmed a little over a degree. Whether for real or because of measurement bias (most likely, both), then number of days above the old 90 percentile going up a little because some days were 30.5 C instead of 29.5 C, for example, is not a sign of more extreme weather. A better metric would be how many days there are that are above the old 90 percentile plus the increase in the average. It will show if climate change is having a significant effect on numbers of extreme days or just making them slightly hotter.
Yeh, but any “unprecedented” days?
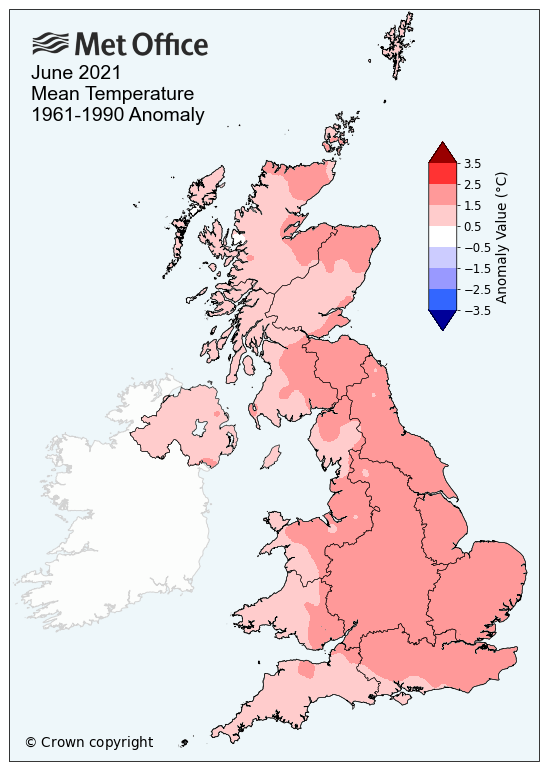
1976.
What I can say about the ‘2021 = top 10 hottest summers’ I live in the centre of the UK. We still had our heating on at the beginning of June, and today I had to turn it on again. So Met office is full of BS