From The Cliff Mass Weather Blog
Last week we witnessed a major failure in science communication regarding the Northwest heatwave.
A failure that misinformed you and millions of others, and a failure that highlighted glaring weaknesses in the media’s ability to cover important scientific issues. And it revealed the disappointing behavior of some members of the scientific community.

The Northwest Heatwave Attribution Study
During the last week of June, the U.S. Pacific Northwest and southwest Canada experienced the most severe heatwave on record. So extreme that all-time high-temperature records were not only broken but obliterated. My recent blogs describe the situation in detail.
Within a week, an international group of scientists, policy researchers, and others rushed to create and distribute an attribution analysis of the heatwave. A study trumpeting an extreme claim in the first sentence of the report:
“Based on observations and modeling, the occurrence of a heatwave with maximum temperatures as observed in the area was virtually impossible without human-caused climate change”
As I will show below and previously demonstrated in my recent blogs, this claim is not supported in the document or by the rigorous science, and, in fact, the material in the attribution report contradicts this assertion. I will provide substantial evidence that the heatwave attribution report, which has not been submitted for peer-review, is profoundly flawed, with serious technical and interpretative errors.
But the lack of peer review and the obvious problems with the study did not stop it from becoming front-page news in both mainstream and secondary media, including the NY Times, the Seattle Times, the Washington Post, CNN, and many more. Some samples of the hyped headlines are shown below:


With the exception of one story in USA Today, none of the writers questioned the grand claims of the attribution study, nor noted that other scientists had differing viewpoints. Here in Seattle, an incurious Seattle Times staff did not bother to examine contradictory evidence. It has become clear that much of our media is more interested in promoting a political narrative than providing citizens with factual information.
As a result of the media’s failure, millions of people were misinformed about the heatwave and its connection with global warming. And such poor information undermines society’s ability to deal with climate change.
A Technical Examination of The Heatwave Attribution Analysis
In the following sections, I will note a few of the major problems with this attribution study.
I should note that this research area is one in which I have an extensive background, having published several papers in peer-reviewed journals on Northwest heatwaves. Some of my papers are referenced in the report and one of the authors contacted me for advice and assistance.

As I shall demonstrate, the study is deeply flawed, does not support the claims in the headline bullets, and has serious scientific and other errors. If submitted to a journal for peer review, it would be rejected.
The main findings are not supported by scientific evidence or the materials in the report
As noted above, the first bullet of the main findings states that the heatwave was “virtually impossible without human-caused climate change.” Sounds very certain, doesn’t it? Virtually impossible.
Then read their next bullet:
“The observed temperatures were so extreme that they lie outside the range of historically observed temperatures. This makes it hard to quantify how rare the event was”
On one hand, they say it is hard to quantify how rare or unusual the event was, but on the other, they claim the event was virtually impossible without human-caused climate change.
Both statements can not be true. You can’t be uncertain and certain at the same time.
But the contradictions don’t end there. In the next bullet, they state there are two possible sources of the extreme temperatures. The first is a low probability event that was aggravated by climate change. This is what I suggested in my blog–and I am not the only one who believes that the best science supports this hypothesis.

Their second possibility is that global warming was the essential cause of the heatwave, with “non-linear interactions” increasing the probability of extreme heat beyond the gradual increase that has been observed during the past half-century. They state that “we need to investigate” the second possibility and ADMIT that “climate models do not show it.”
This is startling. They acknowledge that for global warming to cause the extreme heatwave, non-linear interactions that amplify the global warming signal are required and further admit that such interactions are not found by the key technology for doing so, climate models.
To put it succinctly, they have no evidence that global warming played a major role in the event.
Their next claim is that the June heatwave was enhanced by 2°C by global warming, which is not out of the realm of possibility.

But think about it. Considering that they state that the heatwave had maximum temperatures 16-20°C warmer than normal, by their OWN ADMISSION only about 10% of the heatwave was the result of global warming. Thus, a record-breaking, unique heat wave would have occurred without global warming.
Imagine if they had stated that. You would not have seen many headlines: Global warming contributed 10% of the heatwave!
In the final bullet, they note that if global warming continues at an aggressive rate (their SSP8.5 heating scenario assumption), futures heatwave would be ONE DEGREE °C warmer by midcentury. Not much compared to the amplitude of the June heatwave.
Daily High-Temperature Trend Problem
In the next section of the report (1.2), they claim, based on widely scattered observing stations, that the daily high-temperature trends in the Pacific Northwest are higher than the global average. This is deceptive. First, the Earth is 72% water and daily high temperatures generally increase more slowly over water than land. Northwest observing stations are over land.
But more importantly, the authors of this report appear not to know that the observing locations west of the Cascade crest have experienced LESS warming than inland stations because of the marine influence. This is obvious if you plot (see below) July/August maximum temperature trends around Puget Sound and the Columbia Basin during the period of largest global warming (1980-2020). The temperature trend is twice as large in the Columbia Basin compared to Puget Sound (1F versus 2F).

Puget Sound Temperature Trends
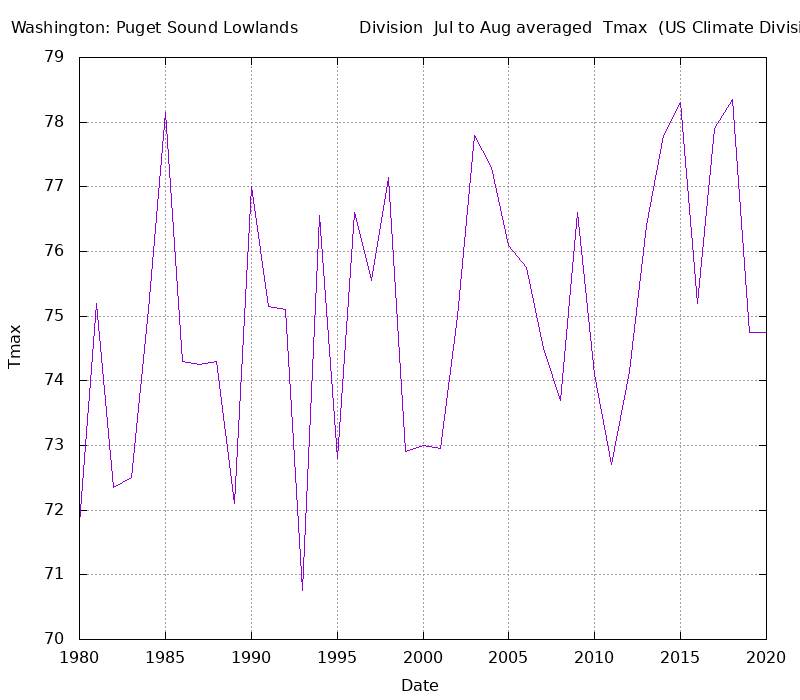

Columbia Basin Temperature Trends
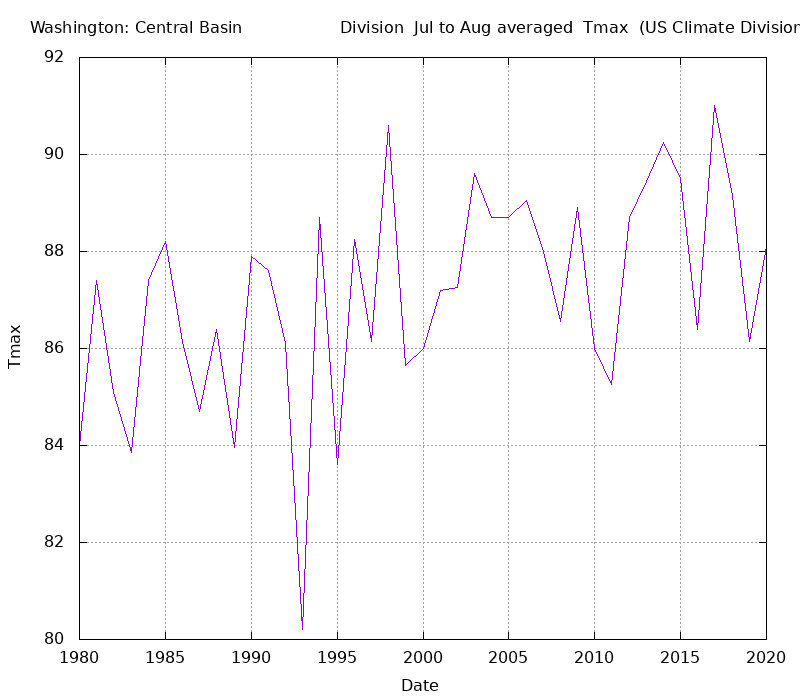
Data and Methods Problems (Chapter 2)
In this section and others of the report, it is apparent that the investigators have limited knowledge of key aspects of Northwest weather. For example (section 2.1), they suggest the importance of Lake Washington in local weather, suggesting it significantly influences the climate of Seattle (it doesn’t). They neglect the critical effects of Puget Sound, such as its substantial cooling of downtown Seattle and Seattle Tacoma Airport,
The study makes use of low-resolution Global Climate Model (GCM) simulations, which lack the resolution to get the basic aspects of Northwest weather and climate correct, These models do not simulate the important effects of the Cascades, the BC Coast Mountains, the mountains of Vancouver Island, the Olympics and the coastal mountains. The regional land-water contrasts in the GCMs are seriously in error and the global climate models fail to even grossly simulate the snowpack and soil moisture distributions of the region.
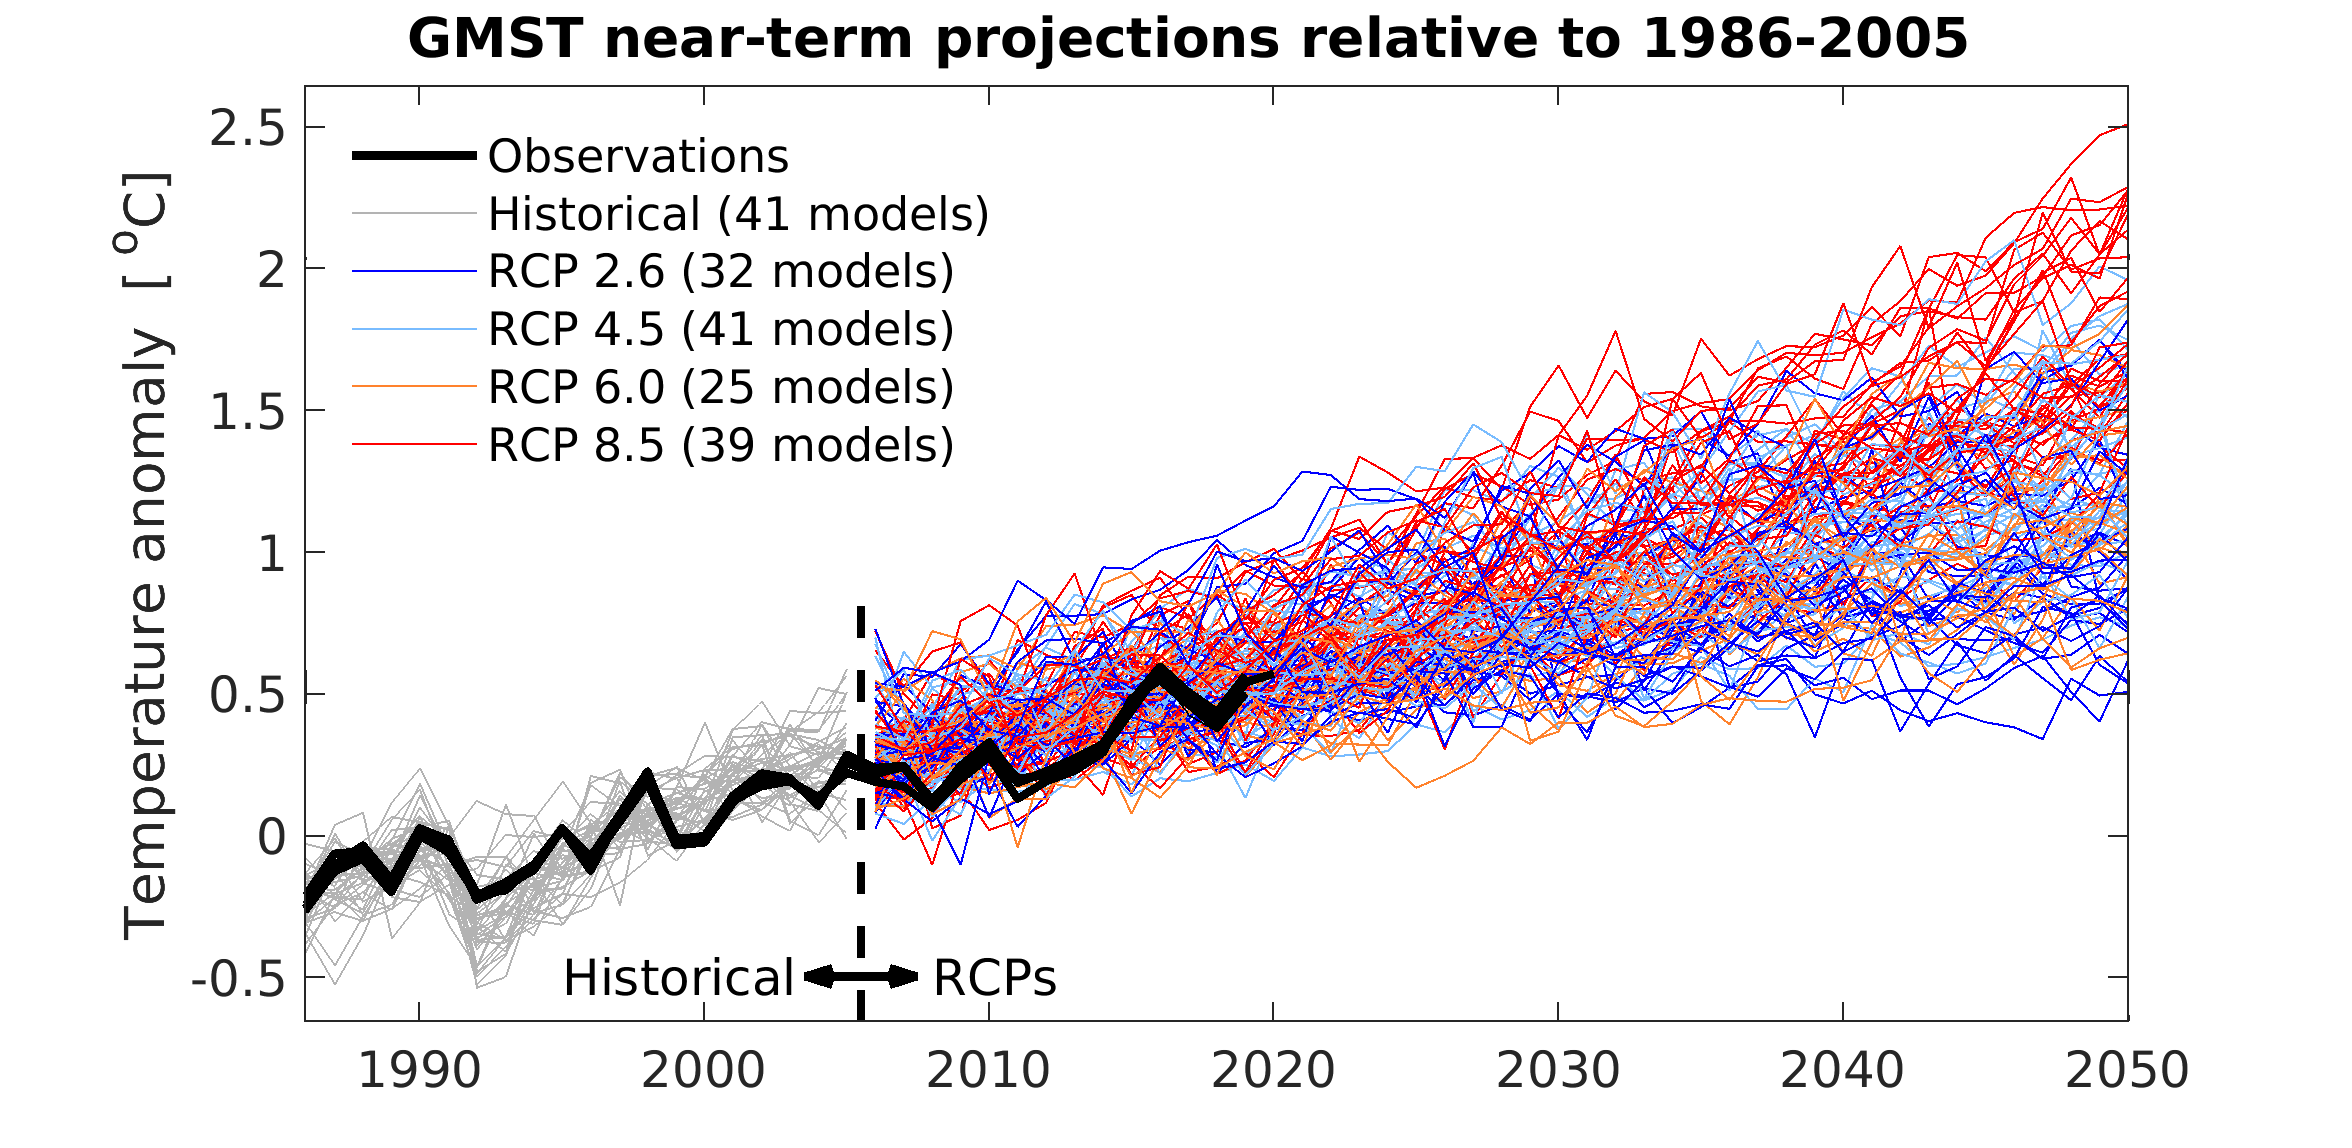
To make a bad situation even worse, the simulations they used are driven by an unrealistic, excessive greenhouse gas emission scenario (SSP-8.5) that leads to unrealistic warming during this century. Furthermore, the just-released CMIP-6 global climate model simulations were used, and these projections evince unrealistic warming.

The selected emissions scenario is highly aggressive, making unrealistic assumptions (such as massive increases in coal use)
Return Time Analysis of Historical Gridded and Station Data
In the next section, the paper attempts to determine how unusual the high temperatures were during the event. One goal was to determine the return time of the extreme heat based on past annual high temperatures; would such warmth be observed every ten years, hundred years, etc.? This section included an extreme value analysis, in which investigators fit a Generalized Extreme Value (GEV) distribution to the observed annual high temperatures. You can think of the GEV as a theoretical probability of temperatures occurring at various values, with the probabilities decreasing for more extreme values.

Their analyses provided an important finding: the Northwest heatwave of last month was extraordinarily improbable EVEN IF SUBSTANTIAL GLOBAL WARMING occurred. Global warming could not explain it.
This study clearly showed that the heatwave was a very rare black swan event. And this finding contradicts the headline in the first bullet of the report and in headline banners around the world.
And there is more. They determined the probability of getting a similar extreme temperature event ANYWHERE on Earth (similar sized area, similar or greater magnitude). Importantly, they found that the probability of observing the event anywhere on Earth was MUCH higher (about 60 more chances each year because the June heatwave encompassed about 1.5% of the Earth). The return time of a similar extreme event somewhere on the planet was between once every 1.5 to 15 years. Thus, such black swan events occur somewhere quite frequently– just not necessarily in the Pacific Northwest.

After this important finding was revealed, the authors made a critical admission:
“It is, therefore, conceivable that it was pure chance that it (the heatwave) happened at this location.” And they called for further research. Wow.
Multi-model AttributionIn many ways, this part of the report is the weakest. They provide little explanation of their analysis approach, other than to refer to a previous paper (Kew et al. 2021) whose methodology was questioned by the reviewers of that paper (not sure how that paper even got published with those reviews).
For some reason, they combine observations and models at the same time in their analysis, which does not make any apparent sense. In addition to a confusing and inadequate description of their approach, they provide grand claims of global warming producing major increases in the probability of extreme heatwaves. Such findings were inevitable considering they used models driven by unreasonable global warming inputs and the use of highly sensitive CMIP6 simulations.

But that is the least of it. The probabilistic approach to climate attribution is highly flawed, something I touched upon in my previous blog on the event. If the probability of an extreme event increases from .001 to .1 percent it has gone up by 100 times, but still, the probability is still low. That is why the claims of global warming increasing the probability of a once in a thousand-year event by 150 times are so deceptive. Furthermore, the results of the various models they used were all over the place (their Fig. 12), with a huge range in the probabilities of the heatwave (the majority suggested it was very, very unusual).
Meteorological Analysis: Major DeficienciesIn this section, they state ‘The circulation pattern itself also appears not extremely anomalous” and that the Heat dome “is not that anomalous.” These claims are not correct.
In truth, the amplitude of the ridge of high pressure aloft was the greatest ever observed and the high pressure was in position for a very long time, allowing air plenty of opportunity to warm by sinking.
At 850 hPa (about 5000 ft above sea level) the temperatures were not only unprecedented but extraordinarily extreme (see graphic below from Dr. Joe Zagrodnik). And an approaching trough of low pressure played an important role in forcing strong offshore flow, but this is not mentioned in this report. I could go on, but the message is clear: the meteorological setup was extreme and exceedingly rare, something not recognized in this work.

Global Warming and the Jet Stream, Drought EffectsThe report considers but finds no evidence for global warming causing the jet stream to experience more blocking or ridging (high pressure) events. Record-breaking high pressure aloft played a central role in this event and without a global warming connection, the role of natural variability comes into the forefront.
Finally, the report notes that drought and dry soil conditions could have enhanced the high temperatures due to less evaporative cooling. But they admit that soil moisture conditions and precipitation were not below normal in British Columbia, where many of the warm records occurred. Furthermore, as described in my previous blog, moistening the soil in model simulations only cooled the region by about 1°C, a value dwarfed by the heatwave amplitude (16-20°C).
The Bottom Line: The ominous claim in the first sentence of this report, suggesting an overwhelming global warming origin of the Northwest heatwave, was not supported by the remainder of the document. If anything, much of the material in the report is highly suggestive of a random, black swan event that is slightly enhanced by greenhouse gas warming.

An Advocacy DocumentIt is clear that this attribution study was not intended to serve as an objective examination of a scientific issue (e.g., the contribution of global warming to the Northwest heatwave) but rather is an advocacy document.
It is easy to demonstrate this. For example, the first section of the paper calls for immediate policy changes, including adaptation and mitigation. The final section “Recommendations” promotes policy changes and specific adaptation recommendations. The inconsistency between the dramatic claims of the first sentence and the more nuanced material within the document suggests a clear intention to highlight a message that promotes notice and action.

Afterword
The future of our society depends on scientists dedicated to determining truth and communicating their best estimates of truth, including the inevitable uncertainties. Scientists, in their professional roles, should never become advocates for politicized viewpoints or actions.
Likewise, the media in their news reporting must strive to avoid political advocacy and communicate truth, with all its uncertainties. The media must be engaged and curious enough to not only understand the science but to actively question the reliability and rigor of scientific claims.
In the recent heatwave case, we have seen a profound failure on both sides of the equation: scientists who created a rushed, sloppy, and flawed attribution study of the Northwest heatwave for reasons you can probably guess, and the media who headlined such poor work because it fit a comfortable, politically favored narrative.
Hopefully, this unfortunate situation will serve to encourage reform in both the scientific community and the media. The cost to society is too great for such behavior to continue.

“If submitted to a journal for peer review, it
wshould be rejected.”There are journals that will publish anything. Especially for a fee….
Is there anybody left in the mainstream media who even attempts to be honest? The very few who do make an effort (John Stossel and Sheryl Atkisson come to mind), end up being thrown out.
The same is true of Wall Street. Honest people need not apply.
https://joannenova.com.au/
See the results of a US survey of the people’s trust of the MSM.
“Is there anybody left in the mainstream media who even attempts to be honest?” No. Reason…An honest man is rewarded over a period of time, a dishonest man is rewarded immediately.
Joe
The other thing to do is go back and look at tempature records from the late 20s and 30s where not erased.
Does anyone remember the dust bowl years…..
Be back to post a few links here
https://en.wikipedia.org/wiki/Ice_Harbor_Dam
Quick look at record temps before wiki realizes and erases
118c in 1929
118f, sorry
https://en.wikipedia.org/wiki/U.S._state_and_territory_temperature_extremes
In fact, according to NOAA, the temperature has previously hit 118F twice in Washington State.
July 1928 at Wahluke and August 1961 at Ice Harbor Dam.
https://www.ncdc.noaa.gov/extremes/scec/records/wa/tmax
The chart says 1961, not 1929
It was 133 F in Santa Barbara in 1859, caused by the same down-slope wind which they correctly called a “sirocco”. It baked apples and pears on one side (the windward side) while still hanging on the tree.
https://realclimatescience.com/2021/07/what-really-controls-the-climate/
With Wiki, odds are very high that’s already adjusted data. Heck, for that matter, odds are that if you even look at “official” temperature sources, it’s been adjusted. Just look at the various “blink” charts and articles posted here at WUWT over the years regarding the official weather records being adjusted… always with the past magically being cooler, and the present magically becoming warmer than the actually measured data.
The study authors have learned that few people, even media mavens, bother to read past the headlines these days. They know they can make unsupported claims in the headlines and save the exceptions and qualifications for the body of the story, because no one will read that far. This group (World Weather Attribution) has been around for a few years, doing these sort of sham studies, to promote climate alarmism. They are an advocacy group pretending to be a legitimate scientific organization. They ought to have NO credibility, but since they serve the purpose of lending a patina of science to alarmism, they are touted by a deceitful MSM.
Remember this?
https://www.curbsideclassic.com/vintage-reviews/road-track-takes-on-ralph-nader-nader-vs-volkswagen-a-rt-report-rebuttal-is-more-like-it/
The media had a predetermined conclusion. The heatwave and this report fit the conclusion. Insert ominous quotes from the report, taken out of context, and craft a click-bait, fear-mongering headline. Jobs done, says the media.
“Hopefully, this unfortunate situation will serve to encourage reform in both the scientific community and the media.”
If only. The errors you report are obvious and egregious. The media articles has to have been written based on a press release, by “journalists” who never even read the study abstract.
The folks at RealClimate addressed this exact misconception about extreme heat waves several years ago:
In other words-
“it’s worse than we thought!” 😱
I think the “in other words” here would be, “it’s exactly as expected.”
“it’s exactly as expected.”
Which is always – “worse than we thought!”
Temperatures are not normally distributed. There is a long tail on the cold side.
The mean can be, and is, shifted to the right by increases in the low temperatures without significant changes in the upper tail.
“Can be” and “always is” are different things. Can you show that the distribution of global temperatures is only ever shifted by the cool wing? Is this true of all regions around the world as well? Can you provide evidence proving it?
Thank you for quietly admitting that you can’t address Dr. Mass Numerous science and data based postings on this heatwave topic.
Cheers.
I believe that all of Mass’ objections have been addressed on RC’s recent post on this topic in the comments. I certainly cannot do a better job of addressing each one here than actual experts in this topic can, so I’d refer curious readers there.
Looks like griff’s troll shift is over. Now we have weekly_rise on duty.
Having heat waves 16 to 20C above normal is normal for that region. Always has been, always will be.
Having one of the climate gang proclaim that CO2 must have played a role, even though nobody can prove it is par for the course.
Yes indeed … why Canada’s highest recorded max was smashed by 4.6C.
The Post shows that that is a lie. Can’t you read?
Once again, variation in the weather dwarfs variation from AGW in both magnitude and rate.
Coping with the weather is required regardless.
Coping with AGW will happen anyway, if we cope with the weather.
Actions on AGW should only be taken if they don’t interfere with coping with the weather.
We cope with the weather through adaptation – which costs.
So actions on AGW can only be justified if they cost nothing relative to
what we have to spend anyway.
“Once again, variation in the weather dwarfs variation from AGW in both magnitude and rate.”
Staggering:
You cannot divorce “weather” from climate !
Weather happens BECAUSE of climate.
As in the energy available in the climate system for weather to happen.
When the world is experiencing (as in the case of the US where I recently posted data), twice as many record warm temps vs record cold temps when compared to the much vaunted 1930’s, you can’t.
AND that does not mean that the 1930’s dust bowl was not extremely hot – it means that at that time there were also an equal number of record cold temps recorded …. as would be expected in a climate that is not warming – record cold matched record warm.
Not now.
Exceptional heat most certainly IS connected to AGW.
Sorry just is.
Bizarre, confirmation bias to expect weather to divorce itself from climate and somehow do it on it’s own.
AB,
Climate is 30 years worth of weather averages….NOT “weather happens because of climate”. Weather can change in a hour, it takes a hundred years to determine if the average climatic temperature has risen by a degree, while a weather front can change the temperature 5 degrees in 5 minutes. Yes, your confirmation bias regarding weather and climate is bizarre.
The real greenhouse effect. A blocking phenomenon that a decade or so ago temporarily raised temperatures above average in Siberia. An uncommon but recurring globally distributed event of variable proportions.
I’m going to with Anthony’s prior post on this heat wave and the fact that satellite record shows no such heat (below 30-year average) on our globe for the past few months. Tell me for the first time how no global excess heat in the atmosphere can add 10% of an atmospheric heatwave.
But wait, there’s more. Yes, there has been some warming, although exaggerated. And you can’t just take whatever that warming is, say 1.5C and attribute that much to how high temps go during a heatwave. That isn’t how science, or indeed nature works. Finally, they are trying to pull a fast one, and attribute all, or most of that warming to man. Nope. That isn’t science either. The truth is, there is no proof that we are responsible for any of the warming. Quite possibly we have added some small amount, but it can’t be measured, nor would it matter in the slightest if it could because the effect is so small.
Global temperatures are down. Much of the northern hemisphere is experiencing cooler weather and most of the southern is below typical. Contrast this to years past when during the same months, temperatures were much warmer overall. Wouldn’t record temperatures due to global warming occur then instead of when the overall trend is lower temperatures. Global warming is not a case where a compressed spring is suddenly released and pours all its energy into one place. People would do well to learn a lot more about “catastrophe theory” in physics, which attempts to describe unstable equilibrium in chaotic systems. People often refer to the “butterfly effect” but have no idea what the rest of the theory is about. Global warming reduces instabilities while cooling increases. Expect more extreme weather events as the earth cools, not as it warms.
As a side note: In fusion energy, “catastrophe theory” rules.
Global average temps are down 0.7 C in 4 years. If the proposed warming is 1.0 C above the 30 year average, based on models, in reality it is only 0.3 if we assume there is an immediate effect. Now the Earth is about the same temperature as it was in the late 80’s.
Eh??
So you choose to go from an isolated peak high in 2017 to the current dip and come up with 0.7C cooling.
Do you really think that surface temps behave in such an erratic way?
Where we live and not a region aloft in the atmosphere?
Hint: look up any of the surface data series.
The Sat sensor data that is modelled to come up with UAH (let’s not forget it’s V6.0)
(Same data exactly that RSS use, and which is v near the surface warming trend),
are v sensitive to WV – which is why you see such exaggerated peaks/troughs that coincide with ENSO.
El Nino the peaks, La Niña the troughs with about a 6 month lag.
Try drawing a least squares mean through the graph.
That’s the AGW trend.
blob:https://wattsupwiththat.com/6dd74223-b513-429a-abd2-7e7a692a0de4
I’d suggest yo stop holding out on erratic ups/downs.
That is weather.
Cyclic NV that adds no long-term trend as it is energy in the climate system moving around.
Whatever “pauses” a certain lord may contrive are just that and when the Pacific returns to a warmer state again the “staircase” of warming will resume.
BTW: was a time when a cooler Pacific caused a cooling of GMSTs – now it can only manage a “pause”.
https://www.woodfortrees.org/graph/uah6/from:1979/to:2021/plot/uah6/from:1979/to:2021/trend
The peak of Super El Nino 2015-16 was in February 2016. It was no more isolated than prevous Super Los Ninos. Its peak heat was a tiny fraction of a degree warmer than Super El Nino of 1997-98. Hence, statistically insignificant warming for 18 years.
The fact is that, despite a strong El Nino in 2019, Earth has cooled for over five years, despite ever more CO2. Same as its temperature went sideways from 1998 to 2015.
UAH shows an increase of 0.14 C/decade over the multi-decadal upswing period in a cyclical varying sine-like wave with a slight secular upward trend. And that is far from an “AGW trend.” There is no actual proof that that a majority of that minor secular trend is AGW. The actual trend is a fraction of those of the UN IPCC CliSciFi models.
“There is no actual proof that that a majority of that minor secular trend is AGW. The actual trend is a fraction of those of the UN IPCC CliSciFi models.”
Really:
https://www.climate-lab-book.ac.uk/comparing-cmip5-observations/
Whoo-ha, Anthony. Your graph actually disproves your reliance on models.
1) Hindcasts over-drove volcanic cooling in the 1990s because they misunderstood and exaggerated radiative forcing.
2) Since 2000, the actual temperatures have leveled off, contrary to model predictions.
3) The only warming in the 21st Century occurred during a Super El Nino, which is now cooling off and you fail to show 2021 actual temperatures.
This is the problem with CliSciFi: They fail to show all the facts and uncertainties in order to present a an ideologically consistent narrative. Anything that doesn’t support the narrative is suppressed or denied. That is not science. Read their science without considering their conclusions. With both the IPCC and U.S. NCAs, the conclusions do not follow the science actually presented. I know; I’ve read them all. Why don’t you do a little critical reading?
Records of any kind are extreme values. All are made to be broken in time. They should be analyzed with extreme value statistics rather than normal statistics.
I’m going to go out on a limb here and suggest that the longer a time-series (with an infinite population) is sampled, the greater the probability that an extreme outlier will be encountered.
Clyde
I am pretty sure Willis provided the math behind the forecasting of the probability of encountering a “record” event. The Stats behind a “500 year” event are pretty standard because it is used so much in estimating the required size of a water storage dam.
Essentially the dam storage volume specification provides the basis of claiming the confidence that a specified flow rate can be guaranteed over a specified time. The input data is the flow rate of the river(s) supplying the dam. That data is used to forecast the high and low flows expected.
If the terms are 99% confidence that 200 cusecs will be available 24/7 for 50 years, the dam size is smaller than for 100 years, because of low rainfall expectations and the probability they will occur. When it is extended to 500 or 1000 years, the probabilities are recalculated based on the river flow variability (these days there may be 125 years of data). It is the projection (calculation?) of the likelihood of extreme events which feeds the reliability – flow demand – reserve – time period formulae that underlies their probability.
Nothing I have see so far is up the the standard required for a Master’s thesis in Statistics. It is little more than “Hot day = global warming caused by people driving SUV’s.”
Clyde, excellent intuition. The function Ln N would approximate such a proposition if the series is more or less random. It has been used to analyze successive snowfall, flood height records, etc. The conditions for weather series is far from perfect but you do get Ln N type results.
For perfectly randomized series, one can see that new records become few and far between rather quickly. eg: for 200yrs Ln 200=5 successive records.
*Ln 400=6 successive records
* LN 1000 =7 successive records.
The drawback is you have to count the first data point as a record.
Diamond size distribution in a diamond pipe is somewhat similar to what you describe. A 1c cut gem diamond is ~one in a million (you need a 2c rough), a 2ct cut is one in ~ 5 million stones and a 3ct one in 15 million. The cullinan diamond was over 3000ct found over 100yrs ago. Several times over more diamonds have been mined since it was found.
The bottom line is, the whole climate change scam is based on false premises. When you start with faulty assumptions, and wear glasses that only let you see things in certain ways, the odds of coming up with anything true or useful are slim to none, and Slim left town several decades ago…
The “document” itself is simply another example of academic fraud. The authors need to face disciplinary actions. Yeah, right.
The global temperature has dropped ~.5 is the last year. It is only this temperature (and not some trend extrapolation) that could have influenced the conditions at the time of the heat wave.
Just another demonstration that “A Disgrace to the Profession” applies not just to Mann but that the disease is rampant in the scientific community. Science must police itself or lose its lofty and credible standing.
It did already.
These hacks are so biased they can’t even see their own contradictions.
Reminds me of the papers that claimed the models would be correct if you ignore internal variability. Those of us who pointed out that confirms the skeptic argument about the dominance of natural variation got them to stop doing that. I still get the “it averages out” argument from those papers though.
“Scientists, in their professional roles, should never become advocates for politicized viewpoints or actions.”
I respect Cliff Mass for his truth-seeking scientific rigor and the analytical skills he brings to analysis of complex meteorological conditions . It’s already got him in trouble with a radio station that dismissed him for not hyping the cause.
In the quote above, he seems unaware that the corruption of science is very well advanced (all global universities, scientific institutions, UN, journals, professional societies, gov, MSM…) It should trigger suspicions about the whole anthropo warming “Crisis” being a clear and present danger caused by human activity emissions of CO2.
The behavior of the authors of the heatwave analysis has been the norm for several decades. Does Cliff know about Climategate, the constant manipulations of Temperature series to ‘cool the past’ and to ‘warm the present using what CO2 control knob theory says the temperatures SHOULD be, the constant changing of goalposts when former temperature forecasts have proved to be 300% too high? Does he know that New Zealands temperature adjustments were so outrageous that a successful lawsuit resulted in the weather authority admitting that the official record is not fit for use in climate analysis.
Does he know that UNFCC heads have already owned up to a centrally planned political rationale for the climate change putsch.
Yeah, it’s warmed a bit (and thank God!) since the goalposts have been shifted back to the end of LIA. But, before massive T adjustments, most of the warming had occurred before 1940 when contribution of anthro CO2 was not significant.
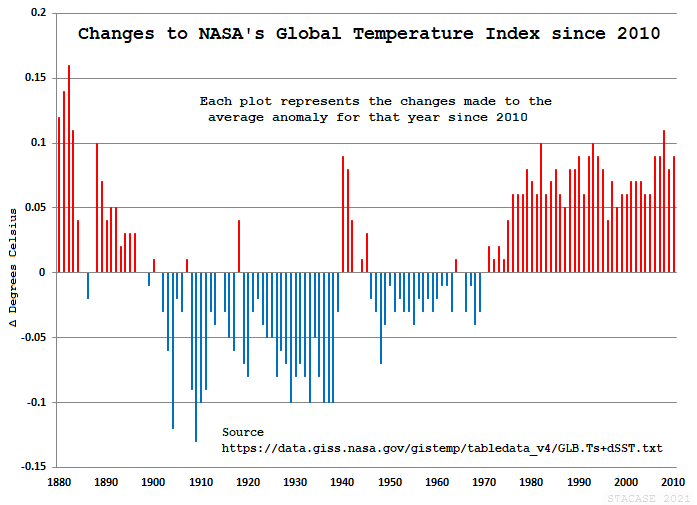
Does Cliff know about Climategate, the constant manipulations of Temperature series to ‘cool the past’ and to ‘warm the present ….
Funny that you mentioned that, GISTEMP just released their Land Ocean Temperature Index, LOTI for June 2021. Compared to May 2021 there were 348 changes made to the 1685 monthly entries going back to 1880. All of the 91 changes from 1973 to 2017 were positive. There were 16 changes since 2017 that were negative. Of the changes made prior to 1973, 221 were negative and 20 were positive. Plotted out the pattern of “Cool the Past, Warm the Present” (CTPWTP) is like the field marks for the Bald Eagle, i.e., “Unmistakable”
Here’s how a plot of that looks comparing LOTI from 2010 to the 2020 data:
“….. the constant manipulations of Temperature series to ‘cool the past’ and to ‘warm the present ….”
And then we have GISS Global ….
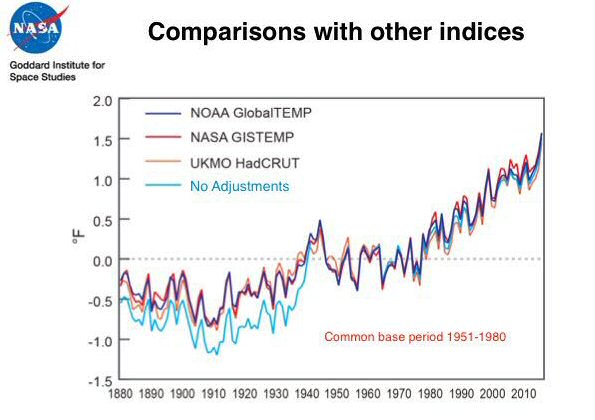
Which shows the opposite.
The past has been warmed NOT “cool the past”, such that the warming trend is lessened.
There is after all a tad more to the Globe that the US.
Any chart that does not show the Early Twentieth Century to be just as warm as today is a bogus, bastardized, instrument-era, computer-generated distortion of the temperature record.
What do you know, all the distortions, have the same profile.
All the unmodified, regional charts of the world show a completely different temperature profile than the bogus Hockey Sticks. The regional charts show it was just as warm in the Early Twentieth Century as it is today, which means no unprecedented warming casued by CO2.
Hansen 1999:
Australia regional chart (just in case you want to claim the U.S. only represents a small portion of the Earth):
They don’t look anything like the bogus Hockey Stick chart, do they. There are lots of regional charts that show the same profile as the U.S. chart. None of them show the profile of the bogus Hockey Stick chart. Why do you think that is?
Sorry, you reply does not appear to address my point.
Which is that the global temp series has been adjusted to raise past temperatures and not cool it, thereby reducing the Global warming trend of AGW.
Yes we know that the US was hot in the 1930’s thanks.
http://www.bom.gov.au/state-of-the-climate/images/2020/figures/SoTC2020_aag_AusTemp.png
AS I’ve said most of AGW is being seen in warmer nigh-time minima.
Because excess heat in the day is convected high into the atmosphere and thus spread over a massive volume of air.
So, as the above shows – mean temps are rising.
Oh, and for some reason you US temps graph is missing the last 20 years ….

“Because excess heat in the day is convected high into the atmosphere and thus spread over a massive volume of air.” Since your “excess heat in the day” is not reflected in the observations, your “theory” fails.
Misdirection: Not the U.S.; his example is for NASA global LOTI. Also, you didn’t address his criticism of NASA adjustments.
I’ll address the criticism of NASA adjustments now…NASA only adjusts for the urban heat island effect. You can turn this adjustment on/off by deactivating step 2 in the code. It turns out that it doesn’t make a significant difference either way. I’ve done it. No other adjustments are done by NASA or the GISTEMP code itself. You can download the GISTEMP source code here, review it and run it on your own machine and see for yourself. It even downloads the necessary inputs on a daily basis for you. You can literally have it running in a matter of minutes.
I didn’t mean to.
But I will if you want me to?
I addressed the “the constant manipulations of Temperature series to ‘cool the past’ and to ‘warm the present ….” allegation.
To show that it was false.
The G in AGW is important because of regional differences caused by NV dominated by ocean currents.
The Global graph shows that temps haven’t been adjusted to increase the warming trend.
The opposite in fact.
None of this adjustment argument matters either way. Only after satellites since the end of the 1970s have we had accurate global coverage, especially UAH. Only after ARGO from the early 2000s do we have accurate global coverage of the oceans, especially at depth.
CO2 significantly increased in the late 20th Century and the 21st Century, coinciding with satellite coverage beginning in the late 20th Century and ARGO in the 21st Century. We now have good atmospheric and global ocean data to compare to models of the climatic impact of CO2’s increasing atmospheric concentrations.
To date, radiosondes, satellites and ARGO confirm CMIP3, 4 and 5 model series greatly overestimate CO2’s warming effect. It became apparent that the CMIP5 models were running so hot that the UN IPCC CliSciFi AR5 had to arbitrarily reduce medium-term model projections. The UN IPCC CliSciFi practitioners are so morally corrupt that they didn’t reduce the unrealistic long term model warming estimates.
Additionally, the UN IPCC CliSciFi practitioners prove their corruption by labeling RCP8.5 as “business as usual.” All of the CliSciFi practitioners were informed numerous times that RCP8.5 was both physically and economically improbable and the assumptions use to develop it were beyond reasonable projections. History has proven that RCP8.5 is in gross error, an error continued in CMIP6 and AR6 drafts.
“None of this adjustment argument matters either way. Only after satellites since the end of the 1970s have we had accurate global coverage, especially UAH.”
OK
So by that reckoning.
We can’t be sure of the MWP
The LIA the RWP??
The usual self-consistency employed here.
UAH (lets not forget the many corrections to arrive at V6.0!)
Is not the SURFACE.
Where projections are made for.
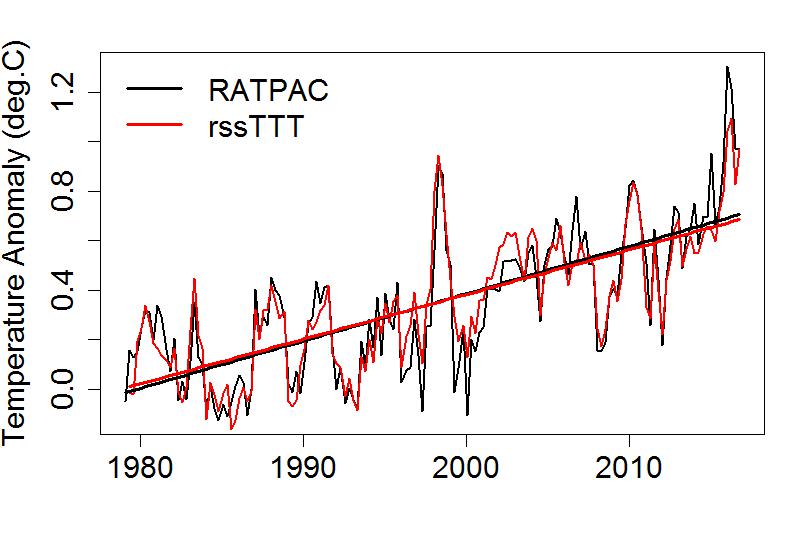
“To date, radiosondes, satellites and ARGO confirm CMIP3, 4 and 5 model series greatly overestimate CO2’s warming effect.”
They don’t because UAH V6 (V5.6 was OK) underestimates RATPAC radiosondes…

Whereas RSS doesn’t (it’s trend being similar the the Surface indices ….
And also you statements mean that climate scientists are.
Incompetent.
Frauds and scammers.
The obvious answer….
They know more than you.
Because you only come here and to other contrarian Blogs (?) for your climate “Science”.
GCMs project atmospheric temperatures and they are grossly inflated; the non-existent hot spot, anyone?
RATPAC is not all radiosondes.
Your different graphs are mixing different physical parameters. Typical CliSciFi deception.
The warming trend from CMIP5 and CMIP6 from 1880-2020 is +0.08 and +0.07 C/decade. The observed rate was +0.07 C/decade. They also do a reasonable job of replicating the variation like what is observed with volcanic eruptions.
So how exactly are you defining “grossly inflated”?
Once you’ve provided the definition let’s apply it to contrarian models so that we can see how they compare. Does that sound fair?
CliSciFi GCMs totally miss the ups and downs of various decadal scale variations. They have had documentation of these ups and downs and still fail to reproduce them in their hindcasts. It is a trivial exercise to match a long-term (140-year) trend by adjusting parameters so as to smooth over the ups and downs.
Something is seriously wrong in the “physics” of the various models, especially considering their non-existent tropospheric hot spot and the fact that their average global temperatures vary by 3 C from model to model, among many other documented weaknesses.
Ten years ago, all of these differences were zero. What happened in the last ten years that caused the past to be cooler and the present to be warmer? B.S. handwaving does not cut it. Sciencey-sounding verbiage does not justify what we see.
I’m surprised it was only 348 changes. If you modify the gio.py file to output more decimal places you’ll likely see more than 348 changes when comparing updates from different months. This is because the GISTEMP code reprocess all months all over again each time it runs. And since the ERSST and GHCN-M inputs themselves are updated with observations on a daily basis often months, years, or even decades old you’ll get a slightly different result each time it runs. Even today there are large record digitization efforts still underway so the source repositories are anything but static. That’s a good a thing. We want that. And the adjustments (that aren’t even made by NASA) for station moves, time of observation changes, instrument changes, and other non-climatic change points are also a good thing. We want that too even if it means that we have to accept that the planet didn’t warm as much as what the unadjusted data suggests.
The adjustments are unnecessary and they enable a lie to be perpetrated on unsuspecting people.
Nothing good comes out of lying about a climate crisis, like the alarmists are doing.
The adjustments are necessary to address known errors and biases. Not doing the adjustments would be unethical at best and would rise to lying at worst if you didn’t disclose that errors and biases were contaminating the dataset even though you knew about them. It would be no different than submitting an instrument for NIST certification and getting it back with no calibration necessary even the technician discovered a bias.
Just use radiosondes, UAH6 and ARGO and you don’t need to adjust anything for assumed past errors. RSS was adjusted to conform to CliSciFi biases.
I only rely on UAH6 and ARGO for analysis purposes. The rest are prone to error and are not useful for climate work; too many guesses and changes. The UN IPCC CliSciFi practitioners and all its enablers have been caught playing fast and loose too many times to ever be believed again.
Have you actually read the U.S. National Assessments? Pure evasions, lies and propaganda. The wording of the UN IPCC reports is obtuse and evasive, having many summary statements unsupported by the scientific material. I have written and reviewed many scientific, engineering and economic reports and can say that the material from CliSciFi would be laughed out of any serious endeavor.
You should be more skeptical and incorporate all available data into your analysis.
Unreliable data is worse than no data at all. Radiosonde, satellite and ARGO data are the only reliable data available.
How do you know they are reliable?
How close to “true” are they?
Much better than the earlier data.
How do you know?
They don’t need ad hoc adjustments.
Yes they do. Some datasets like ARGO and USCRN may be less impacted by biases by design, but they aren’t completely immune. Nevermind the obvious problem that they are only available after the 2000’s.
So what dataset do you use for pre-2000 analysis and how do you know it is reliable?
Average radiosondes from 1958, the approximate beginning of Man’s possible impact on the weather. Satellites since the 1970s, the beginning of the latest (current?) cyclical upswing in global average temperatures. ARGO for over 15 years, coinciding with the peak and pause in the latest cyclical upswing in average temperatures. They all look pretty good to me.
Analysis varied but before AGW became a political thing in the 80s, at least one study of the widely acknowledge cooling from the late 40’s until the mid to late 70s was 1 degree C. Some others concluded somewhat less but still possibly as much cooling as the early 20th century warming.
The United States cooled by 2.5C from 1934 to the 1970’s. See the U.S surface temperature chart above.
Then look at the other chart above that shows the changes that have been made to the bogus Hockey Stick chart. Compare the 1970’s on that chart to the 1970’s on the Hansen 1999 U.S. chart.
The Hansen chart shows the 1970’s to be just as cold as the 1910’s. The bogus Hockey Stick shows the 1910’s to be much cooler than the 1970’s. More data manipulation to cool the past and warm the present.
The Data Manipulators are lying to billions of people.
That chart does not contain the adjustments for station moves, instrument changes, time of observation changes, and other non-climate changes. You tell us…by not disclosing this in your post are you being truthful?
Are you talking about the Hansen 1999 chart?
Don’t you think Hansen knows how to record the correct temperature? Do I have to prove he did it correctly? Is that what you are saying?
Hansen’s high temperature in 1934, which he says was 0.5C warmer than 1998, is corroborated by one of his colleagues in the Climategate emails, who had similar readings.
The Hansen 1999 US chart is the chart with minimum data manipulation by the alarmist data manipulators, which includes Hansen, but the 1999 chart comes before the massive data manipulations carried out by the promoters of human-caused climate change.
That’s why I use Hansen 1999. It shows the real temperature profile of the Early Twentieth Century, and its temperature profile looks like all the other unmodified regional temperature charts from around the world. We just got a chart of Japan showing no warming since the Early Twenthieth Century They all show there is no unprecedented warming today since the Early Twentieth Century was just as warm as today.
As far as that goes, the Data Manipulators themselves show the 1880’s as being just as warm as today, so the 1880’s along with the 1930’s both put the lie to unprecedented warming the alarmists claim we are experiencing today.
It’s not true. It’s been just as warm in the recent past as it is today. CO2 is a minor player in the Earth’s temperatures.
There’s nothing unprecedented going on here. Other than the Huge lie being foisted on the world that we are living in the warmest time in human history because of CO2. It’s a provable distortion of the facts.
That chart uses the qcu file from GHCN. Hansen does NOT in anyway record, collect, collate, etc. the observations. All his GISTEMP program does is compute regional and global mean temperatures from the observations provided by another party. The qcu file contains the unadjusted data which is contaminated by non-climatic biases like station moves, instrument changes, time-of-observation changes, etc. I believe it was the early 2000’s when GISTEMP switched to the qcf file which contains the corrections. It is unfortunate that the qcu file was contaminated so heavily by these biases, but people back then didn’t realize the station records would be used to track the CONUS (and global) mean temperature trends and so didn’t focus on guarding against non-climatic bias like these. The next best thing that GISTEMP can do is to use the qcf file to provide a better picture of what the true trends are.
Can you post a link to a dataset that is immune from bias contamination that shows it being as warm in the 1880’s as it is today?
This is why I advocate only using radiosonde averages, UAH6 and ARGO to detect climate change related to CO2 concentrations. They don’t need adjustments and can be compared to contemporary analyses using measured CO2 and aerosol concentrations. Everything else is speculation based on cherry-picked parameters.
Those need adjustments too. No dataset is immune from contamination from bias…none. There may be some that are less prone like ARGO and USCRN, but they aren’t completely immune and they only start in the early 2000’s. And UAH is probably THE most heavily adjusted dataset of them all. In fact, they don’t even measure the temperature directly. They have to use a complex model to map microwave emissions from O2 molecules into meaningful temperatures. They then have to use another model to make adjustments for satellite drift, satellite orbit decay, and various other biases. Then on top of that UAH has had a history of making errors so egregious it changed the trend by 0.10C/decade.
Don’t hear what I’m not saying. I’m not saying UAH or any dataset isn’t useful. They are. It’s just that you shouldn’t put all of your eggs in one basket. My advice…be a lot more skeptical than you come across here.
I’ll repeat my previous question, but reword it to drive home a point. Which dataset are you using to eliminate the possibility that the Earth warmed at a rate of +0.30 C/decade from 1880 to present?
Ridiculous question. If it were +0.30 C/decade from 1880 to present, the world would be over 4 C warmer. We know it isn’t, so move on.
My problem is with believing that we can know past temperatures on all remote land and the entire oceans to a hundredth of a degree. Average radiosondes, satellites and ARGO are fairly accurate and are more useful than prior data sets for determining the climatic impacts of increasing CO2. Why go back in time to study something for which we have current and fairly accurate data?
So in one sentence you say we know it didn’t warm 4C. Then in the next you say or at least insinuate that we can’t know. So which is it? Do you know or not? And if you are sure the planet didn’t warm by 4C then which dataset are you using to falsify that hypothesis?
“As a result of the media’s failure, millions of people were misinformed about the heatwave and its connection with global warming. And such poor information undermines society’s ability to deal with climate change.” I stopped reading there… what climate change is there to deal with that hasn’t been going on for millions of years?
Even if all the changes are due to natural variation, some are quite disruptive, even devastatingly destructive, as history repeatedly demonstrates. It is possible to buffer the effects of these changes on societies but that will not happen if you are guarding one direction, spear poised to defend against an imaginary dragon, while the hungry bear lumbers up behind you.
In NZ, it’s not that the MSM are _unable_ to report accurately, they literally came out and told us they _will not_ report with any balance on climate change.
Stuff NZ are a disgrace
John Daley visited Death Valley
http://www.john-daly.com/picsl/dv.htm
and had some thoughts, particularly about the Badwater Weather station.
“the media in their news reporting must strive to avoid political advocacy and communicate truth”
Well that ship is lost at sea…
everyone keeps talking about the “media” and their bias…the “media” is owned by someone….as with any company, the company acts as the owner requires/demands. MSNBC/CNN/ which ever newspaper or magazine…they say/print what the owner (those billionaires) demand…those talking heads on a TV screen only read what is put in the teleprompter….and those billionaires have an agenda…great wealth brings power and power brings greed for more….both wealth and power…so what is the agenda of the Rich and Powerful to promote the AGW??? Science be damned…that has nothing to do with the reporting.
This is a good example of something that’s been rattling around in my brain for a few months.
This site is an excellent repository of outlandish claims related to climate issues, but I see some value in distinguishing the outrageous claims of climate scientist from those of the media.
To be sure, there’s a long list of claims emanating from scientists that are irresponsible, misleading and sometimes outright false, But it is my impression that the truly outrageous claims arise from the keyboards of the media. How many times have we seen some outrageous claim, purportedly backed up by a scientific paper, and the theme of the posting at WUWT is that the claim is nowhere supported in the paper?
The Northwest heat wave was a newsworthy event, but responsible coverage would have mentioned climate change by at most a sidebar paragraph, not as the central theme of the story.
I understand when many here use the term climate science in a pejorative sense, but in many cases it is an irresponsible media, fueled by a desire to promote a narrative, and the lack of science knowledge precluding them from realizing that their statements are nonsense.
And don’t get me started on the political class — I haven’t yet decided whether they are equally to blame with the media, or even worse.
“Both statements can not be true. You can’t be uncertain and certain at the same time.”
Actually they can both be true. If the choices are between “this might happen naturally once every 10,000 years” or “this might happen naturally once every 500,000 years” then both of those are ‘virtually impossible’ while still being hard to quantify exactly how rare.
Black swan events.
This is fun!
Black swans are evolving to be part of the fun loving surfie society on Queensland’s Gold Coast.
These Black Swan events are becoming more common as more people risk camera damage from sea water – is this yet another confounding covariable for rare events statistic analysis..
Geoff S