Reposted from the Cliff Mass Weather Blog
If you are living west of the Cascade crest of Oregon and Washington, tomorrow will be a day you will never forget.
The latest model runs, all at very high resolution, show even more profound extremes than previously predicted. And the end of the event will be extraordinary, with temperatures falling by as much as 50F within a few hours.

Records Already Broken
Many records fell yesterday, including a new all-time high temperature at Portland (108F) and daily or monthly records falling at dozens of stations. But his is nothing compared to what will happen now.
Situation Right Now (Noon Sunday)
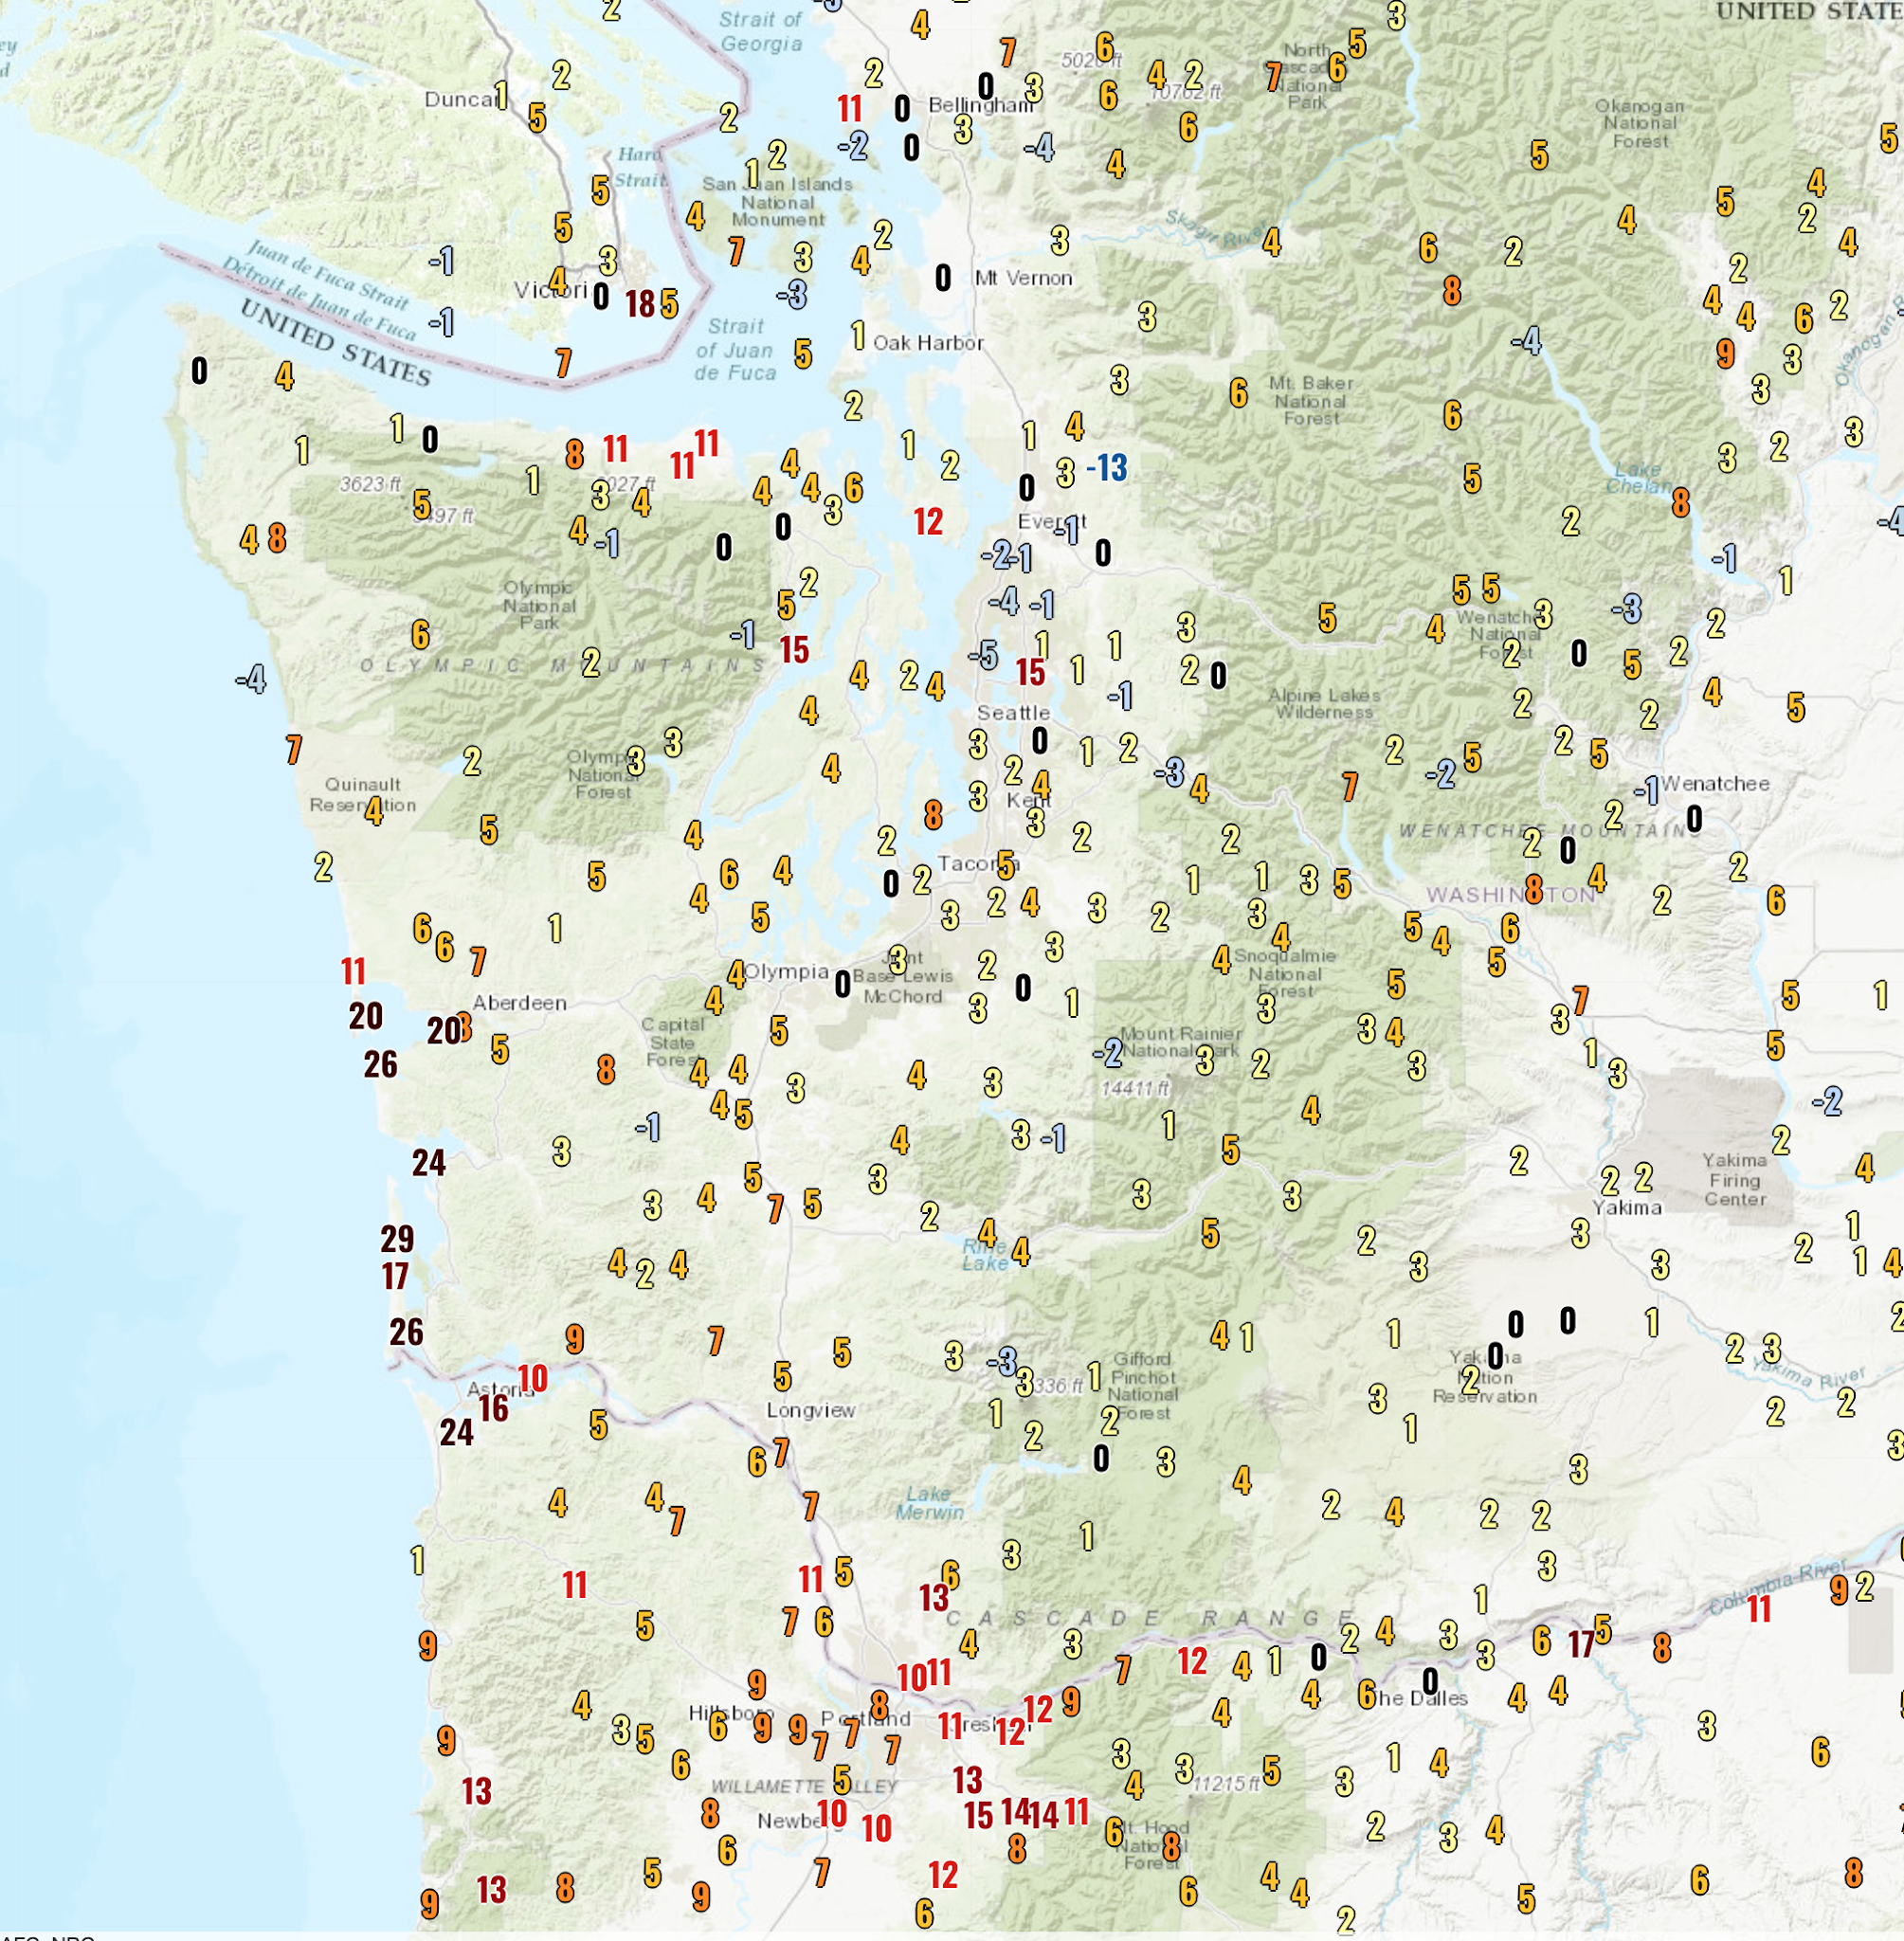
A fascinating plot (below, click on image to expand) shows you the 24-h temperature change–how we stack up temperature-wise compared to exactly one day ago.
Along the SW WA coast, some locations are 15-30F warmer, because of the switch to easterly (from east) winds–pushing away the cool, ocean air. But look at the Portland area…many locations are 10-15F warmer because of increased offshore flow, with the air warming by compression as it sinks over the western slopes of the Cascades.

The new 108F record at Portland is going to be OBLITERATED today. 115F is quite possible.
But north of Seattle temperatures were a bit cooler.
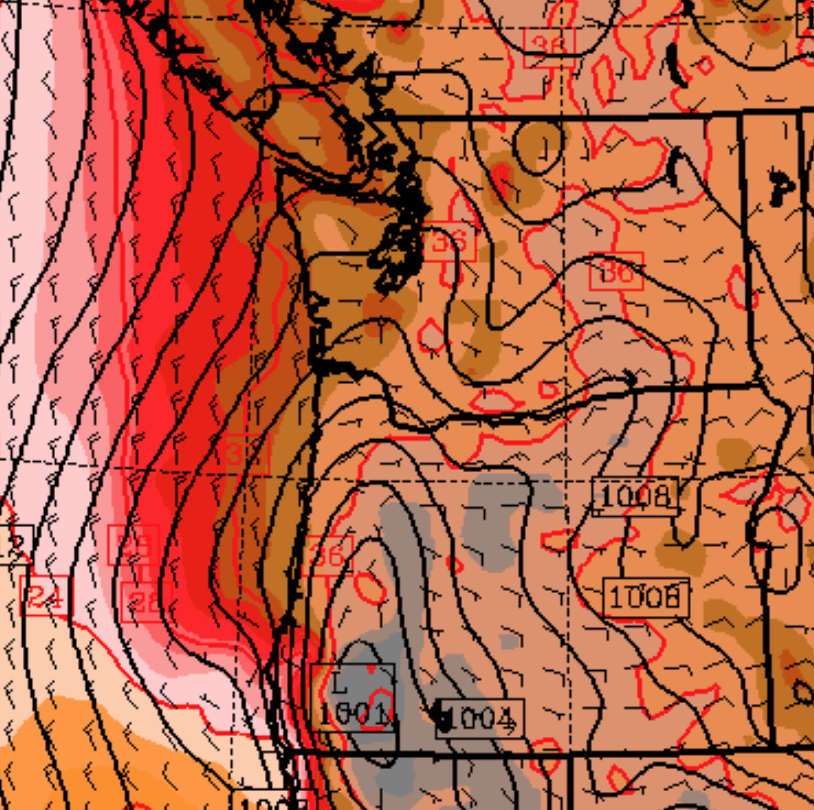
Ironically, it is connected with the warmth along the coast and around Portland! To explain, here is the forecast sea-level pressure map at 5 PM today. You can see the low-level winds and lines of constant pressure (isobars). You will also notice an area of low pressure–the thermal trough--centered in the Willamette Valley. It is the result of warm air produced by easterly flow descending the western Cascade slopes. With low pressure to the south and high pressure to the north, the thermal trough produced northerly winds over the Puget Sound, with the air cooled as it moved over cooler water to the north.

But that low pressure is going to move northward overnight and Puget Sound will be “enjoy” the torrid conditions now burning Portland.
Here is the latest temperature forecast for 5 PM today. You can see the very warm conditions around Portland (dark brown is 109-112) and you will see very warm conditions along the lower western slopes of the central Washington Cascades and nearby lowlands. Near the water around Seattle near the water, it will ONLY be the upper 90s.

Tomorrow: The Day of Unimaginable Extremes
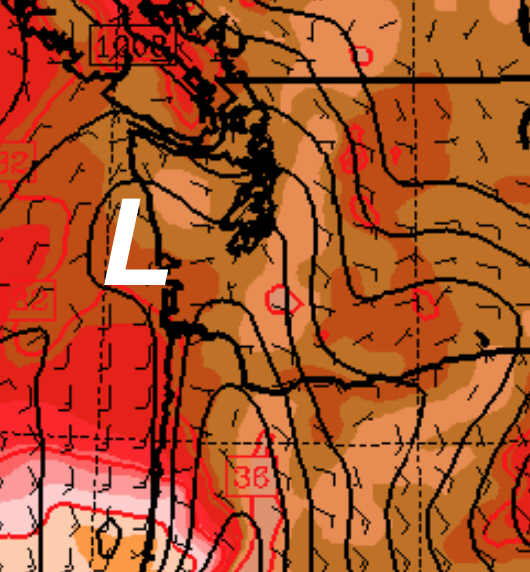
But tomorrow, it all goes horribly wrong. The thermal trough moves northward and westward, pushing the strong easterly, downslope flow northward to over the central Cascades (see map for 11 AM Monday). The sinking air will compress/warm as it sinks.

The burst of downslope, compressional heating will cause temperatures to warm beyond the experience of any living inhabitant of the region (see forecast temperatures at 5 PM Monday). Temperatures will rise above 112F on the eastside of Puget Sound and above 100F for everyone more than a few miles from the water. Portland will be similarly warm. And so will the lower elevations of the Columbia Basin. Heat apocalypse. What more can be said?

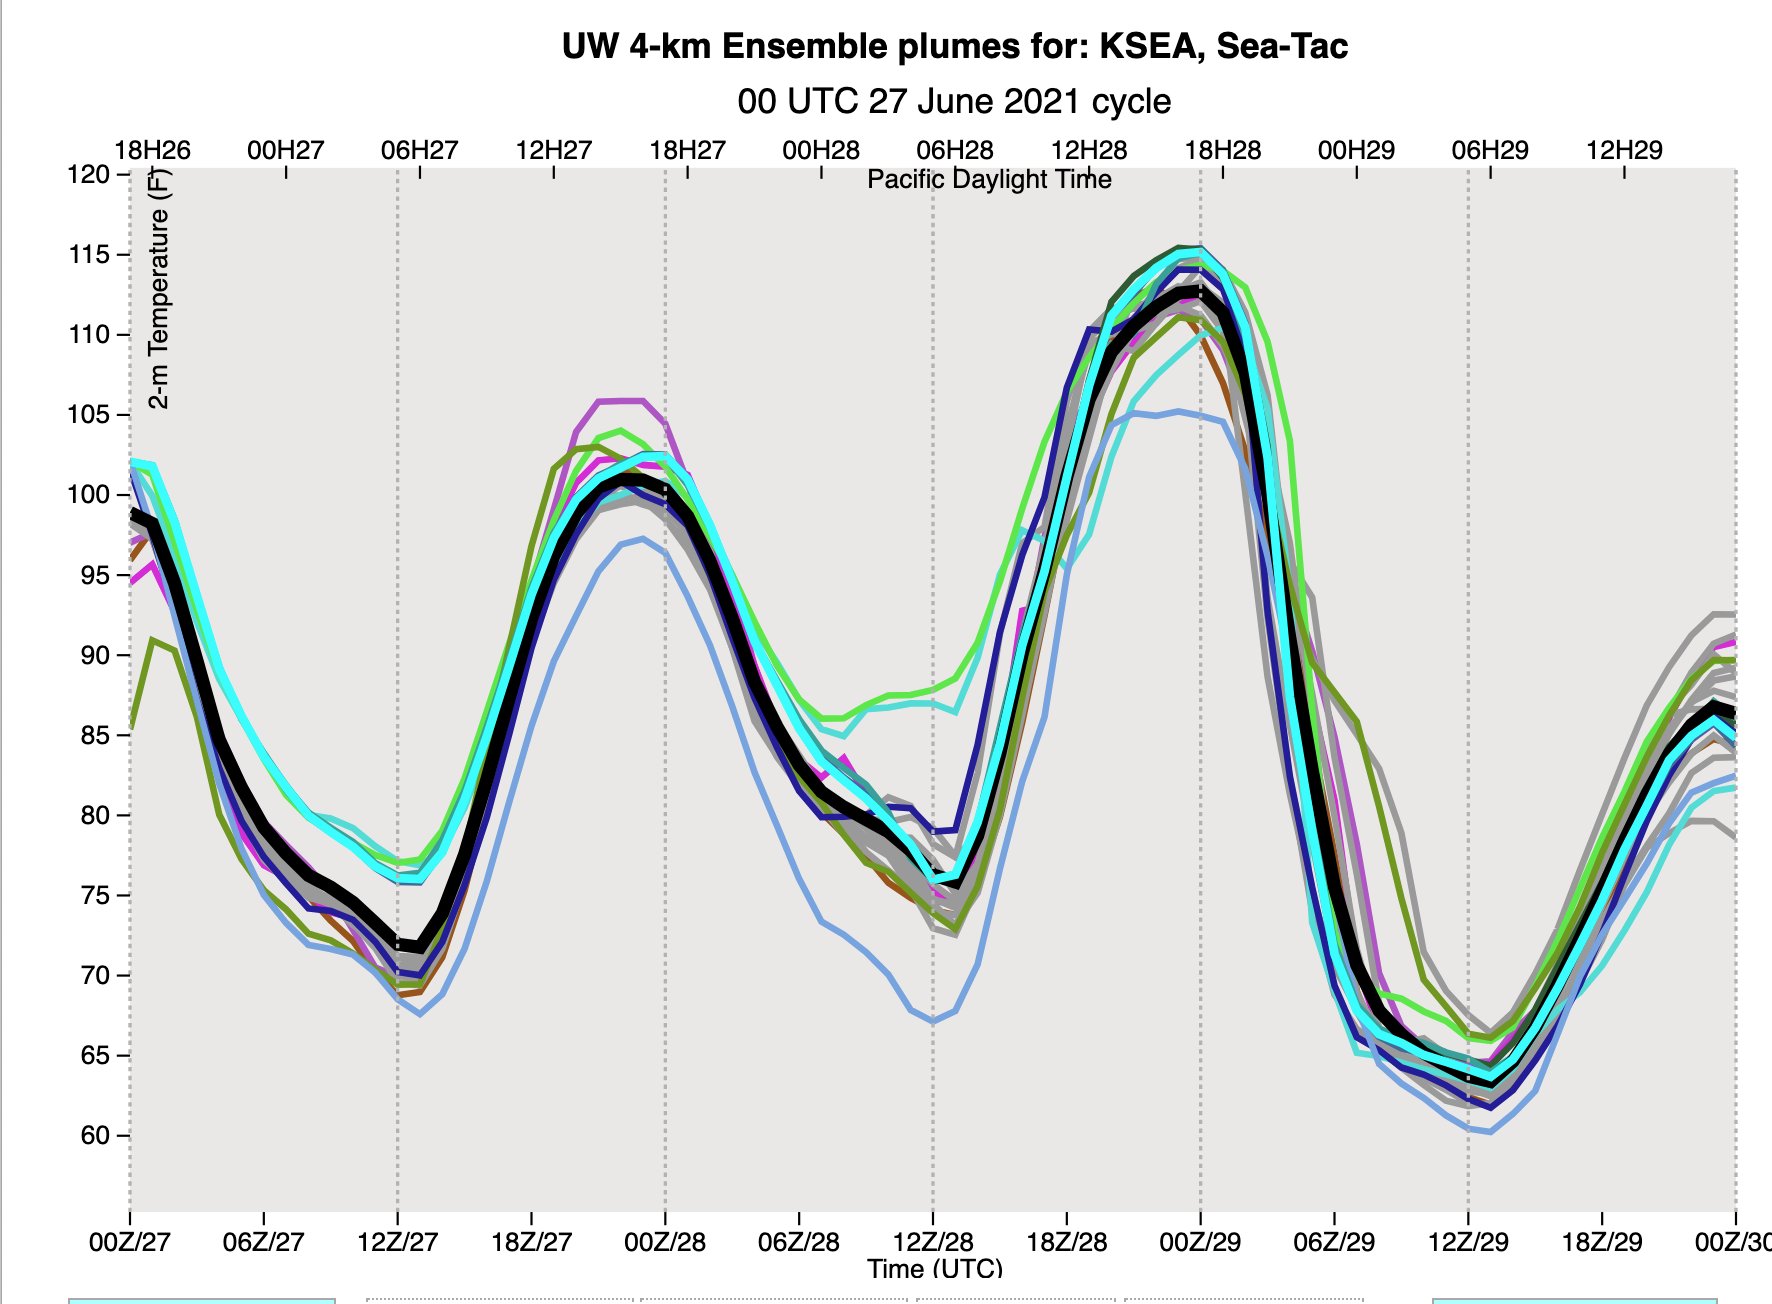
You all know that looking at one forecast is not good enough. We need to examine many (ensembles) to evaluate our confidence in the forecast. Well, here are the high-resolution ensemble temperature forecasts at SeaTac airport. Time is on the x-axis (00Z29 is 5 PM Monday). Nearly every model run is taking SeaTac to around 112F.

And there is more…..after the temperature peaks around 5 PM it plummets steeply, like an insane meteorological roller coaster. Some of you will be sweating in 110F temperates around dinner time, but looking for a light sweater around 6 AM.
The reasons for this profound shift? The thermal trough will begin to move eastward over the Cascades, with an onshore marine push bringing in cool air off the Pacific (see forecast map at 2 AM Tuesday, green and blue colors indicate cool temperatures)

It will still get warm on Tuesday (80s for many), but the savage heat will be broken. Good luck tomorrow. You will be talking about it for a long time.
This is the “perfect storm” producing extreme temperatures for our region. If you want to see how I feel, check out the video (go 60 seconds in) [I cued it up for the WUWT audience~cr]
I bet it’s not obliterated.
Records are always “oblitorated” , “SMASHED”, “destroyed” etc. etc. even if it’s only by the smallest recorded quantum of 1 degree F.
NO Cliff “all time” goes back a bit further than 100y or so of the Portland data record.
So downtown Portland ended up seeing a peak of 110F.
Seems the oh-so-objective Cliff Mass is getting a bit carried away with all the excitement.
Here is the early morning forecast from NWS, again hyping 116F peak for Monday, having overshot by 4 degrees yesterday.
Looks like PDX airport record only goes back to 1938. “All time” was not that long ago !
Greg,
Are these forecasts you produce really NWS? I know NWS is mentioned, but that is just as the issuer of a warning. The forecast comes from the Weatler Channel, weather.com; I canot find such a forecast on the NWS site.
There is a NWS forecast here which says 114F max.
The screen shot I provided shows 114F on hourly plot but 116F high. So I guess they expect a peak of 116F in the last hourly segment. It changes a bit form hour to hour anyway.
It’s interesting, I click on your link and see 106F “Last update 28 Jun 11:25 AM PDT ” . On the same page click on three day history and you find 28 Jun 10:53 am 98F
+8F in 30min seems unlikely , it’s generally warmed at 4 or 5F per hour.
Ah ha. They are rearranging the matrix !
I just got a screenshot of the 3day with 106 at 11:50am and 105 at 11:53 ( that 53min being the usual reporting time ). 10s after I saved the screeny, the rogue 106 evaporated with a pushed screen update.
Wow, I just refreshed the other page ( your link ) and “106F at 11:50am” is now reading “102F at 28 Jun 11:35 AM PDT”

They are screwing around with the “data” big time.
Now we have a bonus data point: 28 Jun 12:05 pm 108 [F]
ie +3F in 12min. Someone is scrabbling around to “fix” the data. How can we even believe this crap?
Hop! It’s gone again. WTF?
Now the rogue 108F at 12:05 is on the “current conditions” page. I wonder how long that will last?

Now we have the same temperature from 12:05 labelled as 12:25

They’re just making this up as they go along.
All those are quite possibly true. At BoM they have a system for posting readings at regular intervals (30 min) with “bonus” values if the computer thinks something is happening that you would like to know about at intermediate times (usually a cool change here). The bonus values can be temporary; they just help you track recent events. It looks like the regular spacing at PDX is hourly at x.53.
You need to damp down the conspiracy stuff. They don’t actually have a nimble-fingered army making it up as they go along.
So I’m supposed to conclude that it was a computer algo which entered an improbable 8deg rise in 30min, then shifted it out to a 1h interval , then disappeared it altogether ?
Not buying it. That’s inept human fiddling. To what ends I don’t know but it’s certainly is not objective, automated data logging.
I never suggested an army of anything. Probably just one blundering idiot. Saying the magic word CT never proves anything and reveals a total absence of any coherent argument or point.
As I commented above, that “latest update” at 11:50 disappeared and was replaced with a “latest update” at 11:35 , the same 106F made a fleeting presense in the 3d history before being rubbed and replaced by 108F at 12;05, which equally disappeared a short time later. Both those were irregular entries in that log which normally only contains xx:53 data entries.
Here is a composite of three successive snaps of the “current conditions” page.
Note the temperature barely moved over the hour despite wind speed more than doubling, humidity dropping and air pressure moving. All that after the improbable +8F in 30min rise which originally caught my eye.
None of that is consistent with automatic data logging or algorithmic changes. Someone is manually fiddling with the data record.
Greg, I agree something looks suspect as I was watching 5 cities throughout the day and noticed the same. Check out Pasco, WA. The history log never records 114 taken at the 53 hourly mark but instead shows the highest temperature at 111. Seems unlikely that within one hour’s time the temperature would rise 3 degrees and fall 3 degrees where it remained 111 the hour before. Odd to say the least.
Yeah, there’s no acknowledgement that he told us last week that models predicted 120F/49C for Sunday. He did at the time say that if they’re wrong then there’s something radically wrong with the models. Crickets on that.
Now it’s “115F is quite possible”, and we’re looking at multiple models to make sure we get it right. Umm, no Cliff, you got it wrong on Saturday. You got it wrong on Sunday. I’ll “project” that you’re getting it wrong again today.
“Heat apocalypse. What more can be said?”
Objective, my a$$.
I dropped a comment on his blog saying it would be good to have a comparison of the forecasts to recorded data, in order to check back on the accuracy of the models.
For some reason he has chosen not publish that comment, despite other more recent comments appearing. ( It’s seems everything is held back for approval ).
He is nowhere near as objective as he claims ( despite not being a warmist ). He involved in modelling, clearly favours and has an unreasonable degree of confidence in them.
Then is not interested in subsequent validation of results.
I saw that comment of yours. Are you quite sure it didn’t go through?
many thanks, I’ll check back. Maybe it’s been cleared.
Yes, apparently it posted as “unknown” despite my using my blogspot details to post. That’s why I didn’t see it when searching.
Apologies to Cliff for my thinking he had not posted it.
Now let’s hope he follows up on the suggestion. It’s important to see how good or bad the models are.
Well they’ve apparently already conceded that the 115F/46C prediction was another exaggeration and won’t come to pass. TWC is calling for 111F/44C (as of 2:30pm PDT)
So it’s a hat trick of exaggerated failed predictions.
According to NWS, it was 115F at Portland at 3.53pm
So you’re claiming that The Weather Channel feed is reporting 6F low? Or are you talking about the temperature on the tarmac at PDX?
Here’s the screen shot from 4pm PDT
NWS reported 115F at PDX at 3.53 pm. That was also the max. Both other Portland locations reported a 114F max. I have posted their table for OR and WA below here
Nick,
As always you miss (or pretend to miss) the point.
I never said that there wasn’t an unusual heat wave in Portland.
My point has been that there has been systematic over-prediction and far-in-advance hyping of unusual conditions that are inaccurately attributed to “climate change”.
The feed from TWS predicted 115F for Monday’s high at the GPS location that they use if you look up Portland Oregon. But at that location, it topped out at 111F very briefly. Overestimated by 4F. Similar to what happened on Sunday and on Saturday.
Now if you could camp out at the airport weather station, I don’t know what temperature TWS would have predicted for that GPS location or would have shown as current conditions at 3:53pm, so I have no data to comment with any assurance, but my guess is it would have been predicting 119F and topping out at 115F.
According to our objective Cliff Mass, when he started hyping this last week, the models predicted 120F on Sunday. But it did not come close to that.
Maybe The Weather Channel is systematically underestimating current conditions but getting predictions perfectly? Would that be your explanation? Or are you accusing me of lying?
“As always you miss (or pretend to miss) the point.”
The point is that you said:
“Well they’ve apparently already conceded that the 115F/46C prediction was another exaggeration and won’t come to pass.”
and I pointed out that it did come to pass. There is value in getting these simple facts right.
The OR record might be beaten by one degree F tomorrow and WA’s tied, if, as forecast, the Columbia Basin hits 118. So whatever might be the case in Portland and Seattle, state records won’t be obliterated.
OR’s now official record dates to 1939 and WA’s most recently to 1961, tying the previous record. So hardly unprecedented. OR’s record used to be 119 at Pendleton in 1898, but that was recently disallowed as unreliable.
Portland’s previous record was 107F. It’s currently 115F there.
Has nothing to do with “global warming”. The baseline is maybe one degree F warmer than when the prior records were set. All the other heat is from a jet stream weather event.
The Dalles did reach 118F
No, it didn’t. OR state record as of today is still 117 F.
Some still accept the 1898 record in my birth city of Pendleton of 199 F, but the state recently opted for the multiple record of 117 F, equalled yet again today, as in 1939 and years before.
https://en.wikipedia.org/wiki/U.S._state_and_territory_temperature_extremes
On the 1898 date, some thermometers in Pendleton registered 124. My grandparents said they believed it. There were also wheat field fires that day east of twon, ie in the direction of their sheep ranches and wheat farms.
Here’s how it ended up: Seattle and Portland beat their records, but Oregon and Washington tied their state records, dating back decades, and with previous multiple ties. BC and Canada however beat their records by one degree, ie 116 at Lytton, BC.
That’s the summary for the heat wave of 2021.
“BC and Canada however beat their records by one degree, ie 116 at Lytton, BC.”
No, there was more. Lytton at 118 F on Tuesday.
Oops, that was Monday. Tuesday’s reading was 121 F. That beats the old record by 6 F.
I am just SW of Portland (about 15 miles) at an elevation of 550′.
Highest temp so far was 109.5 F. People not far away, lower elevations and closer to or in the concrete jungle of the town (Newberg) below us are seeing 111, and the odd 112F.
Are any of those Stevenson screen readings , or themometers on south facing brick walls ?
In Seattle we get late sun on the north face of bldgs, some show highly exaggerated readings.
On the north face? My house faces North/South, there is no late sun on the north side.
We say the sun rises in the east, but in the long summer days with >12h sunlight it rises a fair bit north of east and sets somewhat north of due west.
It is possible to get glasing incidence on a north facing wall as long as there is not masking by trees or buildings of low elevation sun at these times.
Daylight at 45N is about 6am to 10pm on 21 June.
At Fairbanks, Alsaska it rises and sets a mere 15 deg from due north !
This helps visualize it: https://gml.noaa.gov/grad/solcalc/
G’Day Yooper,
Many thanks for the link.
My phone uses the Weather Channel and it didn’t exceed 108F, but apparently it reached 112F at the airport. At least it’s dry.
Airports are well maintained but often not homologised, or are low quality weather stations. They are there to measure air temp on the tarmac for pilots to calculate lift. They are NOT there to give reliable climate records.
For example they may be down wind of the run way or affected by jet exhaust of passing aircraft.
By design they are CLOSE to the runway.
Please don’t let that get in the way of a new record “obliterating” event.
Depends upon how you define “region”.
During Columbia Plateau wheat harvest last century, I experienced 115 F. When the unairconditioned truck drivers brought loads into the elevator, I’d hose them down.
The town of Umatilla, Oregon in 1939 hit 117 F. People still alive in Umatilla County lived then.
Medford in southern Oregon got almost as hot in the 1930s, as well as other areas of the PNW.
Likely the climate hysterics “corrected” those temps from the 30s. They don’t fit the narative.
Tiny Heller post…
“ Adiabatic winds can be very hot. On June 17, 1859 Santa Barbara, California reached 133 degrees.”
Oh, the link
https://realclimatescience.com/2021/06/133-degrees-in-santa-barbara-california/
Did he shrink?
I hope you asked them first…
ooo no. Sweaty, obese, “unairconditioned truck drivers” ? Put ’em in cage and hose em down before you even let em in.
Wheat truck drivers are usually young women.
Reminds me of a song.
Well, I’m running down the road
Tryin’ to loosen my load
I’ve got seven women on my mind
Four that wanna own me
Two that wanna stone me
One says she’s a friend of mine…
Don’t let the sound of your own wheels drive you crazy….
We oughta take it easy.
I like the sound of a job that involves hosing down young women.
The drivers were often technically girls, ie aged 16 and 17, with some college age and a few more mature women. Sometimes tempers flared with the temperature.
My brother referred to the neice of a friend of ours as “100 pounds of attitude in a 90 pound package”.
There were some boys and men. I filled in at times. Our neighbors’ nine year old son drove a combine.
They asked me. They got out of the trucks while dumping.
G’Day John,
Atchison, KS in the 1970’s – the trucks were fastened to the scale (70ft) and the entire scale tilted to unload. That was something to watch. The drivers did get out. (I was working for a scale company at the time.)
Our scale was on knifelike blades. The trucks dumped rather than lifting the scale. Yours must have been a pretty big operation.
I was just a visiting (from California) scale tech – riding in a weight test truck with a local chap from our distributor in Hutchinson. He stopped and we watched a couple of loads dumped.
(We were headed for a customer in St Jo – who had three elevator/silos mounted on strain gauge load cells and wanted an accuracy test. Since I’d assembled most of that system, I got the assignment.)
‘Knife edges’ for the lever system ‘underneath’ – ours (C G Systems) were actually square in cross section – hardened and precision ground steel – so the ‘edge’ was 90°.
Great to hear from a scale expert, I just operated the thing, without really knowing how it worked. And sprayed chemicals on the wheat, climbed to the roof to manhandle the engine and cleaned out the pit. That was nasty.
John T,
Recalling some of your comments on a different page a few days ago. The best part of that service call was getting to handle a Colt Woodsman, owned by my chauffeur. The night he took me cat fishing – phew. Memories…..
You my brother benefited from the days of high adventure in the grain elevator scale industry.
Yep, although it is verboten a read of past history. before writing an article would save a lot of space on this site
.At 85 years I have the impression that the climate was designed for idiot to argue over
I’ve seen 118F in Hell’s Canyon when passing through but equating that location to Portland is a stretch. They are predicting 120s on Plateau.
Forecast now is for 116 at The Dalles and 115 at Umatilla. The dams weren’t there in 1939, not the freeway at The Dalles, and more people, buildings, pavement and air conditioners now, so the records aren’t really comparable.
In any case, Oregon’s record 117 might stand.
Enjoying the updates. Thanks.
The high here in Beaverton was 111. It’s still 109 at 1800…That’s hotter than this area has ever recorded. Tonight, the ‘low’ is supposed to be 80. That will break another all time recorded temperature.
“Field reporter
Tom, I’m currently ten miles outside of Beaverton, unable to get inside the town proper. We do not have any reports of fatalities yet, but we believe that the death toll may be in the hundreds of millions. Beaverton has only a population of about eight thousand, Tom, so this would be quite devastating.
Tom
Any word on how the survivors in the town are doing, Mitch?
Mitch
W-we’re not sure what exactly is going on inside the town of Beaverton, uh Tom, but we’re reporting that there’s looting, raping, and yes, even acts of cannibalism.
Tom
My God, you’ve, you’ve actually seen people looting, raping and eating each other?
Mitch
No, no, we haven’t actually seen it Tom, we’re just reporting it.”
Is that about the situation there, John?
Tom! This just in! We hear there are actually dogs and cats, living together in Beaverton!! Oh the humanity! Er, Canininty/Felinity!!
Tom, we’re hearing reports of chickens laying scrambled-eggs on the sidewalks!
Perfect! Thanks for that MSK!
I live in the Willamette Valley near Sweet Home, OR. We’re 90 miles south of Portland and smack dab in Cliff’s Heatpocalypse.
Buuuut, the temp here topped out today at 99°F. The National Weather Service, a division of NOAA, predicted 114°F (for my zip code), so they were off by 15 degrees. Yesterday they missed by 10 degrees. They predicted 104°F and it only got to 94°. Big misses. Way off. All hype, no delivery.
It’s warm, but not beyond my experience as a living inhabitant of the region. I remember a summer day in the 1980’s when it got to 115°F in The Dalles, OR. So I am not impressed with 99°F.
As to Portland burning, it may be so, but it has been for over a year, and that has nothing to do with the weather.
No doubt there were recording breaking temperatures, but the data you present illustrates warm bias.
I see this a lot from the news stations in Colorado calling for high temperature records to be broken and most often they are not, sometimes they are not even close.
It snowed on Loveland Pass, Colorado today.
Sorry, we are only covering extreme hot weather today. Please don’t disturb the narrative with your silly factoids.
Yeah, anecdotes!! The world is on fire, dude!
Yep, and even here in Albuquerque at 6500’ at the base of our mountain it was as low as 63 degrees by my car’s thermometer ( usually accurate) as a cold rain and windcame through.
Usual temp at same site is in 90’s in late June. In 100’s last week. Seems true that Portland just stole away some of our SW desert air, and gave us their cool and wet in return.
There were many people with personal weather stations in your neck of the woods who were recording 8-10 degrees above you. Oddly enough at 2300 at my house in the ‘concrete jungle’ of Portland, the temperature is 83F while the airport is 90F. My high temperature was also 5deg F lower than the airport. It is usually the other way around.
He bet yesterday it wouldn’t reach 100, not surprised he reports 99. It is abnormally hot this WEEK in Portland area don’t know why people can’t just say yep, that’s interesting. It’s like if they admit it somehow it’s thesame as admitting CAGW is real. I just don’t understand why anyone would be thinking that
Ironargonaut,
Everyone recognizes that it’s a heat wave and unusual.
It’s the exaggeration and the hype that is objectionable. Particularly by the supposedly objective Cliff Mass.
And of course it is necessary to counter the bs claims that climate change is the cause.
Another oddity for you regarding this heatwave. I woke up this morning at 4am (no that isn’t the oddity) and the wind had kicked in bringing the temperature at my house to 87F (I have 5 sensors around the house set up such that between them I get an accurate reading). I hopped on the internet to check other PWS as I couldn’t believe what I was seeing. In Clackamas county south of PDX where the east wind was a trifle stronger their temps were pushing a 100F!! At 4am!! The airport which had calm winds was reporting only 80. That is one hot air mass above us!!
More compression heating closer to the mountains.
“As to Portland burning, it may be so, but it has been for over a year, and that has nothing to do with the weather.”
I was wondering, do those Antifa thugs in Portland take the day off when the temperatures soar like this?
It will be blamed on CC, AGW. That was the proof. We are all going to die from the heatwaves!!!. Doom and Gloom. Validation of the fearmongers. Just a normal natural event. Wonder if a cold record will be set for the low temp reached?
If min temps go up , it’s proof of GW. If min temps go down it proof of more extreme climate.
No possible outcome will counter their cultic dogma.
Every report I’ve seen about the temperatures in the Northwest this weekend proclaims that CC is one of the reasons for the heat wave.
Well, you saw this one, from Cliff Mass, not attributed to CC.
You don’t have to be explicit when you just mentioned it in your last two reports and instead you say “heat apocalypse”
Gimme a break
I was surprised but one Foxnews article never mentioned CC
Including from the martyred meteorologist
More importantly, will low temperature records be set this winter! I suspect the Milankovitch cycle is to blame, and the conjunction of Saturn and Jupiter last December elongated earth’s orbit. That would result in hotter, but shorter, summers and longer and colder winters.
Does this mean stimulus payments to OR and WA because they got warm for a week?
This time last year ‘tiffa and BLM were setting the place on fire with “mostly peaceful” riots.
Oh dear, I think Cliff is getting a bit too excited by the hype.
None of this is an “all-time” record, nor the hottest EVAH, or the hottest in recorded history or any of the other over-excited claims bounding around in the press.
Recorded history goes back about 5000 years. “All time” is about 4.6 billion years, if we limit it to time on Earth.
What we could say is highest recorded temperature.
I presume the 108 F was at the Portland airport (PDX). A lot has changed there since 1965, when the 107 F prior record was set. I lived in NW Portland when the PDX record was tied on two days in August 1981. Obviously, people talked about it, but at that time there was no global warming hysteria. We were just coming out of the global cooling hysteria of the 1970s.
I think the previous record was 107F downtown in 1942.
’65 and ’81 were 107 at PDX.
Correct about downtown. July 2, 1942 to be exact.
And records are always being set! Any reasonably chaotic data set (and weather values are certainly chaotic) will show extremes at some point.
Touche!! During the age of the dinosaurs, the average temps of the earth were about 85F with subtropical vegetation all the way to the poles. (and life survived!!!!!)
(and life survived!!!!!)
Wrong, life couldn’t have survived.
(Therefor we are all a product of our own imagination.)
Because settled climate science states that another 3° on top of the present ~60° = 63°F is game over, so life cannot exist above 70°.
I know the ‘world is on fire’ (I hope the sea level rise douses the flames) I just looked out of the window & can see the smoke & flames plus the smell of charred flesh.
So now I’m going outside (temp = 76°F) with a bottle of wine & join my imaginary friends
atin a BBQ.BBQ? You CO2-spewing criminal!
You almost had me going there. I had a whole tome ready to blast before I re-read your post. Yes, we must be a product of some imagination if 70F world mean temperature will destroy all life.
Love how you make up stuff he didn’t say. Please, show me the higher temp record for Portland. You do realize the city didn’t exist 5000 yrs ago.
Since you don’t quote anything or who said it and don’t say who “he” or was, it is impossible to know what you are saying or what you mean.
In a very short history
ANOTHER BOGUS CLIMATE REPORT BLAMES GLOBAL ‘COOLING’ ON GLOBAL ‘WARMING’JUNE 26, 2021
In a perfect example of what George Orwell called ‘Doublethink’ the AGW party is claiming that global ‘warming’ can also mean global ‘cooling’ — i.e. that your CO2 emissions (i.e. your existence) are responsible for ALL things climate; even the stark cooling we’ve witnessed since 2016.
WINTER STORM “WREAKS HAVOC” IN CAPE TOWN, SOUTH AFRICA, AS GREENLAND LOGS YET MORE RECORD-BREAKING GAINS
June 29, 2021
A powerful winter storm kicked-up from Antarctica has engulfed the South African city of Cape Town –among other locales– delivering anomalously-low temps, flooding rains and heavy snows.
RECORD-BREAKING COLD AND SNOW SWEEP SOUTH AMERICA
June 29, 2021
While the MSM seemingly revels in the unprecedented heat lingering over the NW U.S./SW Canada, a far-more widespread temperature anomaly is currently engulfing a part of our planet: in South America.
“All-time record high” is not equal to “all-time high.” Notice the word ‘record’ in there. The statement means the all-time high temperature ever recorded. Looking at the geologic history of the earth it is a given that none of our all-time record highs are all-time highs. Same thing goes for all-time lows. Your statement is such a classic straw man argument that it should be included in books on logic.
It seems impossible to get actual temperatures from Google. Whatever I do I get nothing but weather forecasts. Does anyone have link to ACTUAL data from a standard recording site?
Not that I trust the NWS or any organ of NOAA, but here are the records for Saturday and June in some Oregon sites, but not for hottest day ever:
https://www.weather.gov/pqr/
Thanks John. Looks like Portland airport is best shot for a record breaker. I wonder how near to the run way the thermometer is. ( Airports measure air temperature for pilots, not for climate records ).
Yes. Those planes need the temperatures right where the concrete or asphatt is. Takeoff and top of climb ( where its lot cooler) are where the engines ned to do their work
The answer to your question is 50′ from an unused taxiway. Lots of grass around other than the taxiway. PDX usually has cooler max temperatures due to the Columbia River only 1,700′ away. For the same reason in the winter it quite often is warmer than the surrounding Metro temperature. 5F warmer than at my house which is in the city on cool still clear winter nights.
I find NWS Western has the data, though the site is klunky.
Here is one of their tables, as at 5pm

Many thanks Nick. These days, google always seems to give you what it wants you to see not what you ask for.
Here is NWS forecast from 5am today predicting a high of 115F for Portland. Not clear whether that is “downtown” or WFO. So 4 or 5F too high just 12h ahead of time.
I guess I’ll pass on 100 y forecasts.
Still 43C/110F is plenty hot for those not used to it.
Greg,
According to this table it was 112 at 5pm. So that max to 5pm might not be final.
Here is the spaghetti plot for the various models for PDX airport. The range is from 111-116F
GEM and UKMO look like they might not be too far off around 110F max.
Greg,
AS I mentioned above, I think those forecasts come from weather.com, the Weather Channel, not NWS. I looked up an archived NWS web page for Sat 26 June; it forecasts 112F for both Sunday and Monday.
G’Day Nick,
“…I think those forecasts come from weather.com, the Weather Channel, not NWS.”
If you go to the following site, look in the upper left corner to input a location. (I keyed in Picacho Peak, AZ, we came down from Gila Bend this morning) Come down the right hand side “More Information” – click on “3 Day History”. Gives the hour by hour data.
On that page, the high and low for the day will be shown in the right hand columns – after 0100 hours. Those figures go to NOAA, who apparently make the ‘necessary adjustments’, and are accessed by the Weather Channel. ‘Raw’ data and forecasts are both available on NWS web sites.
https://forecast.weather.gov/MapClick.php?lat=32.055630000000065&lon=-111.94623999999999#.YNoQ1NVKi00
Yes, I know NWS posts forecasts and data. The question is, how do they relate to the forecast numbers that weather.com posts?
Nick,
There might not be a relationship. I found this:
GRAF – New IBM Weather System Will Improve Forecasting Around the World
IBM and The Weather Company have unveiled a powerful new global weather forecasting system that will provide the most accurate local weather forecasts ever seen worldwide. The new IBM Global High-Resolution Atmospheric Forecasting System (or GRAF) will be the first hourly-updating commercial weather system that is able to predict something as small as thunderstorms globally.
https://mediacenter.ibm.com/media/1_vfo9jf47?mhsrc=ibmsearch_a&mhq=GRAF
But no meaty details.
There’s an “Email Us” tag at:
https://support.weather.com/s/explore?language=en_US
possibly to determine how they produced forecasts in the past.
Thanks. I think the short answer is, it is a TWC forecast, not NWS.
Nick,
You raised a question and got me interested. Now I want to find out just how the Weather Channel develops their forecasts. I’m assuming model(s) and data from somewhere. In a email exchange with WC several months ago they stated that their data is from the “National Weather Service”.
But the figures they gave for a daily high on their “Month” page for where I was at the time didn’t match the local NWS reports. Over 50% of the time the WC figure was one or two degrees higher than what was shown on the ‘local’ NWS web page. Apparently ‘adjusted’ somewhere in the process. NOAA?
Of course, that also raises the question; the forecasts on NWS web pages – who develops them, and how? So many questions, so little time…..
More
Report for Washington state at 5pm

Thanks.
Looks as if the 1939 state record of 117 F at Umatilla will stand. Same county as Pendleton but lower elevation, on the Columbia. Higher than The Dalles, as much farther upriver.
Might be wrong. Forecast now for Umatilla tomorrow is 118.
I follow temperatures on Foreflight, which collects airport Meters. teh highest I saw today was 45C at The Dalles.
Can’t edit for some reason – 45C = 113F. And it’s airport METARS
Are airport temperature gauges designed to catch the T just above the tarmac so that pilots know the lift and required runway distance to get airborne? ( In other they are designed to capture maximum UHI temperatures above asphalt)
Don’t forget weatherlink.com
Pretty sure you can trust that data.
Please, remove untrustworthy Google. Replace with duckduckgo search engine. I just did a websearch. The first item on the page is the local temp: 105F. .
Good suggestion. There’s nothing to “remove”, I don’t use handheld spyware but I did search with DDG and found what I wanted. Logged hourly data. ( Still NWS but it’s a start ).
https://w1.weather.gov/obhistory/KPDX.html
Here is the link to SEATAC’s 5 min auto obs. https://www.wrh.noaa.gov/mesowest/getobext.php?sid=KSEA&wfo=pqr&hfmetars=1
And here is the link to PDX’s 5 min auto obs. https://www.wrh.noaa.gov/mesowest/getobext.php?sid=KPDX&wfo=pqr&hfmetars=1
“Worse than previously thought” does not mean that they were even more right than previously thought.
It means that they were wrong.
https://tambonthongchai.com/2018/05/22/global-warming-science-2007-the-dearth-of-scientific-knowledge-only-adds-to-the-alarm/
The AGW proponents did predict more extreme extremes.
NWS were predicting 115F for Portland just 12h ago. 111F measured.
Eventually they will be right. This entire area of unusual high T composes what, 1/10 th of one percent of the planet?
So some where on this earth we should get what, ten of these a year?
More area than that broke records yesterday. Lytton, BC set a new Canadian record of 116 F. Alberta was abnormally hot but didn’t exceed its record from the 1930s.
But even if the area unusually hot be a third of one percent of Earth’s total surface, ie about one percent of its land, your point is valid.
Meanwhile here in Chile it’s unusually cold. Forecast low tonight for Santiago is 28 F.
My niece lives in BC and has been experiencing temperatures in the mid-40s. Her daughter is on a flood alert due to very rapid snow melt.
It’s a game of miles, as on the OR coast vs. Willamette Valley.
Caused by back radiation greenhouse gas heating.
This weather event is a Foehn Wind caused by a dynamic flow of air down slope that creates air heating by adiabatic compression.
The AGW proponents cannot even get the mechanism of this normal meteorological process correct.
They pretty much predicted everything so they will never be wrong.
Another beautiful day in the PNW.
Who knew knew it is warmer in summer.
Next thing you know they will discover cold and flu season and require wearing masks.
This is definitely unusual.
True, yet the earth is large and the area of once in a 100 year heat is a very small percentage of the earths area. ( So this rare event happens somewhere on earth about ten times a year. )
Ohhhhhhhhhhhh Mo’mmmmmmmmmaaaaaaaaaa …
EXTREME weather … therefore Global Warming. Right?
Next: human blood will boil. Cats, Dogs, living together. Real wrath of Gaia stuff.
Heat of biblical proportions !!
Wow, how can you guys stand it?
Mike In Houston
In ’81 it got (relatively) hot here in the NW. I had been in the Mobile area for a few weeks and I didn’t know ‘we’ were having a heat wave back in the Northwest.
So, when I stepped of the plane, returning to Portland at 6 p.m. to 90 degree temp, I was disappointed. I expected a little relief from my 2 1/2 weeks of Gulf temps. But no, it was only a few degrees colder.
Thanks for sucking up all the hot air from the desert southwest. The humidity is rising in these areas along with the prospect for rain.
Thanks for the update! We are expected to hit 113 in Tukwila tomorrow. We will welcome the drop to more normal temps on Tuesday. Whew
A taste of Arizona style heat in the NW USA.. Hope they all have A/C!
And this should be a wake-up call, not for “climate change”, but for a reliable
electrical grid. Just remember the 2020 California heat wave & 2021 Texas
deep freeze where both states had marked penetration of renewables which
could not deliver power. Electricity needs to be both reliable and affordable.
Here in central Arizona, we had another typical hot (‘only’ 111 deg F) day that
was completely consistent with “climate change”.
The North West has a high penetration of renewable hydropower.
Except when the wind turbines are producing, then they have to spill water to reduce production. I read that the wind farms have priority over hydro, based on transmission line capacity.
Except that both OR & WA classify hydro as NOT renewable. And what Brad says below is true. Water is spilled past the the turbines when the bird choppers are operating.
A lot of houses west of the Cascades in WA don’t have AC, because high temps are pretty rare, and only last for a couple days.
We don’t have AC either. The inside of the house got to 85 yesterday. Today it will be the same. We use fans. The problem, for the last few days anyway, is the temperature at night didn’t get to the usual 50s, which always cools down the house for the next 85-90 degree day. Of course, other than a couple of months in the summer it is cool and wet around here.
We don’t 101 inside the house yesterday
The variability of weather on this planet is amazing. Today in Vostok, Antarctica, it was -106.6 degrees F: https://www.eldoradoweather.com/climate/world-extremes/world-temp-rainfall-extremes.php
We need to average these out and come up with an anomaly.
Thanks!
Glad to see Taiwan got some much needed rain.
So are the deaths in the hundreds or thousands?
Spokane had an Ironman competition today in 110 weather. If anyone dies, it is due to ego…
Upper 80s. lower 90s, in the SL valley desert. Normal… average… boring forecast as far as the crow flies. Although, we did reach above 100 for a couple of days last week. So, there’s that.
If by “the SL valley” you mean the Salt Lake valley in Utah, it wasn’t all that hot yesterday, with a nice afternoon breeze out of the west. After those 100-degree-days last week, we actually got a little (welcome) rain here last Monday, with a high in the low 70’s.
As for those unusual easterly winds giving a heat wave to western Oregon and Washington, their effects depend heavily on location. On September 8, 2020, there were strong easterly winds along the Wasatch Front (that blew down part of my fence), but no heat wave. Only snow flurries and a high in the low 40’s in early September.
My wife will be at work (air-conditioned hospital!) I get to stay home and hose the dogs down every two-three hours! May have to put out a small wading pond for the cats.
Sitting in my (not very cool) basement just outside of Vancouver BC.
We were in Spokane this weekend, with temps over 106. Came home early to Poulsbo to take care of the animals, temps as high as 110 all along I90. The Snohomish pass dropped to 100.
Poulsbo was 96, and when we got to Lofall on Hood canal is was 88. An hour later and we are down to 75, still very sunny. No AC but lots of windows for ventilation, expecting low 60’s overnight. The house should be in the high 60’s when we button it up tomorrow morning.
Seattle design OSA temp is 83, which all newer Bldgs are designed for, no allowance for UHI effects. Most bldgs are lightly loaded due to COVID, but most will be running their HVAC through tonight in preparation. Very few apartment bldgs have AC in the units, can’t imagine how bad they will be.
Hood Canal is our “AC unit”
Is that where the POC go swimming ?
Here in Southern California we call this Santa Ana winds that blow through the mountains from the east and raise temperatures by 10 to 15 degrees above normal on the coast. This happens many times each year and has been going on for eons.
You know, when the very first thermometer reading was taken, it was the hottest on record.
So some warm weather.