By Rud Istvan
About the time NASA launched new SLR ‘bird’ Sentinel-6, I posted on whether it was (unlike its predecessor Jason 3) mission fit for purpose.
At that time, there was then no way of knowing. NASA claimed it was, but provided no hard supporting information.
Now we know.
IT ISN’T.
NASA today made a big press announcement, that after 6 months of calibration in space, Sentinel-6 will start providing two data products on June 23, 2021, “keeping an eye on rising seas”.
The first will be available within hours of collection and is accurate to 5.8 cm.
The second will be available two days after collection and is accurate to 3.5 cm.
Since the long record differential GPS corrected (for vertical land motion) tide gauges all show about 2.2mm/year and no acceleration, both data products are useless for any SLR climate purpose.
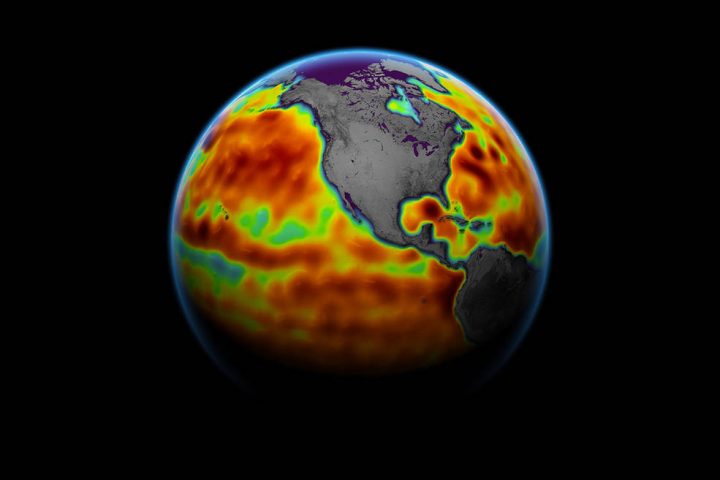
Nonetheless, the NASA announcement is accompanied by a Sentinel-6 data preview image, below. ‘
Above average SL’ (huh???), of course, is red!!!
NASA imagines sea level is like the children of fictional Lake Wobegon—all above average.
So no improvement
No improvement on the science, big improvement on the scam.
Just look at all that red…
Why haven’t you done anything???
Don’t you realize that, with all that extra water (which conveniently doesn’t affect coastal waters) the little fishes are going to drown???
Oh the Hugh Manatee
Well, no improvement, but no regression either. The previous missions all had approximately the same resolution.
Since the long record differential GPS corrected (for vertical land motion) tide gauges all show about 2.2mm/year and no acceleration, both data products are useless for any SLR climate purpose.
NOAA says:
average global sea level rise rate of 1.7-1.8 mm/yr.
Source:
https://tidesandcurrents.noaa.gov/sltrends/slrmap.html
Tide gauges do show acceleration of about 0.01 mm/yr²
Source:
https://www.psmsl.org/data/obtaining/
It can be looked up on Dave Burton’s pages as well.
http://www.sealevel.info/
NASA imagines sea level is like the children of fictional Lake Wobegon—all above average.
Ha ha ha ha! Good one (-:.
Steve, did you know that the Earth’s iron core grows by about 1 mm per year ?
https://www.theweathernetwork.com/ca/news/article/mysterious-lopsided-cooling-points-to-strangeness-in-core-of-earth
Also the Earth’s crust undulates by nearly a foot every day due to the gravitational effect of the moon as the Earth spins on its axis. And what with continuous waves on the ocean whose height varies with wind and storm surge, its really hard for those satellites to have 1mm accuracy….
NOAA has a split personality (and conflicting data) when it comes to sea level rise (SLR).
Notwithstanding the above-referenced NOAA “tides and currents” website value for average global SLR (1.7-1.8 mm/yr), NOAA’s website for satellite altimetry measurements of average global SLR give a value of 3.0 ± 0.4 mm/yr averaged over the last 28+ years (see https://www.star.nesdis.noaa.gov/socd/lsa/SeaLevelRise/LSA_SLR_timeseries.php )
How NOAA and NASA expect to resolve this discrepancy with a brand new satellite that has a stated SLR measurement accuracy approximately 20 times LESS than needed is beyond me.
By the magic of averaging they can go even beyond Plank limits, so… /sarc
What is that, three orders of magnitude less than the resolution of the instruments measuring it????
0.01mm is so far below noise that it is meaningless.
And, it doesn’t say for what period of time this claimed acceleration has been detected in a periodic variable with known cycles of 20 and 50 years, nor what the uncertainty is on the claimed 0.01 mm.
How do you calculate an acceleration of 0.01mm when tidal gauges only have an accuracy of about 1.5cm?
https://journals.ametsoc.org/view/journals/atot/10/2/1520-0426_1993_010_0238_taotgm_2_0_co_2.xml?tab_body=pdf
By carrying through the uncertainty intervals into your final calculation. If you quote 0.01mm +/- 15 mm you will make the reader instantly aware that your calculation is meaningless. Of course then it makes it harder for you to scare people.
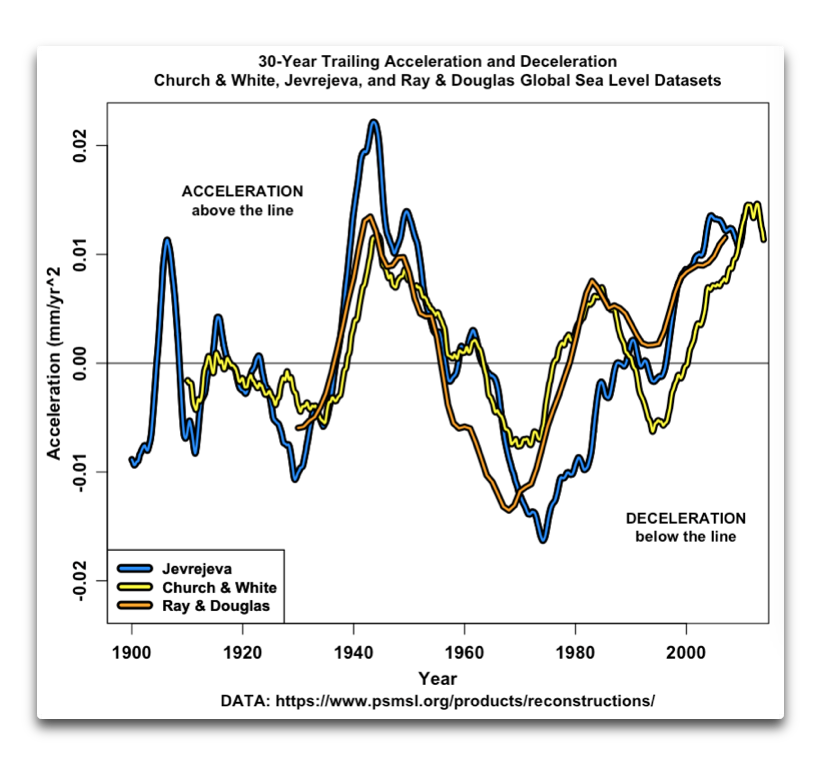
Steve, your claim that “tide gauges do sho acceleration of about 0.01 mm/year” is not supported by simply providing a list of the tide gauges. In fact, the global sea level reconstructions from tide gauges all show the sea level both accelerating and decelerating over the last 100 years.
Regards,
w.
Where are the error bars?
Steve Case
You can’t compare
with
That makes no sense.
I) Here is a graph comparing the two during their respective period
Simple eye-balling already shows what linear estimates computed by any spreadsheet tool confirm.
While Dangendorf & al. obtain
they obtain
For the same period, NOAA’s altimetry gives an estimate of
*
Well, when I read the title of Dangendorf’s article:
” Persistent acceleration in global sea-level rise since the 1960s ”
I think: Duh, what an alarmistic tone!
But that is what they managed to get out of the data, including vertical land movement compensation for tide gauges, but also other surface matter like winds, ENSO etc etc.
I know a lot of people who wrote ‘I think they did it wrong; prove me wrong!’; but none is known to me who was able to prove them wrong, by clearly, scientifically contradicting them.
*
II) A further comparison of Dangendorf’s surface data evaluation with NOAA’s sat altimetry data shows that even their respective acceleration (as detected by a simple spreadsheet calculator using a quadratic fit) look very similar.
Dang 1993-2015
NOAA 1993-2015
(The x-es in the linear and quadratic fit equations represent months.)
If you now do simple layman’s work, by setting x for 100 years i.e. 1200 months, you obtain
the following rise approximations:
Of course: we need here a calculation including uncertainty (mostly requested by people who only read about it, but did never use it during their entire professional life). But we are lay(wo)men here, and no specialists!
Thus, in the sum, Steve Case: when you write
” NASA imagines sea level is like the children of fictional Lake Wobegon “,
I’m not sure you are right…
J.-P. D.
Data sources
Dang
https://static-content.springer.com/esm/art%3A10.1038%2Fs41558-019-0531-8/MediaObjects/41558_2019_531_MOESM2_ESM.txt
NOAA altimetry
https://www.star.nesdis.noaa.gov/socd/lsa/SeaLevelRise/LSA_SLR_timeseries_global.php
NOAA altimetry (directly to the data)
http://www.star.nesdis.noaa.gov/sod/lsa/SeaLevelRise/slr/slr_sla_gbl_free_txj1j2_90.csv
Even if that were true, it doesn’t make it an unreasonable request. But, your tone suggests that it is really intended as an ad hominem attack.
I don’t know of a single engineer who never used uncertainty. From civil, to mechanical, to electrical, to chemical. And other disciplines I’ve forgotten.Everything physical has uncertainty. If you don’t allow for it you won’t be an engineer very long. Or even a framing carpenter.
Clyde Spencer
1) ” Even if that were true, it doesn’t make it an unreasonable request. ”
I never and never pretended that taking uncertainty into account would be an ‘unreasonable request’.
I have read some tiny bits about that, beginning with e.g.
Quantifying uncertainties in global and regional temperature change using an ensemble of observational estimates: The HadCRUT4 data set
Colin P. Morice & al., 2012
https://agupubs.onlinelibrary.wiley.com/doi/epdf/10.1029/2011JD017187
or
Partitioning uncertainty components of mean climate and climate change in a large ensemble of European regional climate model projections
Ole B. Christensen & Erik Kjellström, 2020
https://link.springer.com/article/10.1007/s00382-020-05229-y
as well as some work done by e.g. Kevin Cowtan.
*
2) ” But, your tone suggests that it is really intended as an ad hominem attack. ”
It would be quite reasonable from your side, Mr Spencer, to avoid yourself such unnecessary, superficial claims looking INDEED like ad homs.
*
I’m just sad of people who permanently discredit the work of others by doing no more than hand waving with things like uncertainty, instead of presenting the same work (making offensive use of it) as what they criticized!
That, Mr Spencer, would be a honorable, interesting critique. I guess I can wait some more years before experiencing it.
J.-P. D.
Show me a tide gauge that was a solid 1.4 mm/yr 1900-1990, and is now 2.8 mm/yr .
In fact, Wismar, one of the best tide gauges in the world, has a pre1990 slope of 1.4 mm/yr and a 1988-2018 rate of 1.7 mm/yr which is well within its pre1990 range….and far below 2.8 mm/yr.
The 1.1 mm/yr to 2.8 mm/yr doesn’t hold up…not when compared against the best instrumental data.
Mr Lee
It is now over 2 AM here at UTC+2.
More tomorrow.
J.-P. D.
Comparing tide gauge to satellite data is comparing apples with pears. They are measuring different things. A bit of ocean warming will cause a bit of bulk expansion, thus over the 4000m average ocean depth the pull of gravity will be slightly less, and the oceans will ‘bulge’ a bit. at the coast, where the tide gauges are, this effect is minimal. Thus one computes a lower rate of increase at the coast than over the deep ocean. 2/3 of the earth’s surface is deep ocean, but the satellites are georeferenced to land points, such as the Salar de Uyuno in Bolivia. So the satellite reading over the oceans is biassed upwards by the bulges relative to the reference points. What is happening is the geoid is changing. This is the surface which one would see in thin canals cut through the continents – it is the gravitational equipotential coinciding with the ocean surface ( including those imaginary canals). This is represented mathematically by the spheroid – a sum of spherical harmonic terms calculated to best fit the geoid. I presume the NASA figure shows sea surface relative to some (now obsolete) spheroid. In itself it is fairly meaningless
Velcro
Fine!
And… when will we enjoy your REAL work?
Because writing stuff like you did: that’s easy.
I recommend you to read Dangendorf’s paper, that might help.
J.-P. D.
On what do you base such an opinion? Over the last 7 years I have had 12 articles published, most of which were original analyses of data.
All I have seen from you is comments. Have I missed something?
The accelerations on those graphs is 0.002 mm/yr^2….most unimpressive.
I started reading the article. They have so many judgement calls on averaging on water volumes and geoid distortions and tide gauges…. they have corrections upon corrections and thus, could get answer they want.
Unto itself, the following statement from the abstract, renders the results questionable:
Our reconstructed GMSL trend of 1.1 ± 0.3 mm⋅y−before 1990 falls below previous estimates.
Mr. Lee
It is always super easy to criticize on the base of two or three superficial statements, isn’t it?
Try to replicate their work, Sir, and come back with results we can compare.
J.-P. D.
Mr. Lee
Now I’m here again, and I have some idle time for a reply to the first one of your strange comments:
” Show me a tide gauge that was a solid 1.4 mm/yr 1900-1990, and is now 2.8 mm/yr .
In fact, Wismar, one of the best tide gauges in the world, has a pre1990 slope of 1.4 mm/yr and a 1988-2018 rate of 1.7 mm/yr which is well within its pre1990 range….and far below 2.8 mm/yr.
The 1.1 mm/yr to 2.8 mm/yr doesn’t hold up…not when compared against the best instrumental data. ”
*
Aha. Very interesting!
Here is the official PSMSL plot:
and here is mine, made out of own PSMSL data processing:
Your slope looks OK: it is 1.43 ± 0.04 mm/yr for 1848-2018, and, keeping an eye on Dangendorf’s period, 1.48 mm/yr for 1900-2015.
And your pre1990 estimate for Wismar is correct too: 1.39 mm/yr. Perfect.
But now, Houston, we have a problem: for 1993-2015, my spreadsheet calculator gives… 2.76 ± 0.79 mm/yr. Why did you select 1988-2018?
And please note that this 2.76 slope does not, as opposed to Dangendorf’s work, take GIA into account: around Wismar, there is no GPS data available.
The next gauge is Warnemünde, 50 km away; GPS is in the near according to SONEL data, and there, the correction for vertical land movement gives as estimate for 1993-2015: 2.91 ± 0.80 mm/yr.
What was your point, Mr. Lee?
*
Here is a graph showing you, for the Swedish gauge Furuögrund, located at the end of the Bothnian Gulf, the difference between raw and VLM corrected data:
Estimate for raw data, 1916-2017: -7.8 mm/yr; VLM is +10 mm/yr…
J.-P. D.
Mr. Lee (ctnd)
1) ” The accelerations on those graphs is 0.002 mm/yr^2….most unimpressive. ”
Firstly, I was not interested in showing these accelerations as such; my interest was to compare surface and altimetry within my reply to Steve Case.
Secondly, the quadratic fit is used to show, over a very long period (here: 100 years), whether or not something increases / decreases more than linear.
Maybe the average increase of sea level by 50 cm in 100 years is in your opinion ‘most unimpressive’.
A look at the linear estimates for over 600 PSMSL gauges
https://drive.google.com/file/d/1kLZZQH-zQjkWMvwT72JxAM34cLPOUjMr/view
shows us that while the average trend for 1993-2015 is about 3 mm/yr (like in… Wismar), the trend is way higher at many places, even after a possible correction for VLM.
Most of those places manifestly highly populated, probably inhabited by poor people.
What reassures me here is that the quadratic fit computed out of this short period might be irrelevant, because the past has shown us how variable the sea level change rate can be!
*
2) ” They have so many judgement calls on averaging on water volumes and geoid distortions and tide gauges…. they have corrections upon corrections and thus, could get answer they want. ”
Aha.
Then maybe you find an appropriate explanation for the similarity between the sea level evaluation made by Sönke Dangendorf & al. and two others, solely based on tide gauge data:
As said: feel free to add your work to this graph, by uploading your monthly anomaly time series wrt the mean of 1993-2013…
J.-P. D.
NASA GPS + 2.2 mm/yr (0.087 inch/yr) sea level rise.
Credit card thickness = 0.76 mm (0.0299 inches).
2.89 stacked credit cards/yr (.0866 inches, 2.2 mm) sea level rise.
28.9 stacked credit cards/decade (.866 inches, 22 mm) sea level rise.
289.47 stacked credit cards/century (8.66 inches, 220 mm) sea level rise.
Spend trillions and trillions of dollars on “climate” or buy some rubber boots, cure (1) cancer, (2) World hunger and (3) dandruff with the remaining $.
Willis Eschenbach showed that the “accelaeration” is completely an artifact of blending the four data sets. This was posted here a month or so ago.
Loren C. Wilson
What I wanted to show was the similarity between satellite altimetry data and Dangendorf’s surface data (i.e. not only gauges, but also e.g. winds – the westerlies – and currents).
I have much respect for most of Mr Eschenbach’s analysis work; but I wait for his explanation for such highly similar accelerations computed out of satellite and surface data.
Anyway, the lack of drinking water in poor countries will be a much bigger problem than 50 cm SLR!
J.-P. D.
.01 mm is one twelfth the thickness of a sheet of paper.
That steady sea level rise of 2.2mm per year. Could it be an indication of changes in the Earth’s gravitational field? E.g could the Moon be moving closer?
I’d say no. The moon is very slowly moving further away actually. If Wikipedia is to be believed, tidal forces are slowly transferring angular momentum to the moon, slowing earth’s rotation by 2.4 milliseconds/century and speeding up the moon so that it moves about 38 mm higher each year.
Thanks for the reply.But, could this sea-level rise be the result of gravity itself weakening as the Universe expands?
No
How exactly do you propose a weakening gravity would affect sea level rise? It would have to weaken more for water than land.
1) If gravity was weakening, there are thousands of other instruments that would be capable of detecting it.
2) The expansion of the universe is so slow that on human time scales, it is imperceptible.
3) The expansion of the universe wouldn’t affect gravity any way.
4) Water isn’t compressible, so it’s volume isn’t affected by gravity.
If gravity were weakening my scales would indicate a gradual loss of weight. Since they indicate the opposite, I can only presume an Increase in gravity is the likely cause
Exactly, Rich Davis.
J.-P. D.
No, probably half of the 2.2 mm is a result of tweaking the satellite control system software….it’s complicated and they keep finding they need to adjust the old algorithms….especially for satellite drift relative to the ground stations that they are calibrated to.
https://www.gps.gov/systems/gps/performance/accuracy/
2.2mm is about the displayed height of the text in this comment
Yes, and being concerned about that over a period of 100 years, when plate tectonics movements are an order of magnitude larger seems to be misplaced concern.
TonyN asked: “That steady sea level rise of 2.2mm per year. Could it be an indication of changes in the Earth’s gravitational field?”
The direct and certain answer is “no”. The gravitational field of a given mass is established by the Gravitational Constant (abbreviated as G).
“Over the past two decades, eleven precision measurements of the gravitational constant have been performed, and the latest recommended value for G published by the Committee on Data for Science and Technology (CODATA) is (6.674 08 ± 0.000 31) × 10−11 m3 kg−1 s−2 with a relative uncertainty of 47 parts per million.” — source “Precision measurement of the Newtonian gravitational constant”, Xue, et al, December 2020 (abstract and free download available to https://academic.oup.com/nsr/article/7/12/1803/5874900 ).
G is called a “constant” for good reason.
Look at the gauges surrounding the coast of North America. Sea level is rising on the southern half of the continent, while receding on the northern half of the continent. Our continent is slowly tilting now that the weight of the ice from glaciation has been removed from the northern end of it.
Don’t tell Hank Johnson!
And everything loose is rolling into CA.
I think you have that backwards.
Its hard to tell if that single down vote is from one of the trolls who has taken a dislike to me, or if it is from someone who thinks that North Africa was heavily glaciated during the last glaciation, instead of the end of the continent closest to Antarctica.
Doesn’t the fact (which I read here a while ago) that the earth’s rotation hasn’t slowed down in recent years provided evidence that the sea level isn’t rising much?
Not really. If (big IF) land-based ice (above sea level) is melting and flowing down to the oceans, causing sea level rise, then the earth would be speeding up (an infinitesimal amount).
Interesting image. Seems to be green around the coastlines. I guess it means it’s ok. Seas are rising in the middle of oceans but not on coasts.
So the beach front properties belonging to Bill, Obama and all the other hypocritical liars are safe then but like us they already knew that.
Yeah, 2.2mm +/- 35mm
Riiiiiiiiiiight, tuh
My simple request to have a satellite with frickin’ laser beams on its head… Apparently my cycloptic friend informs me that this is not possible.
Rich, using laser-based satellite altimetry (i.e., LIDAR) to derive a measurement of average global SLR is theoretically possible, but in actuality is subject to a raft of physical problems.
AFAIK, these include light dispersion, absorption and back reflections as light passes through the atmosphere going forward to and reflects back from the ocean surface, as well as issues with accurately measuring distances for sea states other than dead calm. Perhaps most significantly, the sea-surface is inherently NOT a good reflector for EM wavelengths associated with lasers (i.e., light can penetrate many centimeters, if not many meters, into ocean waters, leading to great inaccuracy in establishing the true ocean surface.
I believe that scientists involved with satellite-based altimetry for SLR measurement have settled on longer wavelength, microwave “sounder” instruments to minimize such degrading effects.
Perhaps we should try an unnecessarily-slow dipping mechanism involving an easily-escapable overly-elaborate scheme?
With SL rise of only 2.2mm/yr and no acceleration, it’s going to be tough to hit that much hoped for 7 meter rise by the year 2100.
Sea level rise had better start picking up the pace pretty soon, this could be embarracing.
Like everything else in the world of global warmists, the true effects are always ten years from now.
Sea level rise had better start picking up the pace pretty soon, this could be embarrassing
I have a feeling they are about to [re-]discover isostatic rebound. Doubtless they will have the number that offsets their errors.
No problem. It will rise about 18 cm through 2099 and then reach a tipping point and jump 6.82 meters in the final year. QED /S
7 meters is a lot. According to IPCC AR5 WGI even the RCP8.5 rise is only expected to be 0.7 meters by 2100.
Thx bgdwx. Given the trend of the most physically/statistically significant time period – the last 40 years – we are right on track.
But RCP 8.5 is not a prediction. It never was a product of ANY calculation for the future trajectory of CO2, it was created to make a bounding case and has subsequently been used just to generate alarm. So your statement that we’re right on track with an invented forcing case that never had any basis whatsoever makes zero sense, bigoilyboob.
Pfft, 7m is nothing. Here in NZ we get subjected to claims that it could be 20m by 2050!
“prehistoric data shows climate change could cause 20m sea level rise”
https://www.newshub.co.nz/home/new-zealand/2020/01/alarming-new-map-shows-the-devastation-rising-sea-levels-could-cause-in-new-zealand.html
We’ve had other stories where the sea level rise scenarios describe 10m, 25m, or 80m.
https://hot-topic.co.nz/the-encroaching-sea-new-nz-sea-level-rise-maps/
At least there’s no claim that’ll happen by 2050.
Hmm…I don’t see 20m by 2050 in either of those links. In the first they use Kopp 2014 RCP4.5 which is 0.18-0.35 95% CI. The second link shows inundation at 10m, 25m, and 80m rises. It says nothing about when either of those rises would occur. It also does not list any references or evidence. I don’t even think 20m by 2100 is even physically possible nevermind by 2050.
True. But the insinuation of the media reports has given the impression that 10, 20 or even 80 meters is probable to possible. Blatant case of scaring the horses for political purposes
That’s definitely a problem. I’m not going to argue against the possibility that the media has an “alarmist” slant. I’ve seen it numerous times myself. This is why I always encourage people to look at what the science actually says instead of what the media thinks it says.
1st link – The very first sentence after the text that I quoted…
“An interactive map shows how high sea levels could rise by the year 2050″
2nd link – agreed, no indication of when it could happen by. We’re left to imagine that it might happen sometime soon. Yep, no references or evidence, just published in an effort to alarm us. It should never have been printed.
Right. In the 1st link they also say they use the sea level rise figures proved by Kopp 2014. That publication says 18-35 cm by 2050 at 95% confidence.
The tide gauges from all six major ports in NZ all have 100 year records and all show sea level rises around 1.8 +- per year, according to the University of Otago School of Surveying. All open file to download. No observable acceleration. Even Wellington, where one might have expected tectonic effects, shos the same rate
“Every mother wishes her child to be in every way above average, at the same time as fiercely desiring it to be completely normal”
I read that back in the 1950s in the old ‘Readers Digest’
From their graphic, we can infer that there’s a lot of green in the Southern Hemisphere that was inconvenient to The Science (TM). So they erased it by implying that the earth is illuminated by the sun in a way that could only occur if earth were to tip 90 degrees onto its side. Is there a better word for this than deception?
Of course it’s just artistic license, in no way intended to imply that things are worse than we thought or any other such nonsense floating around in my paranoid denier brain. It could just as easily have been more green than red, this was just a purely random thing. This is fine.
Oh no! We’ve reached the “tipping point”.
https://news.yahoo.com/earth-tipped-over-side-84-005143706.html
If precision of 3.5 cm for an event of 2.2 cm is the new standard I think I will adjust my electric bill accordingly. Let’s see, 3.5 divided by 2.2 is a 59% error, so my electric bill will be adjusted 59% downward, and I will cite the federal standard of Sentinel-6 as justification.
Nope – that’s 2.2 mm per year, not cm. So the error, at best is 350 mm for a real world variance of just 2.2 mm.
Correction – that would be 35 mm measurement error vs. 2.2 mm actual measurement variability – still a very imprecise measurement.
Glad someone else caught this. When they say “accurate to 3.5 cm” does that mean +/- 3.5cm? Or just +3.5cm? Or just -3.5cm?
It’s typical climate science. Trying to measure a difference in millimeters with a yardstick marked with 5cm markings!
Using cm instead of mm gives a smaller number that looks less bad.
I wonder if they do a bunch of averaging then claim it reduces “error” or “uncertainty”.
“Accurate to within” implies that the underlying parameter could be as much as 35 mm greater than or 35 mm less than the instrument says it is.
That would be my understanding. So unless the difference being measured is greater than 35mm you don’t know if there is an actual difference or not!
Thanks Rud. At our old family place on the sea front on the east coast of Australia, we built the sea wall to the same height as our neighbors [which was king tide height] in 1946. I check that same wall at each king tide and for the last dozen years [normal BP] king tides have ranged from 6 inches to a foot LOWER than they were between 1946 and 1953.
Not hard to see why Pacific atolls are increasing.
Can someone please explain to me why and how the people operating this satellite think that an instrument accurate to 35mm can be used by scientists “to gauge how fast sea levels are rising because of climate change” (direct quote from https://www.jpl.nasa.gov/news/major-ocean-observing-satellite-starts-providing-science-data), when the rate of rising is thought to be of the order of 2mm per year. ie, the instrument is only accurate to the best part of 20 years of sea level rise. Will they be unable to publish any results for 20 years? Actually, for more than 20 years, because after 20 years the error margin can reasonably be expected to be around 100%.
PS. I know the author of the article has declared that the instrument accuracy is insufficient to be useful, but I’m wonderng what can be in the minds of the people promoting it.
“Can someone please explain to me why and how the people operating this satellite think that an instrument accurate to 35mm can be used by scientists …”
Yes, we can! : Scientific illiteracy (some years ago a.k.a. scientific ignorance).
My old “Measurements” prof would say ….If you have some random ruler measurements that range over 1” then a statistician will tell you to take N more readings to improve by the square root of N, while an engineer will tell you that if your ruler is off by an inch, it doesn’t matter how many readings you take.
I’m curious about NASA’s world chart shown in the article, in which the Arctic Ocean is coloured dark blue, presumably meaning that the sea level there is sinking not rising. A 2019 paper states that the Arctic sea level has been rising at 2.2mm per year for 22 years.
https://phys.org/news/2019-07-sea-arctic.html
And the Arctic is the only place where warming is supposed to actually be happening at any significant rate. So fast warming ocean, negative sea level, ok what’s wrong with that picture.
Warmer ocean. Accelerated evaporation?
Accelerated exaggeration.
The expanding Arctic water is simply flowing down hill towards the equator where it is shallower.
How do you measure “sea level” there when it is frozen over for half a year?
2.2mm for 22 years that’s 4.84 cm in the last 2 decades…We’re doomed.
(Not quite 2″)
It is scientifically impossible to keep track of sea level rise measured at about 2.2 mm per year with an instrument that is only accurate to within 580 mm or 350 mm, take your pick.
Correction … the accuracy would be to within 58 mm or 35 mm, take your pick. Still very inaccurate compared to the underlying real world variance of just 2.2 mm per year.
measured by tidal gauges claimed to make measurements accurate to +/- 2.5 cm (that is, for the latest version, acoustical domain, most accurate tidal gauges, not the stick in the mud gauges that have been around for more than 100 years).
statements such as 580 mm or 350 mm assume more accuracy than the claimed 5.8 cm and 3. cm.
On another day, in a different context we will be scolded about a shortage of water.
Dateline London
Can Nasa tell me where my global warming is? It must be hiding somewhere.
Michael Mann keeps it in his pants to prevent Brain Freeze when he pulls his head out of his a$$
I suppose everyone knows that 0.1 mm is about the thickness of a coarse human hair. Slightly amazing that “climate scientists” can measure ocean levels changing by up to 100,000 times this amount during each 24 hours, to human hair accuracy.
And from satellites thousands of kilometers away, through constantly variable atmosphere of 100 kilometers or so.
Just shows what averages in conjunction with climatological magic can achieve.
You left out the computer modelled crystal ball
Especially when one considers that measuring large physical objects in an environmentally-controlled laboratory, with regularly calibrated instruments, to a precision of 0.1 mm can be challenging.
I see now the furrows They ploughed into the sea to increase the radiative surface area. Just like a reader told me yesterday. I thought he misunderstood my request for actual stupid ideas thought up by actual people. Was a bit disappointed at his nonsense fantasy. Now look!
Modern science never ceases to amaze me, who would think ploughing the waves possible?
…or did this happen by divine edict of Lord Baal Gates?
What are the sources (by percentage) of sea level rise currently?
See my linked article on SLR, acceleration, and closure. The numbers are in the closure section.
[User permanently banned for impersonation]
[User permanently banned for impersonation]
[User permanently banned for impersonation]
The precision of “true value” is not determined with any arbitrary number of measurements unless one’s knows the basic accuracy inherent in the measurement device.
In other words, if a hypothetical measuring pole has markings located every foot with each mark having a positional accuracy of ±0.5 inch, it is then impossible to establish a “true value” of length to better than ±0.5 inch accuracy using the pole, even with the number of measurements approaching infinity.
In the case you cite, an average of 5.746 (feet) derived from 200,000 measurements is meaningless without additional information.
[User permanently banned for impersonation]
Lawrence replied: “. . . you are measuring an AVERAGE.”
Clearly, we are done here. Bye, and have a good life.
[User permanently banned for impersonation]
Why do people go to the expense and trouble of buying expensive, high-precision, calibrated instruments if all they have to do is take a lot of measurements with their thumb?
Its even more fun when you realize that to get individual one-foot measurements, you must eyeball whether the guy’s head is closer to the upper or lower mark. Also, are you taller or shorter than the guy? Parallax is a bitch to overcome. Once again, the real world impinges on mathematical clouds in the sky.
ESPECIALLY when each measurement is of a different thing.
So an error of plus or minus 2cm can give you an accurate measurement to 2mm if the measurement is taken often enough?
Yes.
Nope. Your results will all fall into the uncertainty interval. You can plot a downward trend inside the uncertainty interval just as easily as you can an upward trend. Until your differences exceed +/- 2cm you simply don’t know if you are seeing an increase or a decrease.
You neglect to mention what the standard deviation for 200,000 measurements to the nearest foot is going to be.
Lawrence doesn’t understand the concept of random sampling and standard error. It is only for populations that are normally distributed, and there is no reason to assume wave heights are normally distributed, not to mention that the locus of measurement is constantly changing so there is no way to say that you are measuring the height of the ocean at any particular location. And if you really wanted to make a comparison to the height of adult males, you should say, “Take a pole 1,000 feet long marked in 35 foot increments. Measure 20,000 adult males to the nearest mark.” What’s the answer then? Well, zero.
[User permanently banned for impersonation]
Ah yes, the power of the naked assertion.
Data everywhere trembles before it.
[User permanently banned for impersonation]
[User permanently banned for impersonation]
Talking to yourself, eh?
No one has a simplistic understanding here except you. You are making the very same mistake that all mathematicians and statisticians make when confronted with actual physical science.
The central limit theory is only useful in more accurately calculating the mean of a population that has variable members. It *still* leaves you with an uncertainty interval associated with that mean. In the best case the uncertainty of the mean will be the uncertainty associated with each sample, i.e. you use the same measuring device to measure each sample. If the uncertainty of the measuring device is +/- u then the mean you calculate, no matter how accurately you calculate it or how many samples you have, will always remain +/- u.
The central limit theory can only calculate a more accurate “true value” when you have one sample to measure and you take multiple measurements of it using the same measuring device. Each measurement is then randomly distributed around the true value and the more accurately you can calculate the mean the closer you can get to the true value. Of course that is only true if the measurements are not skewed away from Gaussian because of something like random temperature changes affecting the measurement device. In that case you have to factor in the uncertainty of the measurement device due to a non-constant temperature.
Before you start denigrating people over their knowledge of statistics perhaps you should learn about how statistics apply in the real physical world.
[User permanently banned for impersonation]
He can’t. If you’ll look he never quotes an uncertainty interval.
Even the Argo floats have an in-built uncertainty of +/- 0.5C. How do you distinguish a 0.1C difference with a +/0 0.5C uncertainty? You *can* calculate such a thing but if you don’t quote the uncertainty to go along with it then you are simply trying to fool people. A measurement of 0.1C +/- 0.5C is pretty meaningless.
Spencer has stated in interviews that the satellite temperature measurement has an accuracy of, if I remember correctly, =/- 0.2 C. Thus, he explicitly admitted, the small year to year differences published are not statistically meaningful.
Also, human made measurements are very prone to biases that reduce the actual accuracy.
When you lower yourself to the level of insults, it suggests that you don’t have a convincing argument.
Actually is it *not* normally distributed around the true average. That is only true if you are measuring the same thing multiple times using the same measuring device in an unchanging environment. When you are measuring multiple things there is no such thing as a “true value”, only an average. And that average will have the same uncertainty as the measuring device.
[User permanently banned for impersonation]
No, it isn’t. The satellite moves, the sea moves, the satellite temp changes, the sea temp changes. You can *never* go back and measure the same point in the ocean multiple times. It’s the same thing with trying to measure surface temperatures. By the time you take your first measurement time has moved on. You can never go back and take a second measurement. All you can do is measure something different each time.
[User permanently banned for impersonation]
I don’t trust *any* global temperature measurement when applied to “global” climate. Spencer’s metric is better than the surface thermometers because it is one measurement device instead of thousands.
However, I *never* see any uncertainty interval stated for the UAH temperature value. It is simply physically impossible for uncertainty to be zero.
go here for an explanation of how UAH is developed: http://www.drroyspencer.com/2015/04/version-6-0-of-the-uah-temperature-dataset-released-new-lt-trend-0-11-cdecade/
If you can find any place in there that lays out what the uncertainty actually is then I’ll re-evaluate my position on UAH. In the meantime, UAH is a metric that probably has some value. How accurate it is and how much value can be placed on it is a large and unanswered question.
[User permanently banned for impersonation]
[User permanently banned for impersonation]
You really don’t get it at all. The claim is that useful information regarding sea level changes in the range of 2 mm can be achieved using a measuring stick where the minimum increment is more than 10 times the change measured. You are as thick as two planks.
[User permanently banned for impersonation]
Yes, but in your example the measurement interval was comparable to the item being measured. In order to be a true analog, my comparison should have specified a pole with 70 foot intervals. It doesn’t matter how many times you measure a man with a true height of 5.5 feet, you’re never going to get information on his height with a 70 foot pole.
Another problem with your methodology is how do you record the heights? Is everyone less than 6 feet 5 feet tall? Suppose the true average height is 5.75 feet. Then you would need to have 15,000 of your men at 6 feet to balance those recorded at 5 feet. I don’t think you’ll find that a true distribution for American males. Your blunt tool is already not working out of the box, and the differences for sea level are 10X worse.
[User permanently banned for impersonation]
From your link: “Said another way, CLT is a statistical theory stating that given a sufficiently large sample size from a population with a finite level of variance, the mean of all samples from the same population will be approximately equal to the mean of the population. “
You should take careful note of the fact that “true value” is not mentioned anywhere. And “approximately equal” is also an important qualifier.
The mean of a varying population is meaningless insofar as “true value” is concerned. There is no “true value” for the height of a all men in the US. There *is* an average but if you use that average to go out and buy t-shirts for all men in the US using that average value there will be a lot of men the T-shirt won’t fit!
[User permanently banned for impersonation]
I know *EXACTLY* what it means. And it is meaningless in trying to determine a “true value”. Again, does measuring the height of all men in the US and calculating an average of the data give you any kind of a “true value” for the height of anything, including men?
Measuring 100,000 8′ 2″x4″ boards and averaging the measurements won’t give you a “true value” of the boards. There may not be a single board that is the same length as the calculated average.
If you stop and pick up every board you see in the ditch along the highway, throw them in the back of your pickup and when you get home calculate an average length of the population will it tell you *anything* about any of the boards? Will the *average* tell you *anything* useful at all?
I have the same problem with “global” average sea level rise that I have with “global” average temperature. Both are time varying which change on a daily basis, and monthly basis and are also geographically dependent. Yet no analysis seems to take any of this into consideration.
You can’t tell what maximum and minimums are from an average yet the max and min are the *most* important data to know! And max and mins vary widely around the globe for both temperature and sea level.
[User permanently banned for impersonation]
equal to the mean of the population with an uncertainty of the uncertainty of each measurement
[User permanently banned for impersonation]
What does standard error mean to you?
What does uncertainty mean to you?
If you use a ruler that is, for some reason, 12.5″ long instead of 12″, what is the uncertainty for every measurement you make with it? If you take two boards, measure them, and then place them end-to-end, what is the uncertainty interval for the combined length when using that ruler?
Use 100 boards. You can certainly calculate a standard error from the measurements of the population. Does that have any physical relationship to the uncertainty of how long all 100 would be when laid end-to-end?
Uncertainty is *NOT* divided by n, the sqrt of n, or any other number. Uncertainty combines as root-sum-square, period. And even that methodology assumes that *some* of the uncertainty will cancel. You have to evaluate the uncertainty carefully, many times it is more accurate to just add the uncertainties together directly.
You continue to try and pound a square peg into a round hole. Uncertainty simply cannot be reduced in the manner you think.
I see that Lawrence has found some bad statistics to back up the bad science that he has been peddling.
[User permanently banned for impersonation]
[User permanently banned for impersonation]
But that average value is *NOT* the “true value”. The average value will retain the same uncertainty interval that each sample has. If each sample has an uncertainty interval of +/- 35mm then the average value will have an uncertainty of +/- 35mm.
[User permanently banned for impersonation]
Proving a negative?
[User permanently banned for impersonation]
Not accepted in these fora.
From your link above:
I think that you have a responsibility to demonstrate that the sampling of ocean waves with radar meets the conditions necessary for “many situations,” and that they have been “properly normalized.”
“Proving someone wrong” is not equivalent to “proving a negative”. Furthermore, this is science where formal logic applies where proving a negative is not “impossible” (actually, it’s not impossible in real life either but may be hard though).
Not impossible? When did you stop beating your wife/husband? How do you prove it?
You are correct Lawrence.
In the past I’ve had people experiment with these concepts in Excel by creating a population of “true” values and then simulate a sample of “measured” values from the population with various kinds of randomly injected errors ranging from rectangular, triangular, or normal distributions and with varying types of sampling methodologies that represent the population reasonably well. I then have them compare the average of the population to the average of the sample. It doesn’t matter how the population behaves or how the injected errors are distributed or what sampling method is chosen. As long as the errors are random and as long as the sample reasonably represents the population the error in the mean of the sample as compared the population always decreases as the sample size increases and it is always lower than the individual errors you injected into the sample.
And it doesn’t matter if the population has temporal or spatial dimensionality to it. It doesn’t matter if the individual elements in the sample are measurements at a specific location in the temporal or spatial domain. It doesn’t matter if the individual elements were measured by different people or different instruments. The error of the mean of the sample is always lower than the error of the individual measurements. And the more measurements you include in the sample then lower the error of the mean will be. I too challenge anyone who disagrees with Lawerence and I to prove us wrong.
[User permanently banned for impersonation]
If I give you fifty 8′ 2″x4″ boards and you measure them all, 100% sample, can you then build me a stud wall at the mean height that won’t have waves in it?
If you can’t then exactly what use is the calculated mean? It has nothing to do with what the “true value” of each of the boards actually is.
Now, if you take ONE of the boards and measure it fifty times and use those fifty measurements to calculate the mean *then* you can tell me with some assurance how long that 2″x4″ is.
If you can’t tell what the differences in these two situations is then you are simply being willfully ignorant. The population in one situation is fifty boards. In the other situation it is fifty measurements.
In the first scenario, the mean is physically useless for accomplishing anything practical. In the second scenario, the mean actually tells you something physically practical.
Physical science works on the second scenario, not the first.
No. I could not build you a wall at the mean height without waves. But that’s a strawman because no one is claiming that they could. Just like no one is claiming that the ocean height is the MSL at every location and at every moment of time.
You might want to track the mean height of 2x4s for various reasons. One reason might be for quality assurance. You take a sample of the population and you form a single monthly mean value. You then track the monthly mean values over several years. Are they increasing or decreasing? Maybe there is a drift in the cutting machine?
In the same way we might want to track the mean height of the ocean for various reasons. The obvious reason is to see if it is rising or falling. You take a sample of the population and you form a single monthly mean value. You then track the monthly mean values over several years. Are they increasing or decreasing? Maybe there is thermal expansion/contraction or mass inflow/outflow that explains this?
In your second scenario that only helps us validate the length of THAT board. That is an important and useful thing to know. But, it does not tell us if boards are getting shorter/longer over time which is another important and useful thing to know.
Physical science works in all of these scenarios. The mean is an important and useful quantity to know in all of these scenarios.
“No. I could not build you a wall at the mean height without waves. But that’s a strawman because no one is claiming that they could. Just like no one is claiming that the ocean height is the MSL at every location and at every moment of time.”
Sure that is what they are claiming. The whole thread started off by claiming that creating a data base from measurements of different things cold generate a “true value” using the CLT.
Sellin: “Go to 200,000 measurements and you can get 5.746 for the average. The random sampled *ESTIMATOR* of an average is normally distributed around the true value which is why standard error applies.”
The average of a population formed from the measurements of different things does *NOT* represent a true value in any way, shape, or form.
“You might want to track the mean height of 2x4s for various reasons. One reason might be for quality assurance. You take a sample of the population and you form a single monthly mean value. You then track the monthly mean values over several years. Are they increasing or decreasing? Maybe there is a drift in the cutting machine?”
The mean will tell you little if anything. What you need is the max and min measurements. Is the max length increasing? Is the min length increasing. Remember the mean can go up from the minimum increasing while the max stays the same.
“In the same way we might want to track the mean height of the ocean for various reasons. The obvious reason is to see if it is rising or falling. You take a sample of the population and you form a single monthly mean”
And what does that mean tell you? It certainly is not a good indicator that the max height of the water is going up. The minimum level may be going up thus increasing the mean.
” But, it does not tell us if boards are getting shorter/longer over time which is another important and useful thing to know.”
The mean won’t tell you if the boards are getting shorter/longer either. It only tells you something is changing. But you have no way to know what that is.
As with most mathematicians/statisticians you always assume the mean going up indicates the maximum is going up. That is simply not true. It’s the same with the “global” average temperature. Far too many climate alarmists assume the mean going up indicates that maximum temps are going up and the Earth is going to turn into a cinder. What you *really* need to know is not the mean, it is the max and min temps. Something like cooling/heating degree day measurements which are an integral of the temperature curve, not a midpoint between the max and the min temps which actually tells you nothing. When you average something that tells you nothing then the average tells you nothing either!
“Physical science works in all of these scenarios. The mean is an important and useful quantity to know in all of these scenarios.”
You’ve already shown that you know little of how physical science works. The mean is only useful if it can indicate the true value. Cramming measurements of different things into a population tells you nothing about any true value.
My guess is that you would say that if the mean height of all men in the US is going up that it indicates that *all* men in the US are getting taller. And you would call that “physical” science?
Exactly correct, the average will still be bounded by the uncertainty of the measurement instrument, even with 32 trillion observations.
If the population is changing during the time you need to make your 666,000,000 observations, the CTL is null and void.
In other words, a time varying function screws up your population data.
Something they all conveniently ignore.
All a big non sequitur because your artificial populations of “true values” are fixed and unchanging.
Carlo, Monte said: Exactly correct, the average will still be bounded by the uncertainty of the measurement instrument, even with 32 trillion observations.
No it won’t. The CLT and the standard error of the mean formula say otherwise.
Carlo, Monte said: If the population is changing during the time you need to make your 666,000,000 observations, the CTL is null and void.
No. It’s not.
Carlo, Monte said: All a big non sequitur because your artificial populations of “true values” are fixed and unchanging.
No. They aren’t. I encourage you to do this experiment. Model any population you want. Try a simple population with trends, cycles, oscillations, etc. Try a population of a 2D field or 3D space with lots of spatial and temporal variation. You will find that the difference between the average of that population and a simulated sample with randomly injected errors will continue to decline as the sample size increases. This works as long as your sample represents the population without bias and the errors are random.
Your challenge here is to prove Lawerence, Nick, bigoilbob, myself, and the entirety of science wrong.
I’m not going to waste my valuable time leading y’all to water when y’all refuse to drink.
“No it won’t. The CLT and the standard error of the mean formula say otherwise.”
You keep making the same mistake almost all mathematicians and statisticians make. Calculating the mean more and more precisely simply has nothing to do with determining a true value. There is *NO* true value for an independent, random population. That’s why the “global” average temperature or “global” average sea level is such a joke. Those averages do not represent any kind of “true value”. They represent *nothing*. Depending on ocean winds the sea level in the western pacific can be entirely different than the sea level in the eastern pacific. Think wind surge associated with a hurricane. So what does a sea level value in the western pacific averaged with a sea level value in the eastern pacific actually tell you? VERY LITTLE. If the mean changes you’ll have absolutely no idea WHY it changed!
Again, if the average value of the height of men in the US goes up WHY did it go up? Did the max heights stay the same and the min heights go up? Did the max heights go up while min heights stay the same? Did they both go up?
If I give you the average value of 25 can you tell me what max values and min values went into that average? If you can’t tell me that then what does the average tell you? If I tell you the new average value is now 26 can you tell me why the average value went up? If you can’t then how do you determine what the change is telling you?
“You will find that the difference between the average of that population and a simulated sample with randomly injected errors will continue to decline as the sample size increases. This works as long as your sample represents the population without bias and the errors are random.”
Sorry, bdgwx, but you have overlooked the simple, real-world fact that “true” values are only known to the degree of accuracy determined by the measurement device(s) that establish that “true” value.
For if you cannot truly measure an objective parameter (such as physical length), you cannot assert that it has a certain numerical value.
Any cell in an Excel spreadsheet named “true value” would itself have a limited range of accuracy associated with just that entered value. Thus, a proper statistical analysis of sample measurements varying against the entered numerical “true values” must take this fact into account.
If this was done properly, you would have found the lack of perfect accuracy in the “true” values gets transmitted exactly into a component of inaccuracy in any statistical processing performed on the “measured” values.
Simply put, using statistics, one cannot improve fundamental accuracy to a better value than that inherent in the given instrument used to perform a measurement (or any number of similar/repeated measurements).
Call it the conservation of limited-accuracy law.
BTW, Excel spreadsheets have their own limits on calculation/mathematical expression accuracy.
The “average” tells you absolutely nothing about the accuracy of the measurement.
Statistics 101.
[User permanently banned for impersonation]
Not if the sample is changing during the measurement.
If you are going to trout out the Central Limit Theorem in this discussion, you should at least know the limits of its applicability.
The Central Limit Theorem has everything to do with the fact that “in many situations, when independent random variables are added, their properly normalized sum tends toward a normal distribution (informally a bell curve) even if the original variables themselves are not normally distributed.”
It has absolutely no applicability to establishing ACCURACY or PRECISION of a given series of measurements.
This resource may help you: https://en.wikipedia.org/wiki/Central_limit_theorem
[User permanently banned for impersonation]
“Standard error decreases with an increasing number of obs.”
Only if those observations are all of the same thing.
[User permanently banned for impersonation]
No, each sample you take is different. Just like taking temperatures. You wind up with multiple measurements of different things in each case. Each measurement you take is like measuring each different 2″x4″ in a pile of 100 and then throwing it in a shredder to make mulch. Once you do your measurement there is no way to go back and repeat it. Time has moved on. You are looking at a different sample for your next measurement.
Certainly you must realize that when making a broad statement like that there are caveats to be concerned about! For example, offering the mean and standard error of a large number of random numbers, there is no practical meaning to either the mean or the SE.
The SE is applicable to increasing the precision of the measurements of something with a constant value, such as the speed of light in a vacuum. However, measuring the speed of light in many different transparent substances, and particularly in different directions in anisotropic substances, the SE will grow with the number of observations.
What are the conditions required for your statement to be true?
[User permanently banned for impersonation]
You missed the entire point Clyde was trying to get across. If you have different measurements of different things then exactly what is the mean and variance telling you?
Can you order one size t-shirt to fit all men in the US? You can certainly calculate a mean and variance for that population. Can you buy one size of pants to fit all of them?
Do you believe that a repeating decimal is infinitely precise and accurate?
Not if the population is changing during the time needed for the obsevations.
Invariably, as long as any imbedded error – the unadjusted gun sight – is accounted for. And for over 150 years, we have had the tools to do so, and have done so. And whether the distributions of those properly adjusted observations are purely gaussian or not…..
An unadjusted gun sight represents a constant calibration error, not an uncertainty interval. They are handled in totally different manners.
Agree. You adjust the gun sight, just as the non random accuracy errors found in new and old measuring processes are routinely adjusted out. You use statistics 101 to handle an “uncertainty interval”, per the book you referenced, but didn’t link to, and also per any number of other primers.
No, you use the international standard methods given in the GUM. Learn some metrology.
Calibration errors can be adjusted out. Uncertainty cannot. It’s why you can’t hit the same hole in the paper every time at a shooting range.
There is always uncertainty about where the next bullet will hit. It comes from different powder loads each time, different bullet diameters each time, different barrel contact each time (some from barrel fouling changes), from different gun holds each time, from different trigger pulls each time, from a different sight frame each time, and on and on and on. Not even clamping the gun in a vice at the shooting bench can get you same hole accuracy. It’s why the concept of MOA (minutes of angle) exists.
You can fire as many shells as you like, making your sample size absolutely huge. Then you can calculate the average hit point out to the the thousandths of an inch, get the average just as arbitrarily precise as you want. That average will still not predict where the next bullet will hit.
THA’TS CALLED UNCERTAINTY!
“It has absolutely no applicability to establishing ACCURACY or PRECISION of a given series of measurements.”
Simply untrue. The conflation here is that there is no evaluative improvement between having one measurement, and more than one.
The key discriminant between Trump supporters and others lies in the answer to this one question. If you pass the runner in second place during a foot race, what place are you now in?”. Most Trump supporters say. “First place”. Goes to a lack of the ability to devote 10 seconds to critical thought. Google “Short Attention Span Theater” for more…..
bigoilbob,
Thank you for making clear to all the insightful wisdom of Socrates who said “When the debate is lost, slander becomes the tool of the loser.”
So, no technical objections. Yes, we tease the instatisticate. But since we have an entire minority party here that has this problem, I’m happily punching up…..
“The conflation here is that there is no evaluative improvement between having one measurement, and more than one.”
If I give you 200 2″x4″ boards will measuring the first one tell you how long the second one will be? Will the first two measurements tell you how long the third will be? Will 199 measurements tell you how long the 200th board will be?
No amount of measuring different things each time will get you past the uncertainty interval associated with the population.
Now if you took 200 measurements of the first board that will tie down the true value of that one board much more than just one measurement would. But it *still* won’t help predict the true value of the length of the next board. There is an innate uncertainty associated with the next measurand that can’t simply be calculated away by measuring other measurands.
The central limit theory only applies if you are measuring the same sample multiple times using the same device.
[User permanently banned for impersonation]
Not if you are trying to determine a TRUE VALUE! You *must* be measuring the same thing. It is the measurement value that is random and makes up the population data, not the length of the measurand.
When you are measuring different things, i.e. different measurands, the measurements do not represent a random distribution that can be used to determine a true value for anything.
If you buy every man in the US a t-shirt sized to the average how many men will it fit?
[User permanently banned for impersonation]
This is Jethro Tull territory.
No strawman here.
Every time you take a sample of a time varying function you are measuring a different thing each time. You are *not* measuring the same sample each time. You can call it MSL but, in truth it is MSL @ur momisugly t0, MSL @ur momisugly t1, MSL @ur momisugly t2, MSL @ur momisugly t3, ……, MSL @ur momisugly t_n.
Each sample is independent just like measuring the height of all men in the US.
When you combine all those independent samples the average tells you nothing about the true value. There is *no* true value when you have independent samples, no more than the average of 100 2″x4″ boards gives you a “true value” for the length of the boards.
And when you add in the uncertainty of each measurement it gets even more complicated because that uncertainty carries right through it all. Uncertainty is *NOT* a probability distribution (actually it is with the true value having a probability of 100% and all other points in the interval having a probability of 0% – but you don’t know what the true value actually *is* so that probability distribution is not amenable to statistical analysis).Uncertainty is not a Gaussian probability distribution, it is not a Poisson probability distribution, it is not a uniform probability distribution, it is not *any* kind of a probability distribution. If you don’t have a probability distribution then statistical analysis simply doesn’t apply.
That is an important point that is critical to the debate. I’m glad that you pointed it out.
Lol, Lawrence you make me laugh
Any “inaccuracies” here are either random or positively correlated. Random, which is what Lawrence is discussing, is the best you can hope for. If they are positively correlated, the standard error of it’s trend over time will be even smaller.
Nope. Inaccuracies are associated with the measurement of different things using different measuring devices. The uncertainty of each sample carries over to the “average” as well.
Not too thoughtful, Tim. We have known about both the imbedded errors and those randomly distributed for every sea level measuring device/process used for the last 150 years. They can indeed by used together. And there has not been any long term trend in those imbedded errors, much less one that systematically adds to the trends.
big,
The problem is how those imbedded errors are handled!
No one is claiming the imbedded errors are increasing! Put away your strawman!
When you are measuring different things the imbedded error carries over into the calculation of the mean.
And a 2mm +/- 35mm measurement is simply not useful.
Those random errors you mention ONLY work when you are measuring the SAME THING multiple times.
Simple physical science.
“No one is claiming the imbedded errors are increasing!”
Nor was I. But the ONLY way they would matter for trending is if they systematically biased up over time, increasing the trends significantly. Glad we agree….
You *still* have an uncertainty interval associated with a trend as long as the data points used to develop the trend have an uncertainty interval. Trending temperature using a thermometer with a built-in +/- 0.5C uncertainty is meaningless till the difference exceeds 0.5C in one direction or the other. If the difference never exceeds the uncertainty then you can pick any point in the uncertainty interval to graph your trend. It might be up or it might be down, you simply don’t know.
It’s why you can’t build a stud wall using the “average” length of an 8′ 2″x4″. Your wall will have ups and downs that become readily apparent when you try to apply the drywall and see a ceiling with waves in it!
[User permanently banned for impersonation]
No, in the above thread about using a measurement pole “8 feet in length with markings at each foot”, there are two sources of error, each fundamentally different from the other.
First, there is the built-in, constant source of error associated with the (unstated) positional accuracy of the markings on the pole itself.
Second there is the random (i.e., variable) source of error associated with taking each measurement reading and having to interpolate the measurement value just using the one-foot-apart markings on the pole.
Statistical sampling analysis techniques can be helpful in reducing errors associated with the second source (although never driving them to zero) . . . but are totally useless with respect to the first source of errors . . . and therefore are useless in improving accuracy beyond that established by that source.
Note that it was Lawrence Sellin that started this discussion with his above hypothetical statement “Take a pole 8 feet in length with markings at each foot.”
Every “source of error” you mention diminishes during trending, per CLT.
Folks, CLT denial is an absolute prerequisite to AGW denial. Nick Stokes doesn’t even comment on it any more. I’m guessing he realized that it is hard wired in WUWT commentary. Along with a plethora of interesting, alt.theories about why they can’t break out into superterranea.
Too bad Willis E found “other uses for his time” than attempting to write a peer reviewed paper. He might then have been amenable to my request for uncensored monthly updates on the exchanges with his reviewers. I would love to get more insight on how corrupt they really are…
No, the sources of error do *not* diminish during trending.
Even when you are measuring the same thing with with the same thing multiple times, the only thing that goes away is the error in the *readings* of the measurement device. The readings are typically ASSUMED to be randomly distributed around a true value. Therefore the mean of the readings with a random distribution cancel each other out and the average is, again, ASSUMED to be the true value. But even here you *must* be careful with the assumptions. For instance, with a micrometer measuring device if it is not tightened on the measurand with the same force during each measurement then the readings do *not* represent a random distribution around a true value. The average of the reading will have to have an uncertainty interval applied commensurate with the possible difference in applied force during each measurement. It simply doesn’t matter how accurately you read the micrometer each time the “force” errors simply do not diminish.
When you are measuring different things with different things then CLT simply cannot tell you anything about the mean representing any kind of true value. In this case the uncertainty of each data point adds with all the rest in a root-sum-square result. In fact, the more data points you have the higher your uncertainty interval becomes.
Get John Taylor’s treatise on error analysis and read it for meaning.
[User permanently banned for impersonation]
Nope. The distance to the surface changes constantly. Wind, temperature, orbit perturbations, even the moon changes the distance to the surface on a daily and monthly basis. You are *never* measuring the same thing over and over. You can’t take multiple measurements of a time varying subject, time moves on relentlessly.
[User permanently banned for impersonation]
It doesn’t matter Tim. The standard error of the mean doesn’t use timestamps as an input or even the units of measure. And the mean over a period time is still one quantity. There is one and only one value for it. The thing you have to watch out for is that your sample should adequately represent the temporal and spatial domain of the population. If your sample has measurements that are clustered in time or space that’ll will be a problem. But if the sample has good temporal and spatial distribution then the uncertainty of the mean of the sample will be lower than the uncertainty of the individual measurements. It is usually the sampling error (the way the sample was selected) that raises the final uncertainty above that implied only by the standard error of the mean.
“The standard error of the mean doesn’t use timestamps as an input or even the units of measure.”
And you just stated the problem while trying to imply that it isn’t the problem.
“And the mean over a period time is still one quantity. There is one and only one value for it. The thing you have to watch out for is that your sample should adequately represent the temporal and spatial domain of the population.”
And how do you make the mean represent a temporal and spatial relationship? Does the annual mean of temperature at a single location represent the temporal relationship of the temperature? Does the daily mid-range represent the temporal relationship of the daily temperature? Does the average of two mid-range values, one from the east coast and one from the west coast represent the temporal and spatial relationship of the temperatures? Does the average of the daily mid-range temperatures at Lymon, CO and Pikes Peak, CO represent the temporal and spatial relationship of the temperatures?
“If your sample has measurements that are clustered in time or space that’ll will be a problem.”
It’s *more* of a problem if they are *not* clustered in time or space!
“But if the sample has good temporal and spatial distribution then the uncertainty of the mean of the sample will be lower than the uncertainty of the individual measurements”
Impossible. Uncertainty is *not* a probability distribution. It can’t be decreased. It carries over to the mean, it doesn’t cancel.
If I have a board that is 1′ +/- .1″ and a second that is 1′ +/- .1″ and I lay them end-to-end the overall length can be somewhere between 2′ – .2″ and 2′ + .2″. Taking their mean, 1′, in no way decreases the uncertainty in the overall length. In fact the uncertainty grows from +/- .1″ to +/- .2″ when you add the boards together. Extend this as far as you want. Use three boards and you get 3′ +/- .3″. With ten boards it becomes 10′ +/- 1″ Because some of the uncertainties probably cancel it is “assumed” that the root-sum-square probably gives a better representation of the final uncertainty. But the uncertainty *still* grows, it never cancels out!
Why is this so confusing to so many mathematicians and statisticians? Even apprentice framing carpenters understand the basic, fundamental physical concept!
When you have INDEPENDENT and RANDOM measurements, such as the distance between a satellite and the ocean surface, the uncertainties in those measurements grow by root-sum-square. You simply cannot cancel them out. If the uncertainty of one measurement is +/- 3.5cm then the uncertainty will *never* be less than +/- 3.5cm no matter how many digits you use in calculating the mean. And when you use yesterday’s mean and today’s mean to calculate a difference and that difference in the means is less than the uncertainty interval you truly have no objective idea if the difference in the means is actually the true value!
You use root sum square to quantity uncertainty when you add measurements.
You use standard error of the mean to quantify uncertainty when you average measurements.
You use standard error of the regression (or trend) to quantity uncertainty when you do a regression (trend) on the measurements like with a linear regression trend.
“No, the sources of error do *not* diminish during trending.”
Agree. What gets diminished is the standard error of the TREND. Do you actually believe that a trend containing 100 points of equal standard deviation is as durable as that same trend containing 1000 such points? Not rhetorical, do you?
Once again, you are introducing a dog’s breakfast of claims here. Every example you cite, whether relevant or not, has been evaluated, and both systemic biases and random variations are (1) known, and (2) properly accounted for..
But more to the point, you are clue free on how little these individual measurement errors, whether repeated (and therefore rightly adjusted out) or random, affect the trending under discussion. If you look at the actual statistics used to find the standard error of a trend, the scales would fall from your eyes.
The standard error does *NOT* diminish. It grows by root-sum-square of the individual uncertainties.
If those 100 and 1000 data points are independent and random then the population with 1000 data points will have a LARGER uncertainty interval than the one with only 100 data points. If all the uncertainties are equal then your root-sum-square becomes:
u_100 = (10) square root( u)
u_1000 = (32) square root(u)
The more boards you lay end-to-end, each with an uncertainty, the more uncertain the total length becomes. It’s not just math, it is common sense. You can’t cancel uncertainty by laying more boards end-to-end!
There are two scenario’s, one is calibration error and the other is uncertainty. Calibration errors can be adjusted out. Uncertainty cannot. And when you have an uncertainty of +/- 3.5cm that is *not* a calibration error that can be adjusted out. It is an uncertainty that must be carried through to the final result as root-sum-square.
“Get John Taylor’s treatise on error analysis and read it for meaning.”
Funny you should mention it. Of course you and Clyde Spencer don’t link to it, because, in toto, it validates everything I have been saying. Clyde’s faux “quote” from it only tried to exemplify the fact that whether you add or subtract expected values, the uncertainty increases. But those “uncertainties” do NOT merely add, as you can not simply add standard errors. Taylor treats this properly, beginning on page 60. I didn’t read thru to his treatment of the statistical build up to the formula for the standard error of a trend, but I am sure that it agrees with the Stat 101 definition.
“https://www.niser.ac.in/sps/sites/default/files/basic_page/John%20R.%20Taylor%20-%20An%20Introduction%20to%20Error%20Analysis_%20The%20Study%20of%20Uncertainties%20in%20Physical%20Measurements-University%20Science%20Books%20(1997).pdf
Does the term root-sum-square mean anything to you? This is what Taylor starts to lay out on page 60.
If you have measurements with uncertainty then the uncertainties add as root-sum-square.
Let your values be x1 +/- u1, x2+/- u2, and x3 +/- u3. Then assume u1=u2=u3.
If the uncertainties are known to be independent and random then the total uncertainty becomes:
u_t = square root( u1^2 + u2^2 + u3^2)
root sum square
He also states that u_t is never greater than the their ordinary sum u1 + u2 + u3.
Uncertainty *always* grows, You can’t cancel it out with statistics. Uncertainty is *not* a probability distribution therefore statistics don’t work on it.
It’s why a trend line has to include the uncertainties associated with each data point. And when those uncertainty intervals are greater than what you are trying to discern you are only fooling yourself that you *can* discern something from a trend line.
Once again, you quit reading when convenient.
“Uncertainty *always* grows, You can’t cancel it out with statistics.”
No, but you can reduce it. You should’a done your homework, Tim. For averages, see p98, and Stat 101 equation 4.14. Same for trending. Note in chapter 8 that the number of observations parameter is, AGAIN, in the denominator. Or you can just look up the actual formula for the standard error of a trend from Excel help, or in dozens of other sources.
I’ll say it again, folks. AGW denial depends on denial of the roots of statistics that have helped us out for centuries. That’s why I sky on the mythology that flourishes here about these alt.theories and how come the rest of the world just doesn’t understand me. The Rule of Raylan continues to apply:
Page 97 states: “Suppose we need to measure some quantity x, and we have identified all sources of systemic error and reduced them to a negligible level”
systemic error would be like your gunsight example.
Read the statement closely. You are measuring “x”, not x1, and x2, and x3, and x4. You are measuring the SAME THING multiple times!
Taylor gives you a list of measurements of x: 71, 72, 72, 73, 71.
This is *NOT* like measuring sea level where you are measuring different things each time. When you are measuring the same thing with the same measuring device you get random MEASUREMENT errors around the true value! These measurements are *NOT independent, random measurements.
That’s *NOT* what you get when you jam independent, random measurements together!
Look at the example on page 104. You get multiple measurements of the length and multiple measurements of the breadth. You use those multiple measurements to get a more accurate true value for each.
You do *NOT* measure 20 different rectangles, find their averages and call that the true value for ALL rectangles.
“’ll say it again, folks. AGW denial depends on denial of the roots of statistics that have helped us out for centuries. “
This is a big pile of manure. The problem is that you simply have no real understanding of metrology at all. You can’t even read Taylor and apply his methods correctly in the real, physical world.
I don’t see why it’s so hard to understand that satellite measurements are not measuring the same thing every time. It’s like you have a balloon in the middle of a field, and measure the distance to that balloon, then walk a big circle around it, and measure again, then saying that’s measuring the same thing.
It’s what you get when non-engineers try to understand the real world.
“Well, I’m measuring MSL. Isn’t that the same thing every time”?
That’s like saying “Well, I’m measuring boards. Isn’t that measuring the same thing every time?”
No concept of the fact that each board is different from the next board. There is *no* true value determined from measuring 1000 different 2″x4″ boards.
[User permanently banned for impersonation]
I am very glad that I do not have to rely upon you to survey and construct any bridges for me.
Actually, Sellin didn’t allow for interpolation. He specifically posed the experiment as taking all measurement to the nearest foot.
Clyde,
If the intent of the hypothetical situation was to measure heights of 20,000 different adult males using a single 8 foot pole with markings only every foot and to record measurements only to the nearest foot-mark, perhaps you can provide a more suitable word than “interpolation” for the judgement process used to determine whether to record to the higher foot-value or the lower foot-value when a measurement visually appears to be “right between” the two marks?
As a matter of fact, what is name of the mental process used to decide which value to assign to any measurement that does not appear visually to be “exactly” on one of the measurement marks?
If you suggest the word “approximation” for this, I then request you distinguish, in the practical sense for this gedanken experiment, “approximation” from “interpolation”.
More simply put: over the 8 foot total length of the pole, isn’t the person using that pole just interpolating the overall height measurement to the nearest foot mark?
And this human interpolation has to be included in the uncertainty of the final result, which will be on the order of about 1/4 of a foot.
You’ll never convince a mathematician or statistician of physical reality and uncertainty. To them a repeating decimal as a result of a calculation is infinitely precise. To them averages of independent, random populations represent a “true value” with zero uncertainty.
[User permanently banned for impersonation]
The problem is that you are misusing the THEROM you keep quoting! The Central Limit Theorem only applies to calculation of the mean. It does *NOTHING* to eliminate the uncertainty associated with that mean. You simply cannot assume that uncertainty cancels out. Uncertainty is not a probability distribution amenable to statistical analysis.
I simply cannot understand why that is so hard for mathematicians and statisticians to understand.
If I take you to a shooting range and let you fire 1000 rounds through one of my revolvers can you calculate the mean strike point for those thousand rounds? Of course you can. And you can calculate it out to far more preciseness than you can actually measure.
Will that arbitrarily precise mean tell you where the 1001 round will hit?
Of course it won’t. And that is the very definition of uncertainty. You can’t use the CLT to calculate that uncertainty away. And that is in an experiment that does not provide absolute independent and random measurands! Independent and random measurands as in trying to find the true value of the MSL.
You are correct here, that Sellin keeps harping about theorem versus theory is telling, methinks. There is of course a lot statistics in the GUM (more than I will ever grasp), but my understanding is that the authors are more to the metrology side rather than pure statisticians.
Some people posting here believe “you can falsify a THEORY, but you cannot falsify a THEOREM”.
How utterly wrong.
“The (in)famous Jacobian Conjecture was considered a theorem since a 1939 publication by Keller (who claimed to prove it). Then Shafarevich found a new proof and published it in some conference proceedings paper (in early 1950-ies). This conjecture states that any polynomial map from C^2 to C^2 is invertible if its Jacobian is nowhere zero. In 1960-ies, Vitushkin found a counterexample to all the proofs known to date, by constructing a complex analytic map, not invertible and with nowhere vanishing Jacobian. It is still a main source of embarrassment for arxiv.org contributors, who publish about 3-5 false proofs yearly. Here is a funny refutation for one of the proofs: https://arxiv.org/abs/math/0604049 —
‘The problem of Jacobian Conjecture is very hard. Perhaps it will take human being another 100 years to solve it. Your attempt is noble, Maybe the Gods of Olympus will smile on you one day. Do not be too disappointed. B. Sagre has the honor of publishing three wrong proofs and C. Chevalley mistakes a wrong proof for a correct one in the 1950’s in his Math Review comments, and I.R. Shafarevich uses Jacobian Conjecture (to him it is a theorem) as a fact…’ ”
— Source of the above quoted text: https://mathoverflow.net/questions/35468/widely-accepted-mathematical-results-that-were-later-shown-to-be-wrong
Exactly! . . . but the “uncertainity” in this case is really the measurement accuracy (±0.5 feet) PLUS the inaccuracy of the markings relative to placement exactly every 1.000000000… foot apart.
And no amount of averaging will ever remove all of these sources!
No will any appeal to the Central Limit Theorem to “save the day”.
Actually you’d probably get an average around 5.9 feet in the US which I’m assuming is where you are measuring. This is because even though the average height is 5 foot 9.3 inches (5.78 feet) according to the info I found, everything from 5 foot 6 and up would get rounded to 6 feet. This means a good number of men shorter that the average would register as taller than the average when only measured to the nearest foot. In other countries you’d get anything from 5.25 to 6 feet.
[User permanently banned for impersonation]
Precise and accurate are two different things. And the precision of a measurement can’t be increased by calculation. The precision of a measurement is determined by the measurement device.
You can’t make a 12″ ruler marked in 1/8″ increments precise to the micrometer level simply through calculation. Your precision will never change from the 1/16′ interpolation.
I can only assume you are a math or statistics major and have not been responsible for actual engineering projects that carry liability with them. If you are building a bridge and order 1000 I-beams based on an *average* length you will wind up throwing a bunch away (i.e. huge cost) for being too short or too long. Either that or you will have to order a bunch of fishplates to fix the short ones and have to spend manpower, time, and money to cut the ones that are too long.
OR you can specify a precision and accuracy for the I-beams that make them too expensive to use.
Precise is how many digits you can read out to. You can’t increase that with calculations. Accuracy is how close to the true value you are. You can fix that with calculations based on measuring the same thing multiple times. You can’t fix that by measuring different things and jamming the measurements into a population data set.
[User permanently banned for impersonation]
That’s right Tim. The precision of individual measurements does not get better with more measurements. But the precision of the mean does get it better when you add more measurements to the sample. And if the accuracy of those individual measurements is randomly distributed then the accuracy of the mean of the sample gets better too.
Nope. The precision of the mean is limited by the precision of the measurements used to calculate that mean. It’s the same with uncertainty. The rightmost significant digit can’t be more precise than the uncertainty interval. Trying to do that is only fooling yourself. If your uncertainty interval is +/- 0.5C then you stated value should never be more than the tenths digit. Anything else is false precision.
Please carefully note what you wrote: “the sample”. Multiple measurements of “the sample” can allow you to calculate a more accurate “true value” but it can never be more precise than the data used to calculate it.
When you state “the sample” you are eliminating the use of multiple measurements of “different samples” from consideration. And multiple measurements of “different samples” is what you get when you take measurements of the sea height over a period of time.
You simply cannot have your cake and eat it too!
Pick one and stay with it. Multiple measurements of the same thing or multiple measurements of different things. Each works differently.
[User permanently banned for impersonation]
Or more likely, his bridge will fail the very first time it is loaded, assuming that he even complete the project.
Loser Larry,
Rud has forgotten more than you will ever know.
[User permanently banned for impersonation]
This isn’t an issue of math/statistics but how math/statistics apply in physical science.
You apparently don’t have a good understanding of that at all.
[User permanently banned for impersonation]
I understand CLT perfectly.
I understand that it applies to multiple measurements of the same thing so that the measurements become the random variable.
I understand that it does *NOT* apply when the measurements are not of the same thing so that the multiple things become the random variable, not the measurements.
[User permanently banned for impersonation]
[User permanently banned for impersonation]
Apparently not here, in spite of your desperate appeal to Watts Up authority.
And we also hear from boob
Troll-a-rama
New gadget for virtue/status signalling…
The graphic design is more misleading than accurate. If I were a an alien from a galaxy far far away, which I am not, I would think the oceans were on fire with a little symbolic green thrown in.
NASA should think a bit more about their image when putting out images to show accurate measurements.
Colors have cultural interpretations imposed on them. That is, in the Western World, red is used for stoplights and signs. The color of blood is commonly used as a warning. So, as in the misappropriation of the meaning of words like “acid” “tipping point,” red seas subliminally suggest a severe problem. It is another indication of the lack of objectivity in the debate.
Why would anyone expect this tech to work for a 2mm a year SLR with variable waves, storms etc. Who signs off on this kind of thrown away money.
There is obviously some kind of hurry to find acceleration in sea level (and other signs that point to climate disaster). The 6 yr
cooling period we are in and the long cold 3 recent winters in Europe that depleted their stored gas supplies and resulted in opening of three coal power ops shows a meme in crisis. Those whose livelihoods are threatened are in panic. We will be getting a flood of doom going forward.
So, I can use my 1970s metal tape measure instead of the usual micrometer? That will save alot of time and money in my precision projects.
I think that it would be a tradeoff between money and time.
Rud,
Were any uncertainty ranges provided to go along with the estimates of accuracy?
No.I provided the hyperlink directly to the news release. You can check for yourself.
Hi everyone, can I ask a question? Could all of the rivers that drain into the oceans be depositing silt into the oceans and displacing enough water to effect sea level?
Not measurably. Average ocean depth is ~4000 meters, and oceans cover 79% of the planet’s surface.
Thank you. I see that they will eventually be offering a third ‘product’ that they claim will be even more ‘accurate.’