By Rud Istvan,
Nearly two years ago (January 2019) over a pleasant lunch, Charles urged me to examine whether the NASA satellite altimetry (satalt) measurements of sea level rise (SLR) were fit for purpose. I eventually provided a longish, somewhat technical guest post concluding they were NOT based on NASA’s newest ‘bird’, Jason-3, while also showing that NASA PR was provably obscuring that. Satalt simply does not correspond with the BEST SLR tide gauge measurements by a factor of about 1.5x. That is not rounding error; it is a big climate data problem.
Jason-3’s replacement, Sentinel-6a, has just completed ground testing and is scheduled to launch November 2020 from Vandenberg AFB. A bit of background. These satalts are necessarily in low earth orbit (LEO). That means they encounter slight atmospheric drag (from Earth’s thermosphere), so their orbit deteriorates, so they do not last long: an average of only 5 years operationally. Jason-3 launched in early 2016. This 4Q2020 launch will allow about 6 months of calibration overlap before Jason-3 must be decommissioned thanks to its orbital decay. Going to be close, because the Sentinel-6a launch was originally scheduled for 1Q2020. Conceptual image of Sentinel-6a below is courtesy of ESA. The ‘roof like’ projections are its solar cells. The downward projections are antennas aimed at Earth. And its odd house like configuration explains why thermospheric drag is such a big LEO orbit problem.

Sentinel-6 is actually two identical satellites, (a) and (b), both to be launched into the same LEO orbit as Jason-3 at 1336km mean original altitude. (b) will sit in inventory and launch in ~2025 to replace (a) for a total mission life to about 2030. Both were built in Europe by ESA, incorporating a couple of JPL.NASA developed instruments. Both will ride NASA launches.
NASA’s big press release yesterday on completion of Sentinel-6 operational ground testing says it will provide ‘centimeter’ precision: “measuring down to the centimeter for 90% of the world’s oceans.” Is that true? Dunno, and there is no way to tell yet because after several hours of researching, neither ESA nor NASA have evidently provided a detailed description of the accuracy and precision of their coming Sentinel-6 data products. But we know some relevant stuff…
It is true that Sentinel-6 contains new plus improved instruments. The five specifically named instruments for SLR by both NASA and ESA are:
- Poseidon-4, a new higher resolution synthetic aperture radar altimeter,
- AMR-C, a new ‘climate quality’ multi-frequency radiometer for humidity,
- GNSS-POD, a GPS guided POD (positional orbit detector),
- LRA, a laser retroflector array for POD,
- DORIS, a ‘Doppler orbitotography and Radio positioning integrated by satellite’ for POD—whatever that actually is and supposedly does.
This NASA/ESA technobabble requires both translation and then contextual positioning. Recall the three main Jason-3 accuracy/precision weaknesses from my previous technical Jason-3 post: orbital decay, humidity retarded radar altimetry, and ocean surface wave height.
The higher resolution synthetic aperture radar altimeter, at higher pulse rates, enables a rough estimation of wave heights, at least those above the 2 meter arbitrary average assumed by the Jason-3 signal processing. That helps some.
The multi-frequency radiometer (different frequencies for different altitudes) provides a better estimate of humidity retarding effects to the main altimeter.
The last three instruments collectively provide a more robust triangulation of the inevitable orbital decay over time.
So, it is conceptually possible that Sentinel-6 could achieve a statistically robust 1cm sea height resolution. But nowhere that I can today find is this ‘fact’ explained by published technical specs. There simply is nothing specific on line (yet?) about Sentinel-6 overall ‘data product’ accuracy and precision. Deliberate?
Two final thoughts
First, the best long record calibrated (to vertical land motion) tide gauge estimates of SLR are about 2.2mm/year, with NO acceleration, AND closure. So, even if the new Sentinel-6 1cm claims are true, they are still not fit for purpose by a factor of about 4x SLR mm/year. And this satalt only lasts ~5 years.
Second, if Sentinel-6 really is this good, then it should (inaccurately) find about 2.2mm of SLR per year, proving Jason-3 was a goof as its published tech spec showed. Personally, I think the chances of that data driven scientific outcome is near zero, because the Jason-3/Sentinel-6 calibration overlap period enables any necessary Sentinel-6 data processing algorithm ‘adjustments’. We already have such ‘adjustments’ shown many different ways for NOAA/NASA surface temperature UHI homogenization. (See essay ‘When Data Isn’t’ in ebook Blowing Smoke for multiple compelling examples.)
I’m still waiting on OCO-II revelations and I’m cynical about any new satellite measurements because of it. All the FUD bestowed on current satellite temperature measurements, even though they correlate with balloon instruments, proves my point. If it doesn’t match their bias they’ll either ignore it or make one that will.
Rud ==> Even if the new satellite could be accurate to 1 cm (previous versions were 2-3 cm) — that is for a stationary surface. Like a baseball field with a GPS target in the middle.
As you and I know full well, the surface of the seas are not stationary – they are not smooth — they are not at a constant level.
The adjustments made for any one sat measurement of a single point are at least one order of magnitude greater (in some cases multiple orders of magnitude greater) than the ANNUAL change claimed to being measured. Tide levels, waves, chop — not to mention the occasional just plain odd “bump” –are all being “controlled for” in ad hoc manners.
Satellite sea level measurements may help us in some way, but they will not be able to tell us how much the surface of the seas are rising or falling during this historical period when the magnitude is believed to be in the single-digit mm range.
Kip, true. My Jason-3 post provided an image from GRACE of the very lumpy earth gravitational geoid proving sea level isn’t level.
Kip, I could have been clearer. The GRACE gravitational geoid shown that EVEN IF there are no waves and tides, sea level is still not level because of gravitational anomalies.
Regards from one old ‘rag’ sailor to another.
..and gravity effects the satellites too
There’s a constant “sea level rise” right over all the sea floor volcanoes in the western Pacific
gravity is stronger over them
… and don’t forget the effects of high and low pressure systems …
This question of atm pressure is interesting. Years ago the U. Colerado team stopped publishing their data without “inverse barometer correction”. I asked why it was no longer on their main page and where I could find a link to non IB version. I was brushed off summarily and told it no longer was publicly available. I wonder why not.
I can see why it may be useful on a local level to be able to remove storm swell to get a weather independent mean sea level but how can this be relevant to the global average MSL dataset ?
Since storm swell simply moves water left or right locally, it MUST be net zero effect: it cannot pull all the water on the planet up or down.
Whether IB does change the results, is exactly what I wanted to check and if it does let’s guess which way the adjustment takes it.
I downloaded two versions of the Jason data at about a year of interval and they were totally different: like going up were the previous version went down and vice versa. I realised at that point that it was all complete fabrication and stopped taking any notice of satellite altimetry.
It is pseudo-data, rigged to give the result they “expect” to see.
GRACE measurements are highly indirect, and require tons of post-processing. I suspect that there are quite a few additional assumptions or parameters involved. There is no independent measurement to compare GRACE data to. I remember seeing a GRACE video showing waves moving from the U.S. west coast over the Pacific, probably an artifact of post-processing.
Satellite altimeters rely on GRACE data. But there is an independent measurement available – tide gauges. They don’t require a lot of processing. And they disagree with satellites.
Regarding waves, it is not just a question of a wave height – also of a wave symmetry. The mean level is not necessarily in the middle between the crest and the trough. A centimeter precision seems rather optimistic.
George — “Satellite altimeters rely on GRACE data.”
The Jason series satellites have their own Radar Altimeters. Unfortunately, their Field of View is rather large — 10km diameter as I recall. If I understand it, and I might, they apparently get their estimate of sea surface distance from looking at the rise of the radar return waveform and — IIRC — assuming that the range corresponding to the time the signal reaches half the eventual signal level is the “true” sea surface distance.
I imagine that they do use GRACE derived Earth models in their data analysis. I mean, like, what’s the alternative?
Jason 3 is also not giving the desired output which is why climate catastrophe believer don’t talk about it and some would say why it needs to be replaced.
At a minimum, NASA/ESA should publish a complete measurement uncertainty budget. I would suggest that they have the experts at NIST help out if they don’t know how to do this properly.
Rick — There are “Satellite Handbooks” on the internet that actually do go into computation and error analysis fairly extensively. The Jason-1 handbook is at https://www.aviso.altimetry.fr/fileadmin/documents/data/tools/hdbk_j1_gdr.pdf
Why not download it and see what you think? I was impressed.
Don: Thanks for the link. Looks like interesting reading. I did find the accuracy specs quite easily. +/- 4.2 cm for IGDR measurement and +/-5.2 cm for GDR. These are stated as 1 standard deviation values so the 95% confidence levels would be about +/- 8.4 and 10.4 cm respectively (+/- 84 mm and 104 mm). The actual performance seems to be mostly very close to these specifications. Very impressive if correct, but is this accuracy adequate to distinguish between 2 mm/y and 3.5 mm/y sea level rise? I looks to me as though the uncertainty is an order of magnitude greater than the claims made based on these measurements.
When I read back then NASA’s proud announcement of the launched a satellite to measure SL +/- 4cm I thought what a crock that is. I was astounded that anyone would waste so much money on an instrument who’s only possible value could be as a PR exercise. But I guess they’ve got to keep the funds coming. It won’t be any news to most WUWT readers but factors such as the elliptical tidal wave, non-spherical earth, interference of land masses with tidal propagation complicated by long term random drivers of day to day SL such as El Nino/La Nina, Southern Ocean Oscillation added to the fallibility of the satellite/instrumentation and the myriad arithmetic fiddles needed to get an “änswer” means the logic of trying to capture all the transient changes in SL world wide and then develop “tricks”to make sense of them is inherently faulty. It is unnecessary and cannot offer a better frame of reference than land based measurements at geologically stable sites such as Garden Island in Sydney Harbour. That’s before trying to stitch the satellite records onto decades, centuries even of tide gauge records – Hockey Stick stuff.
Rick –> Let’s assume uncertainty is +/- 84 mm. Uncertainty means you DON’T KNOW where the true value is located within that interval.
You would have to quote the measurement as 2 +/- 84 mm. I’ll bet that is never discussed.
We’ve seen that post glacial rebound is fast enough that water gauges along the east coast disagree markedly on how much sea level rise there is. One tiny technical detail is that we are using GPS to measure the post glacial rebound. example
Given that the Earth’s surface isn’t static, my first question would be, what are these satellites using for a reference? My second reaction would be that there’s too much math involved in getting the data. Math always involves assumptions and the tiniest mistake in any of the assumptions can increase the errors greatly. Anyway, we need a robust explanation for why the satellites disagree with the tide gauges.
Anyway, we need a robust explanation for why the satellites disagree with the tide gauges.
AS everyone paying attention may recall. When the satellite measurements began in 1993, the satellite was showing 3.1mm, while the tide gauges showed approx 2.0mm rise per year.
Later the satellite measures were ” downward adjusted ” to show the agreement with the tide gauges starting in 1993. After the downward adjustment starting in 1993, and with the ” accurate ” satellite measurement today of 3.4mm, there is suddenly massive acceleration of SL.
Oddly, the tide gauges today still show annual SLR of approx 2.3mm.
Can someone explain how the tide gauges are very accurate in 1993 (confirmed by the satellite measurement ) and very accurate since the 1800’s but somehow grossly wrong 20 years later ?
Joe, one basic problem with tide gauges is that each is sinking or rising a bit because of local conditions — glacial rebound, earthquakes, sediment compaction, pumping of fluids. Plus which,some of them move occasionally because of port repairs. It’s not clear that moves are always recorded or how perfectly the devices are recalibrated after moves or repairs. There would appear to be somewhat more phenomena that will cause a tidal gauge to read too high than too low (e.g the pier the gauge is tied to slowly sinking into the muck is more likely than the pier slowly levitating), so the tidal gauge average may be a bit on the high side.
Conceptually, it should be possible to measure the local tectonic changes in tide gauge absolute elevation. But the changes are so small, that it’s quite difficult to do to the accuracy required. I’m not aware that it has actually been done with any consistency.
“Conceptually, it should be possible to measure the local tectonic changes in tide gauge absolute elevation. But the changes are so small, that it’s quite difficult to do to the accuracy required. I’m not aware that it has actually been done with any consistency.”
Actually a lot of tide gauges do just that nowadays by DGPS:
https://www.sonel.org/-GPS-.html
However it takes a number of years to get a good enough signal to correct the gauge, despite this being a vastly simpler measurement than measuring a satellite orbit with the same precision.
All of the tide gauges that I have examined closely have a GPS unit attached, and the sea level readings are adjusted to allow for the rise or fall of the land. NOAA don’t want to do that, so their data is suspect.
Correctly adjusted tide gauges anywhere in the world tend to show an annual rise of 1.7mm.
“Shut up!”, they explained.
I don’t understand the need for an expensive satellite solution when we have a cheap ground based system that works IE tide gauges.
NASA does satellites. NOAA does tide gauges. QED
An inherently inaccurate system provides much more opportunity for adjustments that produce the desired outcome.
Tide gauges cover, what, perhaps 0.01% of Earth’s ocean area. None are located in deep water. All are subject to local land/seabed uplift and subsidence.
Need more?
Sea level is only of concern where it interacts with the land. Despite all the short comings with sea level guages, they are still the most material data set, providing information on something of relative importance.
Global sea level change is only of concern where it intersects with global climate change.
No global sea level change is only of concern where it intersects with land which is where the people and land based life is. The fact the gauges are on the land as they go up or down is good because it’s only the relative moment that is important.
LdB posted: “global sea level change is only of concern where it intersects with land which is where the people and land based life is.”
There is the simple fact that costal tide gauges DO NOT measure global sea level change. Never have, never will.
Exactly, tide gauges cover where 95 percent of the costal population lives.
Yes, and the stilling pond beside the widest piece of sea level in the world is telling us that there has been absolutely nothing happening for the last century. MSL two and a half inches LOWER than 106 years ago:
http://www.bom.gov.au/ntc/IDO70000/IDO70000_60370_SLD.shtml
Without accurate correction for land uplift or subsidence in the area of Fort Denison (Sydney), that “stilling pond” provides no useful information related to the change of MSL there or in the adjoining “widest piece of sea level in the world”.
A few years ago a GPS/surveying study was done that showed Fort Denison was sinking at some 0.4mm/year (iirc) over the period of the study…
(can’t find the study reference, sorry)
Given that the average trend in the Fort Denison trend is 1mm/year, , that gives a relative sea level rise of some 0.6mm/year
The stilling pool at the Bondi bathes pump gives very similar results.
It is also measured that all of Australia is moving northwards at some 6-7mm/year
(number is only from memory)
Don’t forget about all those Pacific atolls increasing in size over that “widest piece of sea level in the world”.
How exactly does it matter if deep water level changes? Relative to what, the center of the earth?
The only place sea level matters is where there is inhabited land at the shore.
The only useful data is the relative rise of water so that local communities can adapt as the Netherlands has done for centuries now.
How is it easier to measure the distance from a satellite in a decaying low earth orbit to a constantly fluctuating water surface than to establish the motion of the land on which a tide gauge is attached and calculate the absolute sea level at that site?
Gordon A. Dressler
This is the reason why all people correctly evaluating tide gauge data use GIA corrections, mostly based on GPS.
https://www.sonel.org/-GPS-.html?lang=en
Need more?
J.-P. D.
Yes . . . much, much more.
As I’ve posted in detail elsewhere, GPS, by its relatively poor ability to establish vertical position (elevation) compared to latitude and longitude position and by referencing an ellipsoid model of Earth instead of the much more accurate geoid model of Earth, cannot even provide cm/year resolution (accuracy) of earth surface changes, let alone the mm/year resolution (accuracy) needed to correct tide gauges.
And the needed corrections go far beyond just those associated with GIA. For example, ever hear of land subsidence caused by pumping water out of underground aquifers?
In Canada we used to have a network of microwave towers that beamed television signals and telephone calls across the country. In 1972 the first Anik communications satellite was launched. The satellites were much more cost effective than expanding the microwave network.
It’s not a given that satellites are more expensive than a terrestrial solution.
In order to get centimeter level sea level measurements, you are going to have to know the altitude of the satellite to a value significantly less than a centimeter. My guess is you will have to know the altitude to within a tenth of a centimeter.
That simply is not possible. Heck, knowing it to within a centimeter isn’t possible.
Mark W — “They” should be averaging roughly 1,000,000 observations a day (20Hz * 86400 sec/day) minus maybe 600,000 observations made over land or floating ice. It’s easy to point out why individual observations are none too good — starting with how they try to deal with wave heights. But it’s not so easy to explain why the sloppy measurements shouldn’t average out over the course of years to yield a valid difference in the sub-millimeter range.
You’re welcome to take a shot at figuring it out. At this point, I think even many of the true believers in climate change would welcome a plausible explanation for the difference in satellite and tide gauge measurements of sea level rise.
Actually it is extremely unlikely that the error “averages out”. This is only true for random errors of multiple measurements with the same expected value.
It does not apply to systematic errors or to measurements with different expected values, e. g. different points of the ocean, or the same point measured under varying conditions (e. g. tides)
tty = “Actually it is extremely unlikely that the error “averages out”. ”
Yes and no. Does it average out to a valid value for current sea level (whatever that is)? As you say, it seems quite unlikely for dozens, maybe hundreds, of reasons.
But if one takes the mildly bogus value for Jason measured sea level for 2015 and subtracts it from the mildly bogus value measured for 2016, does one get a number very close what one would get if one would get from real sea levels (if one knew how to measure them)? It’s surprisingly hard to figure out why not.
That would depend on the drift of the satellite. Do they know where the satellite is with that kind of accuracy over a year? This is the same issue with only showing differences in temperature in modeling and analysis. When you find out that the model runs 5C hot all the time, does this difference still mean anything? Long-term temperature measurements are affected by siting and urban heat island – differences from one year to the next are not meaningful unless they can show what the UHI was to the same accuracy as the difference they are quoting.
Loren — They should know where the satellite is thanks to DORIS and perhaps GPS as well. But that doesn’t mean that drift isn’t a problem. In the cases that come to mind where drift has been an issue, it’s because orbital drift causes observations to take place at different times of the day than they used to. I believe that’s been a problem if you’re looking a temperatures. I shouldn’t think it’d be a problem for sea level observations. Maybe tides are a problem somehow? Not something I know much about.
A million measurements of a million different locations. No guarantee that they will even measure the same location on each orbit.
No, there is no chance that the errors would average out, even if the error distribution was well understood, which it isn’t.
It isn’t necessary for me to figure a way to correct bad data, it’s only necessary for me to point out the problems with the data.
MarkW
You said, “No guarantee that they will even measure the same location on each orbit.” Even if they should occasionally measure the same x and y coordinates, it is highly improbable that the z-coordinate will be even close to being the same. The crest and trough difference of a rough coastal sea is going to be 10s if not 100s of centimeters. That is, for all practical purposes, despite the millions of readings, none of them represent the same point in three-dimensional space.
That’s an interesting analysis Clyde. I’ll have to think about it for months/years. But the question that pops into my mind is — “If the estimates are that bad, how come their estimates are only 50% different from the entirely independent tidal gauge values? Shouldn’t they be off by 500 percent or 50000 percent?”
I looked up the accuracy of DORIS.
From https://www.aviso.altimetry.fr/en/techniques/doris/principle.html
The accuracy when calculated over 30 days is +/- 2.5 cm calculated by RMS. For any given three hour period it is +/- 10 cm.
In order to have a precision that can reliably show 1 mm differences you need measurements of no more than +/-0.5 mm resolution. 2.5 cm = 25 mm , a far cry from 0.5 mm, about 50 times to little resolution.
Basically, they should be quoting numbers like 2 +/- 25 mm.
DonK
You asked, “Shouldn’t they be off by 500 percent or 50000 percent?” I don’t know. How would one determine that when there isn’t a standard to compare against? To paraphrase an astute philosopher, “Random is as random does.” Even 50% is a substantial error. If your next paycheck was 50% of what you usually receive, wouldn’t you be upset and expect an explanation?
A plausible explanation that the true believers wouldn’t welcome, also known as the elephant in the room – scientific fraud.
DonK
Unlike measuring the diameter of a polished, highly spherical ball bearing with a high-quality micrometer, where the variations are random errors resulting from such things as varying torque applied to the spindle, measuring a highly variable sea surface results in a probability distribution about a mean value, which has a large standard deviation. The standard deviation can be estimated from the range, which it going to be at least tens of meters. The Empirical Rule in statistics suggests that the standard deviation is going to be about 1/4 of the range in values. That is, if the range in the surface with tides and waves is about 4 meters, then the standard deviation will be about 1 meter, no matter how many significant figures are applied to the mean. That is, instead of the claimed 1cm, the precision of the surface measurements is more like +/- 1m, meaning 68% of the measurements will be between mean-SD and mean+SD! That doesn’t give me a lot of confidence that we can assert that the annual rise in sea level can be stated to +/- 0.05mm.
https://wattsupwiththat.com/2017/04/23/the-meaning-and-utility-of-averages-as-it-applies-to-climate/
MarkW..
You will also have to know the speed of the measuring pulse along the radar signal’s transit path. That varies some with humidity , air pressure ..possibly cloudiness..
Not sure how they deal with that.
“Not sure how they deal with that.”
They deal with it with considerable difficulty. I’m a bit hazy on this, but for ionospheric delays, I believe they estimate the overall delay from the difference between radar return times at two substantially different frequencies. Going from memory — something in the 400MHz range and something in the 2000 MHz range?
They seem to be convinced that these dual frequency RAs actually work.
Maybe they’re right.
They use another, different, model for the troposphere where ionization hopefully isn’t an issue, but pressure and temperature are. Temperature, they can get from the Microwave Sounder satellites. Pressure? I have no idea where they get that for the large part of the oceans where barometric measurement is scanty. I’m not aware of any way to measure barometric pressure from space other than from sea level variations. And I doubt “they” can safely use their own data to estimate barometric pressure, then use that pressure to correct their sea level estimates.
Does anyone know where barometric pressure values for, for example, the ocean region between Antarctica and Easter Island come from?
Thanks for that clarification Don K.
Something like the refractive index of red and blue light in a prism differs slightly and so the speed of the 2 radar frequencies’ modulated signal differs slightly over the same unpredictable path
from satellite to ocean and back it if I understand you correctly.
So to sum it up. It doesn’t matter how precise the capability of a satellite or instruments are in taking measurements if the people compiling the data and crunching the numbers are not committed to producing accurate results.
So, even if the new Sentinel-6 1cm claims are true
3.4 mm rise per year, with a measurement that is only accurate to within 10mm.
At least it is better than the current model whose measurement is only accurate to within 25.4mm.
Don’t worry about satellite calibration, Rud, I have a fail-safe technique. When I have to wade through seawater to get to my favorite outdoor restaurant, the Avalon, along Ocean Drive in South Miami Beach, I will send you an alert. Until then everything else is background noise. You’re welcome.
121 in LA we are all going to die.
I was living near Pierce College weather station when the 119 record was set in July 2006. The station had real time measurements online. The college had sold pasture land at the base of a hill where the station is situated to a developer. High density housing was built, air-conditioned of course. On this especially hot day with Santa Ana winds, I was watching when the wind changed, pushing the hot air from the air conditioned development up the hill to the weather station. And thus was that record recorded.
I have a great scientific interest in all things SLR related …
Persistent acceleration in global sea-level rise since the 1960s
https://www.nature.com/articles/s41558-019-0531-8
A Spatially Variable Time Series of Sea Level Change Due to Artificial Water Impoundment
https://agupubs.onlinelibrary.wiley.com/doi/pdf/10.1029/2020EF001497
One study, “Here we present an improved hybrid sea-level reconstruction during 1900–2015 that combines previous techniques at time scales where they perform best.”
Hum?? Lots of room for confirmation bias there. The disparate long term tide gauges adjusted for geostatic movement do not show any acceleration, it anything near 3 plus’s mm per year rise.
Isn’t this a measurement where we need to know both the accuracy and resolution of the measurements? The measurements might have errors but if these are repeatable (systemic) then we might be able to detect rate of SLR?
And we’re forgetting some of the predictions of SLR over a century exceed 1 metre – 10 cm in a decade. In which case even this junk should be able to give us some evidence either way.
Satellite orbital paths are not on a set of sky-train tracks. Add to that the hubris of believing that they can measure an utterly uneven surface such as the oceans to 1cm accuracy. This is a waste of money to even send up there. Although, living in the Adjustocene era as we do, I’m sure there will be firm data claims from NASA.
Actually the sats don’t take point measurements but areal measurements thus …
https://en.wikipedia.org/wiki/Regression_toward_the_mean
https://en.wikipedia.org/wiki/Law_of_large_numbers
See also …
https://en.wikipedia.org/wiki/Central_limit_theorem
See also:
https://en.wikipedia.org/wiki/Independent_and_identically_distributed_random_variables
Are sea level measurements really i. i. d.? Is there really no “memory” there, think tides, weather (waves, air pressure), ocean currents…. For the law of great numbers to apply all such non-random errors must be completely and perfectly eliminated.
All the things you mentioned are known and included in the data analysis. In fact, the tidal aliasing has been shown to be extremely useful for verifying global tidal models. An inverse barometric pressure correction is taken into account. These were all known issues when these instruments were originally designed and algorithms were developed for these known biases. Therefore, the residuals after data analysis, are indeed iid.
And how do you derive air pressure in the middle of oceans thousands of miles from the nearest weather station? By modelling of course.
And how do you know the tidal range thousands of miles from the nearest tidal gauge? You guessed it – by modelling.
By a really weird coincidence the sea level rises fastest in the middle of oceans far from land….
So just ignore the weather predictions? Cute.
The oceans are deepest in the middle. Go figure.
ICU
You said, “The oceans are deepest in the middle.” Unless there is a mid-ocean ridge at a spreading center. Or there is a trench adjacent to a subduction zone.
The law of large numbers only applies to independent identically distributed random variables. There are a few loopholes, but it is hard to sea how they would apply here.
ICU –> The references you give for the LLN and CLT are not applicable to uncertainty of measurements. The CTL only applies when errors have a random (Gaussian) distribution. With sufficient measurements of the same thing you can assume the random errors cancel each other and give you a “true value”. LLN is somewhat similar in that it says random events of the SAME THING will converge to an expected value.
You have obviously studied statistics but I expect you have not delved into metrology. As “tty” has tried to point out, neither of these theorems deal with making measurements. Systematic errors will reduce accuracy and a statistical treatment will simply will not reduce that error. Uncertainty is another issue. Statistical treatment will not reduce uncertainty. Uncertainty is what you don’t know and CAN NEVER KNOW. If all the measurement data you have is uncertain to +/- 2.5 cm, you can average all the data you have or you can take all the samples you want but you can not reduce uncertainty. In fact, your uncertainty increases with the number of measurements you use.
The end result is that if your measurements are uncertain to +/- 2.5 cm, then your result will have the same uncertainty regardless of the calculations you perform. Systematic errors will only add to the uncertainty. This is why you need an uncertainty budget.
Well looks like they’re not in agreement with your starting point Mr Istvan:
From ESA : “Records show that, on average, global sea level rose by 3.2 mm a year between 1993 and 2018, but hidden within this average is the fact that the rate of rise has been accelerating over the last few years. Taking measurements of the height of the sea surface is essential to monitoring this worrying trend – and the Sentinel-6 mission is on the way to being ready to do just this.”
Hidden also in a corner they also say this : “On average, sea level has been rising at a rate of 3.2 mm a year
since 1993, but there are regional differences within this trend.”
With 4.3 billion euros spent in the period 2014 to 2020 I hope it’s all worth it.
Those are the intrinsically unreliable, pseudoprecise, lacking closure satellite measurements, NOT the dGPS vertical land motion corrected tide gauge measurements that DO close.
See the two linked references in my opening paragraph 1. Charles also provided visual links to both Prior posts at the bottom of this one.
I do not think “accelerating” means what they think it means. Satellite measurements of sea level rise, which is what “between 1993 and 2018” refers to, not only shows no acceleration, it also shows sea level rise slowing down.
I’ve been checking sea level rise plots from satellite data regularly over the last several years and watched as the long-term average trend has dropped from 3.4 mm/yr a few years ago to 3.0 mm/yr now. That’s the opposite of acceleration.
stinkerp. “That’s the opposite of acceleration.”
Indeed. The underlying problem seems to be that it is VERY difficult to detect SMALL accelerations in noisy data. Even Gavin Schmidt is on board for that http://www.realclimate.org/index.php/archives/2012/11/dont-estimate-acceleration-by-fitting-a-quadratic/
“The reputable climate-statistics blogger Tamino, who is a professional statistician in real life and has published a couple of posts on this topic, puts it bluntly:
“Fitting a quadratic to test for change in the rate of sea-level rise is a fool’s errand.
I’ve been meaning to research this. Maybe some day I’ll get around to it. I won’t be heartbroken if someone with more affection for and ability with math does so first.
Don’t look for math to prove this wrong. Look at stock market people or quality engineering, or just pure experience. I’ve been there. It is fun to apply x^n type equations to fit the data you have. From experience, don’t trust it beyond the interval you have. Forecasting using trends from quadratic (or any other power) is fraught with danger.
For recent plot of satellite data, see:
https://www.star.nesdis.noaa.gov/socd/lsa/SeaLevelRise/LSA_SLR_timeseries.php
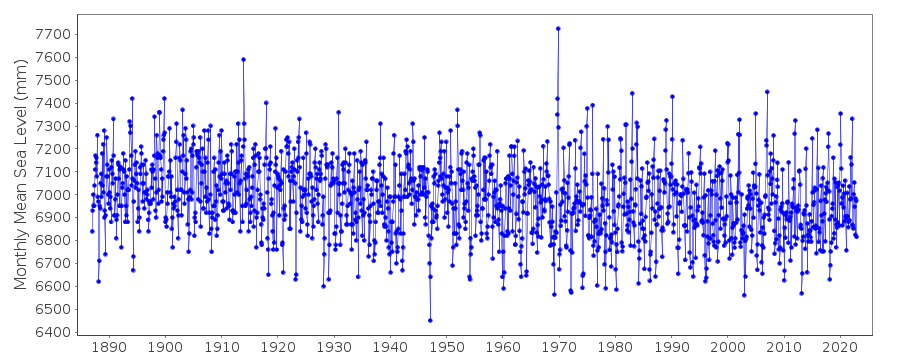
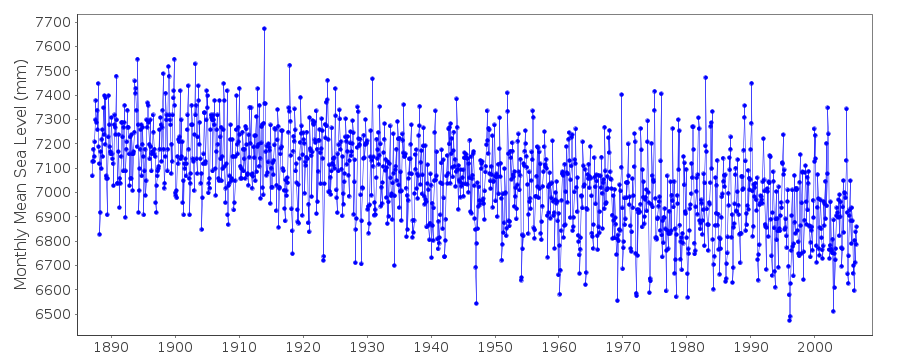
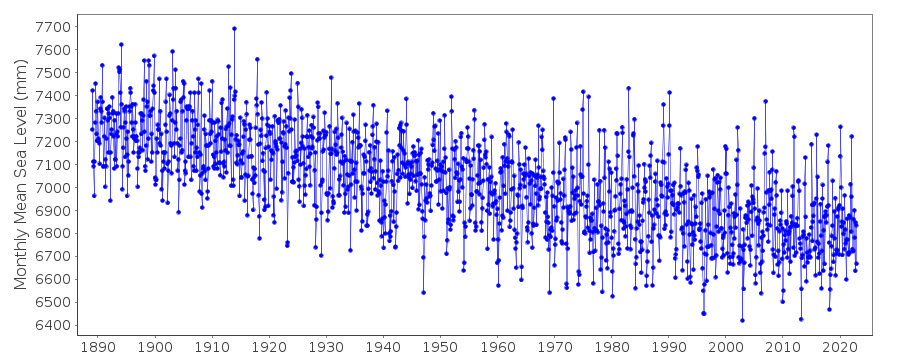
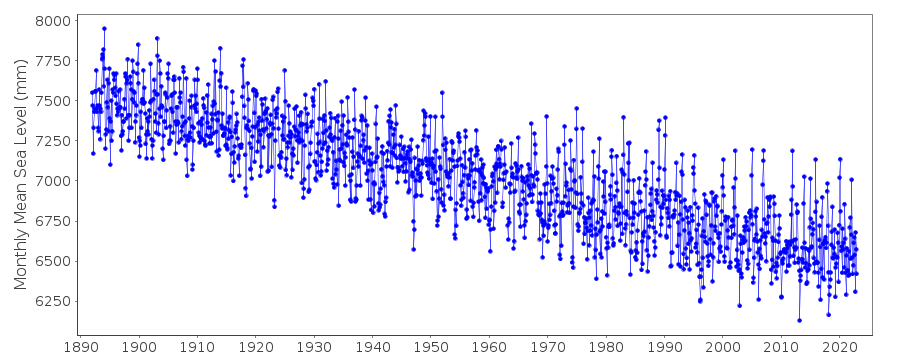
For actual sea level rise see PSMSL.org where elevation change is also provided for many gauges. No need to consider satellite “data” where we have had thousands of yard sticks in the ocean, some for over 150 years.
“but there are regional differences within this trend”
And those differences happen to be many times larger than 3.2 mm/year. And even of different signs.
The image looks like a pitched roof house.
The incredible AGW industry that just keeps on giving. Thank you Mr and Mrs taxpayer.
No problem. I was wondering what I was going to do with all that extra money.
The water levels in the open ocean goes up and down with the tides, high and low pressure systems passing overhead, waves that vary from nothing to 10 meters or more, wind blown surges, heating due to subsea volcanoes and a variety of other things. Couple that with a satellite that also wobbles due to gravitational changes in the Earth below it and constant drag.
Add in the fact it only measures a spot on the Earth once a day and we expect it to give us a robust sea level measurement of the entire oceans to one centimeter (or less)? I think not.
“Add in the fact it only measures a spot on the Earth once a day and we expect it to give us a robust sea level measurement of the entire oceans to one centimeter (or less)? I think not.”
I’m pretty sure they don’t sample the same spot even once per day. They actually get two passes a day through any general area — one on the “descending node”(Satellite moving N to S) and one on the ascending node. But, like many other satellites, they deliberately chose an orbit that tracks some ways away on the following day. The internet might be telling me that the “cycle” period for Jason-1 — and presumably its predecessors is 406 days, but that there is a “subcycle” of 10.9 days such that they pass over very nearly the same spot every 254 satellite revolutions around the Earth.
“DORIS, a ‘Doppler orbitotography and Radio positioning integrated by satellite’ for POD—whatever that actually is and supposedly does.”
Doppler Orbitography and Radiopositioning Integrated by Satellite or, in French, Determination d’Orbite et Radiopositionnement Integre par Satellite is a French satellite system used for the determination of satellite orbits and for positioning. It uses 50-60 ground based beacons transmitting on 401.25/2036.25 MHz and satellite based receivers with a precision of about 10cm. Basically, it’s sort of an “inverted” GPS with the reference transmitters on the ground and the receiver on the satellite
Even though the precision of any single measurement is about 10cm, they get to average a LOT of measurements. And the satellite movement is heavily constrained by Newton’s laws which should help a lot in data fitting by ruling out impossible/improbable solutions. MAYBE they can manage sub 1cm radial average error.
Jason 1 also had something called Blackjack which was intended to try to determine position via GPS. If that worked out, it’s probably integrated with their DORIS system. GPS should probably be more accurate for satellite users than for ground users because satellite users shouldn’t need to worry about tropospheric or (most?) ionospheric phenomena
Tangentially, when you get down to cm range, the whole “satellite position” thing becomes a little nebulous. You’re probably looking at some “position” related to the radar antenna or receiver hardware, not at the center of mass of the platform. And you probably need to worry about the orientation of the satellite/radar antenna relative to the Earth (Vehicle Attitude)
All in all, I’m glad I never had to worry about this sort of stuff
Don K, thanks for the DORIS explanation. I did not bother to track it down for the sake of a simple post about more 1 cm measurement periodic table ‘Impossibilium’. An ‘inverted’ ground based ‘GPS’ for satellite altitude. Got it, sorta.
Never thought before about the vehicle attitude problem induced by drag. Huge. In the ESA image, the flatish roundish thingy sort of horizontal in front is per ESA the altimeter antenna.
And what does the orbit refer to? Since it is in a geocentric orbit presumably to geocentric coordinates i. e. relative to the center of gravity of the Earth .
However not even that is fixed at the centimeter level.
tty – It’s been many decades since I actually knew the answer to that. But I’m 98% certain, that orbits, tracking station locations, etc are typically referenced to an arbitrary point that is believed to be really close to the actual center of the Earth. I can imagine situations where having the coordinate system center misplaced a bit makes a difference, but for measuring changes in sea level over “short” timespans (a few years), I don’t think it matters. I could be wrong about that of course.
FWIW, Jason data products are purportedly corrected for Pole Tides, so I think the folks at JPL, et al are actually aware of fine details of Earth modelling.
Some years ago on a flight to Madeira I saw a huge area of smoothed ocean surface, literally tens of thousands of square miles. It has been suggested that this was the result of phytoplankton oil/surfactant release. Wave breaking was suppressed up to what I judged to be about Force 4.
Question. If wave suppression took place under one of the satellites, what would be the result on the output? Humanity is altering enough of the ocean’s biome to alter the surface — nitrogen runoff, dissolved silica, poisonous effluent would all change the balance between calcareous phytos, diatoms, DMS producers. Would alteration of wave heights change the algorithm?
JF.
“…gauge measurements by a factor of about 1.5x. “ out compared to the best available.
That sounds really good to me for government funded operation!
😉
“Personally, I think the chances of that data driven scientific outcome is near zero, because the Jason-3/Sentinel-6 calibration overlap period enables any necessary Sentinel-6 data processing algorithm ‘adjustments’.”
Gosh, do you really think it’s that corrupt? If so, it’s all very depressing. Just the reverse of the way science and data collection should work. We will never move ahead.
Alistair, I PROVED homogenization that corrupt several different ways in the cited book essay. Simples. For the US, compare the state level surface temp records computed by Drd964x for 2012 with ‘new and improved’ 2014 nClim Div. Both NOAA stuff.
The three examples in the ebook essay cited were deliberately chosen to all be water moderated: California, Michigan, Maine. Archived, side by side ‘official’ NOAA charts.
Net, for CONUS, all but 8 states (so 40) got ‘new’ warming. For ‘old’ Drd964x algorithm, the decadal warming was 0.088F. For new and improved nClimDiv algorithm, it was 0.135F. QED
Rud Istvan
September 7, 2020 at 2:43 pm
Thanks Rud. I sort of knew that the temperatures were fiddled, quite apart from any UHI issues. But I hadn’t realised that they had pulled another similar ‘trick’ on the satellite sea level data. They have no shame.
You can see the “adjustments” starting around 2002….
Topex is “adjusted” upwards to match Jason, creating a trend more than twice what Topex was showing.
It isn’t just homogenization that alters the surface temperature data. There are breakpoint or changepoint adjustments as well. Moreover, it is the accumulation of these adjustments over time that is critical, not just a single year’s data.
If you want to see how big these adjustments can be then you need to read my latest blog posts. Over the last 100 years the adjustments have been quite staggering.
South America: +0.33 °C.
East Pacific: +0.81 °C.
West Pacific: +0.65 °C
Indonesia: +0.96 °C.
Australia: +0.3 °C
In the above article, Rud Istvan states as the first of his final thoughts: “First, the best long record calibrated (to vertical land motion) tide gauge estimates of SLR are about 2.2mm/year, with NO acceleration, AND closure. So, even if the new Sentinel-6 1cm claims are true, they are still not fit for purpose by a factor of about 4x SLR mm/year.
Well, my understanding it that neither precise triangulation-based surveying nor WAAS GPS can provide orthometric vertical elevation of land to 1 cm vertical accuracy over km-scale distances. In fact, there is a major effort presently underway, the NOAA-National Geodetic Survey’s “Gravity for the Redefinition of the American Vertical Datum” (GRAV-D) project to provide much-improved topographic elevation measurements for most of the US . . . but to only 2 cm accuracy, which itself is about a factor of ten better than existing topographic elevation accuracy (Ref: https://www.ngs.noaa.gov/GRAV-D/ ) This website provides a link to a free pdf download of the GRAV-D project plan, wherein beginning on page 1 there is a good description of the difference between reference ellipsoid vertical height (which GPS determines) and reference geoid orthometric vertical height (“colloquially—although not quite appropriately—referred to by the more common term ‘height above sea level’ “)
So given that past orthometric land elevations had measurement accuracy far less than 2 cm, I have to question Rud’s statements about (a) tide gauge estimates being calibrated to vertical land motion, especially to the extent of providing 0.1 mm/year precision, and (b) why assertions of 1 cm altitude accuracy over oceans for Sentinel-6 are criticized but claims of 2 cm orthometric vertical height of land at the end the GRAV-D project are not treated as being even more problematic (vis-a-vis closure with “calibrated” tide gauges).
Also, on the subject of comparing satellite measurements of SLR to tide gauge measurements, one must consider that the locations of tide gauges represents a very small and special subset of the extent of Earth’s oceans. Tide gauges are mostly located in shallow waters along coastlines. At these locations—depending on many non-instrumental factors such as wind fetch, ocean circulation patterns, local seabed topography, thermal gradients, tidal gradients in surrounding bays or channels or estuaries or rivers—the local “sea level” can vary greatly from the gravity-based vertical datum of “sea level” (the reference geoid). To the best of my knowledge, there has been no attempt to correct tide gauges for such conditions that may persist over months, years or decades.
Bottom line IMHO: considering the best of current science and applied technology, it is a joke to report any SLR numerical value to 0.1 mm/year resolution . . . moreover, reporting SLR to even 1 mm/year resolution needs 20 or more years of data from the exact same instrumentation at the exact same location with precise, periodic corrections for local land/seafloor subsidence and/or uplift. Very challenging to accomplish successfully.
How important is the sea level change to mid-ocean dwellers?
Hmmmm . . . I did not find any reference in the above article to “mid-ocean dwellers”.
Nevertheless, global SLR (and that INCLUDES “mid-ocean” areas to a very great degree) is important to understanding how melting of land-supported ice and overall ocean temperature increases (causing sea water thermal expansion) correlate, or not, to climate change™.
“moreover, reporting SLR to even 1 mm/year resolution needs 20 or more years of data from the exact same instrumentation at the exact same location with precise, periodic corrections for local land/seafloor subsidence and/or uplift. Very challenging to accomplish successfully.”
There are many such sites. At least a dozen in Sweden alone. Most have been in use since 1886 and they show very different “raw” values, all have sinking relative sea-levels because of post-glacial rebound. DGPS was installed in about 2004 and the absolute sea-level rise comes to a bit over 2 mm/year (which may be slightly below the world average, since meltwater from Greenland has minimal effect in
Northern Europe)
For example:
https://www.sonel.org/spip.php?page=gps&idStation=2074
tty,
“satellite-based wide-area DGPS (used by GreenStar); accuracy is sub-meter in latitude and longitude, and 2.5 m in altitude”—source: https://msu.edu/~brook/publications/prec_ag/oct1998.htm#:~:text=These%20beacons%20provide%20an%20accuracy,user%20is%20within%20150%20km.&text=satellite%2Dbased%20wide%2Darea%20DGPS,providers%20include%20Omnistar%20and%20SatLoc.
“Survey test using DGPS at eight national triangulation stations showed an error of 0.5 m or less in the horizontal direction and 1.6 m or less in the altitude from the official position of the stations. The standard deviation of the measured position was estimated as decreasing below more than half by collecting data for 3 minutes or more and taking the average of DGPS data.”—source: https://agris.fao.org/agris-search/search.do?recordID=JP1998006032
“All Differential-grade GPS receivers have a horizontal positional accuracy of less than 1 meter. Most new GPS receivers with differential corrections from SBAS such as WAAS and low level OMNISTAR subscriptions or from GBAS such as beacons typically have accuracies from 0.3 to 1.0 meter, depending on the quality of the receiver. Higher-level OMNISTAR service or Trimble’s H-Star service improves the accuracy to 5 – 30 cm. Currently, the highest quality differential GPS receivers available are dual frequency units that utilize both GPS and GLONASS satellites. These coupled with a very accurate differential correction subscription will give the best differentially corrected position possible. Vertical accuracies for these GPS units are 2 – 3 times that of the horizontal accuracy, and should be used only for informational purposes.”—source: https://water.usgs.gov/osw/gps/#:~:text=All%20Differential%2Dgrade%20GPS%20receivers,of%20less%20than%201%20meter.&text=Vertical%20accuracies%20for%20these%20GPS,used%20only%20for%20informational%20purposes.
If you want to use the absolutely best, survey-grade DGPS equipment (more specifically, survey-grade GNNS-based receivers) and use the “Static” positioning mode for highest positional accuracy, you may be able to achieve—with extensive setup requirements—horizontal accuracy to 5mm and vertical accuracy 10 mm. But there is this important caveat: “In addition it must be noted that all GNSS derived elevations, though proven through time to be fairly accurate, are only modeled results. Orthometric heights (or elevation) are simply calculated as the ellipsoid height minus the geoid height (both modeled values based on location). That is why it is important to included high order leveled vertical reference marks (typically NGS benchmarks) when relating your survey to a given datum or your survey area is very large.” — source: (same as that immediately above)
Bottom line: The best vertical position accuracy one can get from DGPS or its GNNS equivalent is 1 cm. And while you claim that “DGPS was installed in 2004”, I seriously doubt that that applies to the “many such sites” (of tide gauges) to which you refer . . . and certainly not in the sense of using survey-grade GNNS-based technology to achieve 1 cm accuracy in periodic measurements of land uplift/subsidence at these locations over the last 16 years.
If I am wrong about this, please provide a reference that supports your assertions.
You are making a common error – confusing accuracy and precision. It is indeed hard to get 1 cm accuracy in absolute vertical position, but it is fairly easy to measure much smaller changes in position, both vertical and horizontal.
And all the main swedish gauges got DGPS installed as part of the SWEPOS program in 2004.
I’m less familiar with the rest of the World, but I know that the extensive Australian network in the Pacific started even earlier, around 2001.
Incidentally any major errors in the (vertical) SWEPOS data would be easily detected, since the relative sinking sea-levels have been actively studied in Sweden for more that 250 years, so there is a very long baseline to check against. Next year it will be exactly 400 years since the isostatic rebound was first noted in academic circles (people living along the coast have always been aware of it).
tty posted: “You are making a common error – confusing accuracy and precision.”
No, I am not. If you had bothered to read the “USGS Global Positioning Application and Practice” document at the last URL I provided in my post immediately above, you would have seen the following statements under the section on Survey Grade GNSS Equipment:
“It is the surveyor’s responsibility to know the accuracy requirements of the survey and match this with the accuracy of his or her receiver in combination with the accuracy of the correction information being received based on correction quality and location (how close the survey is to the area were the corrections are being calculated so the assumption of similar ionosphere corrections is not violated). Most survey grade equipment has horizontal and vertical accuracy based on distance (see table below) . . . When accuracy is described in relation to a datum the quality or error in the benchmark being surveyed from and the models being used must be considered. Typical error in Geoid03 model is 4.8 cm . . . and 3 cm in the GRS80 ellipsoid.”
The word “precision” is nowhere to be found on this subject webpage.
If you have a problem with this nomenclature, I suggest that you inform the seven persons serving on the USGS GNSS Committee: their email addresses are provided near the top of the referenced webpage.
As for the rest of your reply, I gave the quote and source reference above that for survey-grade DGPS (not GNSS-based): “Vertical accuracies for these GPS units are 2 – 3 times that of the horizontal accuracy, and should be used only for informational purposes.”
But, hey, let’s just simply things: please provide an accessible link to a scientific paper or article that states the claimed accuracy in measuring vertical elevation changes at or near “all the main swedish gauges [that] got DGPS installed as part of the SWEPOS program in 2004”.
https://www.gps.gov/systems/gps/performance/accuracy/#how-accurate
Re: your provided link,
Not one mention of the word “vertical”.
Not one mention of the word “elevation”.
Not one mention of Sweden or Swedish or SWEPOS.
Not one mention of “tide gauge”.
FAIL.
“High-end users boost GPS accuracy with dual-frequency receivers and/or augmentation systems. These can enable real-time positioning within a few centimeters, and long-term measurements at the millimeter level.”
Reading ability fail.
And here is Lantmäteriverkets description of the Swedish geodetic network SWEREF/SWEPOS, including isostatic rebound measurements. It includes all your missing buzzwords, unfortunately in Swedish (except “tide gauge”, as we don´t have tides in the Baltic).
The sigma for vertical movement is estimated to be 0.6 mm/yr (p. 56). Since, as I have aleady mentioned, we have a very long measurement period the inherent uncertainty is only 0.2 mm/yr, the rest is due to instability in the coordinate system.
https://www.lantmateriet.se/contentassets/96e6a20268f94f36959bd12e0700a581/hmk-geinfra_2020.pdf
Gordon A. Dressler
Thanks for this very informative comment.
Despite your undoubtedly accurate consideration concerning the senselessness of today’s resolution claims, I’m simply amazed by the similarity of results coming from
– the PMSL evaluation by Dangendorf & alii
and from
– NOAA’s satellite altimetry.
https://www.nature.com/articles/s41558-019-0531-8
J.-P. D.
Thank you, Bindidon.
The very basic problem with the Nature article that you linked is that there is no consistent evidence that global SLR has accelerated over the last 5, 10 or even 20 years.
For example, NOAA documents that global SLR has been in a linear trend of 3.0 +/- 0.4 mm/year since 1993, based on satellite altimetry data from the TOPEX, Jason-1, Jason-2 and Jason-3 satellites.
Ref: https://www.star.nesdis.noaa.gov/socd/lsa/SeaLevelRise/LSA_SLR_timeseries.php
The graph presented at the NOAA website clearly shows there are substantial, temporary variations (both up and down) in the measured rates-of-change of global SLR about the average slope of +3.0 mm/year, even with seasonal variations removed.
One might assert “global SLR has accelerated to 4mm each year” by cherry picking the interval of mid-2018 to mid-2019. However, the most recent data plotted, from mid-2019 to mid-2020, show the slope has once again returned pretty close to the long-term, +3.0 mm/year average rate.
Therefore, caveat emptor.
Gordon A. Dressler
Thanks for the convenient reply.
As written somewhere else in this thread, I have no interest in this discussion about acceleration.
I only wanted to compare Dangendorf’s PMSL gauge evaluation results with those provided by altimetry.
*
Nevertheless, a bit of discussion is needed, as you wrote above:
” The very basic problem with the Nature article that you linked is that there is no consistent evidence that global SLR has accelerated over the last 5, 10 or even 20 years.
For example, NOAA documents that global SLR has been in a linear trend of 3.0 +/- 0.4 mm/year since 1993, based on satellite altimetry data from the TOPEX, Jason-1, Jason-2 and Jason-3 satellites. ”
This is correct!
But… when writing that, NOAA informs you only about the linear estimate, as do all others, from UAH to GISTEMP.
No one uses to write about any acceleration – with rare exceptions, like e.g. the SLR context discussed here, and only in some published articles.
But nobody informing you about linear trends tells you that the data’s behavior itself is linear. You know that only by
– computing nonlinear, polynomial trends (quadratic, cubic), and
– comparing the nonlinear trends with the linear one.
A first example: commenter tty’s so much loved gauge at Kungsholmfort, Sweden, for the period 1993-2015 (Dangendorf’s end):
https://drive.google.com/file/d/1ksIrJhi3YSk3BnQ6aWkwaKimJp5zyLTx/view
Here you see that no acceleration is visible (the quadratic fit rather shows a tiny deceleration).
Now let us compare this with satellite altimetry for the same period (and of course the same anomaly reference period):
https://drive.google.com/file/d/10MqROBgcvCvBw7nEQjzq4ysxDQagdzox/view
The quadratic fit differs here quite a lot more form the linear one (note that the spreadsheet calc computes the fits on the base of units (here: months). To obtain data per year, one has to multiply everything by 12 .
All things remaining equal (what they of course never do), we obtain for the quadratic fit at Kungsholmfort a decrease of 8 cm after 100 years wrt the linear trend, and, for the satellite altimetry, an increase of 24 cm.
You obtain similar values when computing, out of the time series, a running trend series, and computing its trend, thus obtaining something like the slope of the slope.
But this is all theoretical stuff; let a series of huge VEI 7+ volcano eruptions like Mt Samalas in 1257 suddenly happen in say 10 years, and today’s computations no longer will be worth the paper on which they were written.
J.-P. D.
The beach at my place got a foot of sand washed onto it in a single storm. I might pedantically and practically argue that the local sea level dropped by a foot. So discussing whether SLR is 2 or 3 mm per year is splitting hairs of angels dancing on a pin.
Could you please provide a reference? I’ve been using these and would love to have additional references:
http://sealevel.colorado.edu/content/tide-gauge-sea-level
https://link.springer.com/article/10.1007/s10712-011-9119-1
I already did as the second hyperlink in my opening paragraph, and Charles repeated it visually at the bottom of this post (middle of the three related linked posts).
Both point to my longish 2016 WUWT post on Seal Level Rise, Acceleration, and Closure where all was explained, with both hyperlink AND footnote references.
Read and study here more carefully, please. Some of us have been at this for quite a while.
The “second hyperlink” (BEST) doesn’t work. You left off “.com” on https://wattsupwiththat/…
Ummm…thanks for the advice? I’ve been at this too for quite a while and I’m simply looking for more information, which unfortunately wasn’t in this post, but modifying the incorrect link did get me to your previous post which is very helpful. I have been pointing out for years that the satellite and tide gauge data are not in agreement. Not sure why the curt tone.
I just sent this to Charles “The Moderator’ and after another glass of “Adult Beverages” I decided to plug it into a comment here :
I just read most of the thread about SLR and found it amusing that NASA touts 1 cm accuracy, hmmm… 10mm +/- and they want to resolve things to 2.?mm? Where did those jerks go to school?
Oh, I forgot “New Math”…
It’s not just the World Ocean that needs to be looked at; read this entertaining discussion on my favorite boating site. I took the pic in the last comment.
http://continuouswave.com/forum/viewtopic.php?f=4&t=4531
The Great Lakes are very much affected by isostatic rebound which makes basin wide analyses a crap shoot since the rebound can be very local.
Why can’t we know for sure, you ask, eh?
God Said……..
😉
Rud Istvan
” Satalt simply does not correspond with the BEST SLR tide gauge measurements by a factor of about 1.5x. ”
Could you show the data sustaining such a claim?
*
Let us compare available data:
– the most complex and most accurate PMSL tide gauge evaluation by Sönke Dangendorf & alii
– the NOAA statellite altimetry (TOPEX/Poseidon, Jason-1, Jason-2, Jason-3)
Here are the charts made out of the downloaded data (the sources will come out in a subsequent comment). All plots wrt the respective means in the common reference period 1993-2013.
1. Dangendorf 1900-2015 together with NOAA 1993-2020
https://drive.google.com/file/d/1J9cieS73FKJ_Wa8pLo6zVKPkz0VN-5cr/view
2. Dangendorf 1993-2015 together with NOAA 1993-2020
https://drive.google.com/file/d/1XPtw2L5OFkwDsju9GelE9WIKU0YdorgP/view
Trends in mm/year, 2 sigma
– Dangendorf 1900-2015 : 1.4 ± 0.01
– Dangendorf 1993-2013 : 2.7 ± 0.02
– NOAA sat: 1993-2013 2.6 ± 0.03
– NOAA sat: 1993-2020: 2.9 ± 0.03
The Dangendorf paper (behind paywall for me)
Persistent acceleration in global sea-level rise since the 1960s
Sönke Dangendorf, Carling Hay, Francisco M. Calafat, Marta Marcos, Christopher G. Piecuch, Kevin Berk & Jürgen Jensen
Nature Climate Change volume 9, pages705–710 (2019)
Abstract
Previous studies reconstructed twentieth-century global mean sea level (GMSL) from sparse tide-gauge records to understand whether the recent high rates obtained from satellite altimetry are part of a longer-term acceleration.
However, these analyses used techniques that can only accurately capture either the trend or the variability in GMSL, but not both. Here we present an improved hybrid sea-level reconstruction during 1900–2015 that combines previous techniques at time scales where they perform best.
We find a persistent acceleration in GMSL since the 1960s and demonstrate that this is largely (~76%) associated with sea-level changes in the Indo-Pacific and South Atlantic.
We show that the initiation of the acceleration in the 1960s is tightly linked to an intensification and a basin-scale equatorward shift of Southern Hemispheric westerlies, leading to increased ocean heat uptake, and hence greater rates of GMSL rise, through changes in the circulation of the Southern Ocean.
{ Though clearly shown in the spreadsheet’s quadratic fits, I’m not interested in any discussion about SLR acceleration. }
J.-P. D.
“– Dangendorf 1900-2015 : 1.4 ± 0.01
– Dangendorf 1993-2013 : 2.7 ± 0.02”
Such a big acceleration is absolutely impossible, at least on a world-wide basis. It would show up violently for example in the very long high-quality tide gauge data from Sweden (where there are no tides incidentally).
Raw and GPS-corrected data for one such site (Kungholmsfort):
https://www.sonel.org/?page=gps&idStation=2075
tty
1. All the time you show us again and again and again your Kungholmsfort.
Why can’t you accept that this tide gauge considerably differs in its behavior from so many of the over 1500 gauges registered in the PMSL database?
Oh, here is a comparison of that gauge data with and without considering VLM, made at least one year ago:
https://drive.google.com/file/d/1cZB1vNyIZD23EsWzDBetTUO2-moYx8xU/view
2. Don’t you think it’s a bit brazen to simply pretend in a blog (btw, behind a convenient pseudonym) that Dangendorf’s results
https://www.nature.com/articles/s41558-019-0531-8
are ‘absolutely impossible’, without proving this claim in a peer-reviewed paper of comparable quality?
Do the job, tty, and come back to us with the result.
My little finger tells me that when you will have invested as much work as they did, your result won’t differ that much from theirs.
J.-P. D.
I used Kungsholmsfort as an example. It is unusual since it happens to be situated at a site where isostatic rebound (which changes very slowly) happens to be equal to the sea-level rise, and it has remained equal ever since 1886
Here are some more, all very long, high-quality records, all situated on precambrian bedrock of the Baltic Shield, which is one of the most tectonically stable areas on Earth:
Ölands Norra udde (1886-) (N. B. this one is on Cambrian, not Precambrian rock)
Landsort (1887-2006)
Stockholm (1886-)
Ratan (1886-)
With Kungsholmsfort these sites span about 600 miles along the Baltic coast. Do you see any marked “knees” in the data around 1990?
They also all (except Landsort) have GPS support (data since 2004). Kungsholmsfort is rising at 1.6 +-0.8 mm/yr, and is showing NO relative sea level change. Ölands Norra Udde, rising at 2.2+-0.6 mm/yr, is gaining very slightly on the sea level. Stockholm (4.7+-0.9) and Ratan (10.5+-0.6) are of course both showing a markedly sinking relative sea level.
GPS data:
Kungsholmsfort:
https://www.sonel.org/?page=gps&idStation=2075
Ölands Norra Udde
https://www.sonel.org/?page=gps&idStation=2074
Stockholm
https://www.sonel.org/?page=gps&idStation=4258
Ratan
https://www.sonel.org/?page=gps&idStation=2073
I already did, twice. See previous reply. Try second hyperlink in first paragraph, or middle of three visually linked posts by Charles at end of this.
Your links have a big problem. They all either assume a large number of TG will wash out, or that unreliable GIA models will wash them out. Both assumptions ade false. So your references are fatally flawed.
Amazing how some so-called scientist can magically find an acceleration in sea level rise when none of the tide gauges show any acceleration.
ScarletMacaw
“… when none of the tide gauges show any acceleration. ”
Where do you get that from?
J.-P. D.
I looked at tide gauges on NOAA.gov.
But go ahead and prove me wrong. Find me some that show obvious acceleration.
ScarletMacaw
” I looked at tide gauges on NOAA.gov. ”
Jesus! Why don’t you show the exact place of what you looked at?
There are dozens and dozens of places within that information tree, starting e.g. with
https://tidesandcurrents.noaa.gov/sltrends/sltrends.html
Where is your page showing acceleration for single gauges?
Of course: I don’t mean the US!
J.-P. D.
Seriously? I ask you to show an example of a tide gauge showing acceleration in SLR and you come back asking me to show exactly where I looked? Where I looked doesn’t matter at all if you can show acceleration. But apparently you can’t.
If you need an example of where I look, here are two from the southern hemisphere, the area Dangendorf claims to be accelerating enough to make a global statement:
https://tidesandcurrents.noaa.gov/sltrends/sltrends_station.shtml?id=430-088
https://tidesandcurrents.noaa.gov/sltrends/sltrends_station.shtml?id=430-021
No acceleration.
ScarletMacaw
Sorry, but I see immediately that your examples lack any information about acceleration. They only tell about linear trends.
Acceleration is so tiny that you can’t see it by simple eye-balling.
But you are right: I myself can’t easily show you tide gauge examples showing acceleration (or deceleration, idem).
Why? Simply because
– my layman PMSL processing generates times series and computes linear trends, but not quadratic fits;
– I therefore can only show such quadratic fits by loading each time series into Linux’s Excel and letting the guy compute the values for the y = ax²+by+c formulas, like in
https://drive.google.com/file/d/1ksIrJhi3YSk3BnQ6aWkwaKimJp5zyLTx/view
or in
https://drive.google.com/file/d/1a2oc8otjHilHQ9jIMaU846RISE0O5z4s/view
I would spend half a month for that stoopid job.
*
Here is a sorted list of linear trends for all PMSL gauges having shown sufficient data within the reference period 1993-2013:
https://drive.google.com/file/d/1kLZZQH-zQjkWMvwT72JxAM34cLPOUjMr/view
*
Caution: all trends per decade, not per year.
The trends for Nolloth and Elizabeth differ from what is published by NOAA, because I wanted to obtain trends wrt the same time period, and not wrt the gauges’ lifetime, what creates a big comparison bias.
*
Maybe one day I add a quadratic fit column in mm / yr² to this trend list.
In between, I could select a good dozen of PMSL gauges by random, and look at the quadratic info produced by the spreadsheet calc, duh 🙂
The alternative would be to ask Sönke Dangendorf if they don’t have that damned data at hand.
J.-P. D.
To your first parapraph, Already have, more than thrice, this post. Second hyperlink in first paragraph, Charles middle of three related posts. And then again in comments more than once.
Learn to read here. You do not like my 2016 hyperlinked PLUS footnoted post, read it again then get back with a specific fact objection.
Rud Istvan (ctnd)
I preferred to post the data sources in this separate comment (problems with comments containing many links)
1. Data for Dangendorf 1900-2015
https://static-content.springer.com/esm/art%3A10.1038%2Fs41558-019-0531-8/MediaObjects/41558_2019_531_MOESM2_ESM.txt
2. Data for NOAA’s sat altimetry:
http://www.star.nesdis.noaa.gov/sod/lsa/SeaLevelRise/slr/slr_sla_gbl_free_txj1j2_90.csv
J.-P. D.
Please just say what your maybe problems with this post might be, rather than posting un explicated links. I might deal with the former if sensible; never the latter.