Clyde Spencer
2021
Introduction
I started this exploration into the changes in atmospheric CO2 because I was surprised that a widely reported significant reduction in anthropogenic emissions in 2020, resulting from the COVID-19 pandemic curtailing industrial activity, commuting, and air travel, did not result in a discernable decline in the rate of growth of atmospheric CO2. I was not satisfied with the official explanations for the impact not being observed. I decided to examine the data and see if I could tease out the effects, or understand better why not, with more-detailed graphs.
While several sources estimate that the decline in anthropogenic CO2 emissions averaged about 7% to 10% for all of 2020, Carbon Brief has an interactive map that shows the global reduction reached over 18% in mid-April 2020; it was down to about 10% in March and May. Coincidentally, those months are near the usual, annual peak of CO2 Winter ramp-up, when Northern Hemisphere photosynthesis is at a minimum. One would naively expect that, if anthropogenic CO2 were important in the growth of the atmospheric concentration, double-digit percentage drops in the three last months of the annual 8-month ramp-up would at least be suggested in the height of the peak (range) or the slope of the curve. Indeed, it is common to observe ‘benches’ on the growth curves (see Figures 1 and 2, below), related to decreased CO2 flux, perhaps resulting from abnormally low Winter temperatures. However, the ‘bench’ present in 2020 is almost indistinguishable from 2019, and the Winter ramp-up range ties for 3rd place (Presented with one significant figure to the right of the decimal point.) with three other years over the 31-year period analyzed. The rate decline in 2020 was in March, not April, and the April value was a little higher (0.3 PPMv) than in 2019. It is reasonable that there may be a slight lag in observed effects; however, it is X-Files spooky to suggest that a hiatus precedes the decrease in the forcing agent. Therefore, it is impossible that the decline in anthropogenic CO2 flux is responsible for the March decline, which happens frequently.
According to a NOAA Research News Article, “The global rate of increase [2020 CO2] was the fifth-highest in NOAA’s 63-year record, following 1987, 1998, 2015 and 2016.” The same article shows a time-series graph for methane, which shows a seasonal variation also, albeit of different shape. The article makes the following statement with regard to methane:
“Methane in the atmosphere is generated by many different sources, such as fossil fuel development and use, decay of organic matter in wetlands, and as a byproduct of livestock farming. Determining which specific sources are responsible for variations in methane annual increase is difficult. Preliminary analysis of carbon isotopic composition of methane in the NOAA air samples done by the Institute of Arctic and Alpine Research at the University of Colorado, indicates that it is likely that a primary driver of the increased methane burden comes from biological sources of methane such as wetlands or livestock rather than thermogenic sources like oil and gas production and use.”
Considering the obvious seasonality of methane and CO2, I’m inclined to believe that it is temperature, hence weather and climate, that is driving the changes.
Background
I used NOAA data from the Mauna Loa CO2 observatory for analysis. Mauna Loa data are generally considered to be the best representative sample of what is happening in the Northern Hemisphere (NH).

Fig. 1. Recent, typical data from Mauna Loa Observatory (https://gml.noaa.gov/ccgg/trends/) The red lines and symbols represent the monthly mean values, centered on the middle of each month. The black lines and symbols represent the same, after correction for the average seasonal cycle.
Note the saw tooth-like form (red line) resulting from seasonal variations. If a positive trend-line is added to a sine wave (a function of the form y = m x + a sin x), the slope of the increasing side of the sine wave will increase while the absolute value of the slope of the decreasing side of the sine wave will decrease as m increases. That is the opposite of what is observed with the CO2 concentrations! The absolute value of the drawdown slope is greater than the ramp-up slope! By removing the ‘seasonality’ in the black line in Figure 1, it makes it look like there is a trend, presumably driven by continuous fossil fuel emissions, that is modulated by natural variations. I’m making the case that the apparent trend is the result of natural seasonal variations and that the accepted model is not physical.
What I missed, initially, is that the saw tooth pattern is not symmetrical. The ramp-up phase lasts longer than the drawdown phase, although the slope is about two-thirds. In addition, the drawdown phase does not return the CO2 concentration to the original starting level!
A fundamental question to be answered is whether the long-term changes in CO2 concentration are 1) caused by increasing anthropogenic CO2, and by implication, responsible for warming; or 2) if the warming is responsible for rising CO2 levels; or 3) the apparent correlation is spurious and it is just coincidence that both variables are increasing over time.
I created yearly graphs for the years 1990 through 2021, for analysis, by normalizing the beginning of each yearly ramp-up phase by subtracting the October CO2 value from all the CO2 concentrations for the contiguous 12-month period (Oct.–Sept.). Thus, the ramp-up phase starts at zero in all graphs, and all subsequent concentrations are relative to a zero baseline. See Figure 2, below. Some might be concerned that I defined the ramp-up phase as beginning with the lowest, and ending with the highest seasonal values. I did this to emphasize the part of the year when the natural sinks were minimal and there was the greatest hope for detecting a decline in anthropogenic CO2.

Fig. 2. L) Ramp-up and R) drawdown phases for the period of October 2019 through September 2020.
The first half of the yearly cycle is a change from a net absorption of CO2 as plants become senescent and shut down photosynthesis. The annual minimum usually occurs in October; however, rarely, the September average is slightly lower. After the Fall minimum, the CO2 concentration climbs throughout the Winter and early-Spring. The peak is almost always in May; however, it is sometimes as early as April. There are some variations in the pattern in that there is usually a short hiatus for a month or two during the Winter, varying from December to March, as shown in Figure 2, above. It appears that slightly warmer than usual weather may also result in a temporary convex-upward bulge, as shown in Figure 2 above, and conversely, slightly cooler weather results in a concave-upward depression, or bench.
The ramp-up phase is followed by an abrupt decline in the CO2 levels with Spring phytoplankton blooms and leafing-out of deciduous trees and other plants. While biogenic decomposition of dead organic material, producing CO2, is always occurring, the photosynthetic activity on land and in the oceans results in a net decline during the Northern Hemisphere growing season. In addition, theoretically, the reduction in polar pack ice should withdraw additional CO2;however, it isn’t evident.
The 31-year aggregate ramp-up range varies from a low of 6.2 PPMv (in 1999–2000) to a high of 9.4 (in 2015–2016, El Niño); the average is 7.7, with a standard deviation of 0.7 PPMv. The plot of the yearly trend-slopes [not shown] of the ramp-up strongly resembles the range-trend slope (Figure 5) for the 31-year interval. The minimum slope is 0.92 PPMv per month (1999–2000), to a maximum slope of 1.3 PPMv per month (in 2015–2016, El Niño), with an average of 1.1 PPMv per month and standard deviation of 0.1 PPMv.
The shapes of the drawdown curves are much simpler and consistent than the ramp-up phase curves. In addition, the average coefficient of determination (R2) for a linear fit is slightly higher than for the ramp-up curves.
The 30-year [2021 is not available] annual range and slope values for the drawdown phase have R2 values low enough (<0.04) to raise a question as to whether the long-term trend in range and slope (<0.009 PPMv/yr) is statistically significant. The calculated p-values for range and slope are both >0.3; using a p-value cut-off of 0.05, we cannot reject the null-hypothesis that there is no formal predictive value in the independent variable, time. Therefore, the trend is not statistically significant, and we cannot say that the annual drawdown is increasing or decreasing. This suggests that the rate of drawdown is insensitive to the temperature changes. However, we can still say that based on past history, it is probable that the annual drawdown values will continue to oscillate around the current average values (Range: -5.2 PPMv ±0.8; Slope: -1.8 PPMv per month ±0.3) with a 2σ uncertainty.
The wrinkles in the faces of older men are sometimes said to add character. One might similarly say that the CO2 ramp-up curves express more character than the drawdown curves. I think that the transient deviations from a linear growth tells us that something other than the usually constant anthropogenic emissions are having an obvious impact on the yearly growth. Figure 3, below, compares the last 6 years of the ramp-up phase. The El Niño event stands out; however, the other years – except 2017–2018 – are very similar.

Fig. 3. Stacked CO2 ramp-up phase curves.
One might argue that the main driver of the upward trend of CO2 is either increased anthropogenic emissions, which is the default claim, or one could argue that the active sinks simply aren’t keeping up with changes in the temperature-driven emissions. The uncompensated residual at the end of the Summer drawdown is on average about 2.5 PPMv, for the 30-year period. Thus, the next season starts at a base-line that is elevated above the previous season base-line. The drawdown phase is not compensating for the increasing ramp-up. Figure 4, following, illustrates this.

Fig. 4. Annual uncompensated, or residual CO2 at the end of Summer drawdown.
A clue that temperature is driving the annual variations, is that the infamous El Niño events of 1997–1998 and 2015–2016, present as prominent peaks in the graph of the seasonal ramp-up range-trend, as shown below in Figure 5. Note that the 1997–1998 event is also unprecedented in Figure 4, and followed by a similarly unprecedented decline!

Fig. 5. Trend of annual ramp-up phase ranges with peaks at years 7 and 25,
corresponding to the El Niño years of 1997—1998 and 2015–2016, respectively.
If CO2 concentrations were driving temperatures, then one would expect the temperature growth to remain high after a spike in the annual CO2 ramp-up phase. Instead, one observes a sharp decline in temperatures in the years immediately after an El Niño, along with a decline in CO2 concentrations! Clearly, temperature is driving the ramp-up phase variations.
The system seeks an equilibrium between all the sources and sinks, as determined by the solubility of CO2 in water, which is determined by the temperature and atmospheric partial pressure. Bacteria and fungi will increase their activity with increasing temperatures, at temperatures above freezing, also.
Different international agencies have proclaimed 2020 to be either tied with 2016 as the warmest year on record, or the second warmest year. Interestingly, the ‘bench’ is muted in 2020, when the pandemic closures were most severe! This suggests to me that Northern Hemisphere temperatures are more important than anthropogenic emissions.
To explore this further, I obtained GISTEMP v4 Northern Hemisphere-mean monthly, seasonal, and annual means for the Northern Hemisphere, land and ocean. I then calculated the average temperature anomaly for the CO2 ramp-up phases (Oct.–May) for the years 1990 through 2020. The following graph, Figure 6, is the result of plotting the annual range of the ramp-up phase against the temperature anomalies:

Fig. 6. Annual ramp-up phase range versus temperature-anomalies for the years 1990 through 2020.
The R2 value indicates that nearly 44% of the variance in the annual range can be explained by average seasonal temperature changes. This provides better prediction than the time-series, which only has an R2 value of about 28%. I suspect that if multi-variate analysis were to be applied, with the ocean and land temperatures treated as separate variables instead of being averaged, a better fit would result and provide more insight on whether outgassing or biological decomposition were the major contributor. One might want to include an index for upwelling, but I think that would be very difficult to obtain.
When the relationship between CO2 and temperature is examined at a finer temporal resolution than annually, i.e. at monthly averages for a single ramp-up phase (i.e. 2018–2019), the R2 value is reduced significantly to 0.230. This could be explained by differences in lag times between outgassing and bacterial production. However, the graph shows two outliers of large jumps [not shown] in CO2 that are suggestive of transient events that are not temperature dependent. What comes to mind is wildfires, but they rarely occur in the Winter. Also, the transient forcing can’t be anthropogenic because large sudden changes are exceedingly rare, and when they do occur, they aren’t measurable!
There are claims that Spring is coming earlier, and there is evidence that Winters are becoming warmer. Is the current behavior of the ramp-up phase representative of the longer-term behavior? To answer that question, I also looked at three years of early atmospheric CO2 data, 1959, 1960, and 1961, also obtained from the NOAA interactive graph cited below. The maximum and minimum seasonal values occur in the same months as currently, and the shape of the curves are similar to the recent curves, and the slopes and ranges, while lower than most recent data, are within the observed variations for the last 30 years. Thus, I would conclude that there have been no significant changes in roughly the last 60 years. Instead, we are dealing with small long-term changes, not at all unlike the phenomena of NASA ‘mission creep.’ Compare Figure 7, below, with Figure 2, above.

Fig. 7. L) Ramp-up and R) drawdown phases for the period of October 1959 through September 1960.
Summary
The slope of a line is important because it is a direct expression of the rate of change of the dependent variable, in this case, CO2 concentration. The slope of the Ordinary Least-Squares Linear Regression trend line for Winter 2019–2020 (1.17 PPMv/month) was higher than the 30-year average (1.09) ramp-up, and higher than the ramp-up slope in 2018–2019 (1.15). Not only can a reduction in range or slope of the growth curve, resulting from a reduction in anthropogenic CO2 not be observed, but it is actually suggesting the opposite!
It is generally claimed that about half-of the anthropogenic CO2 goes into the atmosphere and is totally responsible for the annual increase of about 2 PPMv annually.
Therefore, that would predict a decline in the slope of the CO2 concentrations for the 2019–2020 ramp-up phase of about 9% in April (It increased!), or a lowered April 2020 concentration of at least 0.1 PPMv because of reduced CO2 emissions. It increased compared to 2019 and 2021!
If it weren’t for the economic importance of fossil fuels, we wouldn’t have an estimate of their annual production, consumption, and resultant emissions. The available atmospheric CO2 measurements wouldn’t allow us to make such estimates. That is, not only is the anthropogenic release swamped by natural sources, but even subtle changes, such as a decrease in the rate of increase during the seasonal ramp-up phase, cannot be discerned. The working hypothesis of climatologists is that the long-term atmospheric CO2 increase is the result of anthropogenic emissions. However, the evidence supporting that is weak.
In the finest tradition of post-modern climatology, I will speculate, with little supporting evidence, that the benches in the ramp-up curves during the coldest months of Winter (commonly starting in February, as seen above in Figures 1, 2, 3, and 7.), may suppress oceanic out-gassing, and/or inhibit the activity of biogenic decomposition of detritus, thus causing a hiatus in the increase of CO2. I will further speculate that upwelling plays a role in the temporary increases and decreases in the ramp-up phase.
If the Winter ramp-up is driven by soil respiration, biogenic oxidative decomposition of surface detritus, and ocean out-gassing, it is difficult to imagine an equilibrium between the ramp-up and drawdown when the ramp-up lasts twice as long as the Summer drawdown. An exception might be made if bacterial/fungal action were to be shut down during most of the ramp-up phase by temperatures well below freezing, as might be expected during glaciation. Thus, we could be observing a delayed rebound from the Little Ice Age.
However, because the total anthropogenic contribution to the atmosphere is only about 4% of the total carbon flux into the atmosphere, humans can’t be responsible for this yearly imbalance! The atmosphere can’t tell the difference between anthropogenic sources and natural sources, such as out-gassing and biological decomposition. It is just coincidence that the long-term rise is about one-half of the anthropogenic contributions to the atmosphere.
If there was a delicate balance between the carbon fluxes going into and out of the atmosphere, hydrosphere, and biosphere, then it is conceivable that a perturbation created by Man might cause a reaction to dampen that perturbation, with the effect being to suppress all the anthropogenic-induced change. However, this analysis suggests that because of the annual variations in the ramp-up phase, that delicate balance doesn’t exist, and probably hasn’t existed during at least the last 60 years. The available empirical observations do not support the idea that changes in anthropogenic fluxes are measurable directly. Instead, it appears that temperature is the controlling factor.
However, it does appear that there may be a negative-feedback mechanism, which generally is not recognized. As the Arctic pack ice melts in the Summer, it exposes the underlying cold water to the atmosphere. This allows CO2 to dissolve into the water, reducing the local concentration, and contributing to the general NH drawdown. It is noteworthy that the Fall-Winter CO2 ramp-up phase coincides with the growth of the Arctic pack ice.
It is difficult for me to accept that there is an unrestrained, positive feedback loop driven by CO2 and resulting in significant surface temperature increase, because, if that were the case, one would expect that we would have long ago passed the so-called ‘Tipping Point’ and be in a permanent ‘hot house’ state, like Venus.
It appears that the long-term growth in the atmospheric CO2 concentration is driven not by anthropogenic emissions, but instead, by static effectiveness of the sinks, which because of the seasonal effects, appears to not be keeping up with increasing temperature-driven emissions. There is no question that anthropogenic CO2 is being absorbed in the atmosphere. However, there is no obvious evidence to support the claim that it is totally responsible for the annual CO2 increases. I’m speculating that the carbon flux is large enough that, in the absence of anthropogenic CO2, the annual increase would be at least 96% of what is being measured. The temperature-driven transients are undeniable, and therefore the annual temperature increases must be primarily responsible for the annual increases.
For additional background on this, I can recommend this article by Chaamjamal.
Remarks
I used NOAA CO2 data from the last 31 years to produce Excel graphs to explore the annual range and slope from the ramp-up period from October through May; additionally, I prepared graphs for the years 1959, 1960, and 1961. The downloaded ASCII data that I used for analysis only covered the period 1973 through 2019. I had to retrieve the last three years, and early-1960s data, manually from the following interactive graph: https://gml.noaa.gov/ccgg/trends/graph.html
The temperature-anomaly data were from the following:
GISTEMP Team, 2021: GISS Surface Temperature Analysis (GISTEMP), version 4. NASA Goddard Institute for Space Studies. Dataset accessed 2021-06-04 at https://data.giss.nasa.gov/gistemp/
Lenssen, N., G. Schmidt, J. Hansen, M. Menne, A. Persin, R. Ruedy, and D. Zyss, 2019: Improvements in the GISTEMP uncertainty model. J. Geophys. Res. Atmos., 124, no. 12, 6307-6326, doi:10.1029/2018JD029522.
Discover more from Watts Up With That?
Subscribe to get the latest posts sent to your email.
I searched for the word isotope on this page and did not find it?
That won’t help you burning vegetation, land clearing activity and burning fossil fuels all throw up the same isotopes and he is saying the sinks are decreasing … net result is the same.
The problem that opens is emission control won’t work if the sinks really are decreasing by that scale because the deficit is bigger than the human emissions ….. you would need to fix the sinks back up (something not even on the UN IPCC agenda).
You can argue about if the loss of sinks is human or natural but it makes little difference you can’t emission control yourself to a solution.
“if the sinks really are decreasing”
They certainly decrease if you install a solar “farm” on forest land. Of course that reality is always ignored by the climatistas.
That is considered a land use change. It is most definitely considered by carbon cycle experts. Refer to Friedlingstein et al. 2020 for the time evolution and cumulative effect of land use changes.
Sure, on some level, some scientists are doing this- but on a more local or regional level- it’s barely considered. All I hear is “we gotta install more clean and green energy”- so solar “farms” are popping up like mushrooms in the Northeast- I don’t see the enviro groups or scientists pointing out the negatives of “ground mounted solar”. The main reason some “locals” are now complaining is that once they see them- they know that the solar installations will lower their property values.
No they don’t. Different carbon sources have different 14C, 13C, and 12C concentrations. For example, even within the biosphere C3 plants will have a different 13C/12C ratio than C4 plants. And the fossil reservoir is completely depleted of its 14C since that isotope is radioactive with a half-life of 5700 years and since fossil carbon was formed millions of years ago. Carbon sources definitely do not throw up the same isotopes. Similarly carbon sinks have subtle preferences for specific isotopes.
Perhaps you need to think about it again … when do you think all the European forests were cleared and burnt? Now what is the half life again?
Most of the European forests were burned over the last few hundred years. The CO2 given off by those burnings would have been absorbed by various sinks long ago.
No they reached their minimum 200 years ago
https://www.nature.com/articles/s41598-017-18646-7
Notice what C isotope they are using 🙂
This is the problem you can’t have it both ways.
BTW none of that is controversial it’s in the IPCC chapter 3 and even what all the climate gangsters believe
https://www.realclimate.org/index.php/archives/2004/12/how-do-we-know-that-recent-cosub2sub-increases-are-due-to-human-activities-updated/
It’s only climate activist and true believers that probably aren’t across it.
Huh? The European forests (a small part of the world’s forests, btw) were cleared and burnt (and to some extent re-grown) a *whole* lot less than a C14 half life ago. Whereas fossil fuels have been sitting around for so many C14 half lives that they’re virtually devoid of C14.
So what is your point?
I thought that was the case, so thanks for explaining.
LdB, indeed, there is little difference between the isotopic “fingerprint” of recent organics and fossil organics. But there is good solution for that: both use oxygen to burn. As burned fossil fuel quantities are known and their oxygen use is known for the different fuel types, one can calculate the drop in oxygen content in the atmosphere.
That shows that less oxygen is used than expected from burning fossil fuels.
Thus the whole biosphere: plants at one side, plant decay, soil respiration, molds, insects, animals at the other side, together produce more oxygen than they use.
That means that more CO2 is absorbed than produced by the whole biosphere…
See Figure 7 at the last page of:
http://www.bowdoin.edu/~mbattle/papers_posters_and_talks/BenderGBC2005.pdf
That results in following graph:
Don’t get me wrong as I’m the first to say that the climate crisis
Is a scam, but it’s not true that burning vegetation (or decomposing vegetation) puts up the same isotopes as burning fossil fuels. C-14 is generated in the atmosphere and gets incorporated into vegetation (and other living things). It has a half-life of over 5000 years, so the vegetation that was created in the last several centuries has high C-14 while fossil fuels that have been sequestered away from the atmosphere for millions of years has low C-14. Measuring the amount of C-14 in dead wood and other formally living things is how carbon dating works.
It appears to be a huge oversight in the article to not discuss the measured changes in atmospheric C-14 They’re complex owing to the complication of above ground nuclear testing following WWII but are extremely important.
The point of the research was to see if there was evidence of a decline in the rate of growth of atmospheric CO2 during the most severe restrictions impacting fossil fuel use. MLO does not report on the isotopic composition of their measurements.
You also concluded that the rising CO2 in the atmosphere must be from temperature driven effects without addressing what’s known from declining C-14 concentrations.
Scripps does report isotopes associated with CO2. C14 is slowly declining over time and C13 is increasing.
Thank you. I had not seen this data before.
Clyde,
It’s quite interesting. The C13 ratio shows large seasonal cycles, like northern CO2 and is probably more related to terrestrial breathing. C14 is much more suppressed in seasonal cycles. However, it shows a steady downtrend which is why the alarmists point to fossil fuels as the culprit. I’m sure there is more to this story.
Renee, the huge seasonal amplitude in de NH is definitely dominated by vegetation, as CO2 and 13C change in opposite directions. If the CO2 change was from the oceans, they would change in parallel.
14C doubled with the open air atomic bomb tests and are going back to pre-1940 levels, where 14C levels already were lower than historical by using fossil fuels with zero 14C (much too old). They needed correction tables for radiocarbon age detection from 1870 on.
Renee, one caveat with 14C, it would decline regardless of whether humans were lofting 14C depleted carbon into the atmosphere or not. This is because the atomic bomb testing lofted huge amounts almost as if it was done in one large pulse. There is an equilibrium ratio modulated by the residence time of molecules in the atmosphere and its production in the upper atmosphere. However, anthropogenic sources of 14C and depleted fossil carbon do subtly alter the shape of the decay curve. I personally don’t think 14C declines after the bomb spike are a convincing line of evidence in support of the hypothesis that humans caused the CO2 increase. However, I do think the decline prior to the bomb spike is pretty convincing. At the very least significant human causation is consistent with all lines of evidence including isotope analysis.
Renee, 13C is decreasing, the left/right hand scales are confusing…
Ferdinand, you are correct, 13C is decreasing. Scripps likes to invert the scale so it parallels CO2. I wish they wouldn’t do that!
The sinks are not decreasing. Only their relative effectiveness, with a fixed amount of time annually, is decreasing in the face of increasing CO2.
It could be either you actually can’t tell from the data … never assume an answer you can’t verify 🙂
The slope of the drawdown range over 30 years is essentially zero!
Yes but that is the total effect it is still built of (sink + emmission) in both phases just one dominates the other. In the ramp up phase (the one that is changing) you can’t tell if the emission is increasing or the sink reducing or both … your number just tells you the dominate combined result.
The easiest way to play with it is as a tank being filled from a tap with a hole. The tap can change and put more water in, the hole can change and let more water out or both can occur. All you get to measure is the level of water in the tank.
Yes, you can tell by exploiting the law of CoM. You monitor the reservoir above the tap and below the hole. Using this information and the fact that mass is conserved tells you whether the tank level changed because of a change in the tap or a change in the hole.
I love you optimism that you can monitor the entire world carbon bdgwx 🙂
He has plenty of help – check the number of authors:
https://essd.copernicus.org/articles/12/3269/2020/
And read the paper for a summary of the data sources
Does the mas balance idea matter if the non-anthropogenic emissions come from deep-ocean upwelling and short-lived bacteria?
It’s not that simple.
It is that simple. In algebra we use symbols to represent unknown quantities. In this case En represents emissions from *ALL* natural sources (which would include deep-ocean up-welling and short lived bacteria). The mass balance analysis does not require that we know the value of En, so it can represent all natural sources, even if we don’t know what they are.
M Courtney, it always matter: the mass balance must close at any moment, except if there is a CO2 loss to space (which I don’t expect)…
Even if the CO2 emissions from the deep oceans doubled, the net result of the mass balance is that about half of human emissions as mass (not the original molecules) remains in the atmosphere and half must be absorbed somewhere.
Thus a doubling of one natural source requires a similar increase of one or more natural sinks to fulfill the mass balance, as the increase in the atmosphere is smaller than human emissions in mass…
Can we really distinguish by isotope between CO2 that’s been in the deep ocean for centuries and CO2 that’s been in the ground for millennia? Especilly when the CO2 that’s current is changing as well.
Think about my point. We are not measuring CO2 by measuring individual sources C14 ratios. We are measuring the CO2 blend of C14 ratios.
[Measured Ratio of C14 to C12 CO2] = the mean by volume of
[Measured Ratio of C14 to C12 CO2 from fossil fuels] (low) +
[Measured Ratio of C14 to C12 CO2 from deep oceans] (almost as low) +
[Measured Ratio of C14 to C12 CO2 from current land-use changes] (high)
We have too many unknowns and are tying to distinguish the weakest signal of the mix.
Don’t get me wrong as I’m the first to say that the climate crisis is bogus. However, the C-14 ratio in the atmosphere is easily changing fast enough to measure and it’s changing faster than it can decay. If the change was owing to dissolved CO2 coming up from the deep ocean that has been there for many 1000s of years (has to be many 1000s of years, not hundreds, because C-14’s half-life is 5700 years) , the atmospheric concentration wouldn’t be changing unless something is recently bringing it up from the depths that wasn’t bringing it up before. What would that be? On the other hand, fossil fuel use is recent and fossil fuels have been sequestered from the atmosphere and have had millions of years for the C-14 to decay.
This is a case where nature has made it easy to apply Occam’s razor and select the right theory. The increasing CO2 in the atmosphere is mostly from fossil fuels.
Or perhaps as the planet warms plants use relatively more C14? So less C14 in the atmosphere. Or less is being made in the atmosphere? There are possibilities other than the burning of fossil fuels.
Which is to say less C14 is just a product of a warming world – and not indicating the cause.
No, 14C is produced by the action of cosmic rays on nitrogen in the upper atmosphere. Difficult to argue that is affected by a small amount of warming.
I think that is unlikely. If the plants generally have a ‘preference’ for C12 over C13, why would they use more C14 with a rise in temperature?
I would agree. Mass balance is a conceptual model. As presented previously, it didn’t take into account all the variables and it didn’t address the uncertainties in the known variables. NASA has documented an increase in the amount of global vegetation of about 18% over recent years and, as I recently pointed out, the uncertainties in the Carbon Cycle are significant.
I would say that if the mass balance model doesn’t close, in the face of the obvious temperature dependence of atmospheric CO2, then there is a problem with the model.
Lets look at that bit by bit
“Mass balance is a conceptual model.”
No, conservation of mass is a physical law, it very much applies to the real world.
“As presented previously, it didn’t take into account all the variables”
Ea is anthropogenic emissions
Ua is anthropogenic uptake (e.g. carbon capture and storage), but that is negligible, so we have indeed left it out.
En is emissions from *ALL* natural sources
Un is uptake by *ALL* natural sinks.
Precisely what has been left out?
“and it didn’t address the uncertainties in the known variables.”
Incorrect. Both Ferdinand an I pointed out that the uncertainty on En – Un is bounded by the uncertainty on dC – Ea, which is very small. Much too small to cast doubt on the fact that En – Un is negative. The uncertainties in the known variables has been accounted for properly.
“NASA has documented an increase in the amount of global vegetation of about 18% over recent years”
and? This will affect En and Un, but since the mass balance analysis does not assume anywhere that we know the values of En or Un, that is irrelevant.
” and, as I recently pointed out, the uncertainties in the Carbon Cycle are significant.”
As we have been at pains to point out, the uncertainty on En – Un is bounded by the uncertainty on dC – Ea, which is very small, but you have been sedulously ignoring that.
“I would say that if the mass balance model doesn’t close”
Yes, it does close, by construction. That construction is valid unless you think that the carbon cycle does not obey conservation of mass. Good luck with that!
“in the face of the obvious temperature dependence of atmospheric CO2, then there is a problem with the model.”
The temperature dependence is small (c.f. change in CO2 coming out of a glacial). On the other hand, the solubility of CO2 in the ocean is strongly dependent on the concentration difference. Which part of Henry’s law wins out? The concentration difference, if that were not the case, atmospheric CO2 would be rising faster than the rate of anthropogemic emissions as both nature and mankind would be net sources. This is not rocket science.
That is true. However, your particular equation of carbon mass balance is a model of how you think CoM works in the Carbon Cycle. Don’t confuse a general law with an attempt at your interpretation to create a specific implementation of the law. Your equation may be incomplete, or inadequately close because of measurement errors, and not invalidate the physical law.
No. Conservation of mass cannot be written in a way that is not isomorphic to the equation I gave. The change is the difference between total inputs and total outputs. If you disagree, show me an equation that represents conservation of mass which is not equivalent to mine.
”Your equation may be incomplete”
I just challenged you to point out the variable that was left out, but you obviously can’t (because it already includes all natural sources and all natural sinks. What is left? Extraterrestrial fluxes? Supernatural sources? Good luck with that)
”inadequately close because of measurement errors”
How many times do I have to/point out to you that NOWHERE in the analysis do we need the actual values of En or Un? Regardless of the uncertainties on En and Un, the uncertainty on En -Un is bounded by the uncertainty on dC – Ea, which is much smaller. That is the whole point of the mass balance analysis.
You are just repeating the same issue without paying attention to the answers you have been repeatedly given.
I responded to this issue in part in:
https://wattsupwiththat.com/2021/06/07/carbon-cycle/#comment-3264289
In order for the mass balance model to work, all the variables have to be identified and measured, along with an estimate of their intrinsic measurement uncertainties and time-dependent variance.
After looking at the Carbon Cycle models, I’m not convinced that we can characterize all the variables well enough to rely on your mass balance model. Just because you may lump some unknown variables together doesn’t mean that their measurement uncertainties and time-variance can be ignored.
I think that I have provided empirical evidence that the changes in CO2 are dominated by temperature. Yet, your response is to say that measurements of the fundamental variable don’t agree with a model that uses a plethora of measurements of unknown accuracy and precision.
‘In order for the mass balance model to work, all the variables have to be identified and measured,”
I have repeatedly pointed out that in algebra we use symbols to represent unknowns. Thus we don’t need to identify and measure every variable. If you think we do, it means you don’t understand the mass balance analysis.
Conservation of mass means that dC – EA is equal to En – Un. This means the uncertainty on En – Un cannot be greater than the uncertainty on dC – Ea, BECAUSE THEY ARE EQUAL.
‘I think that I have provided empirical evidence that the changes in CO2 are dominated by temperature. Yet, your response is to say that measurements of the fundamental variable don’t agree with a model that uses a plethora of measurements of unknown accuracy and precision.’
no, I have repeatedly pointed out that the processes resulting in the inter annual variation are not the processes causing the long term rise. This is now the third time I have directed you to the paper that explains why
https://ore.exeter.ac.uk/repository/bitstream/handle/10871/123682/Ch%2020%20ENSO%20and%20the%20carbon%20cycle%20-%20for%20production.pdf?sequence=2
Are you a teaching academic? You behave as though you are talking down to an undergraduate.
Yes, I am a teaching academic.
I point out that in algebra we use symbols to represent unknowns because you have repeatedly asserted that we need to consider measurement uncertainties in quantities treated as unknowns (where we do not use the measurements)
If you don’t like basic concepts being pointed out, don’t ignore them in the first place. You are ignoring the point again by complaining about tone rather than addressing the content of what was said.
BTW, I never talk down to undergraduates, they tend to be paying attention the first time. They also never assume that they know better than the worlds leading scientists and think they have proven them fundamentally wrong on the most basic of issues.
Clyde:
In order for the mass balance model to work, all the variables have to be identified and measured, along with an estimate of their intrinsic measurement uncertainties and time-dependent variance.
And that is exactly where you are completely wrong. You don’t need to know any individual CO2 flux at all or its uncertainty, because we know exactly (with a small uncertainty) the net effect of all natural inputs and outputs together. That is the difference between known emissions and known increase in the atmosphere…
And again, the changes in the CO2 rate of change are dominated by the influence of temperature on vegetation, while vegetation is an increasing net sink for CO2 as the O2 balance (and the greening of the earth) proves… Thus vegetation is not the cause of the increase…
Ferdinand,
Yes, it is really very simple: the estimated total emissions of CO2 is almost exactly twice the measured increase in atmospheric CO2, therefore, the combination of physical absorption (ocean) and net biological absorption (land and ocean) must equal very close to half of total human emissions. This painfully obvious. There is no other plausible interpretation.
Coincidence!
No, it is not a coincidence, it is conservation off mass combined with observation of atmospheric co2 and anthropogenic emissions data.
Clyde,
I am enormously skeptical of the catastrophic warming projections from most GCMs and the bizarre projections of sea level rise (1 to 2 meters by 2100? Not going to happen… more like 12-14″.) The models are, on average, probably high in their projections of warming by a factor of 2 or more. There is no impending climate catastrophe, and save for the damage done by covid over the past year, humanity’s condition has continuously improved over my lifetime. That will only stop if global warming panic brings on destructive energy policies that impoverish most people, and especially those living in poorer nations.
My consistent observation is that the field of climate science is as much motivated by leftist politics and Malthusian philosophy as by physical reality, leading always to shrill insistence on destructive energy and other policies… like wealth transfer in pursuit of “climate justice”. IMHO, the field is truly a danger to human welfare, and should be mainly defunded.
All that said, questions like where emitted CO2 ends up are simple and the answer obvious: about half is being taken up by the ocean and plants, and half remains in the atmosphere. This is so blindingly obvious that arguing otherwise is both ridiculous and futile, and distracts from credible arguments against crazy projections and crazy policies.
https://tylervigen.com/spurious-correlations
You don’t understand material balance.
“https://tylervigen.com/spurious-correlations”
it isn’t just a correlation though, is it? It is physics – conservation of mass.
The reason the airborne fraction is approximately constant is probably that we are driving an approximately first order linear system (the higher order terms are more dominant on longer timescales) with an approximately exponential increase in CO2. The result is an exponential rise with the same time constant, so the ratio is constant. You can find the differential equations providing a qualitative explanation in my journal comment on Essenhigh’s paper that I have mentioned elsewhere in this discussion.
Ferdinand
You said, “You don’t need to know any individual CO2 flux at all or its uncertainty, because we know exactly (with a small uncertainty) the net effect of all natural inputs and outputs together.”
DikranM said, “The change is the difference between total inputs and total outputs.”
How can one be certain that the change is correct unless all parameters are measured accurately and with a very small uncertainty?
To be certain of the change in atmospheric co2 we just need to accurately measure co2 (as we do at manually loa and a global network of monitoring sites) and subtract the measurement at the start of the period from the measurement at the end of the period. The uncertainty of that change is small because the measurements have low measurement uncertainty.
Clyde it seems difficult to understand, but it really is that simple:
But, all that tells us is the net difference of a large number of “ins and outs.” Each of them have different measurement accuracies and uncertainties, and different variance from year to year. Just because the net change in the atmosphere is a fraction of the estimated fossil fuel use doesn’t prove that it is actually the fossil fuel emissions going into the atmosphere that are totally responsible for the growth. Since the average anthropogenic emissions are about 4% of the total atmospheric influx, one might see a growth of 96% of the current/recent growth in the absence of any fossil fuel emissions because of the demonstrated sensitivity of the ramp-up phase to global temperatures.
“Since the average anthropogenic emissions are about 4% of the total atmospheric influx, one might see a growth of 96% of the current/recent growth in the absence of any fossil fuel emissions because of the demonstrated sensitivity of the ramp-up phase to global temperatures.”
I’m confused. First you claim that a 9% drop in human emissions should have resulted in a 9% drop in the slope during the ramp-up. Now you say that a 100% drop in anthropogenic emissions would only reduce the slope by 4%.
Let me see if I can unconfuse you. The accepted paradigm is that all of the growth in CO2 is anthropogenic. If that is the case, then an 18% drop in emissions should result in ~9% drop in April 2020 CO2. However, that is not evident.
However, I’m suggesting that all sources are contributing to the ramp-up, of which the anthro’ contribution is only 4%. Ergo, a 100% drop would result in a 4% decline in the ramp-up phase.
“The accepted paradigm is that all of the growth in CO2 is anthropogenic.”
You were talking about the rise from October to May. It is not accepted that all that growth is due to anthropogenic CO2 emissions. Most of that rise is due to the seasonal cycle that has been happening long before humans started emitting CO2.
“ If that is the case, then an 18% drop in emissions should result in ~9% drop in April 2020 CO2.”
I’m still confused about your statistics here. You say there was an 18% drop in emissions in April – but I don’t think that was the case. The link you provided only says there was an 18% reduction on one day in April. Then you say that this should have resulted in a 9% drop in April 2020. I would expect an 18% reduction should result in an 18% reduction in the rise, but it makes little difference.
Let’s put some figures on this. Annual increases in CO” vary from around 2-3 PPMv each year. In a single month this amounts to a rise of up to 0.25 PPMv. An 18% reduction in that rise would be 0.045 PPMv – so whereas we might have seen a rise of 0.25 PPMv in April, we could only get a rise of 0.2455 PPMv. Of course, this difference is well inside the natural variation.
But this is ignoring the natural seasonal cycle, and your claim originally was that the 18% reduction in emissions should result in a 9% reduction in the rise from October to May. As I said elsewhere, this makes no sense when most of that rise would be happening even if there where zero anthropogenic emissions. It’s even more difficult to see how this could happen if you are measuring the slope using a line regression.
“However, I’m suggesting that all sources are contributing to the ramp-up, of which the anthro’ contribution is only 4%. Ergo, a 100% drop would result in a 4% decline in the ramp-up phase.”
Now you are really confusing ideas. The 4% figure is the proportion of all emissions caused by humans – that is, for every 24 Gt of CO2 nature emits in a year, humans emit another 1 Gt. But this is the gross emissions, not the net change. The rise from October to May is not caused by the gross emissions, it’s caused by an imbalance between emissions and absorption of CO2.
But your figures make no sense in any case. It would imply that 96% of the seasonal rise was caused by natural emissions, and only 4% by anthropogenic. It would take around 25 year for CO2 levels to rise by a complete cycle. In reality it only takes about 3-5 years.
Clyde,
Again, the exact difference between ins and outs is known with quite small uncertainty. No matter how large these ins and outs are, The exact difference is human emissions – increase in the atmosphere. Without any knowledge of any natural flux or the exact height of all natural ins or outs together.
It is because the increase in the atmosphere is smaller than human emissions, that it proves that human emissions are the cause of the increase and nothing else, nature is a net sink, not a source.
It doesn’t matter at all if human emissions are 40% or 4% or 0.4% of the total influx, all that matters is that the total outflux is larger than the natural influx. Which is solidly proven by the mass balance.
The increase in net outflux is independent of the natural influx or temperature, the net outflux only depends of the extra CO2 pressure in the atmosphere.
That means that with halving the human input, the CO2 levels would stay even and with zero human input the levels would drop, starting with the same net outflux as today, slowly reducing to zero when the equilibrium is reached.
The ramp-up phase depends of temperature, temperature modulates the net sink rate temporarily, but doesn’t influence the long term sink rate.
You are very confused; I hope you are not a chemical engineer.
Would you be happier if I were a nuclear engineer?
Clyde,
You are on the right track. Uncertainties in this this type of system must be combined in percentages. That means the uncertainty in the largest components are going to provide the largest contributions to the overall uncertainty. That’s why I’m not sure the term “dC – Ea” is an accurate depiction of the bound on uncertainty.
Typically you would use root sum square to combine the uncertainties in all the different measurements. But when the uncertainties are magnitudes different in absolute values it is better to combine the absolute values of each component to use as the denominator in computing the overall uncertainty.
As an example assume the large value has a measure of 95 @ur momisugly 1% uncertainty and the low value is 5 @ur momisugly 10% uncertainty. You get the following.
95 * 0.01 = 0.95
5 * 0.10 = 0.5
——-
1.45
0,95 / 1.45 = 66% of the uncertainty
0.5 / 1.45 = 34% of the uncertainty
The large value of measurement dominates the uncertainty even with a much better precision of measurement.
This means you can not conclude that Ea is the entire contributor to the change.
“That’s why I’m not sure the term “dC – Ea” is an accurate depiction of the bound on uncertainty.”
it is because conservation of mass tells us that dC – Ea = En – Un. As the two things are equal, their uncertainties are bounded by the most certain, not the least. Otherwise the large uncertainties on En and Un would make us less certain of dC and Ea, but that is ridiculous as we have accurate means of measuring both dC and Ea.
You say that like it is a bad thing. Actually, “isotopic” does show up in the quote from Carbon Brief. Did you try a global search?
Considering that I was relying on NOAA data, which doesn’t break out the isotopic composition, why would you expect to find “isotope?”
“this article by Chaamjamal.”
This reference addresses isotopes as well.
I searched for the word troll on this page and did not find it?
What an intriguing analysis, Clyde spencer. Your comments and graph data not only suggest the temperature drives CO2 atmospheric concentrations (as opposed to anthropogenic) but also emphasizes the Good Boy versus Bad Girl effect. If Griff makes the mistake of reading your report he/she/it will have a hissy fit. Wait for it.
I read it.
summary?
Junk science.
and the isotopic signature of CO2 clearly shows a human/fossil fuel origin
You didn’t find any problems with his post since you didn’t specify anything you consider “junk science” in it.
How about telling us what YOU think is wrong with the article?
Your comments are often trolling junk since it is normally a drive by comment with nothing resembling a true counterpoint, thus you add NOTHING useful to the debate.
thus you add NOTHING useful to the debate.
I beg to differ. Griff, like the rest of our warmunist trolls adds the element of foolishness and hubris we have come to expect from their ilk. It reminds us all what we always knew … their position is devoid of science.
While I wouldn’t call it “junk science” (being wrong is part of science), griff DID specify what he thought was wrong with the articcle, which is that it is contradicted by isotopic arguments. You did not address that argument.
No, it doesn’t.
I’d characterize your “summary” as a ‘cheap shot.’ You aren’t specific about anything. You just offer your offhand opinion to 7 graphs and nearly 3300 words summarizing my hours of analyzing 30 years of NOAA data.
You might has well have said “I don’t like it because it doesn’t agree with what I believe.” That would have been more honest.
Clyde’s work also is supported by the work of Berry, Humlum, Harde, Munshi, and Salby
Agree with all but Salby. I have studied all three of his video lectures, and found a lot that was just wrong. Plus, he is inconsistent between the three and when called on it said it was because his notes got ‘left’ in Australia and he was recreating from memory. BS.
Offered to write Salby up for Judith, but it was so bad she did not want to give him the exposure. He is best ignored and forgotten
True to tradition, Rud Istvan is long on opinion but short on understanding. Berry, Harde, and Salby (which reference one another) use the same science to show the same thing.
DMA,
I disagree completely with Berry, who reverted the formula of the residence time to prove what he wanted to prove, which you may do if, and only if, all inputs and outputs are unidirectional. Which is not the case in the real world where the largest CO2 fluxes get from sinks to sources and reverse over the different seasons…
I disagreed with Humlum, but need to recover why (is already some time ago)…
I disagreed with Harde, who started good by looking at the decay rate of an extra amount of CO2 in the atmosphere, but at the final formula used the residence time, which has zero influence on CO2 removal.
http://www.ferdinand-engelbeen.be/klimaat/Harde.pdf
With as conclusion:
Dr. Harde makes three fundamental errors:
I disagreed with Salby: too many impossibilities and errors in what he says (good for a complete article…).
I disagree with Munshi: confusing the cause of the variability in rate of change of the CO2 increase with the cause of the increase…
Griff read it. Griff states that he considers the article junk science.
Since the article was wholly written as an analysis of 31 years of NOAA CO2 data, Griff must then consider NOAA data as junk science.
He wrote that here for all to read. No one forced him to reach that conclusion.
Doonman, the problem is not in the NOAA data, the problem is in the interpretation by Clyde…
It is pretty hard to argue with hard, primary data in the form of graphs. People can see whether or not the graphs support my claims.
I have yet to have you or anyone point to an error in those graphs. What I get from you are claims that my interpretations are in error because they don’t agree with your long-ago analyses. Some of those analyses fail to recognize that instead of looking at the 12-month record (where the range is basically the uncompensated residual) to see what the average change might be for a single critical month, I looked at the ramp-up phase, which has minimal influence from the sinks. That increases the sensitivity to a reduction in emissions because that is the dominant activity during those months. The dominant processes going on during the ramp-up phase and the drawdown phase are different. One has to be careful to justify including both in any analysis to be sure it isn’t a classic case of comparing ‘apples and oranges.’ You fail to do that.
I agree that it is hard to argue with plots of primary data:
The blue line is annual anthropogenic emissions, the red line is the annual change in atmospheric co2 from Maura loa. The difference between the two is the net contribution from the natural environment, which is shown in green. Notice that:
(I) The natural contribution is negative, showing it has been a net carbon sink for at least the last 50 years.
(ii) The magnitude of the net natural sink has been growing over time.
This tells us the rise in atmospheric co2 is not natural, the natural environment has been actively opposing the rise, and doing so increasingly strongly. This directly refutes the argument presented in this blog post.
You and Engelbeen have steadfastly insisted that accuracy and precision are unimportant in the calculation of mass balance.
Ea is an estimate based on sales, largely for tax purposes. While the taxation authorities will be diligent in attempting to collect all taxes due, there will be an incentive to avoid paying those taxes, particularly for bulk sales in countries less well-regulated than First World countries. If we assume, for the sake of argument, that a ‘war of wits’ exists between producers and those levying the taxes, then there will be varying inaccuracies in the Ea estimate. Further, let’s assume that the taxation authorities have gotten better over time at closing loop holes. That means early sales and emissions would be larger than ‘officially’ estimated. If that were the case, then it could change the slope C’-Ea to being flat, negating your argument.
Unless you can assign uncertainties to at least both of these important variables (also sometimes called “unknowns” by academics) you can’t be certain that your claim the “natural contribution is negative” is valid. It is a hypothesis not supported by rigorous analysis.
“You and Engelbeen have steadfastly insisted that accuracy and precision are unimportant in the calculation of mass balance.”
yet another misrepresentation. The key point is that dC – Ea = En – Un. It doesn’t matter that the measurement uncertainties on En and Un are large because the uncertainty of En – Un is bounded by that of dC – Ea because they are numerically equal. So accuracy and precision have been a key element of the analysis.
The uncertainties on Ea are researched, they are of the order of 10% IIRC. I suspect the carbon budget paper I cited earlier will have the details.
I was right, it does, the uncertainty on the fossil fuel component is 9.6 ± 0.5 GtC yr−1, which is nowhere near enough to change the outcome of the mass balance analysis. If you think the fossil fuel use is underreported by a factor of two, you are deluding yourself.(especially as skeptical blogs tend to think climate change is a tax raising scheme, if that were true, governments wouldn’t be incompetently lax in collecting it)
Quite an interesting graphic, there, DM. Anthropogenic emissions increasing with a near-linear trend – while increases in total CO2 are highly variable.
Nice proof that total CO2 increase has no or little relation to anthropogenic emissions.
Clyde to give an example why your analyses per month makes no sense at all:
It is exactly comparable to an analyses of the sea level rise in the upgoing tide.
Even if the sea level rise doubled or quadrupled, that would not be measurable in the huge change during an upgoing tide and its natural variability. You need at least 20 years of data to be sure that there is a change,
The same for the change in human emissions: the CO2 increase is about 2 ppmv/year, or less than 0.2 ppmv/month. The detection limit at Mauna Loa is about 0.2 ppmv. A change of 10% during one month is 0.02 ppmv. Simply undetectable in the natural variability. You need at least a year of a sustained 10% drop and probably several years to detect the change within the natural noise..
It is a poor analogy. If one takes a measurement at low water, another at high water, and another at the new low water, it would be similar to what I have done. One could compare the ramp-up phase (high water – 1st low water) with the drawdown phase (2nd low water – high water). They should be similar but of opposite sign. Because tides are complex sinusoidal curves, I expect a difference. One can still reasonably talk about the average ramp-up statistical characteristics for any given month. That is, winds or pressure differences will show up during the changing tide heights. However, the tides are driven by celestial bodies, not so much by the seasons. Hence about 20 years is needed for the cycles to repeat. The atmospheric CO2 is just the opposite in being driven by the seasons, not so much by celestial bodies. What I did was similar to trying to detect the presence of a wind blowing offshore, or a high pressure system over land during the tide ramp-up phase.
You said, “You need at least a year of a sustained 10% drop and probably several years to detect the change within the natural noise.” That is the dogma that is sanctioned. I was trying to find a way to increase the sensitivity of detection. There are obvious anomalies in the shape of the CO2 curves that are not explained, and totally ignored by only considering only the annual residual or averages. Sometimes a cigar is only a cigar. But sometimes ‘noise’ is an unidentified signal.
Clyde, you can’t increase the detection of CO2 measurements if these are around 0.2 ppmv and the change per month which you wish to detect is 0.01 ppmv
Even if you look at the influence of temperature on the rate of change, while the emissions are not at all influenced by temperature…
One big problem. The biggest natural variability contributor is usually ENSO. In the past year we’ve been primarily under La Nina conditions which usually would lead to lower CO2 levels.
In reality, you have a double whammy to explain. Both the emissions and ENSO say the CO2 rise should have been much less.
I haven’t seen the 2021 figures yet…
Fossil fuel is just that — geologically sequestered plant remains.
Would not fossil fuel emission have a very similar isotopic signature to temperature-stimulated emission of CO2 from plant matter sequestered in soils, say, through bacterial decomposition that happens more rapidly as temperature increases?
What am I missing here?
Paul, indeed there is little difference in isotopic composition between burning/decaying/eaten recent organics and burning fossil organics, but there is a way-out: the oxygen balance.
We know how much O2 is used by burning fossil fuels.
We can measure the O2 decline over time
The difference is what the biosphere as a whole has done.
That shows that the biosphere is net producer of O2, thus a net user of CO2 and preferably 12CO2, thus not the cause of the 13C decline.
See the last page, Figure 7 in:
http://www.bowdoin.edu/~mbattle/papers_posters_and_talks/BenderGBC2005.pdf
You are beginning to sound like Stokes. Whether the CO2 is produced by combustion or biogenic decomposition, the amount of oxygen consumed will be essentially the same, because the end product is oxidized carbon. If oxygen is increasing, which I doubt, that could be the result of increased productivity of vegetation and plankton, resulting from greater availability of CO2.
Clyde, it seems that you don’t like balances: neither the mass balance, nor the oxygen balance.
The difference between expected O2 decline and what is measured shows that less oxygen is used than expected from burning fossil fuels. Thus the whole biosphere is a net producer of oxygen, thus a net user of CO2 and preferably 12CO2, thus a net sink for CO2 and not the cause of the sharp 13C decline in the atmosphere…
What if – as temperature rises the ratio of C12/C14 that a plant/plankton takes up changes? It is one of the reasons why I think the computer climate models are rubbish – the ‘coefficients’ chosen for the model may work reasonably right now, but in a world where CO2 is 50% higher and temperatures up by 0.5°C in all likely hood the parameters will have changed as well – but in ways we can’t know.
It is an interesting conjecture. Do you have any thoughts on why that would happen? Do you have any evidence to support it?
I have long thought that the climate sensitivity isn’t a single number. Rather, it is a variable that changes with temperature and CO2 concentration.
Chris, based on the 13C/12C ratio in ice cores over the Holocene and further over glacial and interglacial periods, the change in ratio caused by temperature changes is quite small. Not more than a few tenths per mil δ13C for about 5ºC difference and 100 ppmv CO2 difference.
The current drop is already over 1.5 per mil δ13C and the 14C content doubled in 1960 and is again near what it was before 1940. That is reflected in the wood of trees.
The isotopic changes are not an issue in climate models, the issue is the positive feed-backs which enhance the effect of CO2 on temperature, but are nowhere found…
And if temperature drives CO2, and there is a net increase in ocean CO2 outgassing going on, then the oceans are not acidifying but basifying (excuse me using that terminology). Which means ocean acidification is hokum also.
I think we are all getting a good look at how science really operates with the virus origin debate going on: natural or fabricated. It isn’t too hard to imagine what would have happened had the former prevailed: “billions and billions of dollars going to zoonotic viral research to prevent the next natural occurrence”. And anyone who presented countervailing ideas would be excluded from research money, publication and a career…
Being a climate scientist must be hard enough (keeping your eyes closed) but could you imagine being a virologist with that moose on the table?
Interesting how we have moved on from the “science vs religion” debate era to the “science vs politics” era.
Anon, there are a few stations where the ocean waters are monitored over decades.
All stations show an increase in dissolved inorganic carbon and a decrease in pH.
Thus the CO2 flux is into the oceans not out of the oceans:
https://tos.org/oceanography/assets/docs/27-1_bates.pdf
You are speaking about the net surface waters. The 1,000-year old bottom waters are delivering CO2-enriched water that has been sequestered for a millennium.
Yes, we all know about upwelling. Are there long term trends in upwelling that could explain the long term increase? No.
Clyde, the difference between the pCO2 of the atmosphere and the pCO2 of the oceans is about 7 μatm over the total ocean surface, including the deep ocean exchanges via sinks near the poles and upwelling near the equator. Thus the total net CO2 flux is into the oceans. Partly in the surface, partly in the deep oceans, where more CO2 sinks near the poles than is upwelling near the equator.
https://www.pmel.noaa.gov/pubs/outstand/feel2331/mean.shtml
Clyde, it would be helpful if you provided a carbon mass budget to your analysis. If you think the fossil reservoir tap has little or no affect on the carbon mass in the atmosphere then you’ll have to identify a carbon mass reservoir other than the fossil reservoir in which mass was transferred to the biosphere, hydrosphere, and atmosphere. Then you’ll need to explain where the fossil mass went if it did not go into these other reservoirs. Remember, we know from observations that mass is increasing in these 3 reservoirs and decreasing in the fossil reservoir. What I and the other skeptics are looking for here is a budget that complies with the law of conservation of mass. Can that be delivered?
At nearly 3300 words, I was pushing the limits of reader tolerance. It would have been a diversion to the main thrust, which was to demonstrate that there is no empirical evidence to support the claim that fossil fuels are driving the atmospheric increase.
I think that it should be up to those advocating the value of a mass balance model, to demonstrate how it trumps the obvious CO2 sensitivity to temperature, and lack of measurable evidence that it is fossil fuels driving the increase.
Right, so you didn’t present the mass balance analysis, which is empirical evidence that anthropogenic emissions drive the increase in atmospheric CO2 because it wouldn’t have left room for main thrust, which was to demonstrate that there is no empirical evidence to support the claim that fossil fuels are driving the atmospheric increase.
“I think that it should be up to those advocating the value of a mass balance model, to demonstrate how it trumps the obvious CO2 sensitivity to temperature”
It doesn’t show *how* it does it, it just shows that it does do so. If you want to know how, I’d start by looking at both parts of Henry’s law, rather than only the temperature dependence.
“and lack of measurable evidence that it is fossil fuels driving the increase.”
repeating that won’t make it true to anybody but yourself.
Berry addresses the mass balance question and supports Clyde’s findings in this report. https://edberry.com/blog/climate/climate-physics/preprint3/
I’ve commented on berry’s blog – he ignored the counter arguments raise, just as Clyde is ignoring them here. That is why he publishes his work in journals that will publish more or less anything if you are willing to pay the fees.
He does not adequately address the mass balance. He also does not adequately address his conflation of residence time and adjustment time. In fact, his commentary seems to suggest he rejects both in favor of a single concept he calls “e-time” which is hypothesized to be an intrinsic and unchanging property of nature. And while that later bit toes the line of absurdity itself it is the simple conflation or rejection of RT and AT that almost defies credulity.
Indeed, residence time and adjustment time are fundamentally different things, but Berry, Harde, Essenhigh etc. Are unable to accept that, so their confusion persists. This is an error that has been going on for so long that the first IPCC report specifically addressed it!
DMA,
I have tried to discuss things out with Dr. Berry, to no avail.
His fundamental error is that he reverses the formula for the residence time, which you may not do if not all fluxes are unidirectional. Which is the not true for the large seasonal fluxes which go back and forth between sources and sinks which reverse sign over the seasons.
That has no influence on the residence time, but makes that the residence time has zero influence on the amount of CO2 in the atmosphere…
I think that we have different definitions of empirical evidence. I think that once you take some data and put it into even a simple mathematical model to derive an answer, it is no longer considered “empirical.”
https://dictionary.cambridge.org/dictionary/english/empirical
That seems to be a prevailing difficulty with the way they (true believers) are manipulating the scientific method and its vocabulary. Hell, they even want to rewrite the null hypothesis to conform to their beliefs.
Ok the fact that atmospheric co2 is rising more slowly than anthropogenic emissions rate is evidence the natural environment is a net sink. If it were a net source, the rate would be higher as both mankind and nature would make a positive contribution.
There, the same evidence, but explained without an equation.
First, it’s not just fossil fuel emissions. Since 1960 fossil fuel emissions account for 365 GtC while land use change emissions account for 85 GtC. Yes, fossil fuel is a significant component of humans emissions at about 80%, but it’s not the only thing.
Second, we do have evidence that humans emissions are driving the increase. This evidence comes in multiple forms including but not limited to 14C declines prior to the bomb spike, the decay rate of 14C after the bomb spike, 13C/12C ratio declines, O2 ratio declines, mass accounting both in terms of magnitude and timing of the human emissions and natural absorptions, the lack of an identifiable alternative for the increase in the air, land, bisophere, etc.
Don’t hear what we’re not saying. We’re not saying that CO2 isn’t also modulated by the temperature. It definitely is. But the magnitude and time scales of that modulation is far too small and too long to explain the carbon mass behavior in the carbon cycle today. Nevermind that if the temperature change is caused by humans then any additional CO2 appearing the atmosphere due to that change in temperature also gets lumped into the anthropogenic bucket as well. And there is a lot of evidence that suggests that a significant part of the temperature change is caused by humans.
However, the temperature changes are evident in the CO2 data, whereas the anthropogenic influence is not to be found!
As I have told you several time, the factors causing the inter-annual variability are not the same as those causing the long term rise. See this paper:
https://ore.exeter.ac.uk/repository/bitstream/handle/10871/123682/Ch%2020%20ENSO%20and%20the%20carbon%20cycle%20-%20for%20production.pdf?sequence=2
An interesting article. I found the statement in the introduction to be noteworthy: “Climate variability related to ENSO plays an important part in the global carbon and influences the rate at which anthropogenic emissions of CO2 build up in the atmosphere year to year.”
However, I think that the remark “The long-term increase in atmosphericCO2concentrations is entirely the result of human-caused emissions of carbon dioxide into the atmosphere” to be over-dogmatic.
You are evading the point, which is that the factors giving rise to the year to year are cyclic and hence cannot cause a long term secular rise, only modulate the rate of the rise.
It isn’t over dogmatic. There are multiple lines of evidence supporting this statement that have been researched since the 1950s. These can easily be found by looking them up in the IPCC reports. Mass balance is only one of these lines of evidence, but should be sufficient for someone that understand bank balances or flows into and out of a bathtub through the taps and drain etc.
El Nino’s drive a large step change in CO2 with about an 8 month delay. That can overlap years and without a careful monthly time series analysis, simple annual averages won’t pick up total rate of change. This effect of ENSO on CO2 is often ignored while the change on temperature is aptly noted as an increase in temp.
Nobody is ignoring enso. I have cited a recent summary paper on the topic several times on this thread.
Btw the mass balance analysis can be performed on any timescale you like. It is convenient to use annual data, but you don’t have to.
I don’t disagree with your implication that fossil fuels are but a part of the potential problem. But, there is not ‘enlightened’ crusade to reduce all the other anthropogenic contributions, which may be substantial. See my first contribution to WUWT:
https://wattsupwiththat.com/2015/05/05/anthropogenic-global-warming-and-its-causes/
Clyde, June 11, 2021 8:10 am :
”I think that it should be up to those advocating the value of a mass balance model, to demonstrate how it trumps the obvious CO2 sensitivity to temperature, and lack of measurable evidence that it is fossil fuels driving the increase.”
The mass balance principle is applicable in every chemical process industry, refinery, waste water treatment plays and as well in the atmospheric chemistry application as long there is no nuclear bomb included in the processes.
The atmospheric CO₂ mass is always conserved and it tells us that there is an atmospheric accumulation when the mass flow in to the atmosphere is different from the mass flow out from the atmosphere.
As Dikran Marsupial and others have argued, the atmospheric CO₂ mass balance can be expressed as :
Inlets + Produced = Outlets + Accumulated (1)
In which
“Inlets” = all natural (oceans and land) + all anthropogenic emitted flows to the atmosphere = En + Ea
“Produced” ~ 0 (CH4 and CO close to zero)
“Outlets” = all natural (+ all anthro ~ 0) uptake flows from the atmosphere = Un
“Accumulated” = Atmospheric mass change per unit time, dC/dt = C’
We know from measurements :
* C’ from Mauna Loa and other CO2 analyzing stations.
* Ea from the corresponding combusted mass of fossil fuels and land use.
From (1) then :
En + Ea + 0 = Un + C’
==>
Ea – C’ = Un – En
Since the left hand part of the equation is measured and positive then also net natural flows, Un – En, are also positive, from the atmosphere to the nature.
From the fossil fuel reserves the atmosphere have been enriched (measured) by 365 +-30 Pg carbon (C) and by 30 +-45 Pg C from vegetation change since the start of the industrial era.
In all (Ea=) 395 +-75 Pg C have been added to the atmosphere since the start of the industrial era.
Since just (C’=) 240 +-10 Pg have been accumulated (measured) in the atmosphere then (Ea-C’=Un-En=) 395 – 240 = 155 Pg C have to be elsewhere in the existing carbon cycle. That figure is found in the oceans as per IPCC.
The average annual carbon flow between 2000 and 2009, also as per IPCC, from fossil fuels and cement production is 7.8 +-0.6 Pg C/year and from net land use change is 1.1 +-0.8 Pg C/year in to the atmosphere.
In all (Ea=) 8.9 +-1.4 Pg C/year have been flowing in to the atmosphere between 2000 and 2009.
Since just (C’=) 4 Pg C/year have been accumulated in the atmosphere then (Ea-C’=Un-En=) 8.9 – 4 = 4.9 Pg C/year have been flowing to the nature.
The natural flows are very big and fluctuating and also the cause of the fluctuating atmospheric concentration as shown in the graph by Ferdinand Engelbeen, June 12, 2021 3:13 am, #comment-3267587 . In that graph we notice that since the end of the 1950’s, every year there have been a net transfer of CO₂ from the atmosphere to the nature despite the very fluctuating natural net flow.
http://www.ipcc.ch/site/assets/uploads/2018/02/WG1AR5_Chapter06_FINAL.pdf
Kind regards
Anders Rasmusson
“…. water treatment plays….. “ to be replaced by
“…. water treatment plants ….. “.
/ Anders Rasmusson
Anders
Thank you for the detailed explanation. However, I have to note that sometimes you show uncertainties, but most of the time you don’t.
As an example, you wrote “Since just (C’=) 240 +-10 Pg have been accumulated (measured) in the atmosphere then (Ea-C’=Un-En=) 395 – 240 = 155 Pg C have to be elsewhere in the existing carbon cycle.” That nominal 155 should be rounded to 160 Pg and the uncertainty should be at least +/- 10 Pg (none provided for the “395”). That is, the uncertainty in Ea-C’ is approximately equal to the annual Ea alone.
Contrary to what DMarsupial and Engelbeen have been claiming, I believe that a rigorous analysis of mass balance requires an estimate of uncertainty for the measured variables, and that they be used in the ‘simple accounting.’
If you want the uncertainties look them up in the carbon budget paper that I have cited a couple of times already. The uncertainties are much too small to change the conclusion of the analysis.
Here are the uncertainties from the 2020 carbon budget paper (https://essd.copernicus.org/articles/12/3269/2020/):
Ea = 9.4 ± 0.5 GtC yr−1 (fossil fuels & cement) + 1.6 ± 0.7 GtC yr−1 (land use change)
dC = 5.1 ± 0.02 GtC yr−1
As I said, much too small to make a difference to the conclusions.
Do you now accept the mass balance analysis?
Nope, looks like Clyde is running away from the discussion.
https://wattsupwiththat.com/2021/06/13/betrayers-of-the-truth/#comment-3268805
plus ca change…
Clyde, “…. That is, the uncertainty in Ea-C’ is approximately equal to the annual Ea alone.
Contrary to what DMarsupial and Engelbeen …..”
Clyde, in my comment above I first picked figures from the reservoirs in IPPC’s figure 6.1, http://www.ipcc.ch/site/assets/uploads/2018/02/WG1AR5_Chapter06_FINAL.pdf in which we find “….. Red numbers in the reservoirs denote cumulative changes of anthropogenic carbon over the Industrial Period 1750–2011 (column 2 in Table 6.1)…… ”
Those figures should not be mixed with the annual figures which is in the second part in my comment above, “… The average annual carbon flow between 2000 and 2009 …”.
Then of course there are more up to date figures as per Dikran Marsupial, https://wattsupwiththat.com/2021/06/11/contribution-of-anthropogenic-co2-emissions-to-changes-in-atmospheric-concentrations/#comment-3268033 .
Kind regards
Anders Rasmusson
Worth pointing out that the uncertainty on the increase of atmospheric co2 since 1750 will be very large because we weren’t measuring co2 at Maura loa in 1750. The measurement uncertainty for the Mauna Loa record is tiny. I can see why Clyde focussed on that large uncertainty, rather than that of modern measurements ;o)
The measurement uncertainty from Mauna Loa is the lab uncertainty. The Mauna Loa data is averaged in several different ways, depending on whether you are looking at weekly data, monthly data, yearly data, data from the associated sites in Alaska, Antarctica, etc., multiple samples per day, missing samples, outlying data, or simply the one site at Mauna Loa. Each averaging, normalization and estimate compresses variance (reduces degrees of freedom) which lowers the hurdle to reach 95% statistical confidence.
The Mauna Loa data are carefully and impressively calibrated, but the results are lab data representing the accuracy, precision, variance, etc., of the instrumentation, lab methods and diligence. But Mauna Loa data is not representative of the variance of CO2 in the environment. Mauna Loa data represents the net difference between two gigatonne fluxes – each flux is more than 10 times larger than the estimated ~5 to 8 gigatonne annual human CO2 emission. These two fluxes flow in opposite directions (absorbed or emitted) through the surface of ocean water, about 98% of the hydrosphere. The Mauna Loa trend line represents two large variances offset against each other, which in much climate literature results in the very large empirical variance being ignored and over-confidence in the data.
For example, in forests and open fields diurnal CO2 concentration. can vary between 266 ppm and 1,430 ppm.The average variance is from 280 ppm to 980 ppm 2 meter above the soil. (Szaran et al., 2005). Diurnal CO2 variation in apple orchard were varying about 300 ppm. https://www.sciencedirect.com/science/article/abs/pii/0098847294900213 CO2 concentrations beneath snowpack and ice range from 600 to 1800 ppm. These concentrations can fluctuate by as much as 200 ppm within a period of just 4 days (Massman and Frank, 2006). Within caves, CO2 levels can reach as high as 30,000 ppm. Even in the open air <1 meter from the entrance to a cave, CO2 levels can reach 11,500 ppm (Cowan et al., 2013). CO2 levels vary by 10s of 1000s of ppm from one cave to the next in the same geographical region. Is Mauna Loa Really The Best Location To Measure ‘Global’ CO2 Levels? By Kenneth Richard 19 October 2020.
My comments here are not criticism of the work at the Mauna Loa lab. Rather it is to caution users of those data about overconfidence with interpretations of these CO2 data with regard to the natural environment. A lot of noise has been removed from these data.
This strawman never dies. Nobody (sane) claims that nature (without humans) is net source of CO2. The claim is that some (significant) part of the increase since 1960 is not caused by humans. These two are not related. It means that some part (even all of it is possible) of the increase since 1960 would have happenned without human emissions too. Even consensus agrees with this, but claims that over 95% is caused by human emissions, the rest by warming.
I don’t think that’s a strawman. Contrarians including Salby, Berry, and Harde say or at least strongly imply that the bulk of the mass increase in the atmosphere was sourced by nature. Since 1960 the atmosphere, hydrosphere, biosphere took on about 450 GtC. During that same period humans emitted about 450 GtC. If the claim is that these reservoirs would have increased in mass by 450 GtC (or some percent) without humans then you need to find 450 GtC (or some percent) from another reservoir(s) that replaces the mass that humans provided. You also need to figure out where the 450 GtC (or some percent) of human emission went if not into air, land, and vegetation.
Not sourced, caused! Even consensus agrees that human emissions caused the hydrosphere and biosphere to become net sink and that without the human emissions they would be net neutral (constant atmospheric CO2) or a small source caused by the warming. Both 0 and 100% caused by humans is possible with the mass balance. Mass balance is irrelevant for the causation.
Humans are the cause of an additional 450 GtC in the carbon cycle. Nature did not tap the fossil reservoir nor did it alter the land by planting crops, clearing trees, etc. If you remove humans you remove 450 GtC of mass. Mass balance is not only relevant, but the very first thing that should be checked before all others.
Edim, that is impossible:
Humans add about 9 PgC/year.
The increase in the atmosphere is about 4.5 PgC/year
That means that 4.5 PgC/year is absorbed by nature.
Besides a small increase due to warmer oceans (16 ppmv/K) all the increase is from the human emissions, as nature is a net sink, already 62 years of exact measurements…
Mass balance is the main proof of human causation of the increase…
Here is my take. The earth has experienced periods with much, much CO2 than now. Humans didn’t cause that. The concentration has also gone down to levels near extinction possibility. Humans didn’t cause that either.
What did cause the sinks to absorb that massive amount of CO2? You’ll have to show that similar changes aren’t happening to the sinks before you can show that humans are currently the reason for changes.
Jim, you can’t compare CO2 levels of 60-120 million years ago with CO2 levels today. Much of that CO2 is buried in thick carbonate layers like the white cliffs of Dover.
But over the past few million years, there was a direct connection between temperature and CO2 levels: CO2 levels followed temperature changes with some (long) delay.
Since 1850, that ratio is broken by the rapid release of CO2 from fossil fuel burning. increasing CO2 far beyond what is expected from temperature changes.
The absorption in oceans and vegetation is directly proportional to the extra CO2 in the atmosphere. That is a natural reaction on the extra CO2 pressure, whatever the source of that CO2.
That is not fast enough to remove all CO2 added by humans in each year, thus part is remaining in the atmosphere.
Jim, keep in mind that high CO2 concentrations in the distant past barely offset the lower solar luminosity. Like all main sequence stars the Sun brightens as it ages. The general rule is about 1% every 120 million years (see Gough 1981). 600 MYA the solar forcing was -12 W/m^2. All other things being equal CO2 would have had to have been 4000 ppm just to offset the reduced solar radiation.
There was an article on WUWT last week that showed a mass balance of carbon to the atmosphere from various sources (including burning of fossil fuels) and removed by various sinks, in petagrams (or gigatonnes, which are equal) per year. That balance showed fossil fuels as contributing about 7.7 Pg/yr, but cellular respiration contributing 93 Pg/yr and photosynthesis removing 95 Pg/yr, both of which are much larger than contribution from burning fossil fuels.
The net effect on the atmosphere of total sources and sinks of CO2 can be estimated as follows (the scientific notation E+n means “times 10 raised to the n power”):
If we consider the earth to be a sphere with a radius of 6,360 km (6.36E+6 m), its area is 4*pi*[6.36E+6)^2 = 5.08E+14 m2. Assuming an average sea-level pressure of 1.01E5 N/m2 (equal to the weight of the atmosphere above it), the mass of the atmosphere above 1 m2 of surface is the pressure divided by the acceleration of gravity, or (1.01E5 N/m2) / (9.807 m/s2) = 1.03E+4 kg/m2. Multiplying this by the surface area of the earth results in a total mass of the atmosphere of 5.23E+18 kg.
Dry air (without any water vapor) has a molecular weight of 28.967 kg/kmol, but since water vapor has a molecular weight of only 18.02 kg/kmol, its presence in the atmosphere would probably reduce the average molecular weight to about 28.9 kg/kmol. Dividing the mass of the atmosphere by the molecular weight results in 5.23E+18 / 28.9 = 1.81E+17 kmol of total gases in the atmosphere.
In order to increase the CO2 concentration by 1 ppm (by volume or moles), the total net increase in moles of CO2 would be 1.81E+17 * 1.00E-6 = 1.81E+11 kmol. Since CO2 has a molecular weight of 44.01, this corresponds to a mass of 1.81E+11 * 44.01 = 7.97E+12 kg of CO2, or 7.97 gigatonnes (or petagrams) of CO2.
Sometimes, writers of articles express emissions in mass of “carbon” instead of mass of carbon dioxide. Since burning 12.01 kg of “carbon” (in organic matter) generates 44.01 kg of CO2, the amount of “carbon” burned to raise the CO2 concentration in the air by 1 ppm would be 7.97 * 12.01 / 44.01 = 2.175 gigatonnes (or petagrams) of “carbon”.
I was the author of the article to which you refer.
Informative article. I note that NOAA still haven’t discovered that living trees emit methane too.
Along with a lot of other volatile organic hydrocarbons!
Hence the great smoky mountains.
So have you been able to identify a specific flaw in the mass balance analysis that I presented in the previous thread that demonstrates that the natural environment is a net sink of carbon from the atmosphere and is actively opposing the rise rather than causing it?
I did challenge you to point out an error half a dozen times, but you sedulously ignored them.
Yes, the White Cliffs of Dover are clear evidence that, long term, CO2 is being removed. Also, the present day precipitation of calcite in the warm Bahamian waters demonstrates natural sequestration.
However, at issue is the intermediate term behavior. See my remarks to M Courtney above.
You still have not identified a specific flaw in the mass balance analysis, this is just bluster to avoid admitting that.
“CO2 is being removed.” Yes, that is Un, nobody questions that natural sinks exist. The question is whether Un is bigger than En (natural emissions) or less. If it is bigger, and that is what the data shows, then we know that the natural environment is OPPOSING the rise not causing it.
“See my remarks to M Courtney above.”
I’ve already refuted them point-by-point here:
https://wattsupwiththat.com/2021/06/11/contribution-of-anthropogenic-co2-emissions-to-changes-in-atmospheric-concentrations/#comment-3266977
There is no flaw in the mass balance analysis – you’re attacking a straw man. The nature (minus humans) is a net sink and is a cause of some of the increase. Consensus says ~3% (I think), some skeptics (including me) much more.
The biosphere and hydrosphere are indeed net sinks. That means they are taking mass from other reservoirs; not giving it away. The law of conservation of mass says that a set of reservoirs cannot be both a net sink and a net source at the same time. If the biosphere and hydrosphere truly are net sinks as most agree then they cannot possibly the original source and thus cause of the increase in mass in the atmosphere. BTW consensus says that nearly 100% of the mass increase in the atmosphere from 280 ppm to 415 ppm is the result of humans.
The biosphere and hydrosphere are a net sink, not a net source. I agree, Salby agrees. They can still cause some part of the increase in atmospheric CO2, as you also agree. You say NEARLY 100% is the result of humans. The rest, however small is non-anthropogenic. I think at least ~50% is non-anthropogenic.
Again mass balance is irrelevant for causation.
Edim, the only source of extra natural CO2 in the atmosphere can be from a warming ocean surface. That is good for about 13 ppmv since the LIA (16 ppmv/K). All the rest is from the 115+ ppmv increase is from the 200+ ppmv human emissions.
The contribution of a net sink is below zero it doesn’t add one gram of CO2 to the atmosphere in the balance…
No. The warming tundra can and does supply CO2 that has been sequestered for 10s of thousands of years. If the planet is greening, which NASA says it is, then the new vegetation can supply CO2 during the ramp-up phase that was previously not partaking in the biogenic decomposition. I suspect that your “(16 ppmv/K)” is a lower bound, because 1,000-year old ocean bottom water is very cold and under tremendous pressure. Hence, when it upwells, more than the typical surface release take place with a release of pressure and changing from near-freezing to ambient surface temperatures. Thus, changes in upwelling may swamp changes in a simple small increase in temperature.
If the warming is caused by humans then the extra carbon released by the warming tundra is anthropogenic; not natural. To be able to categorize the tundra release as natural you need to eliminate anthropogenic causation for the warming.
I’m working on it!
‘new vegetation can supply CO2 during the ramp-up phase that was previously not partaking in the biogenic decomposition.’
That co2 would be from plant growth from the previous ramp-down, so it cancels out and doesn’t cause a long term rise. Plants can’t die back unless they grow first.
The amount of new vegetation is increasing annually.
“The amount of new vegetation is increasing annually.”
tell me, what is the new vegetation primarily composed of?
Clyde, both the oxygen balance and satellites show that the earth is greening, that means taking out more CO2 out of the atmosphere than it releases.
Of course, more biomass also means a larger carbon cycle from that source, but the net effect is first growth (thus CO2 uptake) second more decay, which is less than the growth…
This was a continuation of the previous thread where Clyde refused to address the mass balance argument but just said the subsequent article (I.e. this one) would cast doubt on it (or words to that effect). Hence I restarted the discussion here. The mass balance analysis refutes this article as well, and Clyde still can’t identify a specific flaw in the argument. So it is not a straw man.
The frustration here is that the same nonsensical arguments about the atmospheric increase in CO2 being caused in large part by natural emissions rather than fossil fuel emissions have been made endlessly for at least 10 years at WUWT (and elsewhere), always advanced by people who do not completely understand the implications of and the need for a material balance analysis. You can lead a horse to water but you can’t make him drink.
Anthony could make a step-change improvement in the technical quality of his site by permanently banning posts based on two crazy conjectures: 1) Emissions of CO2 don’t cause an increase in atmospheric CO2, and 2) increasing concentration of CO2 can’t possible cause any warming.
There was a time when I was naive enough to think that writing a journal paper setting out a few basics, in response to Essenhigh’s paper, would help to stop the promulgation of these canards. A decade later and the same mistakes are still being made just as frequently. It wasn’t even a new argument then – Chauncey Starr wrote a paper about this which resulted in the first to IPCC reports specifically warning against this confusion.
It does neither “side” of the argument any good, it just wastes time (perhaps for some a feature rather than a bug ;o). Better to discuss something more interesting like ecs.
There are indeed multiple interesting subjects to discuss, with ECS being just one of them. I would add: the apparent discrepancy between the multi-model model mean and observed warming, why obviously wrong models are not discarded (or drastically altered when they are obviously wrong), Ben Santer’s furious (and I think quite ridiculous) arm-waves about the discrepancy between modeled and measured upper troposphere warming, and the absolutely wild discrepancies between observed and projected sea level increases. These are the kinds of subjects that actually matter; nonsense claims about where the increase in atmospheric CO2 is coming from most certainly do not matter.
If nothing else the “multi-model mean discrepancy” led to some good research about fair model-observation comparison and the biases that need to be addressed. There was a lot of nonsense as well, particularly the Douglass et al paper on Tropical trends, which used a statistical test that would be almost guaranteed to fail a perfect model ensemble. As a statistician (of sorts) the issue of pruning ensembles is an interesting one, but needs approaching with some care.
Could do with abandoning “no warming since X” as well, at least until the statistical power of the test reaches a sensible value (6 years and N months is ridiculous). Even then it doesn’t consider multiple hypothesis testing issues (or post-hoc choice of start date).
I suspect there will be another article on this topic as Clyde is apparently running away from the mass balance discussion on this thread
https://wattsupwiththat.com/2021/06/13/betrayers-of-the-truth/#comment-3268805
I suspect if he ever does answer it will likely be a new article at a later date in the hope I won’t notice (which is highly likely). I’ll have to leave it to Ferdinand and Nick – kudos to both of them for their efforts.
Suggesting that I’m intimidated by you shows that you have an inflated opinion of yourself.
Your remarks say far more about you than you probably realize. Why else would you say,
unless you didn’t realize what it reveals?
Apparently you don’t think highly of the Socratic Method in teaching. Did you graduate from a school using the Confucian approach to education?
Be careful you don’t drop the third tablet. You will only have ten commandments left.
and yet you still haven’t identified a specific flaw in what is a very simple argument…
I have also provided the uncertainties you wanted, from a reputable source (the 2020 carbon budget paper) and you have not responded to them.
I actually do like the socratic methods for resolving disputes, but not for teaching. That is why I ask questions and give direct answer to questions. On the other hand you have avoided most of my questions, e.g. can you identify a specific error in the mass balance analysis.
BTW if you don’t post the response here, I won’t see it. I have made this counter argument now on two blog posts, it is unreasonable to expect me to wait for a third.
There is a NASA paper on the internet entitled “Satellite Detects Human Contribution To Atmospheric CO2” which describes a Finnish study that used OCO-2 data to map the location of human induced CO2. The paper’s map of the US shows that almost all of the induced CO2 is in the Eastern half of the US. This mapping correlates almost exactly with the World Atlas climate map of the US which shows the divide between the moist and rainy Eastern US and the semi-arrid and desert Western US. The mapping also shows little or no human induced CO2 at the locations of all of the large cities in the West and most of them in the East. There is significant correlation between the CO2 level and the locations of intensive mixed needle leaf and broad leaf vegetation in the East.
The text of the paper directly contradicts your assessment
“One would naively expect that, if anthropogenic CO2 were important in the growth of the atmospheric concentration, double-digit percentage drops in the three last months of the annual 8-month ramp-up would at least be suggested in the height of the peak (range) or the slope of the curve.”
Yes, that would indeed be naive. There is considerable inter-annual variation in natural sources and sinks that is very much larger than the inter-annual variation in anthropogenic emissions, so the signal to noise ratio of such an analysis would be very low.
Exactly. The pandemic induced reduction of emissions is the signal we’re looking for. That signal is on the order of a few tenths of a ppm of CO2. But the variability of the CO2 increase in the atmosphere is on the order of a couple ppm. Trivial signal processing techniques are inadequate to detect such a small signal. We really needed the pandemic induced reductions to be larger for longer so that the SNR is high enough to detect with confidence. There is a slim chance that more advanced signal processing techniques could be employed that would detect this signal as-is, but I’ve not seen any attempts yet.
I’d rather the pandemic concluded as soon as possible!
We know by multiple lines of reasoning that the rise in atmospheric CO2 is not a natural phenomenon. It is a bit sad that skeptic blogs continue to trot out minor variations in the same incorrect arguments without reference to the previous rebuttals (in this case it is Salby and Humlum et al.). If skeptics wanted to marginalise themselves from sensible scientific debates, they could do no better than this sort of hubris.
Actually, what is sad, is that it doesn’t matter where the increase in CO2 comes from.
As long as the studies, that show that CO2 was once over 4000ppm and the world didn’t burn up, are correct then 400ppm won’t cause a problem.
As long as the studies of the ice cores that show CO2 going up while temperatures are going down during several inter-glacials are correct, CO2 does not control temperature.
Since CO2 does not control temperature, but does control plant life, we need more of it by any means necessary.
By the way, Mother Earth has been trying to shake off all plant and animal life for millions of years. It keeps sequestering Carbon at the bottom of the ocean where plants and animals can’t reuse it. That is why CO2 is no longer at 4000ppm.
The rate at which carbon is sequestered in the lithosphere is fairly similar to the rate at which it is released by volcanic activity – very slow.
The pandemic response was as large as it could ever be.
No Government is going to lockdown harder and for longer than that.
Therefore we know that mitigation is unworkable. Policy question resolved.
The rest is purely of academic interest.
It also raises another issue. If a one-time 10-20% decrease in emissions cannot be measured, then we have to accept on faith that continuing the activity will actually save the world. Hail Mary!
On the flip side of that, if temperature drives co2, why did co2 continue rising during the so-called hiatus?
Monckton has recently pointed out that we are apparently in a 6+ year hiatus. My Fig. 4 suggests that the CO2 residual is similarly showing a hiatus.
Looks like a linear increase with noise to me. Show me statistically significant evidence for a reduction in the rate of increase in atmospheric co2 over the last six years.
My Figure 4 shows an oscillation (related to weather?) but with no obvious trend. I’m not going to bother with the p-value because I can see from the slope and R2 values that is is certainly not statistically significant.
Because the drawdown phase has not changed in something like 60 years, and appears to be insensitive to temperature, I’ll speculate that the oscillations are determined by Winter weather, which is where most of the change impacting CO2 is seen over the last 60 years.
Bad statistics. If the confidence interval is wide, you can’t rule out substantial increases or substantial decreases.
A lack of significance for a trend does not mean the trend is zero, especially if the period is short and the noise high. In that case a lack of statistical significance just means you don’t have enough data to conclude anything.
Visual inspection rules out any obvious trend trend for the last 6 years. That’s not to say things might not change in the future. That does not mean we are totally ignorant about the behavior.
“Visual inspection rules out any obvious trend trend for the last 6 years.”
As I said, bad statistics, the human eye is extremely good at detecting patterns that are not actually there (especially if they support your argument – I.e. confirmation bias). That is why we have statistics to give a more objective assessment. Monckton’s “hiatus” is no where near long enough for there to be statistically significant evidence of a change in the underlying rate of warming, and neither is yours.
I wrote an introduction to the key statistical concept (statistical power) here:
https://skepticalscience.com/statisticalsignificance.html
If you look at the ice-core data, you will see that CO2 continues to go up for a while after temperatures start down.
Right, so temperature changes co2 immediately when looking at the seasonal cycle, but it takes centuries to act in the ice cores. That indicates a different mechanism, so what is your point?
Because the greening of the planet was not effected by the hiatus. We have to take another look at the possible role of vegetation in the production of CO2.
Amen! Humans are thriving with fossil fuels. Humans were not thriving during lockdowns. Lockdowns are depressing!
Exactly. Suppose the fanatics that target to zero CO2 emissions get say half way there in a decade or so (I doubt it !) Will the Keeling curve flatten? Will it decline? Or will it keep going up. Imaging the political problem if it just keeps going up, how to explain and justify such expensive energy and life style lock-downs? Or if CO2 goes down, but temperature keeps rising? Will they be faking the data as is usual?
It will keep going up, but at a much lower rate (and therefore reduce the amount of warming).
‘Will they be faking the data as is usual?’\
I see I should have read the whole comment before answering. The Berkeley Earth group were skeptical of the temperature datasets and set out to reanalyse the data for themselves. They ended up validating the existing datasets and all the data and materials are in the public domain. And even independent replication by skeptics isn’t enough to stop conspiracy theories about faking data… :roll_eyes:
The analysis rejecting the influence of the Urban Heat Island effect on the historical record was flawed!
“The analysis rejecting the influence of the Urban Heat Island effect on the historical record was flawed!”
No, in that case there is plenty of data, which means the statistical power of the test is obviously high. I wrote an article explaining statistical power here:
https://skepticalscience.com/statisticalsignificance.html
Anecdotally, when the Three Mile Island accident occurred, the operators correctly stated that the average radiation over a circle of a given radius did not exceed dangerous levels. What they didn’t say is that in a plume downwind from the reactor, the radiation levels were dangerous. Averages can hide a lot of sins of omission!
Mosher looked at temperature differences around selected urban areas. What he should have done is compared temperatures upwind to those downwind of the city. Studies done by NASA have demonstrated that temperatures, aerosols, and precipitation can be, and often are, impacted for tens of miles downwind of major urban areas, such as Atlanta (GA). That is, rural area meteorological conditions are contaminated by urban areas upwind.
Fine write a better paper and submit it to a journal. Let me know how it turns out.
The politicians and academics advancing the alarmist position will all be retired and receiving comfortable retirement payments before it becomes obvious it was a fool’s errand.
I think it is more the other way round. Almost all of the climate skeptic scientists are late career or “emeritus” already.
Yes, we probably won’t have the luxury of saying, “I told you so!”
Yawn.
“The pandemic response was as large as it could ever be.”
It was never intended as a CO2 mitigation strategy, so it is not surprising that it did not have that effect.
It did not have that effect because:
1. It was not global. In fact it applied to fairly small regions of the world. It was not even uniform in the USA. China was little affected.
2. More importantly, it was not sustained. Whatever we hope to achieve with emissions reductions would be applied indefinitely, not for a few weeks or months.
A much lower level of reduction applied systematically would be far more effective.
But, those who have looked into it in detail have publicly stated that the annual average decline of anthropogenic CO2 was at least 7% with a maximum global decline of 18+% in April.
Now that’s funny. No effect because it was not intended as a mitigation strategy?
Do you have an explanation for the obvious temperature sensitivity of atmospheric CO2? Can you explain why that can’t be responsible for the CO2 increase when the Earth is shown to be warming?
Yes, as I have pointed out this correlation has been known about since the work of bacastow in the mid 1970s. Do your homework and find out what mainstream science says before trying to overturn it. The link to my discussion of Salby’s work contains a brief explanation (Enso affects the growth of tropical plants, largely by changes in precipitation, which happen to be correlated with temperature. This is partially offset by the very small temperature sensitivity of the oceans which is in the other direction). ISTR Richard Betts had an excellent summary paper on this recently. Try looking for that.
These changes in vegetation are cyclical, so there is no long term trend. Plants can only decay if they grew in the first place, which is why it doesn’t contribute to the long term increase.
A warming Earth increases the effectiveness of bacteria and fungi in their decomposition of detritus. For tens of thousands of years, the permafrost in the Arctic has prevented the decomposition of organic material. It is now suffering the fate of things in the mid-latitudes. In all of this, one has to consider the time-scale of sequestration.
You seem to be ignoring the contents of Betts paper again, which explains why interannual co2 changes are correlated with enso. I prefer Betts scientific research rather than your data free speculation.
Editor(s): note obvious typo in article title . . . Co2 should be CO2.
If you really want pick nits, the 2 is a subscript.
And to be really picky, Co is the chemical abbreviation for “cobalt” . . . I didn’t feel I needed to go there.
Please go about your task of correcting everyone that does not resort to using subscripts when they express chemical molecules in their posts.
True. Most keyboards don’t feature a subscript. Here are a few for you and others: ²²²²²²²²²²²²²²²²²²²²²²²²²²²²²²²²²²²²²²²²²²²²²²²²²²²²²²²²²²²²²²²²²²²²²²²²²²²²²²²²²²²²²²²²²²²²²²²²²²²²²²²²²²²²²²²²²²²²²²²²².
It is correct in the document I submitted. Something got changed. I’ve noticed that a number of other formatting changes happen such as font size and style. I do make mistakes, but in this case it appears to be an issue of ‘translation.’
(I can fix the problems, but I normally wait for the author to request it and specify the problems first) SUNMOD
A software layer somewhere is being “helpful.”
And like the previous thread are perhaps worth fixing, but not a big deal because common sense is enough to work out the intended meaning.
Charles has corrected it at my request.
“While several sources estimate that the decline in anthropogenic CO2 emissions averaged about 7% to 10% for all of 2020, Carbon Brief has an interactive map that shows the global reduction reached over 18% in mid-April 2020; it was down to about 10% in March and May. “
Like most of these speculations, you leave out at this stage the vital calculation – how much deficit does that amount to? At a normal rise of 2ppmv/year, that would be 0.14 to 0.2 ppmv for a whole year. The peak month April would be a deficit of 0.03 ppmv. Do you really think you can detect by eye such changes in a graph like Fig 1?
And then when you go to higher resolution as in Fig 3, the competing noise becomes more evident. As you say, “The El Niño event stands out”. CO2 rises in a warm year. But 2020 was also a very warm year. It was very close to being the warmest year ever. It too would normally have had a bump like 2016 in Fig 3. But it didn’t. That could easily be the effect of the reduced emission.
Just to convert those numbers to pixels. Fig 1 has 18 pixels/ppmv. A change of 0.14 ppmv would be 2.5 pixels. The width of your black line is 2 pixels. You are looking for a total change for a year amounting to a line thickness. For the month of April, the change would be half a pixel.
Exactly Nick. I did a rough analysis a few months back and concluded that the pandemic induced reductions would have needed to be closer to 50% for a couple of years for null hypothesis testing to yield a p-value < 0.05. I admit that I was using a very trivial and simple null hypothesis test so it’s possible someone with more skill with signal processing using far more advanced techniques than I could work up a more a conclusive analysis.
The concentrations reported by MLO have two-significant figures to the right of the decimal point. The declines are not present in the raw data. I compressed the vertical scale to minimize space used by the graphs. When the changes have a sign opposite to that expected, the precision is of less concern.
The correct calculation should be 18% of 1.2 PPMv per month, or 0.22 PPMv.
Clyde,
“The declines are not present in the raw data.”
How can you tell? You don’t know what the result would have been without lockdown. The graph is useful because it shows both trend and noise. Just looking at raw data, you have no way of knowing.
“The correct calculation should be 18% of 1.2 PPMv per month, or 0.22 PPMv.”
No, the normal rise due to emissions is about 2 ppmv/year, or 0.167 ppmv/month. And you are looking for 18% of that (so 0.03 ppmv).
I see from below what the fallacy is here. We emit enough CO2 to cause the ppmv to rise about 2 ppmv/year. There is no great seasonality about that. The amount that we would normally have emitted in April is enough to raise ppmv by 0.167. And the deficit is 18% of that number.
The observed ppmv (ML) has a marked seasonality. But no-one thinks that is because of seasonality in emissions. It is because of cyclicity in SST and photosynthesis. These changes go on regardless of perturbations in our emissions.
If you really think the change due to emission shortfall should be computed as a % of the seasonal rise in observed ppmv in April, what are you going to say in October, when there is a seasonal fall. An emissions reduction causes a rise in ppmv?
I get the feeling that you either didn’t read my article carefully, or you are in your usual MO of looking for little things to offer up as sacrificial straw-men.
Clyde, I get the the feeling that when you are confronted with inconvenient facts, you start complaining about the tone.
Maybe the complaint is warranted. Stokes has a reputation that precedes him, and he and I have a long history of disagreeing.
In science if someone disagrees with you, they are your true friend rather than those that uncritically praise your work. The way to avoid getting things wrong is to listen to criticism and take it seriously, rather than evade it.
I have now provided the uncertainties on Ea and dC, demonstrating that they are far too small to affect the conclusions of the analysis. Do you now accept the mass balance analysis does establish that the natural environment is a net sink? If not, what is the specific flaw in the argument?
Clyde, Mauna Loa reports two insignificant figures after the decimal point, which is the result of averaging the measured 10 second snapshots over 2 times 20 minutes from two different inlets plus several calibrations over one hour.
That are simply the averages of the raw calculations, not the detection limit of the NDIR method which is not better than 0.2 ppmv.
It is rather confusing, but it is what NOAA publishes.
https://gml.noaa.gov/ccgg/about/co2_measurements.html
There is an error in that report: the two intakes are used over 20 minutes each, not 5 minutes, that is the time to flush the lines with the new gas intake.
Further as Nick Stokes said, the change expected from human emissions and the Covid pandemic is 0.03 ppmv/month. Impossible to detect with the NDIR method.
“But 2020 was also a very warm year. It was very close to being the warmest year ever.”
Nick, how far back into Earth history does “ever” go?
The point is that it was as warm as 2016. And 2016 showed a rise in CO2 ppm because of the warmth. The fact that 2020 did not show such a rise may well be partly due to the lower emissions.
Nick, I get your point but you did not answer my question or address my point. How far back in Earth history does “ever” go?
You are speculating, and ignoring Fig. 6.
Superb work Clyde. To me, the lack of palpable simplistic indicators of Covid CO2 changes shows that, like all aspects of our climate and atmospheric variations, it is far more complex than the pointed hat understandings of it all that we are fed daily by “The Science”. My thought upon learning that the evidence of lockdown didn’t show in the data was that maybe the reduction in partial pressure was almost matched by a small increase in outgassing. I visualized that if so, we would have to decarbonize the increased outgassing at a cost of another 90 trillion to meet the Paris accord. Your appeal to temperature change as an important factor has merit.
Thank you, Gary.
You are making the same error as Salby, assuming that the things that affect the seasonal variation in the growth rate also affect the mean value of the growth rate. Unfortunately the wiggles contribute nothing to the long term trend in atmospheric CO2, which depends on the average value of the growth rate.
Hint: The increase is the integral of the growth rate. Integrate a sine wave you get zero. If it is a sine wave sitting on an offset, it is the integral of that offset.
The inter-annual variation is not caused by the same thing as the the mean value of the growth rate. This correlation was first observed back in the 1970s by Bacastow, and there has been a lot of work on this since then, which perhaps you ought to read before trying to overturn the science of the carbon cycle in a blog post. At least take the time to read the rebuttals of the previous papers making these arguments.
https://skepticalscience.com/salby_correlation_conundrum.html
In your mind you believe ‘Skeptical Science’/CAGW could not be incorrect. Observations have disproved CAGW.
Unfortunately we are still spending ourselves to death installing wind and sun gathering. That plan will not work.
You and ‘Skeptical’ Science are ignoring the recent (breakthrough which disproves CAGW) that it has been found that the atomic bomb produced C14 has been found at the bottom of the ocean which is a hard observation that disproves the CAGW Bern equation.
You are arguing rather than looking at the observational paradoxes. See my other comment in this thread for links to more papers.
CAGW is based on /requires the Bern equation assumptions of CO2 sources and sinks be true.
If the CAGW Bern equation assumptions are incorrect, humans did not cause the majority of the recent increase in atmospheric CO2.
If that was true then there would be a missing massive source of CO2 into the biosphere.
The missing source of CO2 and water into the biosphere is CH4 that is extruded from the liquid core of the earth as it crystallizes (see my other comment in this thread for more details and linked to papers that provide proof of concept) that is being pushed into the biosphere. This extrude CH4 is the force that moves the tectonic plates.
Logically if there is a massive missing source of CH4 that is being pushed into the biosphere there would also be a massive missing sink of CO2. The primordial CH4 that is being pushed in the biosphere which explains how the C13/C12 ratio has changed currently and in the deep paleo past.
This explains why when modern tectonic plate movement started the carbon record went negative as compared to current for repeatedly for millions of years. There are more than 12 different periods where the C13/C12 in the carbonate deposits goes negative.
which answers Geology’s paradox what causes tectonic plate movement and what caused the start of tectonic plate movement.
Conceptual analysis finds missing and incorrect concepts.
What moves the tectonic plates? Where does the hydrogen come from to produce the oceans that cover 70% of the surface of the earth? Water is being dragged into the mantel. What replaces the water that is lost? Water is also lost to space.
The must be a conceptual explanation as to why the C13/C12 ratio increases and decreases independently of anthropogenic emissions, in the atmosphere in advance of the occurrence of an El Nino.
See Tom Sources and sinks of CO2 Tom Quirk
http://icecap.us/images/uploads/EE20-1_Quirk_SS.pdf
“The yearly increases of atmospheric CO2 concentrations have been nearly two orders of magnitude greater than the change to seasonal variation which implies that the fossil fuel derived CO2 is almost totally absorbed locally in the year that it is emitted.
A time comparison of the SIO measurements of CO2 at Mauna Loa with the South Pole shows a lack of time delay for CO2 variations between the hemispheres that suggests a global or equatorial source of increasing CO2. The time comparison of 13C measurements suggest the Southern Hemisphere is the source.
This does not favour the fossil fuel emissions of the Northern Hemisphere being responsible for their observed increases. All three approaches suggest that the increase of CO2 in the atmosphere may not be from the CO2 derived from fossil fuels. The 13C data is the most striking result and the other two approaches simply support the conclusion of the first approach.”
The Bern equation assumes zero biological matter is sequestered (sinks to the bottom of the ocean where it is eaten by life that lives on the bottom of the ocean) in the deep ocean which is incorrect.
It was estimated 30 years ago that organic matter sinking to the bottom of the ocean sequesters roughly the amount of CO2 that is emitted by humans every year.
The Bern equation assumes the sequester time for CO2 is roughly 200 years for 75% of the emitted CO2 and infinite for the remaining 25%. These non-physical assumptions are required to enable human CO2 emission to affect atmospheric CO2.
This link explains in detail why the Bern equation is physically incorrect and includes papers published 30 years ago that disprove the Bern equation.
https://www.co2web.info/ESEF3VO2.pdf
“At this point one should note that the ocean is composed of more than its 75 m thick top layer and its deep, and that it indeed contains organics.
The residence time of suspended POC (particular organic carbon; carbon pool of about 1000 giga-tonnes; some 130% of the atmospheric carbon pool) in the deep sea is only 5-10 years.
This alone would consume all possible man-made CO2 from the total fossil fuel reservoir (some 7200 giga-tonnes) if burned during the next 300 years, because this covers 6 to 15 turnovers of the upper-ocean pool of POC, based on radiocarbon (carbon-14) studies (Toggweiler, 1990; Druffel & Williams, 1990; see also Jaworowski et al., 1992 a).”
An observation to support the assertion that the CAGW Bern equation is physically incorrect is the recent discovery…. …. that ocean life at the bottom of the ocean has absorbed the atomic bomb produced C14.
https://www.livescience.com/65466-bomb-carbon-deepest-ocean-trenches.html
‘Bomb Carbon’ from Cold War Nuclear Tests Found in the Ocean’s Deepest Trenches
Bottom feeders
Organic matter in the amphipods’ guts held carbon-14, but the carbon-14 levels in the amphipods’ bodies were much higher. Over time, a diet rich in carbon-14 likely flooded the amphipods’ tissues with bomb carbon, the scientists concluded.
Ocean circulation alone would take centuries to carry bomb carbon to the deep sea. But thanks to the ocean food chain, bomb carbon arrived at the seafloor far sooner than expected, lead study author Ning Wang, a geochemist at the Chinese Academy of Sciences in Guangzhou, said in a statement.
Yawn an ad-hominem. I wrote that article, which you would have seen if you had bothered to click on it and read it. I can bring myself to listen to arguments here. Are you not open minded enough to read arguments from a blog on the other “side” of the debate?
I wrote that article, which you would have seen if you had bothered to click on it and read it.
Did you use the name DikranMarsupial as the author? You are a piece of work!
Yes I did. Didn’t you look either?
What is the problem with posting under a pseudonym. If you look at the author page at SkS it says exactly who I am. I have said who I am on this blog before now.
This is just more ad-hominem, attacking the source (me) in place of an attack on the content of the argument I made on the SkS article.
My remark was made because I thought that you were referencing a peer reviewed article. No, I didn’t read it either. I don’t have the time to read everything that someone offers up. You apparently expect everyone to be familiar with your actual name. Then why not use it?
Rubbish you can tell from the url that it isn’t a peer reviewed article. You ought to read articles that show you are wrong if you have an ounce of self skepticism.
In science the source is irrelevant, the evidence and the argument are all that really matters. What relevance has my name to any of this?
Also what is wrong with publishing under a pseudonym in journals? Plenty of scientists have done so over the years without it being a problem? For instance William Sealy Gossett published under the name “Student” – Student’s T distribution is [pseudo-] named after him.
Could someone correct the title of this post? The formula of carbon dioxide is CO2 not “Co2”. This mistake always gets my goat, sorry.
Some people here will no doubt think this comment OT. It is not. It is just one example of many that can be pointed to that makes it clear that the climatnistas are full of crap.
This truck driver went to Canada this week and doing so I had to cross the Ambassador Bridge. Between Detroit and Windsor Canada runs the privately owned Ambassador Bridge. It is a piece of crap! It has been a piece of crap for a long time. This bridge, opened in 1929, should have been replaced or another bridge put in elsewhere decades ago! It handles more than 25% of the commercial vehicular traffic between Canada and the US. Far more than any other bridge between the two countries. It leads to the 401 which is the busiest interstate in Canada and I-75. The fact that it hasn’t been replaced or another bridge put in elsewhere over the Detroit river in the Detroit area is third world bullshit.
The next closest crossing for commercial traffic is up at the Blue Water Bridge running between Port Huron, MI and Sarnia, CA.
Not once in the more than a decade that I have been running to Canada back and forth over that bridge can I remember a time that bridge was not under repair with at least one lane closed. This week is was down to a narrow single lane of traffic running each way because they had places in the other two lanes torn down to the girders welding in new anchor bolts before putting in new road surfaces.
To get onto the bridge from I-75 one takes exit 47B and that exit only leads to the only way to the bridge. Once you take that exit there is no turning back, your going cross the bridge to Windsor, Canada. Right now I-75 there is under construction. There are three lanes with no shoulders where exit 47B is. Going up to Canada I sat in a line of trucks backed up on I-75 in the right lane there by reducing that major interstate going into the city of Detroit down to two lanes going through. Usually there are five lanes!
It took me 1 1/2 hours to get across and clear the Canadian side, almost all of it spent on the US side idling along in bumper to bumper traffic or stopped waiting,. And this is not unusual at all! We’re talking 100s of vehicles, the largest proportion of them diesel trucks, sitting idling waiting every day.
Coming back I had the hours to make it across the bridge but not the hours to make it home because of the delay at the bridge I knew I would face during the high traffic hours. So I stayed at the truck stop at Comber, CA about 26 miles from the bridge. I have to stop there because that is where I have our ACE department fax my clearance documents anyway and this time I just stayed and took my 10 hour break so I would be going over the bridge at 06:00 in the morning instead of 20:00 at night when traffic is heavy. It took me 40 minutes to come back.
It is a suspension bridge. When I get caught in bumper to bumper traffic on it and sit still as often happens you can feel it swaying and vibrating at times.
It is shameful that Detroit, the US government, and the Canadian government have failed to remedy this situation. No excuse!
If they were serious about pollution this would have changed long ago. That bridge was inadequate even in the 1960s it has gotten steadily worse and there is not a new structure being built even now!
Something about it being an international border. Nobody wants to pay for a new bridge. Same problem at the Peace Bridge, Buffalo to Ft. Erie.
That would be easy to fix. Tolls. The Ambassador bridge is a private toll bridge now. Any objection to a new toll bridge, would be BS.
“It is shameful that Detroit, the US government, and the Canadian government have failed to remedy this situation. No excuse!”
Send a note to the White House saying that all the steel which would have gone into finishing the Keystone XL pipeline should go into a new bridge between Detroit and Windsor. The US will pay for it because we screwed the Canadians with the pipeline permit decision.
Sure, all the steel will be Chinese steel. But hey, much if not most of the steel that goes into Biden’s Buggered Windmills and into every other new infrastructure project in America will be Chinese steel.
If a new bridge appears between Detroit and Windsor, you will be happy. Detroitians and Windsorians will be happy. Canada will be happy. China will be happy. Joe Biden will be happy because everyone else is happy. Especially so because China will be happy.
The other comments seemed to miss the point.
If THEY really cared about CLIMATE or CO2 THEY would spend the money on improving infrastructure, not subsidizing the construction of bird choppers, solar blight and the extensions to the electrical grid to connect to the unreliables. Other than the generators, blades and panels themselves, everything else (steel, concrete, aluminum) COULD be used to build the new bridges and roads.
If you want to “sequester” steel and concrete, better for roads and bridges that actually improve peoples lives by reducing TIME and FUEL COSTS for traveling from point A to point B.
Thank you.
Glad someone got that point but there is a second point I intended to be inferred. That is: Here we have two countries who claim they can lead us all to a carbon free Nirvana, and yet over several decades have been unable to build a bridge between then that has been very much needed. A bridge that would lesson pollution by speeding motor vehicle movement and improve commerce and private connections between two long time allies.
Why should anyone with a lick of common sense believe a word these governments say about wanting to decrease emissions of any kind when they can’t even get their act together on a relatively simple and inexpensive infrastructure improvement like that? And there are dozens of similar examples one can point to.
Yep. Also, how often do we wait for stop lights to cycle when nobody is around?
These miserable f*cks come on here supporting these stupid models that do nothing but try to stop humans from thriving.
Thank you Rah for doing the work that really makes a society possible.
Hey, my life is great. I have much to be thankful for.
Now this comment is OT.
Last night I went to my first races since COVID. I love to watch the Sprint and Midget car races and especially so on the dirt.
It is Indiana Midget Week. USAC runs a great program. They go from track to track in Indiana all week and it is a big deal for a driver to win the series. Last night was the 2nd to last race in the series. It was at the track at Gas City. It was a beautiful night for racing and the track was fast and my neighbor had gone in early and staked out great seats.
It was not a place for “Karens” or anyone suffering COVID Paranoia. Stands filled to over 80% capacity and not a mask in sight. A place where people take off their hats and bow their heads for the pre-race prayer. A place where everyone stands for the National Anthem. A place were people are friendly and considerate. My kind of people. My kind of place.
Because folks didn’t stop eating:
Thus, Farmers didn’t stop ploughing, tilling, cultivating, (haha) no-tilling, (nitrogen) fertilising, paddy fielding, rounding upping, and burning burning burning
There is/was only 73 days supply of (what passes for) food in stores, silos, farms etc around the world – how long was/is lockdown. Longer than that fo’sure
That is why the CO2 graph didn’t change
Plenty folks will tell that it will stop rising, inside 50 years.
Better start laying down some fat huh?
Clyde, several remarks…
Thus sorry, way too many assumptions made that are opposite to what observations show.
And as several asked, where is the mass balance for every phase?
Wait, what?
“The seasonal variation is opposite to the general trend: with higher temperatures, CO2 drops, while your expose tries to prove that the temperature increase drives CO2 in the atmosphere.
So if we emit less CO2, the planet cools and CO2 goes up?
We’re screwed.
Good joke…
You (as well as Stokes) have missed the point of the analysis approach I took. You are working with annual averages, which includes the drawdown phase. By focusing on the ramp-up, the sensitivity to short-term changes during that time interval is increased by about a factor of 4.
It is the simplistic annual average approach that I took exception to that lead me to look at the problem differently. I would have thought that you, of all people, would have appreciated that.
When I have the time to read your links, I may get back to you about them.
“By focusing on the ramp-up, the sensitivity to short-term changes during that time interval is increased by about a factor of 4.”
No, that is a fallacy. The emissions rise rate is not increased. It is 0.17 ppmv/month, all months. The slope of the total curve is higher in April, but that is because of the natural oscillation.
That is why you and others have gotten average values that are so low. You are using all 12 months, which includes the drawdown. During the ramp-up phase, the natural sinks are minimal, and that increases the sensitivity to changes in the emissions because the range for that 8-month period is greater.
“During the ramp-up phase, the natural sinks are minimal, and that increases the sensitivity to changes in the emissions because the range for that 8-month period is greater.”
No, that is absolute nonsense, and again shows the consequence of your indifference to mass balance. A pg of CO2 emitted at any time adds 0.272 ppmv to the atmosphere, some of which will go into the sea. That is just based on the mass of the atmosphere, which doesn’t change.
To see how it is nonsense, try applying the same arithmetic to the down phase, in October, say. The slope is negative. If you say that a 10% drop in emissions should be multiplied by that slope, the result will be an increase in ppmv in the air. Caused by a drop in emissions!
No, it is not nonsense. Analysis needs to be done at a time resolution no longer than a month. If you don’t do this, you can not analyze cause/effect adequately, either by value or by time frame. If the big change in ENSO occurs in one year and the following CO2 changes in the next year, averages simply don’t allow you to see what occurred when.
Everyone wants to use averages which hides so much of a time changing continuous wave it isn’t funny. Somebody above mentioned averaging a sine wave but then missed the real point. If you don’t detrend, that is remove the constant change, you simply can’t do an adequate analysis of cause/effect. Do a search on time series analysis. It’s a whole area that climate science totally ignores in favor of simple annual averages.
Jim, what Clyde has done is looking for the cause of the year by year variability. Which indeed is caused by temperature variation.
Everybody in the scientific world agrees with that.
It even is known that tropical vegetation is the main respondent.
He then is looking at the impact of the change in human emissions at the increase part of the seasonal CO2 change.
Of course that is impossible to measure, as for one month the change is far below the detection limit for CO2 at Mauna Loa (0.2 ppmv) and far below natural variability.
That is the same as looking for a change in sea level rise in the signal of the upgoing tide…
While I appreciate the specific, limited-timespan focus of this article, it is also important to realize that the disconnect between the growth of atmospheric CO2 concentration and the rise in global lower atmospheric temperatures (GLAT) has already been shown, scientifically and objectively, over much larger time spans.
The assertion that increases in atmospheric CO2 (whether resulting mostly from anthropogenic sources or mostly from natural sources/variations) is a cause—let alone the predominant cause—of increasing GLAT has been falsified by direct scientific measurements.
There have been three distinct “pauses” in global warming that have occurred over the last 100 years:
1) from 1940-1975 (by some analysts, this interval may even has been a period of global cooling!),
2) from about beginning-2002 to end-2013* (ref: https://wattsupwiththat.com/2014/07/03/rss-shows-no-global-warming-for-17-years-10-months/ ), and
3) from about beginning-2015* to present (https://wattsupwiththat.com/2021/05/03/the-new-pause-lengthens-by-two-months-to-6-years/ ).
*Note that was a slight step-shift upward in GLAT in 2014.
The last two of these “pauses”, and the prior interval of 1958-1975, happened despite the Mauna Loa NOAA observatory CO2 measurements showing a smooth, continuous (averaged over each year) exponential increase in total atmospheric CO2 concentration since their precision measurements began in March 1958.
As Nobel prize-winning physicist Richard Feynman is famously quoted as saying, “It doesn’t matter how beautiful your theory is, it doesn’t matter how smart you are. If it doesn’t agree with experiment, if it doesn’t agree with observation, it’s wrong. That’s all there is to it.”
For this reason, I would not expend too many calories worrying about human/COVID minuscule reductions in atmospheric CO2 concentration.
Let me paraphrase your Feynman quote:
“It doesn’t matter how beautiful your
theorymass balance equation is, it doesn’t matter how smart you are. If it doesn’t agree with experiment, if it doesn’t agree with observation, it’s wrong. That’s all there is to it.”The problem for you there is that mass balance does agree with observation. Mass balance just says mass is conserved. Carbon doesn’t spontaneously appear in the atmosphere *from nowhere* – it must come from another reservoir/source; it doesn’t spontaneously disappear from the atmosphere – if it leaves the atmosphere it must have been taken up by a sink. This means if we add up all sources and subtract all sinks, we are left with the change in atmospheric co2.
Show me an experiment or observation that is inconsistent with that.
Thousands of tons of cosmic dust accumulates on the planet every year, some of which is compounds of carbon. Not saying it’s a significant amount as I haven’t researched it, but it’s certainly possible that
Carbon DOES spontaneously appear in the atmosphere *from nowhere*
What does that do for mass balance?
It doesn’t cause a problem. En represents ALL natural sources, which would include cosmic dust and the 50 kilos or so of 14C caused by cosmic rays on nitrogen each year.
cosmic dust is not appearing from nowhere, it is arriving from space.
En is treated as an unknown in the analysis. Even where there are measurements they aren’t used, so measurement uncertainty is also irrelevant.
DM, what is inconsistent is your reference to “carbon” when discussing CO2 variability in Earth’s atmosphere.
It is true the total mass of carbon (C) and oxygen (O2) on Earth must be conserved, ignoring the fundamentally insignificant increases in the masses of these elements that may result from fission decay of radioactive minerals comprising a very tiny fraction of Earth’s mass.
However, the compound CO2 does not have to follow any mass conservation law in the land-ocean-atmosphere system.
For example, it is known that when atmospheric CO2 dissolves into ocean water at its current average pH range of 8.1-8.2, it almost immediately and almost totally chemically transforms into ions of (CO3)2− and (HCO3)− (see: https://en.wikipedia.org/wiki/Bjerrum_plot ).
As another rather-obvious example, CO2 is not “conserved” when plants use photosynthesis to convert atmospheric CO2 into carbohydrates (i.e., sugars and starches).
And, of course, not all of such chemical transformations of CO2 are fully reversible. As but one example, heating dead/fallen trees to high temperatures in an “oxygen-starved” environment (such as under a covering of soil) leads to the formation of charcoal, which is basically just carbon (C) and not CO2.
Carbon cycle scientists discuss the fluxes in terms of carbon rather than co2 because it is not stored as co2 in all of the reservoirs, as you explain. I tend to follow their practice. Carbon in the atmosphere is dominated by co2, and it is generally co2 when it enters or leaves the atmosphere (except oxidation of methane) so it is not that unreasonable to talk of conservation of co2 *in the atmosphere*, just not in the carbon cycle as a whole.
DK posted: “. . . and it is generally co2 when it enters or leaves the atmosphere . . .”
I bed to differ. Precipitation, as rain, is well known to combine atmospheric CO2 with pure liquid H2O (from water vapor condensation) to form a diluted carbonic acid.
“Most rainwater has a pH of 5.6 to 5.8, simply due to the presence of carbonic acid (H2CO3).” — https://www.soest.hawaii.edu/GG/ASK/rain-creek-pH.html
I dare say that precipitation as rain is a most significant process in the atmospheric portion of the overall “carbon” cycle . . . just consider the total amount of rainfall on Earth each day!
As such, rain precipitation leads directly to non-conservation of CO2 within the atmosphere, with it leaving the atmosphere directly as an acid compound.
O.K. Give me a calculation of the proportion of carbon that is in rain.
It it questionable as to whether rain (liquid state) is actually part of the atmosphere (gas state).
AFAICS this is just pedantry. If it makes you happy, just apply mass balance to the carbon. The conclusion is the same.
DikranMarsupial,
Sorry, you’ve mistaken me for a lap dog.
And this: I can only offer reasoning . . . understanding is up to you.
O.k. So you don’t have an answer to the challenge and are running away. Fine.
‘Sorry, you’ve mistaken me for a lap dog.’
co2 and rainfall was your argument not mine. The onus is on you to do the calculations to support your argument; I’ll do the calculations to support mine.
It has been raining (on and off) for a very long time, and there is still CO2 in the air.
Nick, your specific point being . . .???
Or did you miss the fact that the discussion is about the “carbon” CYCLE, which necessarily involves Earth’s hydrological CYCLE.
To paraphrase your comment: Earth’s been going through glacial and interglacial cycles for a very, very long time, and there is still a livable temperature range on Earth.
“Nick, your specific point being . . .???”
So what is your specific point? Stuff moves around. Yes, some CO2 is entrained in rain. And it outgasses from lakes, rivers and sea. That all balances, at least without AGW.
Nick Stokes posted: “Yes, some CO2 is entrained in rain. And it outgasses from lakes, rivers and sea.”
Well, if you bother to read the Wikipedia reference on the Bjeerum plot that I referenced above at 11:24 am, you may understand that CO2 basically (pardon the pun!) cannot “outgas” from the sea (i.e., the world’s oceans) while the water pH stays in its current normal range of 8.1-8.2.
Currently, CO2 dissolving into the world’s oceans is an irreversible process due the great absence of free H+ ions in seawater. It would take seawater changing globally to pH <7.9 to to allow anything above 1% of the CO2 that has gone into solution in seawater in the world’s oceans to then be (mostly) chemically reconstituted and thence “outgas”.
There is no such thing as a current mass (or volume) balance of CO2 dissolving into typical ocean waters and it also “outgassing” from such waters, over the typical range of ocean temperatures.
“Currently, CO2 dissolving into the world’s oceans is an irreversible process due the great absence of free H+ ions in seawater.”
This is nonsense. The Bjerrum plot is a plot of equilibrium concentrations. Equilibrium is a state where the forward (solution) and back (degassing) reactions are happening at the same rate. It is completely reversible, and of course degassing happens on a regular basis – eg seasonal, deglaciation. If it was irreversible all the CO2 would end up in the sea.
Plots (calculations) of equilibrium conditions are often quite useful in providing insights into non-equilibrium processes that are slowly approaching, or approximated by, equilibrium conditions.
As but one example, the Kiehl & Trenberth diagram of Earth’s power fluxes (W/m^2) and net balance of such (and its underlying calculations) is an equilibrium calculation for a distinctly non-equilibrium real world situation. The inherent usefulness of such is that dynamic processes will average to essential steady-state (i.e., equilibrium) over wisely-chosen timescales.
In this regard, I consider the Bjerrum plot as a fair approximate to steady-state (equilibrium) over the timescale of the next 1,000 years.
Beyond that, I need not discuss eventualities or shifting “irreversibilities” with anyone.
Gordon, my former prof of chemistry would turn in his grave if I would have said that…
The CO2/H2CO3 – HCO3- – CO3– equilibrium reactions simply push C species back and forth between pure dissolved CO2 and carbonates (plus H+ ions). The equilibrium depends of the pH in the oceans, which indeed is slightly alkaline, but still plenty of H+ is around at pH 8.0
Thus if for some reason there is a sudden drop in pH (SO2 outbreak from undersea volcanoes), there would be a huge release of CO2 from the oceans. Or if the ocean surface warmed, there would be a massive release of the oceans (16 ppmv/K), no matter the pH.
On the other side, If CO2 in the atmosphere doubled, pure dissolved CO2 in the oceans would double too, from 1% to 2%, according to Henry’s law, but the rest only increases with about 10%, as more CO2 also means more H+ and that pushes the equilibrium back to pure CO2…
That CO2 balance between atmosphere and ocean waters was already established in 2001 by one million samples taken from the ocean waters (meanwhile over 3 million):
https://www.pmel.noaa.gov/pubs/outstand/feel2331/mean.shtml
2,2 PgC more uptake than release in 2001…
FE posted:
“The CO2/H2CO3 – HCO3- – CO3– equilibrium reactions simply push C species back and forth between pure dissolved CO2 and carbonates (plus H+ ions).”
and
“On the other side, If CO2 in the atmosphere doubled, pure dissolved CO2 in the oceans would double too, from 1% to 2%, according to Henry’s law.”
FE, do you not realize that Henry’s Law is only valid at equilibrium conditions?
So given that CO2, on average over the worlds oceans, enters Earth’s ocean predominately via diffusion at the air-water interface (i.e., discounting the effect of wave action), how long do you think that at a new driving partial pressure of 2*.0004*14.7 psia = .012 psia it would take a step change from 420 ppm to 840 ppm (a “doubling”) to create near-equilibrium conditions throughout the world’s oceans to just their average depth of 3,682 meters (12,080 feet), taking into account that CO2 solubility in seawater (as well as in freshwater) varies by about 3:1 over the temperature range of 0+ to 35 C?
I don’t care to work out the very complicated diffusion-with-convection-down-to-the-thermocline-then-predominately-diffusion equations averaged over the world’s various surface-area-to-underlying volume ratios and associated ranges of undersea temperatures to get an estimate for the above question, but I am very confident in stating that it would be in the range of millions to tens of millions of years.
Given the paleoclimatology reconstructions of the range of variability in atmospheric CO2 concentration with time, I can confidently state that the Earth’s oceans have never been in equilibrium with atmospheric CO2.
Yes, your former prof of chemistry may be turning in his grave . . . but for reasons other than you imagine.
Gordon, the deep oceans are not involved in the fast exchange between oceans and atmosphere, that is a very slow exchange over thousands of years.
Only the “mixed layer”, the upper few hundred meters of the ocean surface is involved. That has an exchange rate with the atmosphere of less than a year, thanks to wind and waves…
If something changes in the atmosphere, the ocean surface follows with some 4 years delay. That is all. Not thousands of years.
Thus a change of 1% per year in the atmosphere is followed by the ocean surface with 1% per year with only a few years delay.
See further:
https://www.pmel.noaa.gov/pubs/outstand/feel2331/maps.shtml
Ferdinand, why do you now introduce the issue of “fast exchange between oceans and atmosphere” when such was not previously discussed?
And you post “If something changes in the atmosphere, the ocean surface follows with some 4 years delay. That is all. Not thousands of years.”
That is all? Really???
The implication of that statement is the degree to which CO2 is stored/sequestered below some undefined depth of the “surface” is of little importance. Again, really?
One of the best rebuttals to this line of reasoning are the following statements taken from http://www.waterencyclopedia.com/Bi-Ca/Carbon-Dioxide-in-the-Ocean-and-Atmosphere.html :
“The oceans contain about 50 times more CO2 than the atmosphere and 19 times more than the land biosphere. CO2 moves between the atmosphere and the ocean by molecular diffusion when there is a difference between CO2 gas pressure (pCO2) between the atmosphere and oceans. For example, when the atmospheric pCO2 is higher than the surface ocean, CO2 diffuses across the air-sea boundary into the sea water.
The oceans are able to hold much more carbon than the atmosphere because most of the CO2 that diffuses into the oceans reacts with the water to form carbonic acid and its dissociation products, bicarbonate and carbonate ions. The conversion of CO2 gas into nongaseous forms such as carbonic acid and bicarbonate and carbonate ions effectively reduces the CO2 gas pressure in the water, thereby allowing more diffusion from the atmosphere.
The oceans are mixed much more slowly than the atmosphere, so there are large horizontal and vertical changes in CO2 concentration. . . . CO2 is also about 10 percent higher in the deep ocean than at the surface.“
[my underlining emphasis added in the above quoted text]
I need not comment further.
It only balances when the climate is static, which was obviously before humans evolved. 🙂
As we go into and out of glaciations, or have thermal events such as the PETM, the reservoirs will re-equilibrate. During the transitions, “stuff” will move around, until the changes stop, which they never do.
But what is not appreciated by those who are not geologists is that the number and volume of minerals has increased over time, principally as oxides, hydroxides, sulfates and other oxygen-bearing minerals. This seems to have been facilitated by the development and evolution of life. That is, there is an ongoing sequestration of oxygen over time, starting with the Great Oxygenation Event.
https://en.wikipedia.org/wiki/Great_Oxidation_Event
You don’t need to be a geologist to know about that, it has been covered in a fair few documentaries over the years. Even more relevant is the “weathering thermostat”.
To know about something is not necessarily the same as to appreciate it. I think it unlikely that you even know how many minerals are known. Don’t bother to reply, because there is no way to demonstrate that you haven’t taken a peek at Wiki’.
‘Don’t bother to reply, because there is no way to demonstrate that you haven’t taken a peek at Wiki’.
I don’t need to peek at wiki for this one, I have text books that cover it that I have read.
enough of the ad-Homs.
Well, if what you assert is true, the sequestration of oxygen via increase in formation oxygen-containing minerals has not been evident in paleoclimatology-reconstructions of atmospheric O2 concentration levels, which have generally increased over the last 200 million years . . . see the graph at
I suspect that the lithological cycle—you know, plate tectonics, ocean-floor spreading, subduction zones, mountain building, volcanoes, weathering, erosion . . . all that stuff—may not permit the degree of “oxygen sequestration” that you imagine.
But then again, I am not a geologist, so what do I know?
Gordon, while interesting, the actual CO2 an O2 balances are hardly influenced by mineral formation and decay over geological times. In the current carbon cycle, (carbonate) rock weathering and volcanoes each add 1% to the C fluxes while sedimentation subtracts 1%…
Ferdinand,
Well, it was Clyde Spencer, not me, who brought up the issue of oxygen sequestration via mineral formation with his statement above: “That is, there is an ongoing sequestration of oxygen over time, starting with the Great Oxygenation Event.”
Did you accidentally post you above comment to the wrong person?
Gordon, indeed wrong place inserted and only looked at the name above it, not the rest of the text…
Undoubtedly Feyman would agree that if your model is not consistent with the law of conservation of mass and the observation that the atmosphere, hydrosphere, and biosphere all show mass increases while the fossil reservoir shows a decrease then your model is falsified. Don’t hear what we aren’t saying. We aren’t saying other kinds of falsification tests like with isotope analysis or whatever are not important. They are. We’re just saying that the law of CoM is so fundamental and easy to check that it would be an egregious oversight to not do it first nevermind ignore it at all.
Oddly enough, I read the chapter on conservation of energy in “six easy pieces” yesterday. I think I can guess what he would think of this thread – probably something about the easiest person to fool being yourself. This is why I keep suggesting challenges that Clyde could use to prove me wrong, but he hasn’t taken up any of them yet AFAICS.
“We’re just saying that the law of CoM is so fundamental and easy to check that it would be an egregious oversight to not do it first nevermind ignore it at all.”
Absolutely! And Feynman agrees too.
Also we have had a slow increase in sea levels…it certainly is not accelerating
You are own the right track. I have done a similar but more detailed analysis of both NOAA’s and Scripps CO2 data. I come to mostly similar conclusions with you, but some significantly different ones. Where you conclude that land based changes in the uptake of CO2 causes the seasonal variation, I conclude that it is the freezing and thawing of the Arctic sea ice that is causing the seasonal variation. As to your Figure 1. The red line “saw-tooth” fits a sine wave with one harmonic better than a simple sine wave. That shape strongly correlates with the Arctic freeze/thaw shape. So the red line is expressing the cold water uptake of CO2. That leaves the blue line representing natural CO2 emission changes. As it turns out. that
blue line represents a “global signature” for natural emissions as it is practically the same for all measuring sites for CO2
For the detailed analysis, go to Climate Changes.
(LINK FIXED) SUNMOD
I did mention polar pack ice as having a probable impact. However, to address it in any detail would have been a diversion from the main point. Thank you for the link. I’ll read it when I get a chance.
The link doesn’t seem to work, so try searching “retiredresearcher.wordpress.com”.
Again thank you for the link. Shouldn’t your units of concentration be Kg/ cubic meter rather than square meter?
Fig. 9 was particularly interesting. You might want to provide more information about it.
Fred,
Two mistakes:
The oceans are not the main cause of the variability in increase, (tropical) vegetation is. That is proven by the opposite CO2 and 13C changes.
http://www.ferdinand-engelbeen.be/klimaat/klim_img/temp_dco2_d13C_mlo.jpg
Figure 10 has nothing to do with reality, reality is that both the oceans and vegetation are net sinks for CO2.
Most mature forests are near net-zero from year-to-year when it comes to emissions and sinks for CO2. Ice and open water is a different story.
Fred, as the opposite CO2 and 13C changes show, both the seasonal and the year by year variability in uptake is dominated by vegetation, not the oceans. Here for the year by year variability, including the Pinatubo event and the 1998 strong El Niño:
The global rate of increase [2020 CO2] was the fifth-highest in NOAA’s 63-year record, following 1987, 1998, 2015 and 2016.”
There are all around times of major el ninos, 2 of them super. co2 release has to be linked in some way to that. Its my belief that the warming oceans are the largest source of increased WV and with it the warming which is greatest where its coldest and driest and also co2 release. Large scale cooling of the oceans which would be a natural event would supply a large hint, However, one hint is the La Nina and the drop of the global temperature over the last year. So think about it, Suppose we went back to where the SST’s were in the 1980s. How much cooling would there be. Likely back close to that level. The residual which would be tiny would have a better link to Man but would be non-consequential. So the argument if you want to assign co2 as the driver, is that IT IS OVERWHELMING nature and the oceans and causing them to warm. That is kind of hard for me to believe though understand why if that is all you look at and its what defines your being, you would certainly believe that. What we need is nature to double up on the La Nina or a strong response, which, unlike the 97-98 event, there is not one and in fact in the wake of 15-16 we had one though weaker that was able to sustain the warming even more. Still no one on the other side of the climate change issue as a lot of us dares touch the elephant in the room, which is water vapor. ( should it not be, given its weight in GHG) 40 years ago, Dr. John Cahir at PSU was saying we were missing even then the biggest metric, which he believed was the quantification of saturation mixing ratios given their correlation to temperature. The temperature was a poor proxy, a second level metric So I am in his shadow, carrying that water ( and believe me, that is a long shadow to be in, the guy was a rare breed of forecaster and dynamist). So was Hossler, and Myers. Glory days of my youth when as a student I got to play in the garden of the gods and they would talk to you not down at you
You are exactly correct. Do a time series analysis on CO2 and Nino and you will find that CO2 follows the temperature increase in about 6 -8 months.
Jim, the CO2 rate of change follows temperature variability, but that is only +/-1.5 ppmv around the trend of 90 ppmv since 1958. Temperature doesn’t drive the 90 ppmv trend…
I’m not sure how much of a reduction in CO2 growth is expected here from a 10% drop in emissions. I might have expected a 10% drop in the expected rise, but that’s small compared with natural variation.
The Met Office originally forecast average 2020 concentrations would be 414.2 ± 0.6. With the pandemic they reduced their forecast to 414.0 ± 0.6, Observed average was 414.01 ppm.
In terms of annual change the original forecast was 2.74±0.57, The updated forecast was 2.48±0.57, the observed increase was 2.52 ppm.
The biggest discrepancy is in August and September where CO2 levels didn’t drop as much as expected and were above the original forecast. The MO speculate that this may have been caused by wildfires in California.
Your prediction makes no sense. For a start you are looking at a time frame when CO2 is naturally rising. Most of the rise between October and May would happen whatever the state of human emissions. What would you predict if emissions had been zero in April? Would you expect the trend to be flat?
“There is no question that anthropogenic CO2 is being absorbed in the atmosphere.”
What does “absorbed” mean?
CO2 is in the atmosphere. It’s a gas.
The atmosphere is a mixture of gasses hanging around between the earth and space.
Where is the absorption process?
Absorbed into what??
Would you prefer I had said “incorporated?”
https://www.merriam-webster.com/dictionary/absorb
I agree with Ron Long who said this is an intriguing anlysis, Spencer. I have thought very little about CO2 trends, myself. A couple of questions do come to mind, though. The mass balance issue may be difficult to settle. I have wondered a bit about the influence of the deep ocean reservoir, mentioned also by others here. This reservoir exchanges all carbon species with ocean floor, atmosphere in regions of upwelling or production of deep/bottom water, and also with surface waters. Just the path from bottom water formation to eventual return to the surface is very long term — perhaps even a thousand years. And it is the largest reservoir by far. All rivers probably pour bicarbonate into the oceans. And the midocean ridge hot springs are involved in neutralizing ocean alkalinity. Finding reasonable estimates of all these exchanges sounds like a daunting problem.
Yes, I have been reluctant to wade into the mass balance question because it is so complex and the quality of our data leaves a lot to be desired to do a good analysis. So far, those who have been advocating the mass balance model approach have ignored the issue of unknown and known high uncertainties.
No, mass balance could hardly be more simple. If the natural environment were a net source of CO2 into the atmosphere, the rate at which atmospheric co2 would rise would be higher than the rate of anthropogenic emissions because both mankind and neuter would be making a positive contribution. But that is not what we observe. We observe that the rate is only about half that of anthropogenic emissions, so we know the natural environment is a net sink and hence is OPPOSING the rise.
This requires only reliable observations of atmospheric co2 and good estimates of anthropogenic emissions. Both of which we have.
The whole point of the mass balance exercise is that we don’t need measurements of natural sources and sinks to deduce that the natural environment is a net sink.
If you think it is complicated, it means you don’t understand it and are introducing complications of you own invention.
Like conversion of bicarbonate to CO2?
Does that happen in the atmospheric reservoir?
No.
No, but it acts as a mechanism to transfer CO2 between reservoirs.
That means CO2 does not have to exist in the gaseous state in a reservoir to end up in the atmosphere. All that has to be taken into account in your mass balance equation. That’s where things get complicated.
Yes, in which case it is part of Un which represents the transfer of carbon from the atmosphere by ALL natural sinks. How many times does that need to be pointed out?
“That means CO2 does not have to exist in the gaseous state in a reservoir to end up in the atmosphere. All that has to be taken into account in your mass balance equation. ‘
NO. The mass balance analysis only considers the carbon that is in the atmosphere, and the fluxes in and out of the atmosphere. How the carbon is stored in the other reservoirs is completely irrelevant.
I have an IQ a little higher than Forest Gump. If I’m not getting it, maybe you share some responsibility in the communication problem.
No. I said from the outset that En represents emissions from all natural sources, so if you keep saying “but what about {insert natural source her]”, then the fault is entirely yours.
You have not engaged with the point this time either. I think we have reached the point where it is clear that you will not engage with the argument, so there is no point in me continuing. I will leave you to carry on marginalising WUWT by promulgating obviously incorrect ideas and ignoring the counter arguments.
A mass balance that does not consider a year-to-year increase in natural emissions is not an accurate mass balance. All the sinks like rain, vegetation and phytoplakton that are acting on anthropogenic emissions as well as natural emissions. If the natural sinks suck up 95% of natural emissions, they will also do the same to antropogenic emissions.My analysis of the data shows no year-to-year accumulation in atmospheric CO2 but a year-to-year increase in natural emission rates which are at least twenty times greater than the year-to-year increase in anthropogenic emission rates.
Mass balance does show year to year variation. That is how we know that there is considerable inter annual variation in natural sinks and sources. See the diagram in one of my previous posts.
So what are you doing with an increase in natural emissions which is not in the mass balance that the IPPC uses?
You are not paying attention to what I said. I said there is ‘ considerable inter annual variation in natural sinks AND SOURCES’.
The mass balance only tells you that En – Un has a great deal of variability from year to year. It can’t tell you whether it is variability in En or Un or both. It is both, I have already posted the details of a recent survey by Richard Betts et al that explains why three times, but nobody seems interested in reading it.
AFAIK the ipcc only “uses” mass balance for inferring the terrestrial net flux (because it is the least certain, so it is the best way to use conservation of mass to bound the uncertainties). The first IPCC report alludes to mass balance as evidence the rise is anthropogenic, but it only alludes to it rather than setting it out mathematically as ur really is a statement of the bleedin’ obvious.
Your error is in assuming natural sources and sinks balance out but that those natural sink processes do not have the same effects on anthropogenic emissions and only balance out about half of anthropogenic emissions.
O.k. It looks like my posts are being moderated now despite not containing any offensive content. Not much point in continuing on that basis.
As I pointed out, increases in En are included in the mass balance in exactly the same way variation in Un is. If you think it is not in the. Analysis, you simply don’t understand it yet. See the diagram I posted earlier, which is the result of applying mass balance to annual data.
Fred, any increase in natural emissions would be immediately visible in the mass balance…
It is if you do your mass balance correctly in a flow system that is transporting CO2 from sources to sinks in the upper atmosphere. Go to my wordpress site and show me where I may have made mistakes in my mass balance analysis. “retiredresearcher.wordpress.com.
Indeed, plotting the net natural flux deduced from the mass balance argument (green) suggests considerable inter-annual variability in natural. Sources and sinks
so as Ferdinand says, any increases in natural emissions would be (and indeed are) picked up by the mass balance analysis.
Your green line is incorrect because it assumes there are no year-to-year increases in natural emissions. The red line does show a relatively steady increase.
“Your green line is incorrect because it assumes there are no year-to-year increases in natural emissions.”
nonsense, it makes no assumptions whatsoever about natural emissions. En in the analysis is treated as an unknown with no constraints whatsoever on its value except that it is positive.
The green line is the result of some combination of inter annual variation in natural sources and natural sinks, but mass balance alone cannot determine the relative contributions.
The red line shows a steady increase because that is anthropogenic emissions, which have been rising steadily over the period depicted. What else would it do?
It surely does not include year-to-year natural increases CO2 emissions. This is a basic error in the IPPC assumptions that allows them to claim that about half of anthropogenic emissions accumulate from year-to-year. All the processes that effectively balance out natural emissions are acting similarly on anthropogenic emissions so it is impossible for there to be a year-to-year accumulation of anthropogenic emissions if there is no year-to-year accumulation of natural emissions. The observed year-to-year rise in the red line is the result of year-to-year increases in natural emissions not accumulation of anthropogenic emissions. Do your mass balance on sources and sinks in a flow system.
“It surely does not include year-to-year natural increases CO2 emissions”
you can repeat that as often as you like, but it won’t make it true. Other lines of evidence (see chapter 6 of the IPCC report) tell us that natural emissions are increasing (not a surprise as there is more carbon circulating in that fast carbon cycle).
The mass balance analysis shows that if natural emissions are increasing, then natural uptake must be increasing even faster. We observe that dC – Ea is negative, and conservation of mass tells us that this is equal to En – Ua. So however much larger En is becoming, Un is growing faster.
”It surely does not include year-to-year natural increases CO2 emissions. This is a basic error in the IPPC assumptions”
Check out figure 6.1 of the most recent IPCC report. That refutes your suggestion that they assume no year-to-year natural increases. They are shown by the red arrows with numbers.
It is not a good idea to say what someone/thing assumes if you haven’t read what they actually wrote.
Fred:
If the natural sinks suck up 95% of natural emissions, they will also do the same to antropogenic emissions.
That is an essential mistake you make. The seasonal cycle is driven by the seasonal temperature. That gives that there is a fixed amount of CO2 released form the oceans for a fixed temperature increase in spring/summer and a fixed uptake of CO2 for a fixed temperature decrease. More or less the same for vegetation, but in opposite direction.
That is what the residence time gives of about 4 years.
If there is a sudden 10% increase of CO2 in the atmosphere, with the same temperature changes over the seasons, there is no change in CO2 uptake or release due to the extra CO2: no more leaves will grow and no more CO2 taken away by the oceans because of temperature.
Of course some CO2 will be absorbed by oceans and vegetation as result of the increased CO2 pressure in the atmosphere, but that is far from 10% of the additional CO2 in the atmosphere. That is about 2% of the extra CO2 in the atmosphere above equilibrium per year.
The decay rate is about 50 years and the half life time about 37 years.
Quite a difference…
The natural cycle is almost completely temperature driven.
The removal of any extra CO2 is almost completely pressure driven…
All the CO2 that reaches the surface of the open water of the Arctic ocean will be absorb. When the sea ice forms in the winter the sink is effectively closed and CO2 concentrations build up. When the ice melts in summer all that buildup is absorbed and mostly consumed by phytoplankton blooms. There is an extremely significant correlation between sea-ice concentration and CO2 concentrations At Point Barrow. Both the shapes and directions of the two curves are very similar. Land based changes are having little effect in comparison.
Fred, the transfer rate of CO2 from atmosphere into water is slow, much slower than the transfer rate of water into the deep oceans.
The pCO2 of the ocean waters at the largest sinks (N.E. Atlantic) is 150 μatm, that is way below the 400 μatm, measured in the atmosphere at the same place.
If the transfer rate was fast, either the pCO2 of the local oceans would lift, or the pCO2 in the local atmosphere would drop.
Moreover even at Barrow, the CO2 changes are from vegetation, not from the oceans, as the opposite CO2 and 13C changes show
Then why does the increase occur exclusively in Fall and Winter?
Because in the northern hemisphere that is when plants die back and decay, which produces co2.
Then how is it temperature driven as Engelbeen says?
Because temperature is one of the things that governs the seasonal growth patterns of plants.
BTW in another reply to your comments, I provided the uncertainties on Ea and dC, showing they are far too small to affect the conclusion of the mass balance analysis. Do you now accept the mass balance analysis. If not, please give the specific flaw in the argument.
Clyde, you should know the answer yourself. In fall the leaves of many trees are falling and are decomposing with a peak in October-November. That goes on during winter even under a snow deck at a slower speed, while CO2 uptake by plants is minimal. In spring/summer it is reverse.
If I look at a heap of leaves i made in fall, that heap halves during fall-winter, even within (seldom here) cold winters…
There is a physical mistake in geology (the earth) at a concept level, at the level of imagination. Geology is a mature field of science. The research has been down and the geological paradoxes have not gone away. For example what causes cyclic abrupt climate change. The paradoxes are linked. Explained by the same thing/cause.
Salby’s findings requires a physical explanation. This is the physical explanation as to why atmospheric CO2 is not tracking anthropogenic CO2 emissions.
What I have written below is not a cutting edge ‘theory’, it really just a ‘discovery’ of the physical system that moves the tectonic plates and replaces the hydrogen that is lost to space and replaces the water that pushed into the mantel.
The earth is 4.7 billion years old. Why did advance life wait 4.1 billion years before appearing on the earth?
The evidence is that the appearance of deep oceans on the earth and the start of modern plate tectonics (Why did plate tectonic start in this period also?) on the earth was the necessary change, that enable advanced life, large, complex organisms.
What happened 570 million years ago on the earth, in the earth … To produce the ‘first’ deep oceans on the earth?
https://www.sciencedaily.com/releases/2018/12/181212134354.htm
Why deep oceans gave life to the first big, complex organisms
All over the planet starting in 1995, there was suddenly a 300% increase in the frequency of earthquakes of magnitude 4 to 6 all over the earth, at the mid ocean ridges, where the sea floor is being pushed apart.
The below link to graph shows the frequency of magnitude 4 to 6 magnitude earthquakes (the frequency of the small earthquakes at the ridge spreading zone has been shown to correlate with the movement of the ocean plates and rate magma is coming up increases when the plates move apart faster).
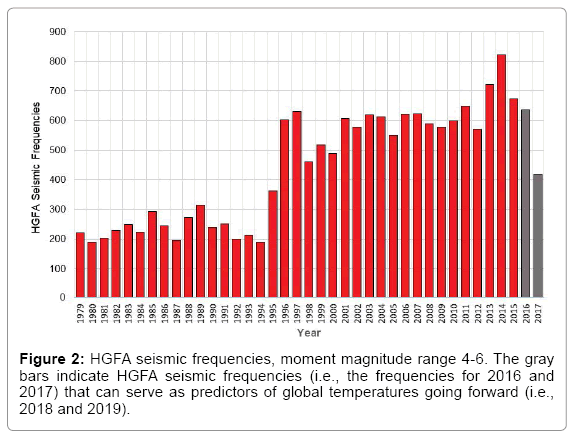
 
https://www.omicsonline.org/open-access/have-global-temperatures-reached-a-tipping-point-2573-458X-1000149.pdf
“As detailed in those studies, increasing seismic activity in these submarine volcanic complexes is a proxy indicator of heightened underwater geothermal flux, a forcing mechanism that destabilizes the overlying water column. This forcing accelerates the thermohaline circulation while enhancing thermobaric convection [3-6]. This, in turn, results in increased heat transport into the Arctic (i.e., the “Arctic Amplification”), a prominent feature of earth’s recent warming [7-9].”
We have ‘pictures’ of a tube system in the mantel that was discovered about five years ago using an AI technique to analysis the information in multiple seismic events simultaneously to determine the structure that is reflecting the seismic waves. It has known for decades that there is a massive structure that is reflecting seismic waves in the mantel however there is insufficient information from a signal seismic wave to determine its structure.
What was discovered analyzing all data simultaneously and then using an AI technique to ‘solve’ to find a structure that could produce the refections… The refections are caused by a manifold system of connected tubes in the mantel. The tubes interconnect in a manifold and the manifold has tubes that connect the manifold to the liquid core of the planet.
Something made the tube like structure that was discovered in the mantel. Something moves the tectonic plates. There is a physical reason why there is water that covers 70% of the surface of the planet.
There is something that is in the earth that is doing stuff in real time and these changes correlate with El Nino events. (Cause El Nino events).
The deep earth system is changing in real time (there are month by month changes, see attached paper that shows the rate of spreading of the ocean ridges is changing in real time. This means (assuming extrude CH4 is powering plate tectonics) that the earth’s liquid core’s rate of crystallization is changing in real time by a factor of three. And the sudden change in the rate of liquid core crystallization is two years in advance of El Nino events.
There is a massive unaccounted-for source of CH4 that is constantly being pushed into the biosphere. The CH4 comes from the liquid core of the earth where it is extruded when the core crystallizes.
The earth was hit by a Mars size object roughly 100 million years after it was formed. That impact formed the moon and removed the early earth’s Venus like atmosphere and removed most of the CH4 and H2O that was in the mantel at time.
At high pressure and temperature, metals bind with CH4. That is the reason why the CH4 was dragged down into the liquid core. The metals in the mantel bond to the extrude CH4 which forms a sheath about the extruded CH4 to form a pipe like structure that carries the CH4, the core pressure, and metals which are dissolved in the CH4.
This explains why the only source of commercial helium is from oil and gas reservoirs. The oil and gas is formed from the CH4 that is extruded from the core. The CH4 carries with it heavy metals from the core which are deposited below the oil and gas reservoir. Over time the radioactive uranium and thorium decay producing helium. The CH4 continues to be extruded which keeps small passages open to enable the helium to move up into the oil and gas reservoirs. This also explains why heavy metals are found in ‘heavy’ oil and the amount of heavy metals correlates inversely viscosity of the hydrocarbon. This also explains ratio changes of C13/C12 in bituminous coal, natural gas, and oil.
The extrude CH4 and the tube system and tube manifold system is what moves the ocean and continental plates.
This primordial core extruded CH4 has a low C13 content. This explains why when tectonic plate movement started on the earth suddenly the carbon record shows a dozen spikes of negative C13/C12 changes from current and evidence of a massive source of CH4 that is pumped into the biosphere.
https://www.newgeology.us/presentation21.html
“In recent years, the kinematics of continental drift and sea-floor spreading have been successfully described by the theory of plate tectonics.
However, rather little is known about the driving mechanisms of plate tectonics, although various types of forces have been suggested”14. Seven years later, in 1982, the assessment was:
“At the present time the geometry of plate movements is largely understood, but the driving mechanism of plate tectonics remains elusive”3. By 1995 we find that:
“In spite of all the mysteries this picture of moving tectonic plates has solved, it has a central, unsolved mystery of its own:
What drives the plates in the first place? ‘[That] has got to be one of the more fundamental problems in plate tectonics,’ notes geodynamicist Richard O’Connell of Harvard University.
‘It’s interesting it has stayed around so long’ “25. In 2002 it could be said that: “Although the concept of plates moving on Earth’s surface is universally accepted, it is less clear which forces cause that motion.
A little off topic. Perhaps you should have submitted it as a stand alone article.
The rate of CO2 change is been about flat since 2012
https://www.woodfortrees.org/plot/esrl-co2/from:1990/derivative/plot/esrl-co2/from:2012/derivative/trend/plot/none
The rate of CO2 change has been decreasing sharply since the peak temperature years 2015-2016. Linear extrapolation puts it at zero change by 2030, but more likely by 2050 if temperature has peaked. Note 2030-2050 is the net zero targets.
SH ocean surface temperature describes about 85% of the variability in rate of CO2 change.
https://www.woodfortrees.org/plot/esrl-co2/from:1990/derivative/plot/hadsst3sh/from:1990
By my calculations human emission/landuse factors are contributing up to 15% to the observed change (i.e. 15% higher than with no human influence).
***”The rate of CO2 change has been flat”. I got too excited and my brain and finger typing didn’t match. Woodfortrees plots just used for convenience and credibility of the data presented. I have crunched the numbers locally.
My Fig. 4 doesn’t support that claim for 1991-2020. It may be true for 2012 through 2020. However, how confident are you that the current temperature hiatus will continue indefinitely?
Not confident at all. I think all anyone can safely say is 33% chance significant increase, 33% chance no significant change, and 33% chance significant decrease. Or more simply, 50% chance anyone will get the sign of the change right over the next several decades.
I just checked and the slope of the line in Fig. 4 for the period of 2012 through 2020 is essentially zero.
What is the confidence interval on the slope?
All moot. See prior article “When Dr. Will Happer speaks, people listen.” CO2 acting as a greenhouse gas is well known. Adding more CO2 will not increase the greenhouse effect enough to matter.
The other side of that coin is that if it can be shown that humans are not responsible for the bulk of the CO2 increase, then mediation is intractable and and the issue of anthropogenic global warming is moot.
IF
of course it is possible that the world’s climatologists have been fundamentally wrong on this most basic fact for the last century and you are right. The balance of probabilities isn’t on your side though, especially as you have been unable to identify a specific flaw in the mass balance analysis, never mind any of the other lines of evidence.
Call me ignorant if your must; but if you do, please direct me to the proper sources.
Has there been a peer reviewed study done attempting to correlate the yearly rises in CO2 to food crop yields over the past 100 years?
Here is a website that has many published papers as reference:
CO2 Science
Yes. Great source.