Climate change action proponents regularly tell us we have to reduce our carbon dioxide (CO2) emissions to prevent “climate change”, even to the point of curtailing industry, travel, and food consumption. Fortunately, a real-world test of just those very things happened in 2020 due to the COVID-19 related lockdowns.
In a report released April 12th by the U.S. Energy Information Administration (EIA) the Monthly Energy Review, they report that energy-related CO2 emissions decreased by 11% in the United States in 2020 primarily because of the effects of the COVID-19 pandemic and related restrictions.
Furthermore, U.S. energy-related CO2 emissions fell in every end-use (consumer) sector for the first time since 2012. The EIA notes:
“CO2 emissions associated with energy use fell by 12% in the commercial sector in 2020. Part of this drop in emissions was due to pandemic restrictions. Because electricity is a large source of energy for the commercial sector, the declining carbon intensity of electric power also contributed to declining CO2 emissions from commercial activity. Emissions from commercial electricity use fell by 13%. Commercial petroleum and natural gas emissions fell by 13% and 11%, respectively.”
“Within the U.S. power sector, emissions from coal declined the most, by almost a fifth, at 19%. Natural gas-related CO2 emissions rose by 3%. Also of note in 2020; fossil fuel generation declined, while power generation from renewables from wind and solar continued to grow.”
These graphs below, provided by EIA, show the downward trends in CO2 emissions by sector:

The EIA also provided data that shows in the middle of all that reduction of carbon dioxide emissions, electricity generation from solar energy (and to a minor extent, wind) increased by 17% in 2020.

But here’s the rub.
This big CO2 emission reduction experiment from traditional fossil fuel energy sources so often demanded from climate change alarmists resulted from the global economy being essentially crippled for months, and yet did not matter at all in the grand scheme of global carbon dioxide concentrations, said to be the “control knob” for climate change. Even with that reduction, combined with a 17% upwards shift towards wind and solar, the Earth’s atmosphere didn’t notice – global atmospheric CO2 concentrations continued upwards, unabated in 2020.

As seen in the graph above, CO2 in the atmosphere increased during 2020 during the economy crippling lockdowns at the same rate it has been for decades. There isn’t even a blip.
This lack of any reduction in atmospheric CO2 concentration clearly demonstrates that no matter how much the U.S. reduces CO2 emissions, no one living today will, at any point in life, see a measurable change in climate attributable to the reduction. This is especially true since other countries, such as China, who only give lip-service to the CO2 emissions reduction demanded by the 2015 Paris Climate Accord.

It is a fools errand to think we in the U.S. can change the climate by reducing CO2 emissions, especially when other countries aren’t even bothering to try. We can only mitigate any future changes in the climate, something mankind has been successfully doing for centuries.
So, Trumps work, not Bidens 😀 – without any Green New Deal and idiotic climate action 😀
Yes, Trump’s plan worked better than the others and he didn’t cripple our economy in the process.
Crippling economies is the goal for leftists, always has been. That they can steal everyone blind in the process is just gravy on the side for them.
No, this is not Canadian Arctic circle or even Antarctic it is Mediterranean country of Monte Negro,
https://pbs.twimg.com/media/Ey9ZvmwXEAsHZcF?format=jpg
Well,
the news to come soon;
“Glubal warming threatening to turn Monte Negro in to
Monte Blanch…”
🙂
cheers
That’s funny, either way it’s name will be redacted by Google, Facebook and Twitter as soon as their woke algorithms come across it. Visit Monte Negro, we need your money asap!
https://youtu.be/VtXuGg0Qkro
Great place Vuk
I was supposed to return to Црна Гора last year and then the lock-down. Maybe I’ll head back later this year, Вук!
Monte Negro is at about the same north latitude as Boston, MA.
…… or Rome in Italy, and further south than Nice or Marseilles, France. It is much warmer than Boston in the winter, shouldn’t have that much snow in mid April even in the mountains 40-50 miles from the sea. Photo taken 1:10 PM · Apr 16, 2021
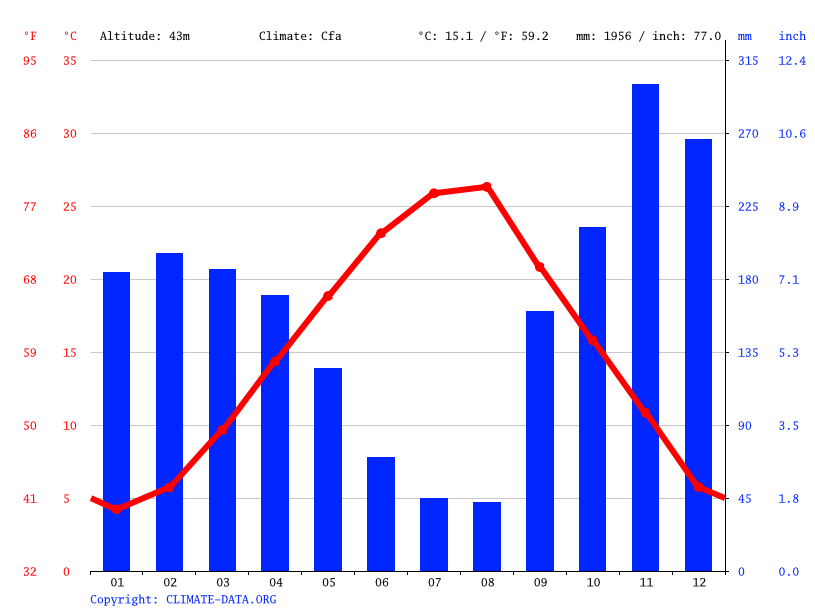
Capital’s temps and precipitation
Montenegro is about 350 miles east of Rome Italy
All I can say is – wow! And glad that wasn’t Texas in February.
How about next year, would that do?
It is place called Mala Crna Gora or Little MonteNegro in Mone Negro (Crna Gora)
Worth taking look at the video of the place
https://youtu.be/w_0e8iHGpM4
Skip trough the interviews
The one in the Balkans, right? That snow must be at some altitude. But that is a LOT of snow!
Cool pic, Montenegro is actually on the Adriatic and is quite mountainous. They are also massively in debt to China so they could use some ski resort revenue right now. 😉
2hotel9,
Oh, no, no
Crippling capitalistic economies, and Cancel Culture, and BLM, etc., are done by Dem/Progs, to PROVE Capitalism, etc., is not working, and should be replaced by THEIR version of Socialism and Communism, that would not work at all, for sure.
Do not let them get to First Base, ever.
Who needs a healthy economy when the bureaucrats can just print more money. They seem to think they have a money tree growing in the basement of the Bureau of Engraving and Printing. They don’t fear inflation because, as public sector employees, they just vote themselves automatic COLAs to keep pace with runaway inflation.
All the while those of us in the private sector are robbed of our purchasing power, discretionary income and accumulated wealth.
Sometime over this next decade, when this whole thing crashes around our ankles, they will point back to 2020 and blame Trump. Nearly half the population, those on the public sector gravy train, will believe the propagandists at NYTWAPOABNBCBSMSCNN. AT that point none of this will matter because we will all be…(Fill in you favorite pejorative here__________)
You won’t see that one reported in the NYT, NPR, Atlantic, or LAT. It would further confuse the muddled masses and might get them to thinking and researching for themselves.
“muddled masses”
I like it. Very discriptive.
I’ve been saying this for weeks.
Mauna Loa demonstrates that mitigation cannot be achieved. Only adaptation is a viable policy.
It wasn’t just the US. The whole world locked down. Aviation was crippled. Global GDP dropped 5%.
And that’s the point. The Covid restrictions were strict. But only reduced the economy by 5%. That means 95% of the economic activity still happened.
Food was still grown and delivered. Homes were still heated. Hospitals were actually very busy. So all the suffering in homes to deal with Covid was nowhere near enough suffering to impact on AGW.
It’s officially not worth doing for one year.
Can anyone imagine us doing 2020 even harder year after year after year?
Getting the rest of the world to go along with that requires WW3 as step one.
With step two being that they find out that the other team has more ammo.
-World production of grains, vegetables and cereal crops are highly dependent on affordable fossil fuels at every step in the production chain.
-Remove affordable petroleum and natural gas, make them exhoribantly expensive and we’ll famines that will bring about what the Malthusian Marxists really want, a global population reduction.
-Famine, first in small steps, then larger ones as they gain more power over desperate populations. Africa will be the first.
-India and China both see that writing on wall, realizing the climate scam for what it really is.
They have both made commitments to not let that happen in their country whilst the West shrivels. Mexico, Brazil and Argentina will follow that and fall more firmly under China’s influence as the West demands “climate sacrifices” on the road to famine.
Of course the globalist elites driving this madness, the Bloombergs, Bill Gates, Tom Steyer’s and John Kerry-Heinz’s of the West, see themselves as staying above all the despair, chaos and mayhem with their financial resources to buy whatever they need at any price, and still have their yachts and private jets.
You nailed it Joel – high crimes against humanity – Stalin, Hitler, Mao and Pol Pot – on steroids.
https://wattsupwiththat.com/2021/04/13/winter-is-not-going-away-without-a-fight/#comment-3225277
If you have time, listen to Dr T Nemeth’s interview – she nails it – the leftists core plan is to destroy our society, starting with our energy systems. That means the death of multitudes.
https://anchor.fm/martinz-critical-review/episodes/The-MARTINZ-Critical-Review—Ep62—The-climate-alarmism-narrative-perpetrated-by-Transnational-Progressive-Movement-and-the-destruction-of-our-present-way-of-life—with-Dr–Tammy-Nemeth–PhD-eurcpg
Best regards, Allan
Correct Joel, and highly alarming.
There is a powerful logic that says no rational person or group can be this wrong for this long – the climate alarmist, anti-fossil-fuel leadership clearly knew from the outset decades ago that they were engaged in large-scale genocide.
I wrote this comment about energy reality many years ago :
Fossil fuels comprise fully 85% of global primary energy, unchanged in decades, and unlikely to change in future decades.
The remaining 15% of global primary energy is almost all hydro and nuclear.
Eliminate fossil fuels tomorrow and almost everyone in the developed world would be dead in about a month from starvation and exposure.
Best, Allan
I think Dems are falling in love with these downturns. They get to check off blocks of items on their agenda list all at once in the form of mislabeled stimulus, now with side payments to the voter base.
Remember how Obama told us that strong economic growth was a thing of the past? Trump proved he was totally wrong about that and the Dems hated Trump even more because he proved it.
How about the world wide carbon emissions? How do they correlate with rising atmospheric CO2 as detected in Mauna Loa?
Meanwhile, here it’s still snowing in western Massachusetts. Very heavy wet snow. Where’s my global warming that I want so much? I love the heat and I’d like a longer growing season and as a forester I’d like the trees to grow more each year.
Told you so – January 2008.
https://wattsupwiththat.com/2021/02/27/great-reset-architects-celebrate-the-orderly-quiet-of-covid-lockdown-cities/#comment-3195374
Funny – Atmospheric CO2 concentrations were unaffected by the full-Gulag Covid-19 lockdown, despite a huge decrease in fossil fuel consumption.
Why? Because increasing CO2 concentrations are primarily naturally caused, not primarily driven by fossil fuel combustion.
Surprise! Climate Crisis Cancelled!
I recommend Ed Berry’s new book
“Climate Miracle: There is no climate crisis Nature controls climate”
https://www.amazon.ca/Climate-Miracle-climate-crisis-controls-ebook/dp/B08LCD1YC3/
My review: 5 Stars.
An excellent, readable book that destroys the scary global warming / climate hypothesis.
Reviewed in Canada on November 11, 2020 Verified Purchase
https://www.woodfortrees.org/plot/esrl-co2/from:1979/mean:12/derivative/plot/uah6/from:1979/scale:0.22/offset:0.14
file:///C:\Users\Owner\AppData\Local\Temp\msohtmlclip1\01\clip_image002.jpg
Author Dr. Edwin Berry demolishes the IPCC’s very-scary catastrophic man-made global warming hypothesis. Ed proves from basic principles that the growth of CO2 in the atmosphere is primarily natural, not man-made. Berry’s analysis is consistent with my 2008 publication that atmospheric CO2 cannot significantly drive temperature, because changes in CO2 lag temperature changes in the modern data record, as they do in the longer-term ice core record. Kuo et al (1990) and Keeling (1995) made similar observations in the journal Nature, but have been studiously ignored by global warming propagandists. “The future cannot cause the past.”
CARBON DIOXIDE IS NOT THE PRIMARY CAUSE OF GLOBAL WARMING, THE FUTURE CAN NOT CAUSE THE PAST
By Allan M.R. MacRae, January 2008
http://icecap.us/images/uploads/CO2vsTMacRae.pdf
_________________________________
https://wattsupwiththat.com/2020/02/11/climate-science-does-an-about-face-dials-back-the-worst-case-scenario/#comment-2914772
6. The sequence is Nino34 Area SST warms, seawater evaporates, Tropical atmospheric humidity increases, Tropical atmospheric temperature warms, Global atmospheric temperature warms, atmospheric CO2 increases (Figs.6a and 6b).
CO2, GLOBAL WARMING, CLIMATE AND ENERGY
by Allan M.R. MacRae, B.A.Sc., M.Eng., June 15, 2019
https://wattsupwiththat.com/2019/06/15/co2-global-warming-climate-and-energy-2/
Other factors such as fossil fuel combustion, deforestation, etc. may also cause significant increases in atmospheric CO2. However, global temperature drives CO2 much more than CO2 drives temperature.
Agreed! Dr. Berry’s book is a good place to start. Then his preprint https://edberry.com/blog/climate/climate-physics/preprint3/ and Harde’s papers and Salby’s videos. The underlying AGW assumption that humans are raising the temperature of the planet by using fossil fuels is falsified by these works.
Dr Ole Humlum’s latest Climate4You update is here:
http://www.climate4you.com/Text/Climate4you_March_2021.pdf
Dr Humlum makes the following observation:
Atmospheric CO2 and the present coronavirus pandemic
Modern political initiatives usually assume the human influence (mainly the burning of fossil fuels) to represent the core reason for the observed increase in atmospheric CO2 since 1958 (diagrams on page 42).
The present (since January 2020) coronavirus pandemic has resulted in a marked reduction in the global consumption of fossil fuels. It is therefore interesting to follow the effect of this on the amount of atmospheric CO2.
By the end of February 2021 there is still no clear effect to be seen. Presumably, the basic explanation for this is that the human contribution is too small compared to the numerous natural sources and sinks for atmospheric CO2 to appear in diagrams showing the amount of atmospheric CO2 (see, e.g., the diagrams on p. 42-44).
Joseph,
Correlation is no proof of causation, ever, per Statistics 101
Right- of course- but I was just curious to what extent there is a correlation since the story talked about reductions in CO2 emissions in America, not the world. It seemed to me that the world wide emissions numbers would add to the story. My personal opinion is that nobody has a clue about the climate so no reason to spend trillions to fix it- and I’m also highly skeptical of the medical industry, I don’t trust anything any doctor says. I’m also skeptical of anything said about what food is good for us or not. And I’m infinitely skeptical about all religion and political theories. I do think most people mean well- but everything is way more complicated than we naked apes can figure out. Through trial and error we do manage to make some things work- our tools and gadgets but we’re along way from any deep understanding. For all we know- the cosmos is just a hallucination in Buda’s mind. I like that theory as it means we shouldn’t take ourselves to seriously. :-}
“This lack of any reduction in atmospheric CO2 concentration clearly demonstrates that no matter how much the U.S. reduces CO2 emissions, no one living today will, at any point in life, see a measurable change in climate attributable to the reduction.”
While I am not a believer that climate cares much about atmospheric CO2 concentrations at this point, one should understand that 1PPM of Atmospheric CO2 weighs around 5 Gigatons and since we are emitting approximately 33 gigatons annually, Earths atmosphere is absorbing less than half of what is being emitted. It would appear that the biosphere is absorbing the majority of the surface CO2 emissions, so I would not expect an 11% reduction in emissions to have any effect on the growth of annual atmospheric CO2 levels, nor would it appear that an 11% increase in annual CO2 emissions would have any impact on atmospheric CO2 growth levels. After all we have more than double emissions in the last few decades but annual atmospheric CO2 growth has changed little.
Sort of like sea level trend growth
Atmospheric CO2 concentration has being completely disrespectful to man and the manmade emissions, either when the emissions were going up or not…
same disrespect to manmade emissions
from ‘rona’ too. 🤪
cheers
“. . . so I would not expect an 11% reduction in emissions to have any effect on the growth of annual atmospheric CO2 levels . . .”
Well, the Mauna Loa observatory is reporting CO2 levels to the nearest 0.1 ppm, equivalent to 0.1/410 = .02% precision in ppm measurement (not that I necessarily believe this claimed level of precision).
At end-2019 the US was contributing about 14% of all global CO2 emissions (https://www.nytimes.com/2019/12/03/climate/carbon-dioxide-emissions.html ). I could not quickly locate more current data on this parameter, but it changes slowly so let’s just go with this value.
So, using your values for the other terms, we arrive at this conservative calculation for the change in global atmospheric CO2 assuming that it was only the US that reduced CO2 emissions in 2020:
(1 ppm/5 Gt * 33 Gt) * (0.14 * -0.11) * 0.5 = -0.05 ppm
Thus, the US-only 11% reduction is CO2 emissions for 2020 would likely not be detectable in Mauna Loa reported CO2 levels.
According to the IEA (https://www.iea.org/articles/global-energy-review-co2-emissions-in-2020 ) global energy-related CO2 emissions fell by 5.8% in 2020. If we use just this value (i.e., neglect the CO2 emission changes related to cement production and other processes in 2020) and again use a rough estimate that about 50% of CO2 emissions are absorbed by the biosphere, we get this calculation:
(1 ppm/5 Gt * 33 Gt) * (1 * -0.058) * 0.5 = -0.19 ppm
This should have been detectable at Mauna Loa, although it would not appear as a “dip” on the graph in the above article due to its limited resolution.
Bottom line: the gist of the above article and LT’s related comment is correct, significant reductions in mankind’s annual emissions of CO2 will result in almost imperceptible changes in global CO2 levels for long into the future.
If the ‘sinks’ are saturated by man’s additions, then surely the effect of small changes in those emissions will be amplified in the Mauna Loa record, not masked?
There is no evidence that the sinks are saturated. They are increasing.
Okay, sorry. Perhaps I put that badly. The attribution for increased atmospheric CO2 made by the climate community is a calculated balance, where it is assumed that the sinks cope with only a certain amount of anthro emissions, the rest remaining in the atmosphere. If, for example, the sinks handle 50% of man’s output, then if that output falls by 10 percent, the amount remaining as a visible extra should be 20% less than expected. Anthro emissions are treated as the ‘top slice’ not as a ratio.
In the longer term I agree with you that the sinks are part of a dynamic system, but there is likely no instantaneous response to a changing CO2 output..
I also get the feeling that there are a lot of uninformed climate communicators that think mitigation, even globally, will stop long-term sea level rise of the interglacial. I had not considered that scope of stupidity. I’m sure John Kerry would dismiss it as an affront to his faith.
No quantity of data could possibly impact Kerry’s Quixotic quest for carbon control. Any human being who could justify flying in a private plane round trip to Europe to receive a climate award lacks the cognitive ability to process actual empirical data.
Right on! I detest hypocrites far more than people do nasty things out of stupidity.
Massachusetts, an epicenter of climate alarmism, is loaded with climate hypocrites.
The typical green politician is a woke imbecile, easily distracted by shiny objects.
Way early on after Al Gore’s famous movie hit the silver screen with the big diagram of CO2 and Temperature, it was pointed out that atmospheric CO2 concentration lagged the increase in temperature by about 800 years.
Well currently we are seeing a CO2 increase seemingly regardless of human activity. So regarding that 800 year lag that has been pointed out, what happened 800 years ago?
Can you say “Medieval Warm Period” from about 950 – 1250 BC? I knew you could.
Every now and then I see this point brought up and then crickets.
Source Wikipedia
The 800 years lag consists in consideration of long and slow warming trends,
and usually leads to misconception, as actually CO2 lags temps at around of 0.2C of variation.
In the slow long term temp variation trends, the 0.2C consists in a 800 years time frame.
But you see, in any significant climatic warming trend CO2 concentration will lag in time accordingly with the 0.2C variation and reaching
‘full potential’ of a clear steady growth just about
@ur momisugly the 0.4C variation of temperature.
Again, CO2 concentration lags temperature, and it has not a special timetable or timeframe to keep.
cheers
“Medieval Warm Period” from about 950 – 1250 BC?. I presume you mean AD 950 to 1250?
♩ ♪ ♫ ♬ AC ♩ ♪ ♫ ♬ BC ♩ ♪ ♫ ♬
Dunno post enough, and you finally make your self look stupid.
What do you mean? That “BC” (Before Christ) was incorrect. It should be AD (Anno Domini, or, if you prefer, CE as many people nowadays write).
Medieval warm period (MWP), also called medieval warm epoch or little climatic optimum, brief climatic interval that is hypothesized to have occurred from approximately 900 ce to 1300 (roughly coinciding with the Middle Ages in Europe), in which relatively warm conditions are said to have prevailed in various parts of the world, though predominantly in the Northern Hemisphere from Greenland eastward through Europe and parts of Asia.
One of uncountable sources
Yes, and there’s also the continued reference to temperature rising “since the beginning of the industrial age”. Why not “since the end of the Little Ice Age”? That’s more appropriate, as most of the warming has been recovery from the coldest period in human history. Who wants to go back there?
It’s been a lie since the first IPCC report in 1990 when temperature was seen to lead CO2 seen in the Ice Core Bubbles (Vostok) hijacked by politicians of the left and their MSM. I quote:
Jo Nova from Chapter 5, Climate Change The Facts 2020: ‘Sacred Bubbles in Ice Cores’
“In the world of evidence there is nothing more compelling than ice-core
bubbles. They fill the first graph in the first executive summary in the first
IPCC report 1990. And in all the years since, there is no other data set like
it. Nothing else shows carbon dioxide (CO2) and temperature in ‘lock up’
moving up and down in parallel.
Yet buried in the subclause ‘Summary for Policymakers’ was the rather
devastating caveat:
“Measurements from ice cores going back 16,000 years show that the
earths temperature closely paralleled the amount of carbon dioxide
and methane in the atmosphere.
Although we do no know cause and effect ….”
With candour that disappeared in later reports, the IPCC even admitted
they weren’t sure whether CO2 led temperature of temperature led CO2.
The resolution of the early cores was not good enough to tell. But billions
of dollars were about to be poured into solving a crisis and the ice cores
were about to become a poster child. The world was captivated by the
unnerving parallelism of temperature and CO2 shifting together through
the eons. But it was a very new and immature science. Only 15 years
earlier it had not even seemed realistic to estimate atmospheric CO2
levels from bubbles (Berner et al. 1980)
Such was the runaway enthusiasm of the day that the 1989 New Scientist
magazine prematurely ran the same Vostok ice-core graph with the
caption “Where carbon dioxide leads, temperature follows” (Gribbin 1989)
It would take another 10 years for the first IPCC report before scientists
realized that it was temperature that rose first, not CO2. Between 1999
and 2003 it was discovered (quietly) that temperature was driving CO2
levels, and not the other way round. Cause and effect were back the front
and thereafter were barely spoken of again. In the end it was just basic
chemistry; “the oceans contain 50 times the amount of CO2 as all the air in
the sky. As the oceans warmed, they degassed and released CO2.
Whatever drives temperature, by default, indirectly drives CO2”.
That ought to have been a major blow to the theory of a man-made
catastrophe, but the express train to a carbon-based scare was already
well fuelled and running ‘at speed’. Paleoclimatologists (and many
others) were implacably convinced that CO2 controlled the climate. They
argued that even though temperature initiated the rise in CO2, after that,
CO2 amplified the warming. And perhaps it does to some small extent, but
its not large enough to measure. Teams of researchers have hunted ever
since, with little success.
Having told the world that carbon led temperature, New Scientist
magazine didn’t rush to correct the record. The peer reviewed papers
detailing the ‘lag’ were published in the theoretically prestigious journals
of Science and Nature, but even years later, in 2007, the 170,000 of New
Scientist would have had no idea. I wrote to the editors in 2007 and
asked if I had missed the news.
Michael Le Page from the new scientist replied, acknowledging that they
did not cover any of the papers but bristled that it was entirely
unnewsworthy, saying:
“Why do you think we should have reported a finding that no scientist
found at all remarkable at the time, because it confirmed what they
had always thought”.
As if New Scientist wouldn’t have done glorious headline-grabbing cover
stories on those same papers had the results been the other way round.
This data is central to topic that New Scientist calls ‘the most important
threat we face’, and the magazine found the space to mention ‘Vostok’
eighteen other times during the same 5 year period the papers were
released, but somehow the 800 year lag was not even news.
I pointed out the incorrect caption on the 1989 graph, and le Page
stopped replying. Three months later, New Scientist mentioned the lag for
the first time in a ‘myth debunking series’ with the snappy title ‘climate
Myths: Ice cores show CO2 increases lag behind temperature rises,
disproving the link to global warming’. So the news that was too obvious
to mention in 2003 was later worth debunking because punters were
starting to think the ‘lag’ New Scientist had kept secret, might matter?
It speaks volumes for how science journalists became activists and how
powerful the Antarctic ice cores were as a form of advertising.
The largest marketing campaign using the ice core results was Al Gore’s
An Inconvenient Truth. Look at the extreme care he took to frame the
graph:
“The relationship is actually very complicated but there is one
relationship that is far more powerful than all the others and it is
this …. When there is more CO2 the temperature gets warmer,
because it traps heat from the sun inside” (Gore 2006)
So he enlarged the graph to 20 square mtres, and talked at length about it,
was aware of how complicated it was, but didn’t find the time to say the
four words; ‘temperature rises before CO2’.
He won a Nobel Peace Prize for what was arguably stage managed
misinformation.
You’d think that on this basis of this level of mis-representation of climate facts
that it would be enough for the scientific community to make a stand for a
correction. But no, the political wheels of science corruption were well in progress.
It’s easier to see the subtleties using total CO2 derivative. This is scaled to show change in CO2 PPM compared to 12 months prior in any given month, with a 12 month moving mean. https://www.woodfortrees.org/plot/esrl-co2/derivative/mean:12/scale:12
There is no question there is a strong relationship to temperature, with best fit to SH SST.
Those using Henry’s law concepts to falsify the temperature CO2 relationship for ocean solubility ignore the massive inputs of organic and inorganic carbon from terrestrial erosion inputs in their analysis. In my work we measure up to 20 tons per acre per year in agricultural settings alone, for example. This enormous amount of carbon input to ocean could be delivered to the atmosphere during warmer SST periods. The Henry’s law analyses showing perhaps only 10-20% of CO2 increase related to SST fail to account for terrestrial C inputs which are readily delivered as CO2 through plant and soil respiration processes in decomposition.
https://agupubs.onlinelibrary.wiley.com/doi/10.1029/2020GB006684?
While this level of erosion continues any direct atmospheric contribution reductions might make little difference.
that’s a cool website you have at https://www.woodfortrees.org/
Fresh water absorbs the most CO2. Ocean salinity has been increasing which would lower the absorption of CO2 and decrease evaporation. My biggest question is what do other forms of ocean pollution do to CO2 absorption and/or evaporation?
We know our oceans are receiving tons of micro-plastic pollution. Is it possible that human pollution of the oceans is raising the temperature of the water due to decreased evaporation? Naturally, some of that heat would also warm the atmosphere and reduce absorption of CO2.
Working through the data empirically it is clear that only up to 15% of atmospheric CO2 increase is related to direct emission to atmosphere from fossil burning. Therefore net-zero emission policies may result in up to 15% reduction of total emission. This will be barely observable. In reality it is likely substantially less than 15%, but this provides an upper bound.
Very interesting graph. River waters and lots of ground water are bicarbonate, and in my graduate studies days were thought to be the major inputs to ocean “carbon” in its various forms. How did the cycle close with carbon dioxide return to the atmosphere? Well, I was taught about the clay minerals on the ocean floor, but in the early 1980s, I was gone from academics into industry and was slow to get the news that researchers began to recognize the importance of hot springs on the midocean ridge system and alteration of oceanic crust.
I have just started to read your linked article. Many thanks for it. Sampling is the achilles heel of all this, isn’t it? — ocean chemistry, atmospheric temperature, sea level rise. In every instance we have sampling done not necessarily where the measurements would be most useful, but where convenient and with stations highly correlated to one another, but treated as independent.
JCM, I don’t know who you are (“my work”), but your 20 ton carbon loss per acre per year by erosion is high by much more than a factor of 10. A little crop yield data disproves your assertion quite readily. Take hay production, for example. According to USDA production data for selected states, sustainable dry hay production per acre per year is only about 1 to 3 tons, yet you claim 20 tons per acre per year carbon loss by erosion. Meanwhile, farmers have long known and used erosion control practices as well as practices to maintain soil organic carbon. Agricultural soils in the U.S. typically ranges from about 1% to 10% organic carbon, higher in moist and colder northern states. So naturally, those 10% soil organic carbon regions only begin with 100 tons organic carbon per acre in the plow layer. According to your estimate, all soil organic carbon would be gone via erosion in only 5 years! Yet we have been actively and successfully farming those regions for well over 100 years. Without organic carbon, soil structure, fertility and tilth would be destroyed.
You treat modern farmers as if they are idiots, when they are in fact some the most sophisticated and knowledgeable of professionals, continually learning and improving their practices.
Now internationally, that is a totally different story. Maybe that is where you get your numbers. Land use change, particularly in S. America and SE Asia and other developing and impoverished regions, is responsible for something like 1/4 to 1/3 of human-caused atmospheric CO2 emissions. If we could stop and instantly reverse poor land use practices in those areas, it would stop anthropogenic emissions growth in its tracks, without even changing our fossil fuel combustion practices. But of course, nobody dares say that, because we are the evil West.
We measure up to 20 ton per acre per year, the average is less, yes. I am not making any assertion about modern farming practices nor did I call anyone idiots. It is common knowledge that tilling fields with heavy equipment has increased the rate of erosion. Organics must be reintroduced by source material application (manure) and incorporating crop residue matter.
regards,
JCM
I should clarify that development of agricultural source material now relies on the use of chemical fertilisers. There is most definitely a net discharge of organic and inorganic carbon from fields. In addition to direct tillage erosion, fields are more exposed to rill, sheet, and gully erosion from storm runoff. There is increasing recognition of this issue and so crop residue cover management for erosion control is of increasing interest, in addition to other erosion control methods.
Just be more specific rather than treating all of planet earth as if it is one huge mismanaged erosion gully. With the numbers you quote, I can only assume you are referring to losses due to wretched management in tropical and developing nations.
Hi JCM..
Someone of my line of thinking, theCO2 is coming out of the dirt
I’ve explained here a trillion times
Start exploring here…
https://www.jstor.org/stable/1938896?seq=1
yes it talks about forests and trees but all farmland was =forest before it became farmland
Rough calculation..
Assume the soil organic layer goes down to 3 metres depth, under a truly ancient undisturbed forest
Lets say 50% of the soil, by volume is organic material. Just as you would make compost for a pot-plant on your windowsill
Thus 1.5 metres depth organics
When fairly dry, 25% moisture, it will have a density of about 660kg per cubic metre
Thus, under one hectare there will be 10,000 x 1.5 x 0.66 tonnes of organics
I make that to be 4,000 tonnes per acre
It is no good coming along now and talking about what is there now in the plough layer
It has all gone
It is floating around in the sky
Reason being = Nitrogenous fertiliser
It primarily feeds the soil bacteria (fungi also) and when their Liebig Limiter is opened right up via additional nitrogen, they go crazy consuming soil organics and making CO2
So there goes vast amounts of CO2 as per the link above
In the process, they produce acidic waste, exactly as we human animals do. We are bacteria factories.
That aidic waste will acidify the soil, something cery well known and is why, when nitrogen fert. first was made available just after WW2, it was supplied (in the UK) as ‘Nitro-Chalk’
Basically Calcium Nitrate – with the calcium put there to buffer the acid created by the bacteria.
Otherwise. soil pH could drop by a whole pH point inside 25 years.
But there is another CO2 source because Nitro-Chalk is no longer available.
Farmers much prefer Ammonium Nitrate, because you get much more nitrogen bang-for-your-buck
But, certainly in England, many farms are on naturally chalky or limestone soils
Thus, the acid created by the bacteria is neutralised by the chalk BUT, releases vast amounts more of CO2
I was gonna point to the gallery at NASA of the original OCO Sputnik data.
It. Has. Gone.
The reason why it went was that it showed HUGE amounts of CO2 hanging over the rrainforests – directly and completely contradicting their narrative that CO2 caused Global Greening.
The rainforest should have had low CO2, not elevated high levels.
The reason, as pointed out on the link, is that ‘escaped nitrogen’ was falling into the forest.
It was feeding the soil bacteria down there and creating both greening and extra CO2
The nitrogen escaping from farms obcviously but also motor vehicles, power stations, cookers, heaters furnaces boilers etc etc etc
Oxides of Sulphur, from those same sources, were also feeding the bacteria
That is the cause of the Global Greening.
What everyone calls ‘Pollution’
No. Farmers are not idiots. They do what they must, what they know they must, to stay in business
i.e. Produce Cheap Food
All the fine words about Lo-Till No Till and soil organics is pure BS in that face of that Prime Directive
And that means using Ammonium Nitrate to stay in business.
If they don’t, they go out of business and someone else takes over who will use Nitrate fertiliser
As long as farmers keep using Nitrate fertiliser, the CO2 will keep rising.
Until of course that start figure 4,000 tonnes per acre created by the ancient forest, is all used up
Then they will be looking at and trying to farm a desert
As I remember, one tonne of organic will get you 2.4 tonnes of CO2
(Don’t quote me)
Yes JCM you are on the exact right track but, the CO2 is primarily blowing away in the wind and not down the streams and rivers
The Alert Reader will now see the jam we are in.
Rising atmospheric CO2 means falling soil organics and there is only a finite amount there.
When it runs out, we all move to Planet Mars. Without going anywhere.
OK. Let’s stop using Nitrogen fertiliser.
Fine. In 3 months time, over 80% of the World’s population will have died of starvation
If we keep using nitrogen, inside 60 years (as calculated and presented by the UN ## in a report of 2015), 99.9% will have perished, because all the farmland soil will be dust and have blown away.
There Is Precedent
And its no good saying that ‘measures have been taken’
Sorry. No.
When the dirt blew away in the Dust Bowl, it did actually blow away.
The horse bolted. Its gone.
Pointless now ‘taking measures’ to prevent another Dust Bowl.
You only had One Chance
and blew it
There’s your choices, take it or leave
## Its out there somewhere,I’ve looked but not found it.
As a start, look for “UN, farmland soil, 60 years, 2015” or any combination of those plus whatever you think may help with a search
That is an interesting viewpoint PoN. I will give it consideration as it very well may be valid. My leaning, though, is to connect various terrestrial sources to the very clear ocean/atmosphere connection of CO2 flux. I do not see the ocean connection in your hypothesis.
Farmers are anything but idiots. The poster above got the wrong impression so I want to be clear. Farmers are paid to produce food and increase yields, which they have done extremely effectively with very low margins. The issue could be with certain business models where cash croppers rent land for short term gain. It is the landowners who should be concerned with the long term investment in soil health and fertility to maintain the value of the land. The most expensive inputs every year are chemical fertilisers. Technical innovations and optimisation of fertility management and soil testing could maximize yields while minimising the cost of inputs. Occasional cover crops, forages, and residue management could be incorporated to maintain organics and moisture content.
JCM
JCM,
In the U.S., the role of federal and state agricultural research and extension is to improve all aspects of the science of production agriculture and then to educate farmers, one-by-one, county-to-county, throughout the nation. To my knowledge, every U.S. state has a an ag extension program. Can we do better? Of course. Continual improvement is the name of the game. I am confident that Canada, EU countries, Australia, New Zealand, etc. have comparable programs. Our experts also expend great effort to export this knowledge to developing countries. Here in Texas, we employ almost 1,000 FTE in agricultural extension. We have a huge library of publications, and agents hold field days, classroom instruction, demonstration projects, and many one-on-one consultations. Here are the stats for a single year (2019):
• Economic gains of more than $486 million for agricultural producers.
• Savings of $107 million (and conserving 3.1billion gallons of water) through wildlife/ecosystem management for 1.3 million managed acres.
• Involvement with 550,000 4-H youth through programs like STEM.
• Interactions with 18.4 million educational contacts via nearly 128,000 educational events.
• Savings of $79.8 million in lifetime healthcare costs by educating residents on diabetes, nutrition and physical activity.
• 5.5 million hours of volunteer time (valued at $139.3 million) by engaging 93,600 volunteers.
Today, we are not teaching till till till, inefficient irrigation, or overloading with expensive inorganic fertilizer.
But back to your 20 tons carbon loss per acre per year figure. That number is excessively high for the developed world. You need to qualify that number with respect to location for it to be believable.
There is no reason to suggest that current US figures are in any way representative of the current global or historic land management practices. It sounds like you are involved with a vast investment of resources to improve land management in your local area. I congratulate you.
It is interesting you quote my figure of 20 ton as 10x your estimation, considering our surveys indicate most landowners under-estimate total erosion by a factor of 10. We are using LiDAR sensors and in-situ measurement in a drumlinised till landscape to asses erosion and nutrient loading to waterbodies of concern. You might be shocked at the slopes that are being farmed.. We work with local crop associations. As I stated prior, 20 ton is the maximum within field erosion measured. It sounds like you are involved in some interesting work but I don’t recommend projecting your local practices to global scale in historic context. Everyone makes due in a variety of landscapes and resources. There isn’t anything in your comments that dispute my original premise.
From a generalized point of view, historically, CO2 increase is proportional to human population. Total cropped area is proportional to human population. Total erosion is proportional to total human population. Today with modern practices less land is required per capita, but land is farmed more intensively resulting in similar erosion rates per capita. Massive volumes of effluent are discharged. It is pointless to argue that you see 2 ton per acre in USA which is 5% of population of earth. I am speaking as a non American so the view that some farms in Texas have a certain erosion rate seems rather arbitrary.
JCM
Peta
More rough calculations.
The world uses about 150 million tonnes a year of N in synthetic fertilisers.
Can you put that in context with tonnes of CO2 produced by people farming , or in weight per area of land or whatever units you are comfortable using.
Looking at order of magnitude effects.
Thanks. Geoff S
The above article just reinforces the adage, so often lost on AGW proponents, that correlation does equal causation.
Joe, Kamala, John, Alexandra, Michael, Greta . . . you listening out there?
No, they are not listening. They already have their minds made up.
The radical Left is not moved by rational arguments.
Some people think if Joe or Kamala were to go the southern border and view the chaos, that they would see the light and change their policty.
No, this misunderstands how the Left looks at things. What is happening at the border is what they want to have happen. The only southern border problem the Biden-Harris administration think they have is the optics of the fiasco. So they censor and try to keep secret what they are doing as much as possible, while trying to speed up the importation of illegal aliens.
If Kamala were to travel to the border, then she would be expected to do something about it, and I don’t think that’s in their plans.
I was encouraged to see the governors of South Dakota and South Carolina come out and say their States will not accept Biden’s illegal aliens in their States. When the South Carolina governor was asked about what he would do if the U.S. government tried to force him to take illegal aliens, the governor said, “In that case, the fight would be on.”
More States should come out and refuse to help Biden import his illegal voters into the United States. Every State has children who need foster parents and every State has homeless people that need help, and Biden wants U.S. States to put their own people last, and service the illegal aliens instead. The governors say they are not going to do that.
Tom, you are correct that when all three branches of the Federal government come down against the natural rights of the people, the only and rightful remedy must be the nullification of Federal tyranny by the people of the states. At present, we’re seeing a handful of state AGs seeking remedy via the courts. But this is doomed to failure given the wide discrepancy between the plain meaning of the Constitution, which limits government, and constitutional law, which has inexorably paved the way for Federal incursion into every facet of our lives. One of the milestones in the latter process was the 1938 Carolene Products case, which basically says that anything the Federal government does is “ok”. Note that this sea-change in the judiciary’s expansion of Federal government’s role came in the wake of FDR’s court packing threat, which is now being repeated under the current regime.
I just downloaded the report. I wanted to have a copy before the James Hansen types decide to “adjust” the data.
The data is not matching the “Science” so needs adjusting
Good. Since we need more Co2 in the atmosphere, not less, we need produce more. Oh, well, the St Vincent volcanic eruption is making up for what little we have reduced of our output. Win-Win.
That’s because the level of CO2 is determined by the Earth’s biosphere. Anthropogenic contributions are only a few percent. We could shut down ALL industry, transportation, domestic electrical consumption, and it would hardly register at all on overall CO2 levels. If the COVID lockdowns proved anything, it’s how little humanity’s activities affect the planet.
Only rich countries will impoverish their poor. Poorer countries wil determinably build towards electricity for all. Try living without it yourself
Where was it established that Nature was Net Zero? Isn’t that an unproven assumption?
It seems very strange that we we have heard so little from the OCO satellites that were supposed to answer this question.
What we did see was some early results that contradicted the NASA CO2 models, then crickets. Nothing some data homogenization can’t fix.
The human average yearly human activity input of CO2 into the atmosphere for the past forty years has been one tenth of one ppm. This microscopic amount has absolutely no noticeable impact on the Earth’s temperature or climate. The increase in the atmospheric CO2 level is almost completely driven by the increase in global broadleaf vegetation caused by global warming.. The mapping based on OCO-2 data support this.
I think the OCO-2 data is “inconvenient” to the human induced global warming-climate change argument therefore it must be suppressed.
No matter what Germany does, what Europe does, what the US does, etc., the CO2 PPM in the atmosphere continues its relentless upward trend.
That means, we should immediately stop what we are doing, i.e., spending hundreds of billions of dollars each year, BECAUSE IT IS NOT WORKING.
That means, we should be reducing ENERGY CONSUMPTION by increased efficiency in all areas, and eliminating energy-intensive activities from lifestyles.
Kerry’s private plane should go, for starters.
Here is a CAPEX estimate for the US and the World, if we were to continue the present nutcase course for the next 30 years.
EXCERPT FROM
https://www.windtaskforce.org/profiles/blogs/world-total-energy-consumption
SUMMARY OF CAPITAL EXPENDITURES, CAPEX
The analysis includes two scenarios: 1) 50% RE by 2050, and 2) 100% RE by 2050.
The CAPEX values exclude a great many items related to transforming the world economy to a low-carbon mode. See next section.
50% RE by 2050
World CAPEX for RE were $2,652.2 billion for 2010-2019, 10 years
World CAPEX for RE were $282.2 billion in 2019.
World CAPEX for RE would be $24,781 billion for 2019 – 2050, 32 years; compound growth 5.76%/y
US CAPEX for RE were $494.5 billion for 2010 – 2019, 10 years.
US CAPEX for RE were $59 billion in 2019.
US CAPEX for RE would be $7,233 billion for 2019 – 2050, 32 years; compound growth 8.81%/y
100% RE by 2050
World CAPEX for RE were $2,652.2 billion for 2010-2019, 10 years
World CAPEX for RE were $282.2 billion in 2019.
World CAPEX for RE would be $60,987 billion for 2019 – 2050, 32 years; compound growth 10.08%/y
US CAPEX for RE were $494.5 billion for 2010 – 2019, 10 years.
US CAPEX for RE were $59 billion in 2019.
US CAPEX for RE would be $16,988 billion for 2019 – 2050, 32 years; compound growth 13.42%/y
THE BIGGER CAPEX PICTURE FOR THE WORLD AND THE US
World More-Inclusive CAPEX
The above CAPEX numbers relate to having 50% RE, or 100% RE, in the primary energy mix by 2050, which represents a very narrow area of “fighting climate change”. See Appendix for definitions of source, primary and upstream energy.
This report, prepared by two financial services organizations, estimates the world more-inclusive CAPEX at $100 trillion to $150 trillion, over the next 30 years, about $3 trillion to $5 trillion per year
https://www.investmentexecutive.com/news/research-and-markets/funding-the-fight-against-global-warming/
US More-Inclusive CAPEX
The ratio of World CAPEX for RE / US CAPEX for RE = 16,988/60,987 = 0.279
A more-inclusive US CAPEX could be $27.9 trillion to $41.8 trillion
The US CAPEX could be less, because, at present, the world is adding a quad of RE at about $58.95 billion, compare to the US at about $102.78 billion.
It is unclear what accounts for the large difference.
Part of it may be due to differences of accounting methods among countries.
NOTE: The CAPEX numbers exclude costs for replacements of shorter-life systems, such as EVs, heat-pumps, batteries, wind-turbines, etc., during these 30 years. For comparison:
Hydro plants have long lives, about 100 years.
Nuclear plants about 60 years
Coal and gas-turbine plants about 40 years
Wind turbine systems about 20 years
Solar systems about 25 years
The biggest mistake in IPPC’s modeling of material balance is assuming that natural emissions of CO2 (which are 20 to 90 times higher than anthropogenic emissions) are completely balanced out each year by natural sinks; yet those same sinks are only able to absorb about half of man made emissions. That way they are able to claim that anthropogenic emissions accumulate in the atmosphere. There is no accumulation in the global atmosphere beyond a year.There is a build up over ice in winter, but all that is absorbed by cold melt waters in the summer. The year-to-year rise in atmospheric concentration of CO2 is the result of a year-to-year increase in natural emissions.
The mapping of global CO2 concentrations based on OCO-2 data shows a direct and clear relationship between the locations of heavy vegetation, especially broadleaf vegetation, and higher levels of CO2.
Emissions went down but levels went up! Did alarmists’ heads explode? Are Greta and AOC having a pity party? Their entire reason for being just vaporized.
And to make matters worse, levels went up but temps went down! Oh the humanity! What a topsy-turvy world we live in. I expect alarmists will start jumping off turbines soon. The cognitive disconnect is just too much. Reality really does bite.
Thankfully, Greta & Co. are immune to reality. The MSM continues to spin disaster scenarios despite what happens in the real world (frosty France for example). So they continue to whine and cry inside an information bubble, insulated from reality.
Please explain why China still has “Most favored nation” status.
They are the worlds biggest polluter and a direct threat to western democracies.
Still unanswered is why China closed its internal borders while telling the world their was no risk in leaving the external borders open.
As a result millions have died around the world while China has reported only a very small number of casualties.
Revoke China’s most favored nation status, as it clearly has not delivered on its promises.
According to the bottom graph, the USA has reduced its CO2 emissions by about 0.8 GT/yr since 2000, and the EU 28 reduced theirs by about 0.6 GT/yr. But China increased their CO2 emissions by about 7.5 GT/yr, India by about 1.4 GT/yr, and “other countries” increased theirs by about 3.8 GT/yr. Even if the USA and EU went to zero CO2 emissions, that decrease of about 8.6 GT/yr would be erased by the increases from China and India alone.
Although China has over 4 times the population of the USA, their increase in CO2 emissions since 2000 is more than twice as large than our decrease, on a per capita basis. For China, 7.5 GT/yr increase / 1400 million people = +5.4 T/yr/person; for the USA, -0.8 GT/yr / 330 million people = -2.4 T/yr/person.
It is completely futile to reduce CO2 emissions in the USA and Europe if the rest of the world (particularly China) won’t cooperate, which would result in energy being cheaper abroad than in the “western world” (North America and Europe), and allow other countries to steal our prosperity.
No matter what is done in the USA and Europe, CO2 emissions and concentrations in the air will continue to increase. We just need to deal with the consequences.
Sea levels will continue to rise at about 2 to 3 millimeters per year, so that sea walls will need to be built around low-lying cities over the next few centuries, but that has been done before, and we have the technology to do it, although it requires burning fossil fuels in earth-moving equipment.
But there is an upside: higher CO2 levels in the air cause plants to grow faster, resulting in more abundant harvests and spreading of forests. Eventually, the rate of CO2 removal by photosynthesis will catch up to the CO2 emission rate, and the CO2 level in the atmosphere will stabilize at a higher level than now, leading to a greener and slightly warmer earth. What’s wrong with that?
There is this interesting paper on CO2 solubility at various temperatures and pressures. The upshot is that a 0.1 C change in the temperature in the deep ocean would change the solubility of CO2 enough to explain the modern increase in atmospheric CO2.
Because of the massive amount of CO2 in the oceans compared with the atmosphere, and because of Henry’s Law, the amount of CO2 in the atmosphere is controlled by the ocean and not vice versa. In other words, anthropogenic CO2 is irrelevant.
So, has the deep ocean warmed sufficiently? Well ‘they’ say that the thermal expansion of the ocean explains as much as half the recent sea level rise. link
Don’t worry. It’s a well known truth that taxing carbon will reduce atmospheric concentrations of CO2 in our lifetimes. Just ask Joe Biden who always picks truth over facts as he himself has stated. The fact that no economic slowdowns have ever affected the Mauna Loa measurement record is a false flag. That’s because the truthful remedy of increased taxation wasn’t implemented. Only politicians who raise taxes can save you from climate disasters, all democrats say that. Why some people resist being saved is what is puzzling them.
Well, as the head chef said to the waiter named Watson, “It’s alimentary, my dear Watson”. The CO2 which was hiding in the oceans decided to come out. Then, when we are back to “spewing” plant food, I mean “carbon” into the air, boom, temps will skyrocket.
Just nonsense!
What is nonsense?
Answer these questions.
1) Do you doubt that atmospheric CO2 is a Greenhouse Gas?
2) Do you doubt that atmospheric CO2 is accurately measured by Mauna Loa?
3) Do you doubt that there has been no discernible change in the increase in atmospheric CO2 concentration in 2020?
4) Do you doubt that emissions were reduced by the loss of flights, traffic, industry during 2020?
5) Do you doubt that anthropogenic emissions are responsible (at least in part) for the rise in atmospheric CO2 concentration?
If you actually believe all five points are reasonable the only logical conclusion is:
Mitigation is unworkable. And therefore wasteful.
So it doesn’t matter what you actually dare to answer.
The world’s political leaders are going to end up drawing the only logical conclusions anyway:
Points 1 to 5 are right and AGW needs to be adapted to…
Or…
At least one of those points is wrong and AGW needs to be ignored.
I think you might err in presuming political leaders can make logical conclusions.
Even standig in front of what ever nonsense you will not recognise it because you don’t know, what sense is.
But typing your comments, everybody see upcoming nonsense 😀
I saw the word’s griff-liar typed.
And assumed it was a heading for his post.
Certainly an apt description of basically everything he types…
Yesterday this trucker did a run up to the Chicago area. To get there I take I-65. Just north of Lafayette, IN is a huge “wind farm. For 9 miles as one drives along I-65 one see’s wind turbines in the fields as far as the eye can see looking east and west.
Yesterday going north at about noon local time almost none of the turbines were turning. The wind was fine and weather was not a factor. .
Au contrare, weather WAS a factor. The wind wasn’t high enough to spin the turbine blades, hence no electricity was generated. And calm conditions are a part of weather. A big part, which is why wind generators are unreliable. Keep on truckin’.
Wrong! There were a few turbines going just fine. The others had their props feathered.
There is much discussion as to whether CO2 affects Earth’s temperatures, bot no discussion on what actually DOES cause global temperatures to change. And that is changing levels of SO2 aerosols in the atmosphere, of either volcanic or Industrial origin.
http://www.skepticmedpublishers.com/article-in-press-journal-of-earth-science-and-climatic -change/
Per Karl Popper,,any hypothesis that is correct must be falsifiable (that is, capable of being empirically tested), and ,the gold standard for its acceptance is its ability to make predictions.
The “hypothesis” that changing levels of SO2 aerosols in the atmosphere will cause temperatures to change is both testable (and has been tested multiple times, and proven to be correct) and capable of making predictions: If SO2 levels are increased, average anomalous global temperatures will decrease. And vice versa.
And further, there can be only ONE correct, validated hypothesis for a given problem, in this instance, Climate Change..
With so much at stake for our (and the worlds) economy, we need to change the paradigm
A long URL, and I made a mistake.
http://www.skepticmedpublishers.com/article-in-press-journal-of earth-science-and-climatic-change/
Burl, you screwed up again!
http://www.skepticmedpublishers.com/article-in-press-journal-of-earth-science-and-climatic-change/
If aerosols were the cause of the temperature change since 1880 then the change would not occur in the patterned way the temperature record shows.
Bill Everett:
The patterned record is BECAUSE of changing amounts of SO2 aerosols in the atmosphere.
.
Changing to a thirty year pattern of alternating periods of rise in temperature and pauses in the rise? I don’t think aerosol release follows such a pattern.
Bill Everett:
What are you talking about? There is no thirty year pattern:of alternating rise and pauses in temperature increases.
You must be using a useless graphical program. The cause of each significant individual change in average anomalous global temperatures needs to be analyzed and understood, which I have done in my article.
It turns out that every temporary increase or decrease in temperatures is the result of random changes in the amount of SO2 aerosols in the atmosphere.
These random changes are superimposed upon a gradual natural increase in average global temperatures, as Earth recovers from the LIA cooling, primarily due to albedo changes. Prior to the LIA ,all glaciers had melted during the 300 year MWP, Those that formed during the LIA are now melting away, because of reduced volcanic activity, as then.