By Joe Bastardi
I see that Willis has referenced an idea I posed on a blog from another source so I wanted to make sure for WUWT I am clear. The last person I want to pick a fight with is Willis (or anyone. I simply observe, but forth ideas, and then in what I do, make a forecast for people willing to look) You notice that while I am a WUWT groupie, rarely do I comment.
The. “Go to” site for me on co2 is the Keeling Curve Site. https://keelingcurve.ucsd.edu/ Its 2 year chart (you must click on it) does show some interesting things. Please excuse my lousy artwork, for along with being a lousy writer, I can’t draw to save my life. But you will get the point. (If you are wondering how I can write books, it is because I have a great editor, and he gets paid a % some other writers have told me is like he is getting combat pay. He is. He can translate Bastardiese, which is a level slightly below pig latin).

Now the blue line represents the late winter leveling off of co2, from what I have been told, the maximum time of year for arctic sea ice. When the ice starts to melt up goes co2 again until the foliage and lack of fossil fuel use in the northern hemisphere takes it back down. (This forms one of the legs of my “no fault” idea to get rid of the co2 fear without crashing our economy. 1) Plant a trillion trees worldwide. There is where the push should be on other governments. It is cheap and environmentally friendly. 2. Nuclear power. We have to get rid of the Jane Fonda induced “China Syndrome” (see the movie)hangover. In fact the only true China syndrome is that China leads the world in true air pollutant and ocean pollutant emissions. 3) Carbon Capture. Anyway, back in spring, when Covid hit, there was a mad rush to say the shutdown was reducing pollutants. It was, true pollutants of which co2 is not one. PARTICULATE AND TRUE POLLUTANTS WERE BEING REDUCED. But Co2 leveling off was like it is every year if you can blow up the jagged rise line you see in multi- year graphs. My observation is that this has been rising along with the increase in SST which is largely natural and cyclical (another argument for another time since there is much about the oceans we do not know. I am a Bill Gray person on this matter) My hypothesis was stated in the article if you read it, but I will rehash it here.
- Oceans are the biggest sink of co2
- The warmer the oceans, the more co2 released.
- The oceans have warmed.
- Co2 has increased.
Of course, our “friends” on the other side of the argument want to argue its co2 that has lead to the warming, and quite frankly I am open to that argument as long as warming persists. I don’t believe it, but BELIEVING something and ABSOLUTE KNOWLEDGE are 2 different things.
I believe in gravity, so do you. That is belief and absolute knowledge. I also believe that the pattern we are in can lead to a lot of snow in the south and the east, and will produce a major period of cold for a few weeks. But that is not absolute knowledge and even if and when it occurs, there will be arguments over it. The big difference I see in this debate over co2, is that while I acknowledge that they have every right to try to assign blame if they wish, the bulk of the people that do that will not look at anything that can challenge them. Even if there is precedent for warming in past times that has had little or nothing to do with co2, but instead as many of us believe, is largely natural. And that should tell you what the real conclusion is, that all our hand wringing over this is not truly about a level scientific argument among people of good will, but a smoke screen for “other things”. ( you can fill in your own ideas on that)
But in fairness to Willis he only looked thru November with his chart if I am reading it right. Look again at the red lines ( again this was in the article that was used as a tease for what was put on WUWT)

Clearly the slope from the min to max last year before the late winter level off ( then as you can see it resumes) was more sharply up than it has been this year. We increased about 5 ppm last year by this time, this year its about 3ppm. Now I think its because of what has been a big down turn in SST since last year at this time. Check this out, the difference in anomalies.

But I wrote this because I have been pushing this idea since summer to watch for this, a natural cause, knowing full well that there would be arguments for Covid style lock downs due to climate (Again I make clear in the article and in my book, my thoughts on this matter)
And I may not be right. I see other arguments, one has to, for the secret to having a chance to forecast the weather in a way that adds value is to making sure the idea one is most skeptical of is your own. Then you go looking for trouble and if you can counter it first, you have a chance. But I wanted to make sure that readers understood, even if wrong, where I as coming from.
To quote Eric Burdon from the Animals:
I’m just a soul whose intentions are good
O Lord please don’t let me be misunderstood.
Thanks, Joe, your contributions are always welcome. My response is as follows:
a) The Vostok ice core shows a swing in global temperatures in each glacial-interglacial of about 10°C, coupled with an increase in CO of about 100 ppmv. Since 1959, CO2 has gone up ~ 100 ppmv … but the ocean has maybe warmed by 0.3°C.
b) The Arctic ice swings every year from about 14 million sq. km. down to about 4 million sq km. That’s a swing of +5 to -5 million square km every year, which is about ± 1% of the global surface. Not seeing how a 1% swing above and below the average would make much difference.
c) The Arctic is not generally known as either a big CO2 emitter or CO2 sink. The biggest sink is the Southern Ocean and the central Pacific.
d) You’ve shown 2 years of data. Here is the average of the 45 years of weekly Mauna Loa data:
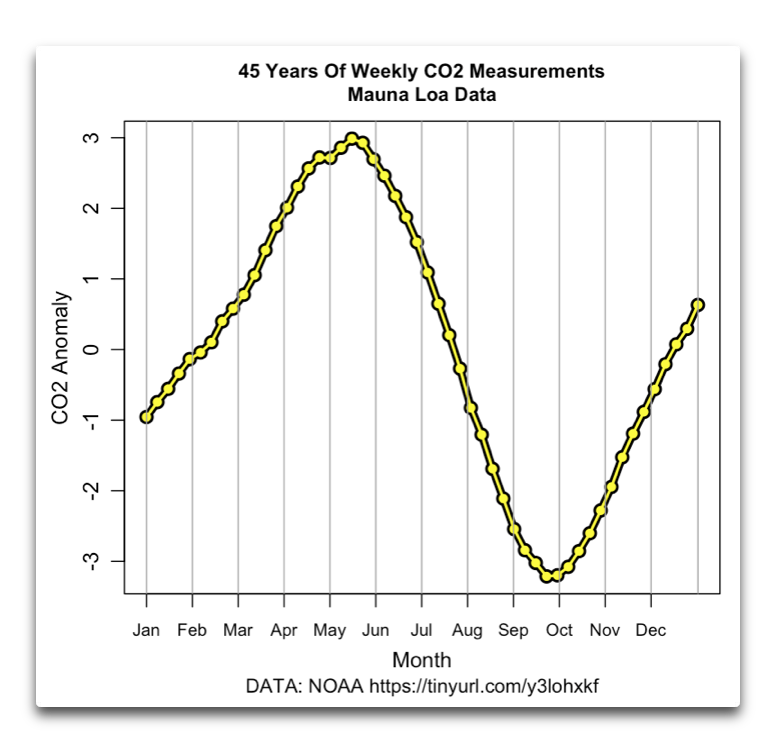
Combining all of those, I’m not seeing how the change in a small bit of ice in the Arctic is causing a large change in CO2.
My best to you,
w.
Willis, it is not the ice that it is relevant here, I think. And I donot think that Joe is saying that. The arctic sea is getting warmer. Some places in the arctic are reporting an increase of 8 or 9 degrees C. That means that the liquid areas where the CO2 sinks, are getting much smaller *(in the arctic). Hence the zig zag, where the CO2 in Hawaii is getting lower during SH winter and increasing during NH winter. Vegetation and emission are red herrings. It is nothing compared to Henry.
Except that more vegetation causes more warming on land. (John Christie et al)
Above the equator there is always some more CO2 as here the CO2 is strongly emitted from the oceans together with water vapor. So Joe is right. The temperature of the oceans is the major factor affecting the CO2 in the atmosphere. But as explained before, pH is also a major factor although it seems nobody has even taken the trouble to calculate how much….
I think we may assume that pressure is constant, although I think I have seen reports that the weight of the atmosphere is not absolutely constant. I just don’t know what the variation is.
to calculate how much…
should rather be
to measure how much…
(It should be measurable, not so?)
Henry, for some unknown period of time you can edit your posts by means of the small wheel at the bottom right of the comment.
w.
Thanks, Henry. The CERES data show a maximum warming (which is indeed in the Arctic) of about 0.3°C per decade. MSU data shows the same, a warming of 0.27°C per decade. Not sure where you’re getting your numbers.
Also not sure about where you get your CO2 data. Here are satellite sources and sinks from the Japanese Greenhouse Gases Observing Satellite (GOSAT) and NASA’s second Orbiting Carbon Observatory (OCO-2). These are in close agreement with estimates based on surface measurements. See here for details.
As you can see, the Arctic is generally a net sink for CO2.
Best regards,
w.
Joe, what happened between 1 and 2? One moment its a sink, a big one, then…
It is actually a sink, so how did you leapfrog to 2?
CO2 exchange happened. Most, if not all, sinks are also sources.
Well yes, but he seems to be arguing rising CO2 level is from the ocean not human sources. How else can this be interpreted?
2.The warmer the oceans, the more co2 released.
3.The oceans have warmed.
4.Co2 has increased
It’s hard to tell whether he really believes it or not. Either way his opinions are influential in some circles so he should be more careful about spreading misinformation given the ocean is a net sink.
just imprecise language
try instead “atmospheric CO2 increased because warmer oceans (while still a sink) absorbed less CO2 than before”
plausible, though as DM pointed out above, lacking much support from Law Dome and etc
there are some oddities in the CO2 record but it’s hard to account for all of the increase without either a major human contribution or some as-yet-unknown factor
Henry’s Law happened.
the amount of gas that is dissolved in a liquid is directly proportional to the partial pressure of that gas above the liquid when the temperature is kept constant.
With the papers of Rex Fleming(1) and most recently from Wijngarden & Happer(2), it seems to me that the negligible effects of CO2, Methane and Nitrous Oxide on at least future GW constitute more or less “absolute knowledge”. That politically motivated journals refuse to publish the data is secondary.
1) Fleming, Rex J.Env.Earth Sci. (2018)
2) https://arxiv.org/pdf/2006.03098.pdf
So, to my layman’s eye, one recurring universal theme appears to be that CO2 levels respond rapidly to changes in temperature, but not the reverse? Well who’d a thunk it! #sarc
Joe, Why on earth would we wish to lower the CO2 in the atmosphere? Co2 is needed for proper plant growth. The open atmosphere does not have enough for proper gene expression in most plants. Take a walk over to the Agriculture Dept. at Penn State on your next visit and ask about the advances made in greenhouse culture with added CO2. At 2500 PPM the plants need less water, less roots, less light and grow bigger. It’s actually astounding. Calling for CO2 removal is calling for a return to famine.
https://joannenova.com.au/2020/12/thursday-open-thread-31/#comment-2388967
I recommend Ed Berry’s new book “Climate Miracle: There is no climate crisis Nature controls climate”
https://www.amazon.ca/Climate-Miracle-climate-crisis-controls-ebook/dp/B08LCD1YC3/
My review::5 Stars.
An excellent, readable book that destroys the scary global warming / climate hypothesis.
Reviewed in Canada on November 11, 2020 Verified Purchase
https://www.woodfortrees.org/plot/esrl-co2/from:1979/mean:12/derivative/plot/uah6/from:1979/scale:0.22/offset:0.14
Author Dr. Edwin Berry demolishes the IPCC’s very-scary catastrophic man-made global warming hypothesis. Ed proves from basic principles that the growth of CO2 in the atmosphere is primarily natural, not man-made. Berry’s analysis is consistent with my 2008 publication that atmospheric CO2 cannot significantly drive temperature, because changes in CO2 lag temperature changes in the modern data record, as they do in the longer-term ice core record. Kuo et al (1990) and Keeling (1995) made similar observations in the journal Nature, but have been studiously ignored by global warming propagandists. “The future cannot cause the past.”
CARBON DIOXIDE IS NOT THE PRIMARY CAUSE OF GLOBAL WARMING, THE FUTURE CAN NOT CAUSE THE PAST
By Allan M.R. MacRae, January 2008
http://icecap.us/images/uploads/CO2vsTMacRae.pdf
https://joannenova.com.au/2020/12/thursday-open-thread-31/#comment-2388969
More on Ed Berry’s recent book “Climate Miracle: There is no climate crisis Nature controls climate” and his landmark paper at https://edberry.com/blog/climate/climate-physics/preprint3/
The world is a big place, and the carbon cycle is never in equilibrium – it chases gradients as they occur, all over the planet. Henry’s Law does work – but locally.
Note the people who contributed strongly to Berry’s paper: Ed Berry, Richard S Courtney, Will Happer, Murry Salby, Hermann Harde and others – I know most of them, and they are certainly among the most intelligent people on the planet. It would be foolish to dismiss their conclusion without doing the work and locating a fatal flaw – which I suggest none of the detractors have done.
It is too easy to shoot-from-the-hip and miss the target. Many years ago, someone called this remarkable relationship “spurious correlation”. It supports Berry’s hypo and is not spurious.
http://www.woodfortrees.org/plot/esrl-co2/from:1979/mean:12/derivative/plot/uah6/from:1979/scale:0.22/offset:0.14
Atmospheric CO2 cannot significantly drive temperature, because changes in CO2 lag temperature changes in the modern data record, as they do in the longer-term ice core record. Kuo et al (1990) and Keeling (1995) made similar observations in the journal Nature, but have been studiously ignored by global warming propagandists. The very-scary Catastrophic Human-made Global Warming hypothesis is falsified, because “The future cannot cause the past.”
Regards, Allan
THE CATASTROPHIC ANTHROPOGENIC GLOBAL WARMING (CAGW) AND THE HUMANMADE CLIMATE CHANGE CRISES ARE PROVED FALSE January 10, 2020
https://thsresearch.files.wordpress.com/2020/01/the-catastrophic-anthropogenic-global-warming-cagw-and-the-humanmade-climate-change-crises-are-proved-false.pdf
CO2, GLOBAL WARMING, CLIMATE AND ENERGY June 15, 2019
https://wattsupwiththat.com/2019/06/15/co2-global-warming-climate-and-energy-2/
Joe — Interesting and logical that a relatively quick change in amount of Arctic sea ice can have such a big effect on global CO2. I’ve been looking at the UCSD CO2 ppm graph points. I see the overall wave has 3 peaks (~3 yrs), each of which rise about 5-6 ppm and then fall. Also, I follow the logic of your article, and thanks for all that. [.I hope we agree so far.]
Now, as a retired refinery instrument/analyzer guy, I thought of one thing — Accuracy.
It has been a few years now, but up to about 2010, I remember the analyzers for CO2 were between +/- 0.5% of reading and/or +/- 5.0 ppm, which ever is greater.
So, IF that accuracy I remember is still true, then is the usefulness of the waves seems wiped out?
because I think 415ppm +/- 5.0 becomes very similar to 410ppm +/- 5.0 ppm
So how can we be talking accuracy of 1ppm.in approximating slopes on the graph?
Also if we can get the 1ppm for analyzer accuracy, is the “chain of custody”, from Mauna Loa to the testing laboratory, clean (no losses of gas, absorption by sample vial, or impurities introduced)?
You have taught me so much over the past 20 years, please help me out on this.
Is there more accurate technology, or are we “reaching” too far, or what did I miss?
Joe Bastardi stated in his above article:
“My hypothesis . . . I will rehash it here.
. . . 2) The warmer the oceans, the more co2 released.”
Sorry, Joe, but this is simply not true as long as the world’s oceans continue to have an average pH above 8.0 (this has been the case for a very long time because the oceans are strongly self-buffered to be a slightly basic solution with an average pH range of 8.1- 8.2).
A common misconception—shared by many, as one can see in the above posts—is that gaseous CO2 absorbed when Earth’s ocean waters are cool will automatically come back out of solution and be emitted back into the atmosphere when the same oceans warm slightly. This is not scientifically correct . . . the physical absorption of CO2 in ocean water is NOT a reversible process that varies with water temperature, nor does it follow Henry’s Law.
There is essentially no dissolved CO2 that exists for very long as a dissolve gas just waiting to be outgassed from ocean saltwater as its temperature increases or as the gas pressure over the liquid water decreases.
If you really dig into the chemistry of how CO2 enters and chemically reacts with sea water (understanding such things as the Revelle factor and, most importantly, the Bjerrum plot), you will find that CO2 gas “solubility” into the ocean is not a reversible process, directionality depending on water temperature, as long as the water pH remains above 8 or so. At the current ocean average pH of 8.1-8.2, far less than 1% of the CO2 entering the ocean remains available as dissolved CO2, a portion of which might possibly come out of solution gradually with increasing ocean temperatures.
Basically (pardon the pun), an insignificant amount of CO2 remains as a gas in aqueous solution in the world’s oceans, and might therefore be available for temperature-induced “outgassing” (see Figure 1, the Bjerrum plot, and the associated detailed, elegant text explanation for this at https://www.soest.hawaii.edu/oceanography/faculty/zeebe_files/Publications/ZeebeWolfEnclp07.pdf ).
Au contraire, please see:
https://wattsupwiththat.com/2021/01/08/a-response-to-a-co2-oddity/#comment-3160232
Alan, the fact that changes in global LAT CO2 lag changes in global LAT temperature in the modern data record as well in the paleoclimatology distant past (the main argument of the reference you linked) does not mean that the physical chemistry of Earth’s saltwater oceans at pH levels above 8 is invalid.
This fact could be explained by many other mechanisms, such as:
1) plant biological processes . . . “The study shows that as global temperatures increase, the amount of carbon dioxide released through plant respiration will increase significantly.”—source: https://www.anu.edu.au/news/all-news/plants-release-more-carbon-dioxide-into-atmosphere-than-expected
2) animal biological processes . . . the activity of animals and their populations, thus their metabolic generation of CO2, tend to increase with warming ambient temperatures
3) abiological processes . . . such as the decrease in calcium carbonate solubility with increasing water temperature, thus reducing CO2 “sequestering” in rocks (such as limestone) with increasing global temperatures.
Each of the above would, of course, have time delays between the driving factor of increasing warmth and the resulting factor of increasing atmospheric CO2 concentration.
There are likely other mechanisms that could come into play to explain the “lagging CO2” response to whatever is the primary driver of global LAT temperature changes.
As I explained, largely by reference to the URL I provided, outgassing of CO2 from Earth’s oceans is not a viable explanation . . . that is, unless one wants to assert that in the recent past (say, the past million years) the world’s oceans had an average pH closer to 7 than to 8 . . . and good luck with that.
http://www.soest.hawaii.edu/oceanography/courses/OCN621/Spring2010/Biomass_lecture.pdf gives the oceanic biomass as 10^9 tonnes plankom biomas, with a turnover time of .02 to .06 years, compared to a turnover time, of landed biomass of 9 – 20 years. Note (as noted above) most of the oceanic biomass is in the Southern oceans and central Pacific.
LW from CO2 cant warm the ocean, it can only cause it to retain more energy that it got from SW, but the amount is tiny. The Tarangoa experiment got about 0.2C for 100 watts increase in skin temperature.
So yes, the sea is such a big CO2 sink it out weighs human production, so while NO2 clearly reduced during lockdown, CO2 didnt. It didnt make one damn bit of difference.
COVID made us run the ‘no more CO2 ‘ experiment for three months, and the results clearly prove man in not a significant source of CO2, oddly.
Thanks, Matthew. I’ve looked at the Tangaroa data, and I find nothing about ocean warming from longwave. Do you have a link to where they drew that conclusion?
Next, LW from CO2 can definitely leave the ocean much warmer than it would be without CO2. See my post called “Radiating The Ocean” for four different chains of reasoning supporting that conclusion.
Next, I fear your claim that CO2 and COVID “clearly prove man is not a significant source of CO2” isn’t true. The reason is that the annual variations in CO2 swamp any possible changes from the lockdowns. See my post, “Locking Down See Oh Too” that details the the issues.
My best to you,
w.
Here you so, the SAGE experiments on the Tangaroa ship, it is pretty well known since it is the only, so far as I know, experiment like this,
http://www.realclimate.org/index.php/archives/2006/09/why-greenhouse-gases-heat-the-ocean/
We know LW cant penetrate more than a molecule or so, all it can do is warm the very surface skin of the ocean. But the warming is tiny, as you will see from this experiment.
“the annual variations in CO2 swamp any possible changes” If annual changes swamp what man produces then man is not a significant producer.
Look at mans CO2 production since we went through 400 ppm, a few years ago. We are told that is due to us. But when we cut CO2 production back 20%, and there is absolutely NO change at all in global CO2 increase, you have to conclude that man is not a significant player.
Re your link. Your first error is saying CO2 can penetrate a mm, it cant, it is much less, less than 10^-5 meters
The cool layer is half a mm thick or so, heat cant conduct up hill.
Yes the cool layer does go away, when the wind is above 12 m/s I read recently, but this also increases the latent loss. Apparently a hurricane can suck 1000 w/m out of the sea through evaporation.
And you cant say ‘where does it go then’ as proof it does go into the ocean. Thats called circumstantial evidence.
But it is clear that LW cant penetrate more than a few molecules, and the warming effect of this is tiny, and due to retention of energy obtained from shortwave.
(Note in the SAGE data there is no ‘time of day’ spread to the data. This warming effect looks to be pretty quick, it doesnt take time to happen, and once warmed, sits at that new temp in a stable way).
I asked several questions in my post. I fear you haven’t answered any of them. Please come back when you have answers.
Here’s another one. How far does LW penetrate into rock? Less than into the ocean, and yet the rock warms up. Go figure.
Whether LW is absorbed in millimeters or micrometers doesn’t matter. If the energy is NOT warming the ocean, where is it going?
w.
PS-Using RealCimate as your source marks you as a newbie. Those prix banned me for asking scientific questions. Don’t believe a word they say. If they say it’s raining … look outside. Among others, a main player is Michael Mann … see here for what a wonderful man he is.
He also was up to his ears in concealing the Climategate issues. And his so-called “exonerations” are a sick joke.
I did answer tham, I gave you a link to the Tangaroa data, a graph showing LW penetrates less than 10^-5 meters and why if mans CO2 caused the 400 to 415 ppm increase, cutting it back 20% should have reduced it.
“PS-Using RealCimate as your source marks you as a newbie.” Oh come on. RealClimate is a joke, but its the only link to the Tangaroa (SAGE) experiment i could find. It is still valid.
Ignoring data because you dont like the link is evasive. Its the kind of things alarmists do. Dont be like them.
“How far does LW penetrate into rock? Less than into the ocean, and yet the rock warms up. Go figure.”
Rock hasnt got a cool layer because of evapopration. Thats why LW heat cant penetrate the ocean.
“Whether LW is absorbed in millimeters or micrometers doesn’t matter. If the energy is NOT warming the ocean, where is it going?”
It does matter, it means the energy can not penetrate water. You cant say ‘oh, I cant explain it, so it must heat the ocean’. That is as bad as an alarmist saying ‘i cant explain 20th century warming, it must be co2’.
It isnt up to me to show where the energy goes. It is up to you to prove it goes into the ocean. It cant, it is impossible. It doesnt penetrate water to any meaningful depth and cant conduct up hill.
The sun heats up the rocks and the oceans. LW is from both types of surfaces, hindered from radiating in their full black body spectrum directly to the space by the absorbing/emitting components in the atmosphere, which although colder than the surfaces, being much warmer than the space at 3 K.
Kind regards
Anders Rasmusson
Matthew, here are my four questions, and despite your claim, you have NOT answered them:
Next, you say:
It appears you miss my point. Energy can neither be created nor destroyed. If it is absorbed by water, it must heat that water … that’s the nature of absorption of thermal radiation.
I say that that warmed water transfers some of the heat downward by both conduction and turbulence to lower layers, as is described in great detail in the JGR study entitled
Heat transfer in the top millimeter of the ocean.
And at night it leaves the ocean warmer than in its absence by delaying the onset of the daily nocturnal overturning of the ocean, a factor you don’t seem to have even considered.
And some, as you point out, goes into evaporation and radiation … but without the DWIR providing that energy, it would all have to come from the heat in the ocean, and as a result the ocean would cool very fast.
You say the warmed water does NOT transfer the energy downwards … if so, where does it go?
Finally, if you ever accuse me again of “ignoring data” or being “evasive”, this discussion is over and you can osculate my fundament. I do neither. I tell the truth as best I know it and I answer all questions as best I can. I am operating in good faith, and screw your ugly accusations to the contrary.
w.
OK< let me say it all again…
#1 it isnt a mm, it is less than 10^-5 m, and there is the cool layer meaning heat cant conduct. Thats the difference between water and rock.
#2 I dont care, and it isnt my job to explain it. The fact is it cant conduct down, only raise the skin temp a tiny amount, -.2 C per 100 watts according to Tangaroa. Data you deride because the only lik=nk I can find to it is on realclmate.
Others have suggested it is lost immediately in evaporation. That is a reasonable suggestion, but I haven’t seen it validate through experiment. Or perhaps it is reflected in some way. WHo knows.
#3 same as #1. Cool layer. The cool layer doesnt go away at night.
#4 When you make the lip of a dam higher with bricks, and the level goes up inside the dam. What is that level made of, bricks or water?
The effect of raising the skin temperature, because of LW, is to cause the ocean to retain more energy. Energy it got from shortwave. Energy that can penetrate water tens or hundreds of meters.
But the skin has almost no mass, it cant absorb any significant quantity of LW energy.
You JGR paper. “Turbulence dominates below .5 mm at winds below 10 m/s” . I have read 12 m/s, close enough.
LW cant get through this 0.5 mm barrier. Thats the problem. As wind speed increases I imagine the picture is very mixed. The cool layer will thicken as more water evaporates, to the point where the water is mechanically mixed by the wind, having the surface sheared off. What this does to the energy flow I dont know, but I read hurricanes can cause 1000 w/m heat loss from the ocean, which I imagine is through evaporation due to high wind.
So I am not convinced the cool layer really does go away as it gets windier. Perhaps it goes away between 10m/s and 20 m/s, then comes back as increased heat loss through evaporation increase. I dont know, it needs testing.
So no, I am not at all convinced LW warms the ocean itself.
shades of the “missing ocean heat” that alarmists kept insisting must be deposited in the part of the ocean where we can’t measure it
Willis re 4: argument by induction and inference is always dangerous — if experiment truly rules out DLR as a major source of warming then doubtless we’ll discover Nature has once again outsmarted all of us in a novel way
I say again:
We know from measurements the ocean radiates heat at ~ 390 W/m2
We know from measurements that the sun warms the ocean at ~ 170 W/m2
You claim that the known downwelling thermal radiation, that is ~ 340 W/m2, does NOT warm the ocean but it warms the land.
So under your claim, the ocean is out of steady-state by some 340 W/m2 or so.
Now, you are free to believe that there is some secret energy source operating, a source twice as large as the sun, a source that is warming the ocean but not the land, a source that no scientist on the planet has ever dreamed of, a source that has escaped detection for the entirety of human history.
Me, I shave with Occam’s Razor …
w.
“You claim that the known downwelling thermal radiation, … does NOT warm the ocean but it warms the land.”
Land is not evaporating. Land does not have a cool layer.
Land is not heated from within by visible light.
Seriously, there are so many physical differences between water and land that your argument is baseless.
Your model, flat earth, no day and night, that is giving you these simple figures, 160 watts in, 360 watts out is probably too simple.
But again, let me restate, DLW can cause the ocean to be warmer by forcing it to retain more energy that it got from DSW.
When you add bricks to the lip of a dam the level goes up. That increase is from water, not bricks.
DLW are the bricks, DSW is the water.
This is what the Tangaroa experiments found.
Matthew Sykes
January 16, 2021 1:04 am
That’s not my argument, as evidenced the fact that I start by saying “your claim …”
I merely put it in to clarify that the ~340W/m2 of missing energy has to be some special type of energy that does NOT warm the land but warms the ocean.
First, my model is NOT “flat earth”. My figures are those from the CERES satellite … which doesn’t rotate around a flat earth.
Next, yes, I average the day and night values … and? That’s what is done by all scientists with all of this type of data unless they’re interested in the diel variations. But that’s not what is going on here.
This, in another form, is what I’ve been saying all along. From above:
Now, you say that if you add bricks to a dam the water goes up … but that increase is from water, not bricks.
That’s like saying that if you put on a jacket you end up warmer, but the increase is not from the jacket … really?
Then why does it only happen when you put on the jacket?
Anything that slows heat loss from a constantly heated object will leave it warmer than in its absence.
Above you said:
I gave you a wonderful link that discusses in detail the ways that the heat can be mixed down. It’s called Heat transfer in the top mm of the ocean. It seems maybe you didn’t read it. You can take your mistaken ideas up with the authors.
Or you could read the study and learn something. They discuss and give the size, physical processes, and nature of the various ways that heat in fact does mix downwards.
In addition, despite re-reading the study, I can’t find the claim in the Tangaroa study claiming that DLR can only raise the surface temperature by “a tiny amount”, 0.2°C per 100 W/m2. But it may be there and I can’t find it, wouldn’t be the first time. So let’s assume for the sake of discussion that that is true.
That means that since the DLR is ~ 340 W/m2, it can heat the skin temperature by 0.7°C … hardly a “tiny amount”. In fact, the day to night variations in equatorial SST are generally only about 0.5°C. So your “tiny amount” is greater than the day/night temperature swing of the open ocean? See here for details on the day-night swing.
Next, you say below:
We are looking for a missing energy source that is on the order of 340 W/m2 … and your link says nothing of the sort.
Next, consider how that would work. If the ocean floor is putting out 340 W/m2 at the bottom and the sun adds 170 W/m2 at the top … where would you expect to find the warmest water?
And the fact that you haven’t thought it through that far, and yet you are willing to use it as “evidence” to support your misunderstanding, means I’m wasting my time discussing this with you.
So I leave you with my warmest wishes and regards, and with a clear message:
I’ve said my piece. You are free to respond or not.
I won’t.
Stay well,
w.
“Now, you say that if you add bricks to a dam the water goes up … but that increase is from water, not bricks.
That’s like saying that if you put on a jacket you end up warmer, but the increase is not from the jacket … really?”
The really important thing all this impacts is ECS and TCR.
If there is no ‘ocean heat uptake’ of LWR from CO2, then ECS and TCR are one and the same thing, and there is no ‘baked in warming’ no ‘warming commitment’.
That is why the difference between bricks and water in constituting an increase in the level of water in the dam is so importnt.
Bricks are LW, water is SW.
If the level was because bricks had been dumped in the dam we would have a problem, we have ‘ocean heat uptake of LW’.
If the level is water, we dont.
It is that simple, so regardless of what your flat earth (and it is, it assumes constant DLR on every square meter, no latitude affects, no day night effects, etc. And that IS important, because the equator is heated by SW, yet the entire surface emits LW, unless it has sea ice, in which case it is insulated) model says, LW itself does not warm the ocean, but it can cause an ocean warming.
And very clearly TCR and ECS are the same, and quite low.
The 0.2 C per 100 watts is the graph.
“That means that since the DLR is ~ 340 W/m2, it can heat the skin temperature by 0.7°C … hardly a “tiny amount”. In fact, the day to night variations in equatorial SST are generally only about 0.5°C. So your “tiny amount” is greater than the day/night temperature swing of the open ocean? “
Tiny? We are talking about 3 watts from CO2. The impact of CO2 is tiny, minute.
As for the 0.5 C day night variation in tropical SST, this is due to the absence of DSW in the night time I take it, because the DLR is probably the same, or close enough, given day and night air temps are often very similar over water in the tropics.
Oh, something else, geological heat flow could be much higher.
http://www.plateclimatology.com/discovery-of-massive-volcanic-co2-emissions-puts-damper-on-global-warming-theory
“ it has become clear that geological heat flow and chemically charged heated fluid flow into our oceans is far more influential than previously thought and possibly the root cause of changes to our oceans”
This is entirely feasible, so rather than suggesting some impossible physical process to balance your heat in, heat out model, perhaps look at this.
As regards the complete lack of change in global CO2 levels during lockdown, when NO2 fell off the plate, this article also says. “Natural volcanic and man-made CO2 emissions have the exact same and very distinctive carbon isotopic fingerprint.”
Perhaps this is the massive carbon cycle that so dwarfs mans, that any change is irrelevant.
I do not disagree that geological heat flow could be an important factor, but I do have a problem with the statement that: “Natural volcanic and man-made CO2 emissions have the exact same and very distinctive carbon isotopic fingerprint”; this is absolute rubbish. If anyone can provide better data I would be interested to review it.
1. The δ13C-CO2 content of man-made emissions is estimated by NOAA at -28 per mil (https://www.esrl.noaa.gov/gmd/outreach/isotopes/c13tellsus.html).
2. The following linked example of volcanic emissions gives the δ13C-CO2 as -4.4 per mil (https://agupubs.onlinelibrary.wiley.com/doi/full/10.1002/2016GL068499). (Results for your favorite volcano may vary.)
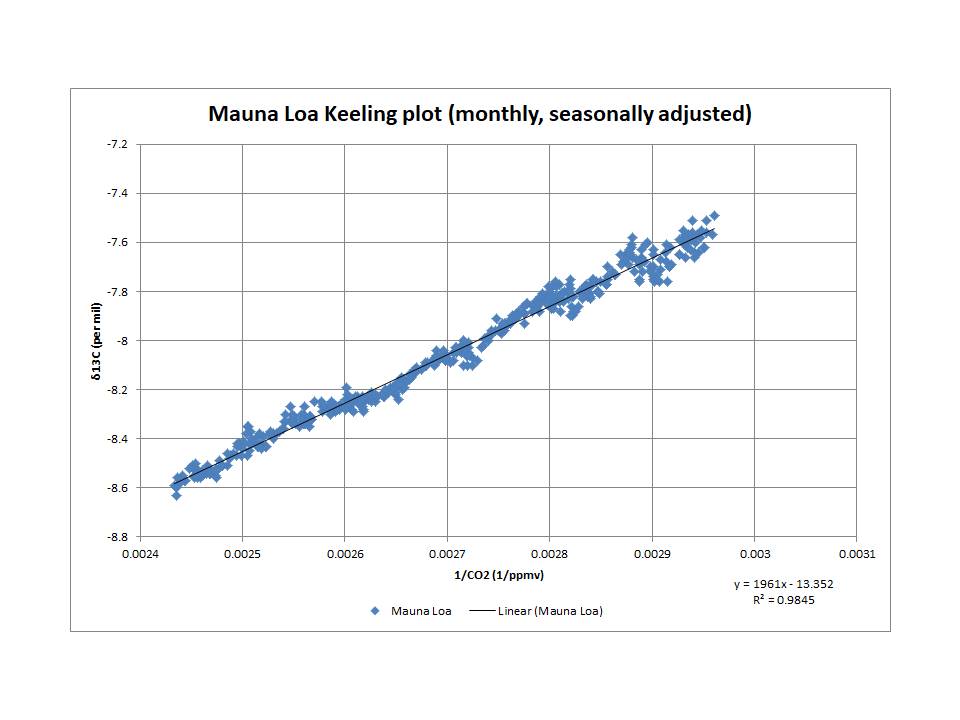
3. The actual observed increase in atmospheric CO2 has a net δ13C-CO2 of -13 per mil:
Apparently CO2 given off by plants has a particular isotope make up to that from the ground.
The assumption is that all CO2 from the ground got in the system because of man. This article suggests volcanoes also put it there, and in quantities so vast it dwarfs mans production.
Why isnt that feasible?
I did not comment on the feasibility of any hypothesis, though I did acknowledge that “geological heat flow could be an important factor” – I said “could be” because I have not studied this in any detail. My point was that a statement about carbon isotopic fingerprints, which you had quoted from your linked paper, was demonstrably incorrect and provided the evidence for the validity of my statement.
Joe
I have learnt a lot about CO2 profiles by looking at the wind direct during all of the seasons. While it does not explain all, as other actions are at play annually that contribute to the seasonal profile, it gives a good basic understanding of the source of the atmosphere that is passing over the sample station. That is, where it originated and passed over.
On the earthnull imaging link below, the atmospheric height is set at 700mb, the closest to Mauna Loa at 680mb.
Also look at Barrow Alaska, it is at the center of a rotating air mass that remains in place almost all of winter, with source from Asia. That is why the winter peak flattens out over the winter months.
Its worthwhile to take the time and look at the entire season of what you are writing about.
Regards
https://earth.nullschool.net/#current/wind/isobaric/700hPa/orthographic=-162.92,22.48,387/loc=-156.918,21.063