Guest Post by Willis Eschenbach.
I saw an article’s headline the other day. It said “Is COVID Or Nature Slowing The Increase In CO2”.
So I thought I’d take a look. Here’s the Mauna Loa data. Top panel is the increase in CO2. Bottom panel is the month-over-month change in CO2.

Go figure. One thing is clear.
The rate of increase of CO2 hasn’t changed in the slightest. I offer up no explanation for this … but it doesn’t bode well for those claiming that we need COVID-style lockdowns to reduce the CO2 levels.
Best of the New Year to all,
w.
Thanks for the update, Willis. Happy and Healthy New Year to you and yours.
Regards,
Bob
The graphs by Willis are not informative. This surprised me.
1 Go to this site:
https://www.esrl.noaa.gov/gmd/ccgg/trends/
2 Click on Interactive plots on opening page
3 A graph will open showing monthly CO2 average
4 Bottom left of this graph, there is a Slider
5 Move this Slider to the right until about 2010 is the beginning
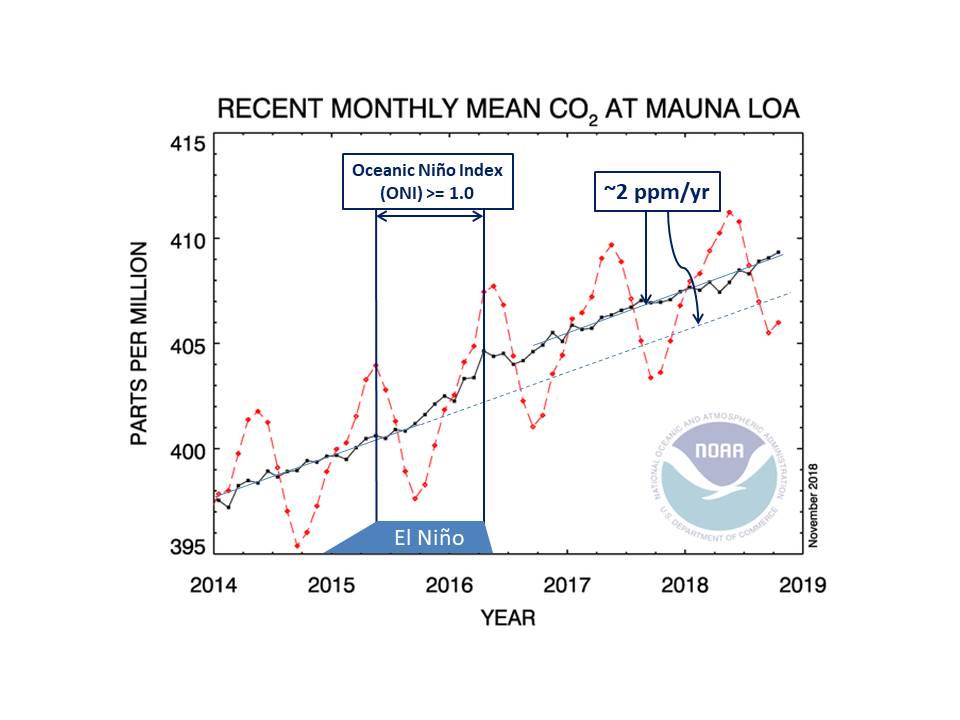
6 Look at the steady yearly rising , low and high levels until 2015-2016
7 At 2015-2016 there is an abrupt increase still steady today due to ENSO, El Nino
8 We can see the same when moving the slider to previous El Nino, but not as pronounced.
9 Note that all the earlier increases in CO2 did return, this is important.
10 If the current EL Nino returns, as ENSO started moving to Neutral and now slightly toward El Nina and CO2 also comes back to the earlier, this would be quite interesting.
11 It would be possible to imply that CO2 increased due to El Nino.
12 This site would help to do this since both CO2 and temperature anomalies are plotted:
https://www.climate4you.com/
13 At this site, under Keep Updates: click on Temperature and CO2 listed items
14 A graph will open showing both Temperature and CO2 for several El Nino prior to this major one
15 The temperature was rising before CO2 was. The temperatures as with ENSO have now beginning to decrease, but not yet CO2 in this last episode. If ENSO continues to decrease as well as this baseline increase in CO2 seen after El Nino, it would be plausible that variations in CO2 can be due to ENSO. Not that this is a major contribution but certainly a lot more important that “human industrial emissions” of CO2.
rd50
January 5, 2021 4:59 pm
Say what? I just looked at the NOAA site. I see no difference between my data and theirs. Here’s theirs.
Compare that to my graph:
Every up and down, every peak and valley, is the same in both. Where’s the difference?
w.
Take a look at the graphs I submitted. What you submitted is junk. Very surprised by what you submitted. You usually provide very nice analysis. Not this time.
I cannot see any difference from what Willis showed. I certainly cannot see “At 2015-2016 there is an abrupt increase still steady today due to ENSO, El Nino”. There is a bump, not a distinct lasting increase. Or would you say that 97-98 was an abrupt increase as well?
Obviously you can’t see this from the junk graph Willis submitted.
Just go to the my submission above. The graph from NOAA is what I used. No problem seeing it.
rd50, As Anders said, there is no difference between the two graphs, except I put in the trend line specifically so I could reply to claims like yours … every notch, every peak, every wiggle is the same in the two graphs.
Why?
Because I used the same data.
w.
PS–It’s easy for someone hiding behind an alias to make any kind of claim, because unlike me and many more, you can walk away and never have to admit your errors or take responsibility for calling my work a “junk graph”. Charming.
It was very light and poorly explained. Not up to Willis’ usual thorough standards.
It does seem that CO2 growth 2020 was bang on the average of the last ten years. No sign of a significant decline for all the pain we’ve gone through.
https://www.esrl.noaa.gov/gmd/ccgg/trends/gr.html
It looks like Willis was using data with the annual cycle removed. That was not stated. That is why the second graph look improbable as “monthly difference”.
Remember and beware Willis,
The right kind of lockdown hasn’t been tried.
I would give you a +1, but I’m afraid your statement is all too true. 😒
You could give him a DoublePlusOne, and maybe the New World Order will look kindly upon you.
“The right kind of lockdown hasn’t been tried.”
I think that’s a subject worth exploring. What is the right kind of lockdown?
Suppose SARS-Cov-2 (the Wuhan virus) was 10 percent lethal the way SARS-Cov-1 (circa 2003) was? Fortunately, SARS-Cov-1 was not very infectious, only infecting about 8,000 people of which about 800 died.
So if we really had to lockdown people on a family basis, how would we go about it to the best effect?
Assuming everyone in the family starts out uninfected, the way to keep them uninfected is to isolate them together and the family will have to designate one of their members to do the shopping and other outside chores, and that person will have to remain isolated from the rest of the family.
That’s my initial thought.
We need to think about what we would do in such a situaton because such a situation could be just around the corner.
But will that work against an airborne virus that seems to be endemic? 😕
(Apologies for drifting off-topic.)
The only real solution is to develop treatments and vaccines for such things, as fast as we can, and avoid the virus as much as we can until that happens.
Emerging corona viruses seem to be the ones that scare the infectious disease specialists the most. This Wuhan virus vaccine will probably give some level of protection from other corona viruses. It’s been claimed that people who had the SARS-Cov-1 virus had attained some immunity to the Wuhan virus.
The Wuhan virus epidemic has been a learning experience (the good and the bad) that will serve us well in the future, as will the medical advances being made as we try to get a handle on the Wuhan virus.
I imagine the medical field is going to be one of the places to be in the future. Biology is pretty exciting, and there is so much to discover. And you can save lives doing it, too.
I hope you’re right. 🙂 I’d like to see some good come out of this mess.
Willis, your conclusion is spot on. NOAA suggests that the absence of a trend may be due to the length of time required for CO2 to show a change. We’ll see.
Forrest
I find NOAA’s suggestion difficult to believe. A look at the Mauna Loa daily data shows a close correlation between the annual maximum CO2 levels and the leafing out of trees in the Northern Hemisphere. It looks to me like there is a lag time of only a few days, at best.
Precisely!!!
The change in CO2 emissions due to the lockdowns is tiny compared to these annual cycles.
Of course they are and we all knew that in advance. However they correspond to 35% of global economical halt and, according to the alarmists, this slowdown should matter. How many years of 35% reduction in global econnomy (more than 1/3) do we need then to make the effect noticeable in the global CO2 budget? See how the main argument of the alarmists is flawed?
What matters is not economic activity, but the amount of fossil fuels being burned. The two are not as tightly linked as you believe.
There was about a 10% drop in fossil fuel use, and that only lasted for a month or so. Amounts consumed rapidly rose back towards normal.
they are probably quite a bit more linked than you think, global primary energy usage is still around 90% fossil
Then why all the concern? These people seem to invent catastrophic situations to fulfil their life or something.
Let’s do the math… they claim anthropogenic emission dropped an average of 7% for all of 2020, yes? And according to IPCC AR4, the anthropogenic component of total CO2 flux is 3.63%, yes? And atmospheric concentration of CO2 is 0.0415%, yes?
So… we start with 415 ppm total atmospheric CO2 (natural and anthropogenic).
3.63% of that is 15.0645 ppm (anthropogenic)
7% of that is 1.054515 ppm (decrease due to anthropogenic causes by dint of the lockdowns).
I dunno… seems like an awful lot of economic devastation for such a small decrease. And they want to more than triple the effect… IOW, they want to triple the number of businesses closing, the number of people declaring bankruptcy, the number of people becoming jobless and homeless… these climate loons are dangerously deluded. They’ll destroy your life without blinking an eye because they believe they’re doing so ‘for the greater good’. And that sort of radicalism is the most dangerous kind.
I fully agree with your comment.
The CO2 emissions of human origin dropped about 17% during the worst period of the 2020 year Covid pandemia.
However there is no noticeable difference between 2019 and 2020’s shape of the detailed curve of CO2 rate in the atmosphere, though the 2020’s zigzag of the seasonal difference between NH and SH is clearly drawn as it was since decades:
https://www.esrl.noaa.gov/gmd/webdata/ccgg/trends/co2_trend_mlo.pdf
In my opinion the human CO2 is utterly dwarfed by the natural CO2 emissions.
Will we get any explanation from the IPCC regarding this awkward oddity ?
In your “opinion” its dwarfed? In other words in your opinion the human cause of the rise from 280ppm to 415ppm is questionable? Where on earth did you get that opinion?
Anthropogenic CO2 has been accumulating slowly for 150 years which explains why atmospheric concentration has increased by almost 50% in that time period. We’ve emitted twice as many billions of tons, yes billions of tons, as the increase indicates, but natural sinks have absorbed about half of our emission.
Human CO2 emission rates are obviously a lot higher these days than they were in 1850, so we can expect that concentration increase to contintue to accellerate – slowly – at several ppm pa. None of that is my opinion, nor is it Willis’, nor Joe’s, nor should it be yours.
Willis has linked to Joe Bastardi’s opinion piece where Joe is courageously suggesting a warming ocean is to blame fo… wait, what? Really Joe? Really Willis? C’mon.
What was that you were saying about Wikipedia the other day?
Sadly it takes one of the resident ‘alarmists’ (and a helping of irony) to try to correct the misunderstanding… and now watch the negatives pile up in response.
GREAT NEWS for the planet, hey Loy.
All that extra CO2 providing LIFE FOR ALL CREATURES ON THE PLANET
And as you continue to prove…….
There is NO EVIDENCE of any warming effect, or any other negative effect of increased atmospheric CO2
Yes, warming oceans release more totally beneficial CO2
CO2 does NOT cause any ocean warming
.
The curve before 1960 when Mauna Loa started is junk. In 1941 Kreutz made measurements of CO2 at least 3 times /day at 4 heights continuously for 1.5 years. He found daily and seasonal variation of CO2 while measuring radiation, atm pressure, precipitation, wind speed and wind direction. The peak CO2 measurement was over 400ppm (adjusted for wind speed and wind direction. In the 1940’s there were also two other independent measurements of CO2 in the atmosphere one in India and one in Norway confirming CO2 over 400ppm. There are indications that measurements around 1900 were over 350ppm.
Callendar “selected” his chosen ppm very carefully.
They knew they needed to start low, to show an increase..
…. so the selection process became obvious
It is highly selective set of data points he chose, always the low ones.
Has anyone post ALL of these data points into a chart with a trendline?
can you please add the source of this graph?
“the human cause of the rise from 280ppm to 415ppm”
What a strange position. What ever gave you that idea?
“Human CO2 emission rates are obviously a lot higher these days than they were in 1850”
CO2 concentrations are higher today than in the 1930’s, too, but it’s not any warmer than in the 1930’s. That contradicts the alarmist claim that CO2 is overheating the atmosphere. CO2 doesn’t appear to be heating the atmosphere at any level that can be measured. So, not very much.
That should tell you something….
Sounds like lolly negotiated higher wages for when he causes negative votes.
It means that he/she/it KNOWS he is talking a load of BS.
Interesting.
Hmmm.
Totally bogus, lolly!
You are worshipping a manufactured graph to falsely imply causation, lolly!
Even though researchers are unable to show correlation, let alone causation.
The left side and the right side metrics are falsely adjusted to paint a fake picture.
Lolly pulls the classic “red herring” “logical fallacy”. i.e. swap in his own erroneous viewpoint.
That is, besides lolly’s typical usage of the logical fallacy argumentum ingorantium, the argument from ignorance.
Lolly demonstrates that: “Falsus in Uno, Falsus in Omnibus”, i.e. false in one thing, false in everything.Or in simple terms, typical lolly.
Correlation is not evidence of causation!
Yes it did drop about 10%, but it only stayed that low for a month or so. Amounts quickly started rising back towards normal.
No, the peak drop of the CO2 emissions during 2020 was 17% (I don’t remember which month). For the full year 2020, the average drop they calculated is 7%.
17% would be noticeable with a small curve inflexion.
https://www.esrl.noaa.gov/gmd/webdata/ccgg/trends/co2_trend_mlo.pdf
No matter how I look at that graph, each year shows the same up and down- peaking in late May. For a variable that is supposed to be causing major atmospheric heating the graphs don’t obviously show it.
Since people do burn billions of tons of hydrocarbons every year human CO2 is obviously a fairly large contributor. The question really is: What else is producing a significant amount of CO2? The measurements of these other effects seem to be either “not that much” or “hidden in the noise” of the graphs.
10% means a drop of 40ppm. That would drop 414 CO₂ ppm to 374 CO₂ ppm.
17% means a drop of 68ppm. That would drop 414 CO₂ ppm to 346 CO₂ ppm.
Where are those drops in the graphs?
Every graphic that I’ve seen alleging to show CO₂ response to COVID lockdowns, were based upon someone’s estimates, not measurements.
Willis’s graph shows CO₂ measurements; and it looks to be normal CO₂ cycle.
“Willis’s graph shows CO₂ measurements; and it looks to be normal CO₂ cycle.”
As did Roy Spencer’s graph.
Which also suggests human-generated CO2 emissions contribute very little to the global increase in CO2, contrary to all the theoretical math and models. Here’s why:
It could be that humans are the main driver of increasing CO2 but since it’s only estimated to be about 4% of total CO2 emissions each year (the rest coming from natural sources), that could explain why it’s hard to see the exponential growth (if there is any); it’s so small compared to natural sources.
Bottom line: it is far from indisputably proved that humans are the primary cause of increasing CO2. It has fluctuated a lot in the past before humans were around as shown by paleoclimate measurements from ice cores and other proxies. And it is certainly far from proved that increasing CO2 will warm the entire planet significantly (or dangerously) over the next couple centuries. Current measured trends suggest benign warming of about 1.4° C per century even if we do nothing to curb CO2 emissions.
Mmm … I didn’t say that we don’t see acceleration in the CO2 data. I used a trendline because it’s a short time period. Here’s an ANOVA test of the full CO2 record since 1959:
This shows an acceleration in the CO2 values which is statistically significant.
Next, as the amount of CO2 emitted by humans has risen, the amount absorbed by CO2 sinks has also risen. So you can’t just look at one and not the other.
As to whether humans are the cause of CO2, the actual airborne CO2 can be very closely calculated using just the human emissions and an exponential decay function. Here’s that calculation
As you can see, anthropogenic emissions are sufficient to explain the rise in atmospheric CO2.
My best to you,
w.
So if anthropogenic emissions are responsible for the rise why has the unprecedented (slc) drop in human CO2 emissions not shown in the actual airborne CO2 values when you consider you can see the effect of Northern Hemisphere leafing and increase in the CO2 sink almost immediately?
note too those seasonal fluctuations are around 10% larger than they used to be, fast carbon cycle is growing
asking what % of the increase in CO2 molecules is “due to humans” is starting to seem a bit like asking what % of the water molecules in your orange juice are “due to urination”
true human emissions are sufficient, but also unnecessary and very poorly correlated
rise in levels is barely accelerating, not at all what was expected 30 years ago under these emissions
natural causes probably dominate the long-term trends as well as short-term
the assumption there must be a “long tail” to human CO2 contributions has always been an odd one, physically speaking
if the dispersal/flow models turn out to be more accurate, people alive today may well see falling CO2 levels as the unique obliquity of the interglacial fades — and their grandchildren might see the beginnings of reglaciation
lol but NOAA has mountains of solid evidence that human emissions appear wherever they will increase NOAA funding
afaict no actual human short-term CO2 signal has ever appeared in the record, we just guesstimate what proportion of the long-term trend is human
If that would be true, we would also see a lag in the seasonal sinusoidal. That’s simply not true. As I said in another comment, this discrepancy will be hard to justify by the “Anthropogenic Mainly CO2 production” community.
I would guess (with no data to substantiate this, so take it as you will) that the drop in emissions as a result of lockdown is substantially smaller than the range of natural variability in annual CO2.
I would also note that the seasonal cycle is quite a bit different than anthropogenic emissions. For the seasonal cycle, leafing plants take up CO2 all across the growing-season hemisphere all at once, while any reduction in emissions will not be reflected until the emitted CO2 has time to mix throughout the atmosphere. I don’t know what the total mixing time for the atmosphere is, but combine a small signal with a slow response + large natural variability and it isn’t surprising that we don’t see much.
“I would guess (with no data to substantiate this, so take it as you will) that the drop in emissions as a result of lockdown is substantially smaller than the range of natural variability in annual CO2.”
Of course it is. It’s so tiny that it cannot be noticed, despite a reduction of 35% of the world economy and almost a complete halt of aerial traffic. That’s precisely the point because alarmists say that the supposedly emitted CO2 does matter. After all that’s the cause, according to them, of the anual rise we are observing. They can dance and twist but the logic is not sound at all.
“Of course it is. It’s so tiny that it cannot be noticed, despite a reduction of 35% of the world economy and almost a complete halt of aerial traffic.”
I’m not sure that these metrics translate directly into metric tons of CO2. Do you have an estimate of the reduction in CO2 emissions believed to have resulted from the lockdowns?
https://www.livescience.com/carbon-dioxide-reduction-coronavirus-lockdown.html
Thanks. This was reported in May, according to the article’s timestamp. Do you have these figures for the full year? The article states:
“If certain restrictions remain in place until the end of the year, average emissions may decline by 7% from last year.”
Ian W gave the answer. No, I did not had that estimate but I have the economical metrics that are imposed by the Paris Accord and they are not equal to 35% of economical slowdown that was proved pointless to the anual global emissions. Considering this, make your own logic about the utility of this international agreement 😉
This also poses a challenge to the “CO2 is well-mixed” assumption.
And if the lag exists, and it isn’t well-mixed, then local land-usage dominates industry.
Not to mention the oceans.
Is a maybe prediction another failed prediction? Doesn’t matter really does it? I bet that less than one percent of the climate gobshites know what the Keeling Curve is, or how to interpret it and, even if they even did find Willis’s fine easily understandable graphs above, they wouldn’t understand them.
Surely as mans co2 is only 4% of the total and half then disappears into the ocean and the lockdown decrease was only some 9% of mans tiny contribution, that what with natural variability, what remains isn’t large enough to show up on any chart that shows total co2 concentration?
tonyb
I think you might be onto something there tonyb. ++ from me.
Glad Loy is agreeing that human contribution is only 4%
Maybe he/she/it is actually capable of learning !!
In which case Net Zero, Green New Deal etc etc are not worth proceeding with as the increase in CO2 is natural not man made.
Wrong end of the telescope Ian
You haven’t even unwrapped the telescope, Loy
And wouldn’t know which end to use if you did.
You remain WILLFULLY BLIND.
First, the lockdown decrease in April is estimated at 17%. Since this is monthly data, where is the corresponding dip?
Heck, in the US, the EIA says April saw the lowest emissions since records started in 1973 …
From Nature magazine, I find this …
So it was by no means a trivial or small drop.
Next, the idea that it might not be seen on “any chart that shows total co2 concentration” is why I put up the month-over-month graph, the graph in the bottom panel… not visible there either.
w.
or says… “gees, we need to adjust that data quick smart !”
Willis, Roy Spencer explained why
Do you have a link to Dr. Roy’s explanation?
w.
http://www.drroyspencer.com/2020/05/why-the-current-economic-slowdown-wont-show-up-in-the-atmospheric-co2-record/
and
http://www.drroyspencer.com/2020/06/covid-19-global-economic-downturn-not-affecting-co2-rise-may-2020-update/
Willis
It is quite simple. Really.
CO2 is getting higher regardless because the sinc area in the arctic is getting smaller. Chemistry 101.
Nothing to do with CO2 emission.
Have a blessed new year.
Trees and leaves have nothing to do with it. Let me spell it out again
CO2 + 2H2O + cold = HCO3- + H30+
Yes, absorption by water is probably one of the faster sinks for CO2. Plant consumption, including by algae, is seasonal and slower.
If I could, I would give you bonus points for a correctly balanced equation.
Again. Vegetation and emission is nothing compared to the giga tons of carbonates dissolved in the oceans.
The arctic is just getting warmer and warmer and humans have nothing to do with it.
There is nothing wrong with my equation.
🙂 Sorry, I should have been clearer that I admired and was appreciative of your perfectly balanced equation (although O should be used instead of 0 in H3O+).
that’s some weird chemistry ya’ got there.
wtf is H3O+?
It’s an unstable ion that causes slightly less alkalinity in the oceans and slightly more erosion of calcium carbonate rocks.
Use the force, Joel – with apologies to Obiwan.
From a readily available internet search (which I wish I understood):
In chemistry, hydronium (hydroxonium in traditional British English) is the common name for the aqueous cation H 3O+, the type of oxonium ion produced by protonation of water.
We used to call it hydronium ion, for the simplest cation that is formed by H+ in water. It was very much in vogue in the past. It’s still viewed as correct.
But it exists in pH dependent vanishingly small quantities. No one “isolates” a hydronium ion.
H+ in solution usually is surrounded by several water molecules to stabilize it. Chemists write H3O+ to denote that the poor little proton is not all alone in the world, but solvated.
Weird physics more like: A tonne of carbon comes out of tailpipes and natural sinks swallow 500kg… thats all.
The missing 500kg? Ah, well it goes into a wormhole and back out, and because wormholes are, well natural, it is of course, now…um natural, untoched by human hands…
HOPEFULLY that extra CO2 goes into the atmosphere..
Replenishing it from the dangerously low levels it is currently at.
The ENHANCEMENT of atmospheric CO2 has been a BOON for ALL LIFE ON EARTH. and has no proven negative effects.
HenryP,
Has anyone made an estimate the annual amount of CO2 that is absorbed from the atmosphere by falling rain and subsequently sequestered in soils?
The amount of CO2 being removed is moot. The point is some large percentage (50-75%?) of CO2 emitted by man remains in the atmosphere.
It can’t ALL be absorbed by water as that would violate Henry’s law. And we also know it doesn’t happen because if it did absorb most of the CO2 we would not see such large increases in atmospheric CO2 instead we would see much smaller increases.
Life processes and certain geological processes can also remove more CO2 but takes more time than direct absorption.
Thing is, you can’t have natural warming of oceans and land areas WITHOUT getting an increase in the CO2 released from natural sources.
NO…. that is sloppy thinking.
Lets assume nature takes in what it puts out….. (even though we KNOW Nature has been taking in increased amounts.).
Man emits some 4% of total CO2 emissions. Nature emits 96% of total
If Nature takes back 96% of the total,
… then, since Nature cannot discriminate the source of the CO2..
… 96% of that human CO2 is absorbed.
Not much left.
Has the Arctic ice extent changed either way significantly enough to change the ocean’s CO2 exchange surface area to make a difference?
Negligible. Arctic sea-ice area has fallen about 10% recent decades but the Arctic is less than 3% of the Earth’s surface. So 10% of 3%.
Nonetheless COVID type lockdowns will be demanded
Even if they don’t work it’s the right thing to do…..
The end justifies the means.
Exactly. Think about the children. How could they survive without the parasitization of their future prosperity by nincompoops.
Willis:
I assume you meant Nov 2020, not 2012. Right?
Thanks, Donald, fixed. It’s one of the beauties of writing for the web … my mistakes don’t last long.
w.
“The rate of increase of CO2 hasn’t changed in the slightest. I offer up no explanation for this … but it doesn’t bode well for those claiming that we need COVID-style lockdowns to reduce the CO2 levels.”
Sooner or later this will become harder and harder to deny by alarmists. Can be a huge problem for them. If we needed an experience abou the influence of anthropogenic CO2 in global CO2 rise, that experience could not be better than the lockdowns.
“…this will become harder and harder to deny… .”
Because no one denies it in the first place?
“Can be a huge problem…, doesn’t bode well for them”
This them you refer to are the ones who are calling the alarm aren’t they, isn’t that why the label alarmist? If they are the ones calling it alarming, why on earth would they be denying what a huge problem it is? It’s a problem alright but not for the reason you’be been led to believe.
Unlike some bad Western, there is no us and them when it comes to the atmosphere. Its like there is an iceberg warning. You can ignore the iceberg warning, that’s fine, go ahead. But please, don’t try and explain to anyone why icebergs don’t exist.
Loydo, I fear you missed my point. I’d said:
Note that I’m not talking about the “problem”, real or otherwise.
I’m saying it doesn’t bode well for those who think that a COVID-style lockdown can reduce the CO2 levels.
As to whether the iceberg exists, let me recommend my post entitled “Gavin’s Falsifiable Science“.
Regards,
w.
“Note that I’m not talking about the “problem”, real or otherwise.”
No but JN was. I agree with you that there is nothing we can do that will make any short term difference to CO2 levels. Whether one thinks our CO2 is going to cause problems or not, no one alive today is likely to see levels drop back below 400ppm.
https://upload.wikimedia.org/wikipedia/commons/a/ab/All_forcing_agents_CO2_equivalent_concentration.svg
WOW Loy is totally full of POSITIVE NEWS today
What happened to your dismal hatred of CO2, Loy ?
Have you finally realised that the extra CO2 in the atmosphere is TOTALLY BENEFICIAL to ALL LIFE ON EARTH !
Wow, Wouldn’t RCP8.5 be absolutely fabulous for LIFE ON EARTH
CO2 levels eventually reach optimum plant growth levels. !! 🙂
All other leave them short. 🙁
You meant to say no one ever
You can ignore the iceberg warning,
WT* are you talking about?
The current level of sea ice is FAR HIGHER than it has been for most of the last 10,000 years.
Icebergs have always existed, they are a NATURAL OCCURRENCE of “rivers of ice”
It was a metaphor you dummy.
You mean a DUMB metaphor. right !!
It came from you , after all..
… and DUMB is all you do.
It seems what is and what could alter CO2 levels is amount tree growth.
And burning wood is adding to CO2 levels, and governors/politicans inability to manage land and resultant forest fires, is not reducing CO2 levels.
Plants are going to respond to higher levels of CO2 by limiting their stomata size and reducing their water loss. By as net, they would be eating more CO2 or they have potential to do so {unless there burnt by forest fires, eaten by animals, etc.}.
Globally, if wanted to lower CO2 levels, it seems one do something to encourage the greening of deserts.
Though basic problem is politics- or politicans are stupid and can’t do anything useful.
If not for that problem, it seems one would want a greening Sahara Desert, and grow permanent forests in Sahara Desert. Or grow trees, where no trees are growing.
Or plants or trees will grow where they can grow and managing that with some competence
is fine thing to do, but doing stuff to allow plants to grow where they can’t, could have more
upside.
If one somehow manage all the evil and lazy politicians so don’t screw everything up, and made vast forests in Sahara Desert, it would increase global temperature, but should also reduce CO2 levels.
The Sahara was green 5000 years ago….it is tied to the “wobble” of the earth’s axis….a 23000 year cycle….. so a green Sahara is not coming soon unless molten salts reactors are built to desalinate Mediterranean water and irrigate the desert. Khadaffi was mining the ground water beneath the sands but that is a limited supply.
We know too little about atmospheric and oceanic circulations to tell why Sahara was green. It is a great field for speculations, almost as great as what happens in year 2100.
It is the latitude….the deserts of the world are at a certain latitude….when the axis of the earth shifts, the rains reach the latitude of the Sahara.
The Antarctic is a quite large desert. The major glaciers causing icebergs are all obviously near the edges, and the flow from central Antarctica is quite slow until it reaches the edges. Much of the inland ice apparently sublimates.
Reason(s) aside, the Sahara was formerly a major sink for CO2.
Willis, you can’t just blurt out the truth like that, you’ll never get any funding. Maybe you should torture the data a little?
I haven’t looked into it for a while, but it appeared to me that we would have to reduce emissions to 1850 levels worldwide (pre-civil war, US) to have any hope of reversing the rising anthropogenic CO2 levels in any reasonable time frame.
Not that I would want to, despite owning a waterfront home in FL just 8.5′ above the high tide line. In my opinion a warmer, wetter world is preferable to a cold, dry one, and the return of the continental glaciers would be a disaster for mankind.
CO2 rise appears to be unstoppable by any practical means. Proposed reversal measures look to me to be a combination of rent-seeking behavior, a desire for raising taxes, and an inclination to take western society down a peg.
Amazing to what length alarmists would go to prevent Siberia, Alaska, and Canada from becoming better places to live.
But children won’t know what hockey is. 😉
The kids I know play Hockey all year long – indoors. That might not happen in the future if the pro-Gaia/anti-Human movement reduces the flow of available electricity to a trickle.
The on-going La Nina conditions will fully explain any year-over-year rate difference when 2020 and 2021 mean annual CO2 growth rate numbers are in.
https://www.esrl.noaa.gov/gmd/ccgg/trends/gr.html
And NOAA’s Global Monitoring Lab folks clearly state that the COVID related emissions reductions will not be measurable:
“Thus, when we compare the average seasonal cycle of many years we would expect a difference to accumulate during 2020 after a number of months. The International Energy Agency expects global CO2 emissions to drop by 8% this year. Clearly, we cannot see a global effect like that in less than a year.”
But then they go Full Retard mode with their next statement:
“It does look like CO2 continues to increase at the same rate as in previous years, which illustrates that we need to make aggressive investments in renewable energy sources to tackle our global heating emergency.”
source: https://www.esrl.noaa.gov/gmd/ccgg/covid2.html
Basically in one statement the GML lads admit that the drastic, economy-destroying reductions from COVID lockdown will have no measurable impacts on the CO2 record. Then they go into a magical beliefs lala-land fantasy that somehow if we destroy our economies completely, build more intermittent wind farms and solar panels and end fossil fuels use (but only in the West) then we can magically avoid a “global heating emergency.” Talk about a bunch of morons.
And flu has disappeared but CV19 is out of control.
The organizers for these studies are clearly not morons. They are getting rich off of our labors through their deceptions. CO2 hysteria is only one of the many tools they use to enslave the working class into servitude.
The lads and ladies working on the government GS dime at NOAA are not getting rich. They are only getting their climate faith virtues soothed while making a nice solid middle class salary.
Joel, the relationship between CO2 (detrended) and the MEI index has an R^2 of 0.02 … so I fear the La Nina doesn’t explain anything.
w.
Willis, Happy New Year. As usual, you are careful to be driven by what the data say. Listening to the data is a good strategy. However, I do think that if this is an aspect that, should it interest you, you might pursue Joel’s comments further. There are plenty of papers that recognize a correlation between CO2 growth and ENSO (perhaps mainly visual rather than mathematical, I admit) but here is one plot that may be of interest:
If you wish to pursue this further, I would recommend looking at the atmospheric δ13C, δ18O and O2:CO2 relationships. There are lots of interesting potential correlations out there (to me at least), which are remarkably consistent over time despite all the complexities of atmospheric behavior.
I just got the data and ran the R^2 of the detrended CO2 and the MEI from 1959 to the present, and it is pathetic.
R^2 = 0.02. Change my mind.
Hang on, he used the ONI. One moment please … OK. Calculated it using the ONI.
R^2 = 0.0008. Change my mind.
w.
Willis,
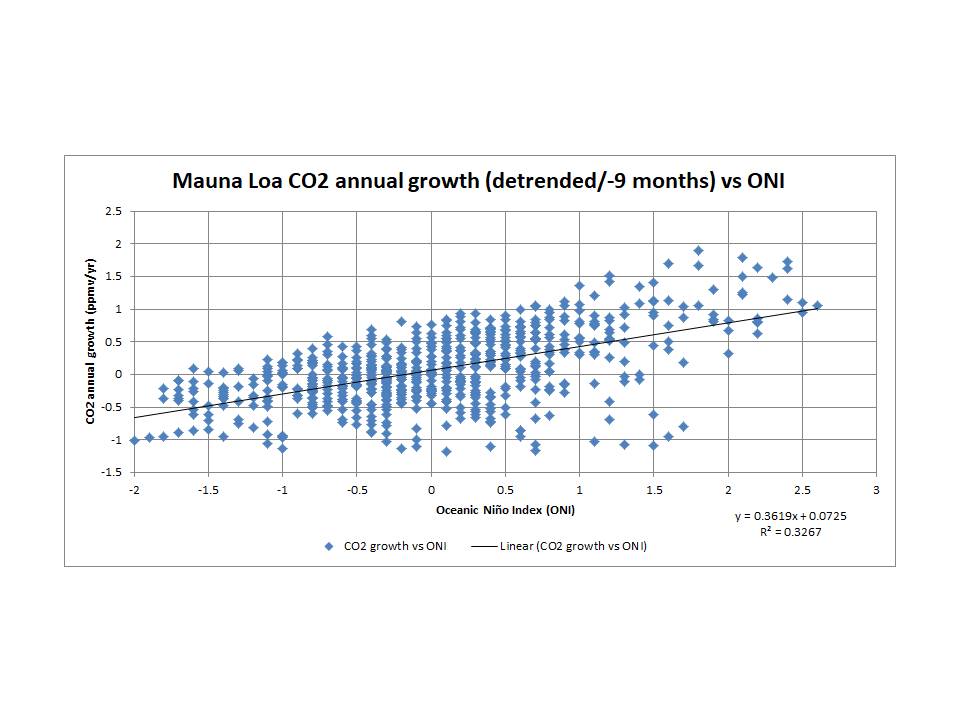
I can certainly improve on an R^2 of 0.0008. How about 0.33? Not brilliant perhaps but this includes the effect of Pinatubo where the ONI said El Niño, but the eruption had an even larger effect on atmospheric CO2 behavior.
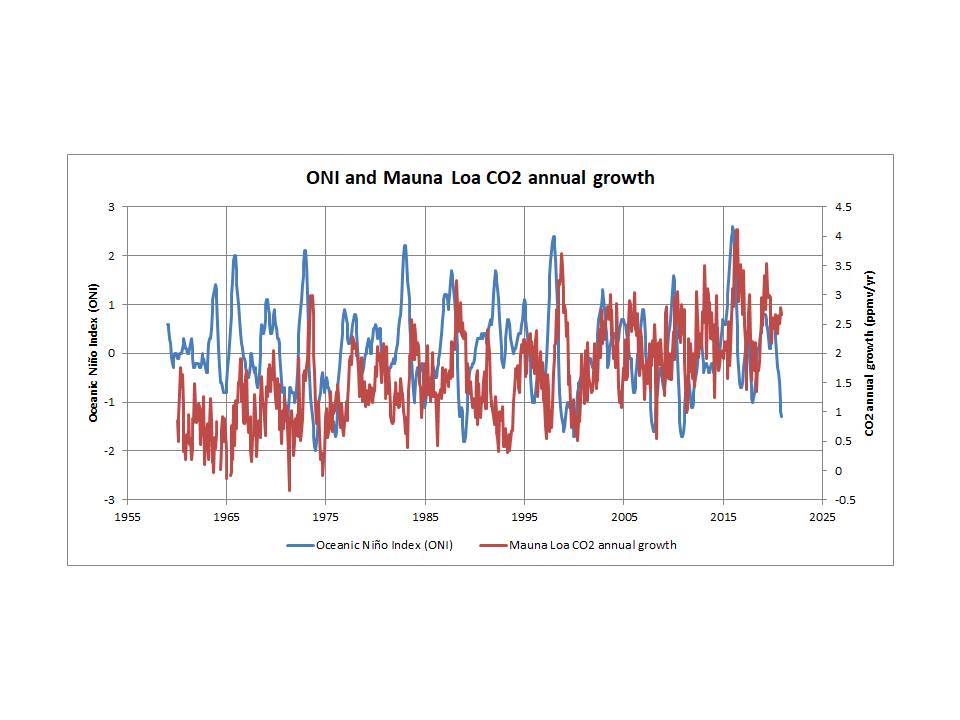
The first plot is simply ONI and the annual growth (Jan to Jan, Feb to Feb, etc.) of atmospheric CO2 at Mauna Loa. This approach removes the effect of the annual cycle since we are interested here in the longer term variations.
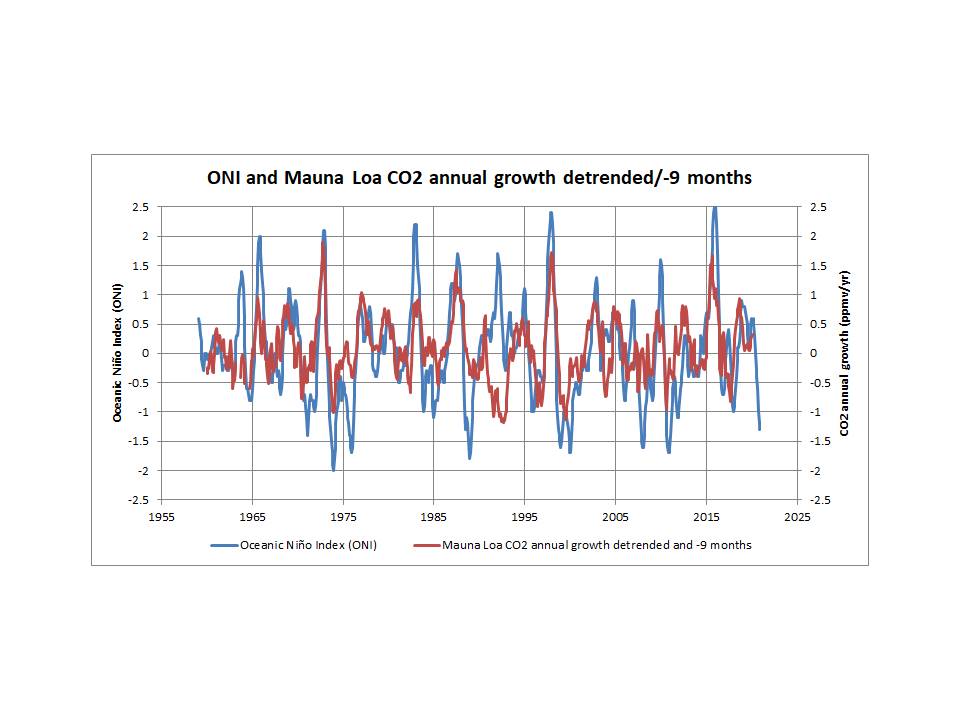
For the second plot, the CO2 growth rate has been detrended, smoothed (rolling 3 month average in order to match ONI) and shifted by 9 months to reflect the delay of CO2 growth rate change following an ENSO event.
This final plot is a cross-plot of CO2 growth rate (modified as per the previous figure) against ONI.
It’s outside my skill set, but many data-based, basic studies show an ENSO vs.CO2 annual growth rate correlation … from data.
Such as:
https://www.esrl.noaa.gov/gmd/icdc7/proceedings/abstracts/zeng1EC306.pdf
We don’t need R square! The increase is obvious. What will be of interest is if this increase starts to decrease when El Nino goes to La Nina.
Joel,
Agreed. The correlation between atmospheric CO2 annual growth rate and ENSO is not generally in dispute. It has been known for a very long time, having been identified as a possibility as early as 1976 (https://www.nature.com/articles/261116a0). Even most AGW proponents accept this relationship and their position is that atmospheric CO2 growth rate increases following a major El Niño as a result of reduced removal of emissions due to drought and forest fires in the tropics, whereas it decreases following La Niña due to more efficient photosynthesis, also in the tropics, which removes more emissions. I don’t buy these hypotheses, but my point is that there is little dispute about the relationship that we are discussing here.
I suspect that the the balance between CO2 dissolved in the oceans and free CO2 in the atmosphere is changing. Warming of the oceans from the Little Ice Age could be responsible.
It is obviously nothing to do with human activities. Alarmists like to claim that the Keeling curve shows human emissions. If it did, it would now be showing a large dent due to covid. Obviously human emissions are too small to show up on the Keeling curve. Alarmists can’t have it both ways.
Alarmists can’t have both ways, but they’ll try.
Seems doubtful. Per the ice cores, the relationship between temperature and CO2 is that for every degree of warming, the CO2 goes up by ~7.6 ppmv.
CO2 levels have gone up by ~ 100 ppmv since 1959. For that to be due to changing ocean temps, the ocean would have had to warm by 13°C since 1959.
w.
The largest unknown seems to be how much of the CO2 in the atmosphere and ocean in sequestered via subduction and increased plant and animal life. The amount of CO2 in the atmosphere is a pittance compared to the ocean.
“The rate of increase of CO2 hasn’t changed in the slightest. I offer up no explanation for this … but it doesn’t bode well for those claiming that we need COVID-style lockdowns to reduce the CO2 levels.“
When has complete lack of effectiveness ever stopped poor government policy?
German government, May 1945. I wish it could be achieved without a complete destruction.
Misinformation headline writing in the MSM never sleeps nor misses its appointed rounds with the gullible..
“Neither snow nor rain nor heat nor gloom of night stays these couriers from the swift completion of their appointed rounds”
2012?
The decade of 2002 – 2012 anthropogenic ( Mankinds) emissions increased 200% over the previous decade and overall emissions didn’t blink. Humans don’t drive CO2 and CO2 doesn’t drive warning. Time to get over it and call it what it is Power hungry Fraud.
It doesn’t have to be fraud or power if people actually believe it is for general “good”. Example: burning autistic young girls as evil witches was considered the “best solution to the problem” amongst both elites and regular citizens in the middle ages.
It may very well come to that again, @DMacKenzie.
If we could graph the curve of superstitious thinking, I believe that we would see a real hockey stick starting sometime in the Spring of last year.
Gretas of the world, beware. Being able to see the evil in the air obviously means you are in league with the forces of Hell.
And when you wake up get yourself a cup of coffee, the damage they are going to do will be massive to the economy and the environment.
“Geneva, 23 November 2020 (WMO) – The industrial slowdown due to the COVID-19 pandemic has not curbed record levels of greenhouse gases which are trapping heat in the atmosphere, increasing temperatures and driving more extreme weather, ice melt, sea-level rise and ocean acidification, according to the World Meteorological Organization (WMO).
The lockdown has cut emissions of many pollutants and greenhouse gases such as carbon dioxide. But any impact on CO2 concentrations – the result of cumulative past and current emissions – is in fact no bigger than the normal year to year fluctuations in the carbon cycle and the high natural variability in carbon sinks like vegetation.”
Not odd at all if you look down where your feet are planted instead of up in the sky.
The CO2 is coming out of the dirt/soil. i.e. Soil Erosion
The business of ’tillage’ is what’s doing it.
The rate hasn’t stopped during Covid because tillage hasn’t stopped in actuality or stopped expanding in area and intensity.
If it had, some 10’s or 100’s of millions of people would be starving & dying – not the handful suffering from Covid, physically and mentally.
The Technical Bit…
The business of tillage is that of replacing Perennial Plants (forests and ancient grasslands) with Annual Plants. Wheat, rice, corn, potatoes etc
Perennial plants are in fact absorbing CO2 and growing all the time
It is generally reckoned that on a UK Livestock farm, 10% of all grass growth occurs during winter.
That’s beyond 50 degrees North and barely 6 hours of sun in the sky!
While plants are growing they are also dying and shedding ‘Organic Matter’ Leaves, twigs, stalks whatever whatever and an army of little critters, bugs and worms will be pulling that stuff down into the soil
But tillage requires the destruction of that process.
Annual plants such as we grow and use as the tasteless nutrient free mush that now passes for ‘Food’ cannot abide any competition.
But, they are only absorbing any serious amount of CO2 for 2 months out of 12, 3 months at most.
During the other 9 or 10 months, bare soil is exposed to the sun.
The primary ingredient of this organic material is cellulose and by its being a carbon chain molecule is blown to buggery by the sunlight.
In fact a lot of the Soil Organics is actually bacteria and they are similarly trashed by exposure to the sun.
As they pass by on the wind, Friendly Oxygen (and Ozone) Molecules pick up the broken bits and carry them away as CO2
It has been said a trillion times on here that such process does not matter.
It is asserted that the organic matter created by the plants will turn into CO2 anyway.
OK but,
In which case I ask, why is there such stuff as (organic rich) soil, topsoil or dirt?
( ‘A Horizon’ as it is properly called)
If the process I describe is not one of accretion, why is the entire Earth not just a ball of bare rock as it was 4 or 5 billion years ago?
The process of dirt creation must be one of positive accretion, read= constant CO2 absorption or there wouldn’t be any. Or any of us for that matter.
Also and not least, where did the (never ending as we’re also assured round here) supply of coal, oil and natural gas come from?
Is it really beyond the bounds of science, modern thinking or anyone’s brain capacity to imagine that all that bare soil lying around for 10 months out of 12 might cause the place to warm up a little. What sort of shit are those climate super mega kilo duper super-duper mega-mega kilo-nova computers doing?
Considering that the bare soil has an albedo of 0.1 and green plants an albedo of 0.4?
Not beyond the limits of Microsoft Excel I’d guess.
AND that that bare soil is most prominently exposed when the sun is at its very highest and strongest.
i.e.In late spring, when the recently planted annual crops are weeks away from ‘closing their canopy’ and covering the bare soil.
Was anyone counting the Climate Whammies in there?
Might need to use the fingers of BOTH hands or do contemporary education standards not even acheive that level of competence?
haha
Maybe you can tell I’m a bit annoyed and not least because the General Assumption around here and everywhere is that the business of tillage is Natural Variation and casually brushed aside. While NEVER offering any explanation of what that means
Even worse, we are endlessly told about Roman & Minoan (and others) Warm Periods
What exactly was the timeline for those?
Its generally taken that the warmth caused the flowering of those civilisations.
Maybe, just maybe, those civilisations caused the warming (via tillage, deforestation and overgrazing) and that coincided with The End of their civilisations
It does strike as impossibly bad luck that EVERY attempt by humans at creating a civilisation, every attempt, was thwarted by Climate Change.
Please tell me I’m not the only person to think that
That is something I have often pondered. For example, papers have noted that parts of Australia could be cooled by growing more vegetation. Local temperatures differ above cleared land versus uncleared land. Irrigation has been shown to cool irrigated areas. Vast areas of land are cleared for grazing and cropping. Worse, at hot times cattle graze the cover away to bare earth and here in Australia that often coincides with the local wheat harvest. And so on. Surely, if cities cause UHI, vast areas cleared of native perennial vegetation must also radiate more heat (to say nothing of CO2 being liberated from soils by clearing and tilling). After all, the warmed atmosphere only is warmed because the earth warms and radiates back to space.
I suggest you start with quantifying the factors you are considering.
I have only one question in this: the actual atmospheric level of CO2 is 0.04%, and O2 is 21%. So how does Mauna Loa’s CO2 exhaust actually change atmospheric levels overall?
Answer: It does’t. It’s totally local, MANN! (Pun intended.)
I hope you all had a nice New Year’s weekend. I know I did: the female redbellied woodpecker came to my birdfood spread on the front steps, along with a chipping sparrow and a couple of cardinals.
w.
Thanks!
You are welcome. It’s what the site is all about.
w.
This might help too.
Still waiting for that one paper Loydo…….
Ok I’ll bite, that shows exactly what?
You know that this CO2 rise is totally beneficial to ALL LIFE ON EARTH
You also know that it has no affect on the atmospheric temperature.
All you have to show is the GREAT NEWS about increasing atmospheric CO2 levels.
THANKS 🙂
MORE GREAT NEWS..
Atmospheric CO2 continues to rise, uninterrupted.
Thanks Loy.
When the Dems see these linear trends they think consistency of political messages rather than science questioning.
The article particularly the title were meant to trigger the subliminal narrative that the CO2 levels were falling due to the COVID lockdowns. We know they aren’t but the green confirmation bias will not require to read any further or cross check.
If data were plotted on an honest chart, say from 0 to 600 ppm, instead of cherry slicing a tiny section (380 to 412) of the y-axis that scarily exaggerates the change, any so-called apocalyptic “trend” would simply vanish into the cloudy uncertainty zones.
If your chart needed 0 ppm of CO2 it wouldn’t be discussing climate change as the problem.
Not entirely unrelated, it seems the Earth’s speed of rotation has increased in 2020, probably not because we’ve been able able to fly all year.
Year 2021 is set to FLY by as the Earth is spinning faster than at any time in the past 50 years – prompting scientists to call for the addition of a ‘negative leap second’
https://www.dailymail.co.uk/sciencetech/article-9113999/Earth-spinning-faster-time-past-50-years.html
From NASA
Melting land ice, like mountain glaciers and the Greenland and Antarctic ice sheets, will change the Earth’s rotation only if the meltwater flows into the oceans. If the meltwater remains close to its source (by being trapped in a glacier lake, for example), then there is no net movement of mass away from the glacier or ice sheet, and the Earth’s rotation won’t change. But if the meltwater flows into the oceans and is dispersed, then there is a net movement of mass and the Earth’s rotation will change. For example, if the Greenland ice sheet were to completely melt and the meltwater were to completely flow into the oceans, then global sea level would rise by about seven meters (23 feet) and the Earth would rotate more slowly, with the length of the day becoming longer than it is today, by about two milliseconds.
Greenland has done OK in gaining ice in last two years
http://polarportal.dk/en/greenland/surface-conditions/
The data sets from Mauna Loa and South pole goes back to 1959. You can see an acceleration If you look at the entire dataset.

/Jan
True, Jan … not sure what your point is here.
w.
That makes more sense if it is measuring anthropogenic / economic emissions than if it is measuring the volcano.
Which is interesting.
What’s with the bow?
The temperature forcing from rising CO2 is proportional to the logarithm of the CO2 concentration. So here’s a log-scale graph of CO2 concentration, which you can think of as a “CO2 forcing” graph:
https://www.sealevel.info/co2.html?co2scale=2
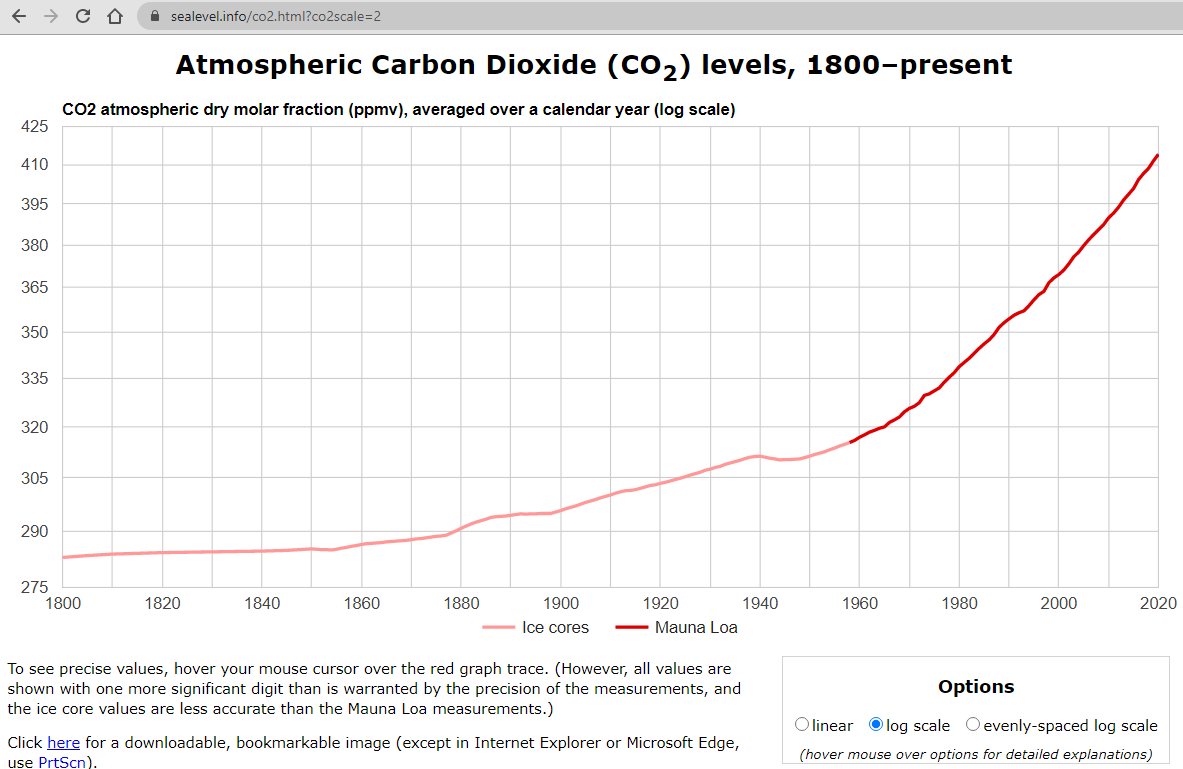
Note that over the last quarter century the graph is almost perfectly straight, indicating very little acceleration in the CO2 forcing trend. (Remember that fact the next time you see a prediction of wildly accelerated ______, as a result of CO2 emissions.)
(Fill in the blank with anything you wish.)