From Dr. Judith Curry’s Climate Etc
Posted on December 20, 2019 by niclewis | 14 Comments
By Nic Lewis
In an earlier article here I discussed a Comment on Lewis and Curry 2018 (LC18) by Kevin Cowtan and Peter Jacobs (CJ20), and a Reply from myself and Judith Curry recently published by Journal of Climate (copy available here). I wrote that I would defer dealing with the differences between observed and CMIP5 model-simulated historical warming, which formed the basis of CJ20’s numerical analysis, until a subsequent article. I now do so.
Differences between observed and CMIP5 model-simulated historical warming
CJ20 compared mean warming in CMIP5 model historical simulations with observed warming between varying early and late windows. They found that “Different window choices can lead to the conclusion that the model results show significantly faster warming than the observations do or that the observations warm slightly faster than the model results”. However, such a comparison is meaningless unless the evolution of forcing is the same in the model simulations as it is estimated to be in reality. We show in the Reply that this is not the case: forcing increases more slowly in the CMIP5 model mean than as estimated in LC18 based on IPCC AR5 best-estimate time series, updated to 2016 and revised where appropriate. To provide a better comparison, we remove the temperature changes caused by volcanic forcing (to which the climate system responds differently from other forcings), which are much larger in CMIP5 models than in observations – and compare total forcing with the volcanic component removed.
Figure 1 in the Reply, reproduced below, shows how observed and CMIP5 simulated historical global temperature evolution compares, before and after removal of volcanic influences.
 Figure 1. CMIP5-mean and observed global mean warming before and after removing the response to volcanism: centered 9-year running means of anomalies relative to the 1869–82 mean. CMIP5 historical simulations have been extended using RCP4.5 simulation data. The averaging period is reduced at either end, to a minimum of 5 years.
The faster initial rise in observed than simulated temperature is likely due to the omission of mean volcanic forcing from most CMIP5 preindustrial control simulations. That omission reduces CMIP5-mean warming over the historical period by 0.1°C, mainly during the third quarter of the 19th century. But even from the adopted baseline of 1869-1882, the primary LC18 early window, CMIP5-mean warming eventually climbs clear of observed warming. What we said in the Reply was:
On decadal timescales, the mean evolution of warming of CMIP5 models over the historical period broadly matches that of observed warming until 2000, with some fluctuation (Figure 1, thick purple and cyan lines). When the fitted response to volcanic forcing is removed (Figure 1, black and orange-red lines), CMIP5-mean historical/RCP4.5 warming exceeds observed warming by the mid-1980s, with the gap widening from the mid-1990s.
The post-1900 cooling, and the lack of warming between the 1940s and the 1970s, in observed surface temperature with the response to volcanism removed, likely reflects cool phases of the Atlantic Multidecadal Oscillation (AMO).
Since the transient climate response (TCR) of CMIP5 models is 35% or so higher than the observationally-based best estimate in LC18, one might expect CMIP5-mean warming to exceed observed warming before then. The main reason it doesn’t is that historical forcing evolves more slowly in CMIP5 models than per the LC18 revised and updated AR5-based forcing time series. This is mainly, but not entirely, due to CMIP5-mean aerosol forcing, growing increasingly more negative than per LC18 up to the 1970s, since when it is has not changed greatly.
Forcing evolution in CMIP5 historical simulations can only be derived approximately, since unfortunately it was not generally diagnosed. However, we show in the Supporting Information for the Reply that, for two models where evolving historical simulation forcing was diagnosed, it can be accurately derived as:
ΔF = ΔN + λ × ΔT
where Δ signifies a change or anomaly from a reference period mean, F is effective radiative forcing (ERF), N is global top-of-atmosphere radiative imbalance, T is global surface temperature and λ is climate feedback estimated by regression of N against T over the first 50 years after an abrupt step increase in CO2 concentration. See also my article here. This method was used in Forster et al. 2013, but with λ estimated over the full 150 years of abrupt4xCO2 simulations, a period with a much longer average age of forcing than the historical period and which generally gives lower climate feedback estimates for CMIP5 models. While use of this method involves partial circularity when going on to compare warming ratios and forcing ratios between models and observations, it appears to be quite accurate, and superior to cruder methods such as that used in Gregory et al. 2019
Figure 2 in the Reply, reproduced below, shows the estimated forcing evolution in CMIP5 historical simulations (red line) compared to the AR5-based/LC18 median estimate (black line), and how their ex-volcanic ratio (blue line) compares with the corresponding ratio of ex-volcanic warming relative to TCR (green line).
 Figure 2. CMIP5-mean and AR5-based/LC18 ex-volcanic ERF relative to F2xCO2 (the ERF for a doubling of atmospheric CO2 concentration) over 1861–2016, their ratio and the corresponding ratio of CMIP5-mean and observational warming relative to respectively CMIP5-mean and observational TCR estimates, of 1.82 K and 1.33 K respectively. Based on an ensemble of 25 CMIP5 models with the requisite data and the LC18 preferred median TCR estimate when using globally-complete Had4_krig_v2 temperature data. Values are anomalies from the 1869–82 mean. Relative ERF and relative warming ratios are calculated model-by-model before computing CMIP5 means. Ratios are of centered 15-year running means (shortened to 5 years by the final year plotted, 2014).
This is what we say about Figure 2 in the Reply:
When the green line is above the blue line, CMIP5-mean warming relative to that observed is greater than predicted by their respective TCR and [ex-volcanic ERF] estimates, and vice versa. The relative warming ratio starts off much higher than the relative forcing ratio, reflecting the unusually cold first quarter of the 20th century, before falling below the relative forcing ratio during the warm period centered around 1940, when the AMO was positive. From the late 1950s until circa 1990, the relative warming ratio largely tracks the rising relative forcing ratio, but generally exceeds it as the negative phase of the AMO, which reached its nadir in the 1970s, was associated with cooler global temperature. After 1990 the relative warming ratio remains close to the relative forcing ratio, as is to be expected if the LC18 TCR estimate is accurate.
From the late 1990s on, the ratio of estimated ERF in CMIP5 models to the updated and revised AR5-based ERF used in LC18 has been stable at around 0.85. That is very close to the 0.86 ratio in Otto et al. 2013 of estimated CMIP5-mean ERF in 2010 before and after adjusting for CMIP5 models’ stronger than AR5-based aerosol ERF.
Conclusions
The conclusion we drew in the Reply from this analysis sums up the results of our analysis:
The differing evolution of temperature in observations versus models is consistent with the substantially different observationally-based and CMIP5-mean TCR estimates once differences in the evolution of estimated forcing and in the effects of volcanism and multidecadal internal variability are accounted for.
Nicholas Lewis 20 December 2019
The fundamental mistake made is to actually believe models accurately describe reality. Just because someone found a way to regenerate the broad features of observed curves doesn’t mean the model assumptions and functions indicate true causal relationships in reality.
We have found for decades model predictions don’t pan out. They have no predictive value. Furthermore, models disagree with each other, and make different assumptions to produce their features. Averaging the results of different models is nonsense.
You have a shiny toy, go play with it.
Well said Cago………
Didn’t the IPCC admit several years ago that the models did not reflect real-world conditions and never had?
Somebody will provide the link if I’m right. And if I’m right why are we still paying any attention to the models at all?
Try this link…
The UN’s IPCC on Climate Models, page 774:
“In sum, a strategy must recognise what is possible. In climate research and modelling, we should recognise that we are dealing with a coupled non-linear chaotic system, and therefore that the long-term prediction of future climate states is not possible”
IPCC Third Assessment Report, The Scientific Basis 14 2 2 2, p.774
https://www.ipcc.ch/site/assets/uploads/2018/03/TAR-14.pdf
Exactly.
Reading the actual IPCC reports instead of the fear mongering Summary For Policy-makers (written by politicians) and scary alarmists ignoring the IPCC reports (only the latter two ever get reported in the msm) tells you that models are not fit for purpose, and in any case changes in society and technology will entirely mitigate and effect of a warmer climate.
Tell that to most people and they yell at you for being an evil denier. It’s a topsy-turvy world we live in, when true science is ignored in favour of political alarmists, even by supposed scientists.
You that statement will be ignored by the chosen,Greta will demand three hail Greatas!
Cam_S
The next sentence from the paragraph you quote states:
“The most we can expect to achieve is the prediction of the probability distribution of the system’s future possible states by the generation of ensembles of model solutions.”
Perhaps think of the ensemble range as a golf fairway with ‘rough’ and ‘out of bounds’ areas at the edges. Annual observations are the lie of the ball with each shot. If the ball falls outside the ensemble range (out of bounds) then the model range is wrong. Too much time in the ‘rough’ (lower or upper 5% of the ensemble range) and likewise the range is wrong. However, if the ball lands on the fairway for at least 90% of the observation period (which runs to 2050), then we can’t yet say the model range is wrong.
According to the IPCC metric (as calculated by Ed Hawkins, University of Nottingham), the ball has skirted the lower edge of the fairway and has been in the rough a few times; but not yet for long enough to invalidate the model range. Nor has it yet fallen ‘out of bounds’ and current best estimates place the ball on the fairway; albeit at the lower side of center (2019 observations will push it further away from the lower ‘rough’ than seen in this 2018 update):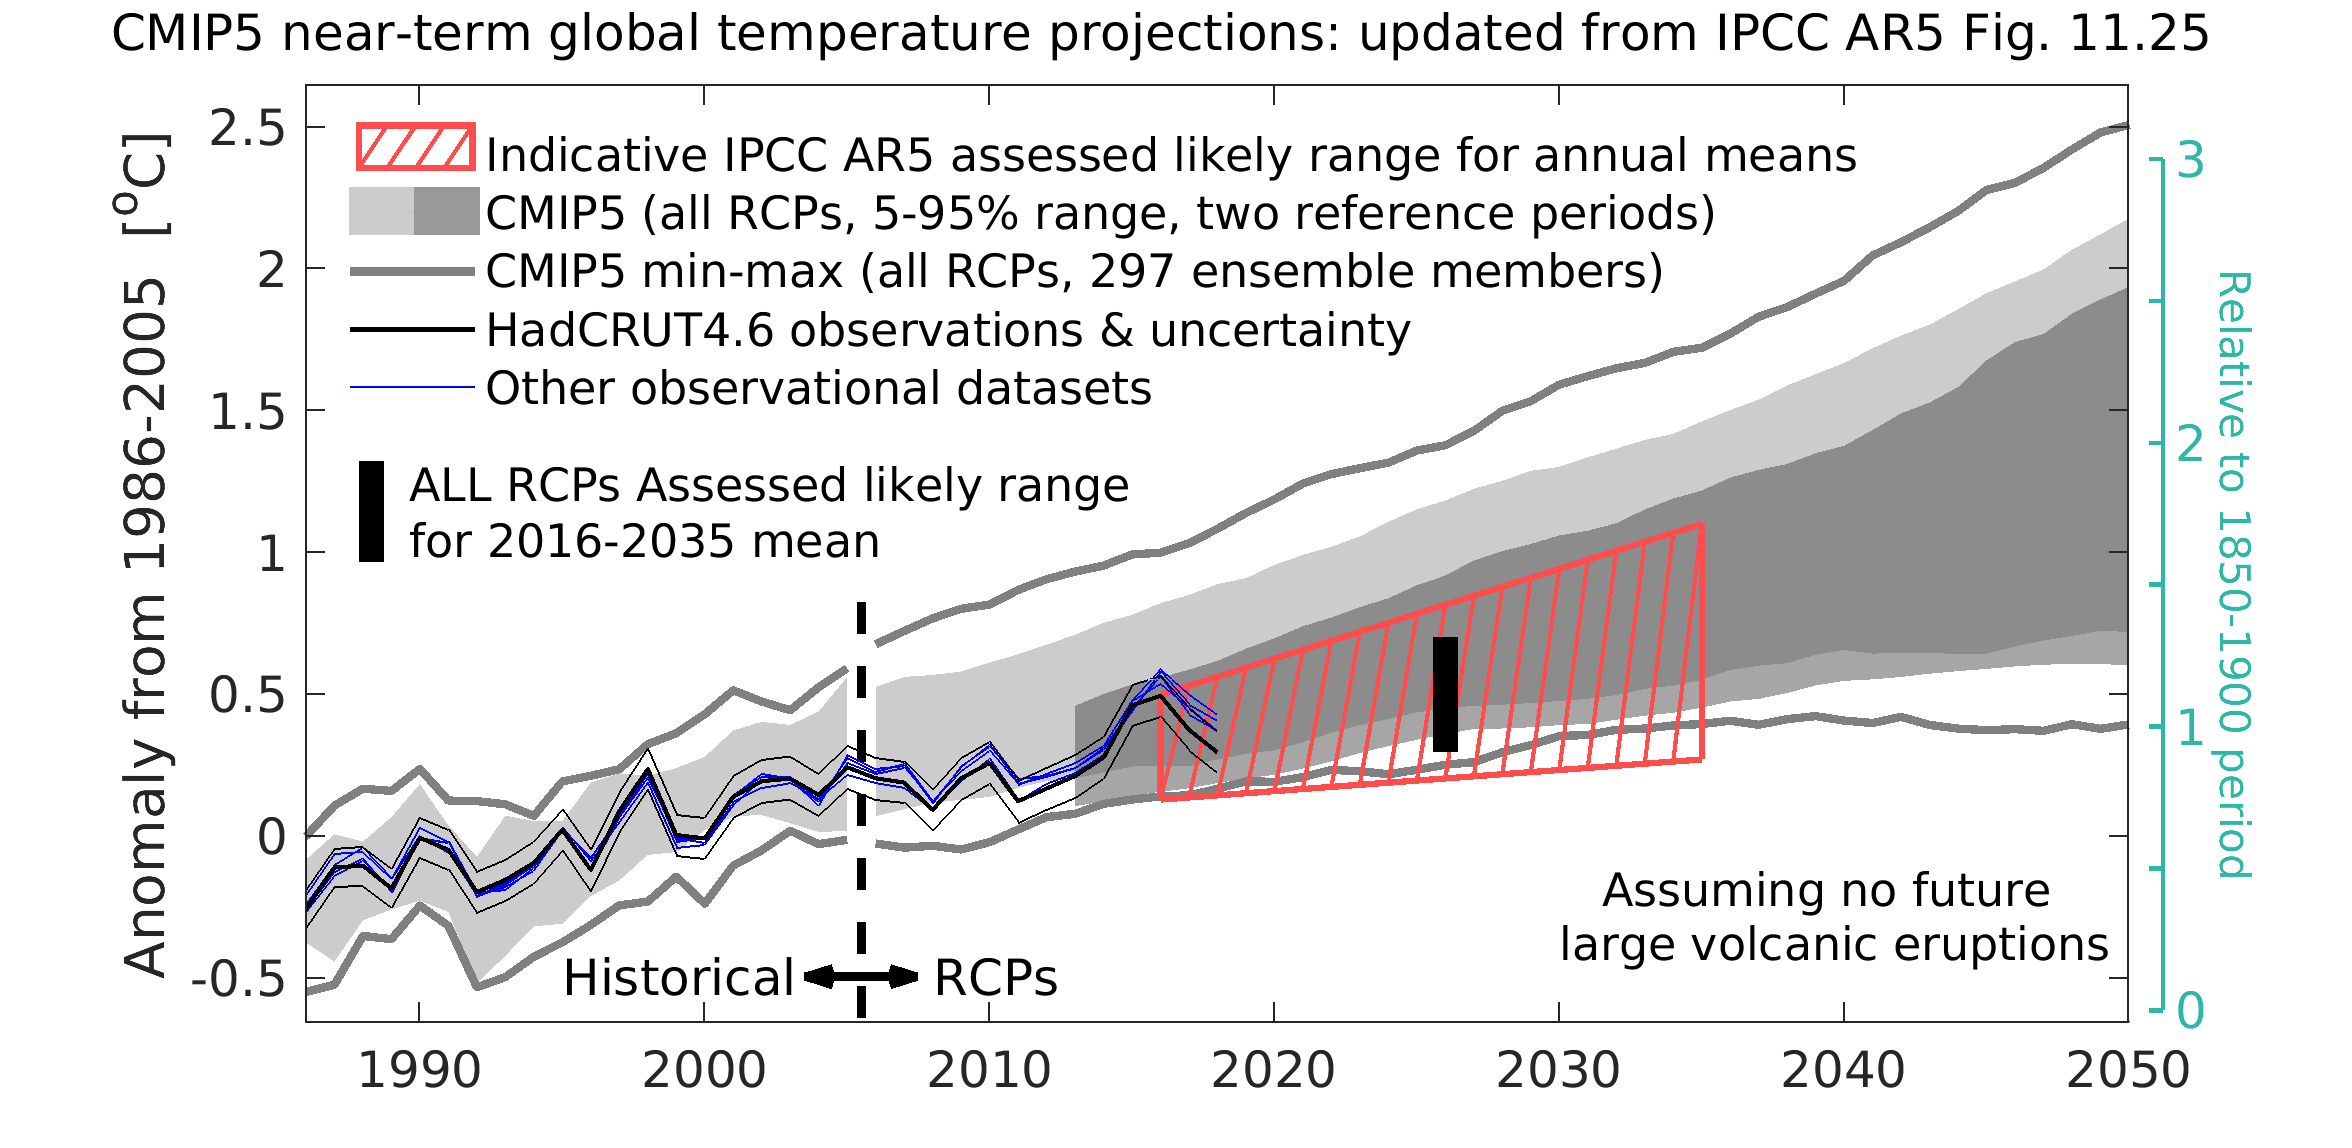
except the models work. even exxons model worked.
Do they work to explain the medieval warm period or is that fake news like the moon landing 😉
Ha ha!
Now that’s funny, right there!
Models only work if they are paid lots of $$
“except the models work…”
The only time the models work is when they ‘hindcast’
And even Steve knows hindcasting is cheating, pure and simple.
It’s just tweaking the models to predict a known answer.
It’s predicting the outcome of a game after you know the final score.
Showing 3 times the warming that actually occurred, works???
Exxon never had any models, all they did was to review the publicly available studies.
steve, are you being paid to embarrass yourself? If so, you aren’t being paid enough.
MarkW
“Exxon never had any models…”
Ha ha!
https://www.scientificamerican.com/article/exxon-knew-about-climate-change-almost-40-years-ago/
Just because you ignore things does not mean they don’t exist, Sir!
Wow, what an eye-opener! I was an avid reader of Scientific American as a teen science nerd in the 60s. This is the first time in decades that I’ve read one of its articles. I had no idea it had changed so much. Boosting the AGW narrative and smearing contrary views undermines its claim to be scientific. It’s sad to see such decline in a once commendable periodical for a broad science-oriented public.
The word “models” appears exactly once in the article, and doesn’t provide anymore information. Yup, that’s conclusive alright.
Oh, what a maroon! WHICH models work, and why are so many completely out of whack??Why not NAME for us the models that work, then tell us why the three-dozen or so others DON’T work?
Put it here, pal….
Thank you Cago. To me the most logical thing to do is pick the model that most closely resembles reality and run with that until it diverges significantly, and with no apparent cause, from reality.
Spot on , that averaging is nonsense .
2 wrongs don’t make it right .
Turn left 3 times before u r heading in the right direction .
From the article: “The post-1900 cooling, and the lack of warming between the 1940s and the 1970s, in observed surface temperature with the response to volcanism removed, likely reflects cool phases of the Atlantic Multidecadal Oscillation (AMO).”
“Lack of warming between the 1940’s and the 1970’s”? That’s an odd way to put it seeing as how some climate scientists in the 1970’s were convinced the Earth was about to enter another Ice Age because the temperatures had been falling for decades from the 1940’s to the 1970’s.
Perhaps a visual representation of events is called for. Here is the AMO chart:
As you can see, the warming period from about 1910 to 1940 and the cooling trend from 1940 to 1980 is clearly shown and then the warming trend from 1980 to the present is shown.
The cooling of the 1970’s was equal to the cooling in the 1910’s, and the warming up to the 1940’s is equal to the warming today. This is the global trend: It warms for a few decades and then it cools for a few decades.
Below is Hansen 1999 the US Surface temperature chart. Note how closely the profiles of the AMO chart and the Hansen 1999 chart compare to each other. It should also be noted that all unmodified (actual temperature readings) regional charts from all over the world show the same temperature profile as the AMO chart and the Hansen 1999 chart where the 1930’s show to be just as warm as today.
Since, according to actual temperature readings, the Earth is no warmer today than in the 1930’s, this should be considered evidence that CO2 is at best a minor player in the Earth’s atmosphere.
If we threw away the fraudulent Hockey Stick charts which have been used to artificially cool the 1930’s and artificially warm the 1970’s into insignificance in the Data Manipulators computer programs (probably the reason for the odd wording above, the writer giving too much credence to bastardized temperature charts), and went back to relying on actual temperature measurements, then we could say and demonstrate that CO2 is nothing to be afraid of, instead it benefits humanity.
The only thing saying CO2 is a bad thing are the bogus, bastardized, fraudulent Hockey Stick charts which have turned the true temperature profile of the Earth upside down in an effort to sell the false narrative that CO2 is bad for humanity.
And here’s the Fraudulent Hockey Stick. Notice how the bastardized chart minimizes the warmth of the 1930’s and the chill of the 1970’s, and makes it appear like the temperatures have been getting hotter and hotter for decades and the present day appears to be the hottest period in the whole record. It’s all a LIE!!! The actual temperature readings put the lie to the computer manipulations You can see it all right here in this post:
This is the ONLY “evidence” the Alarmist have, and it’s all fake, fake, fake! Don’t be fooled!
Which is why I contend Hansen knew he and the rest of CO2 fraudsters had about until about 2015 to pull off the climate scam before it was game over on the warming. That would be assuming the AMO is really quasi-periodic between 60-80 years with a late 1970’s start.
Hansen testifying in the Senate in 1988 delivering his predictions, the 30 years to pull of the hustle was just too good an opportunity to pass up for an environmentalist.
I also guessing they anticipated peak oil hitting by 2000-2005 (as widely predicted in the 1980’s and 1990’s) would provide the unforced reduction in CO2 emissions. With declining oil and natural gas and the cyclic downturn in GMST they could continue the “correlation is causation” scam.
Their warming phase scam: 1978 + 35 (± 5) yrs = 2013 ± 5 yrs
We’ve been at a GMST plateau for 4-5 yrs now, aided by a very convenient big 2015-2016 El Nino. But the climate scam party for the Boyz and Girlz of GISS is pretty much over now, coinciding with the deep solar minimum we are now in. We’re now likely to see a step change downward (or two) in the coming 15 years. But the boyz and girlz at the NASA Adjustment Bureau will no doubt being furiously working up station data deletions and new infilling AlGorerithms to their best computer synthesis abilities. But there will only be so much they can do, given both satellite and balloon tropsopheric data will still be collected and reported.
As far as I can tell, Lewis and Curry aren’t being criticized for using the wrong temperature data. What they do is demonstrate that, even if you take a highly adjusted data set, the climate sensitivity is non alarming.
There is nothing wrong with Lewis and Curry’s paper. Climate sensitivity to increasing atmospheric CO2 is too low to cause dangerous global warming. Full stop.
https://wattsupwiththat.com/2019/12/02/an-anti-climatic-response-to-okboomer-and-cop25/#comment-2860984
[excerpts]
… I also believe that the climate fraudsters’ game plan is about to come off the rails – even the most ignorant members of the public are becoming aware of rising electrical power costs and the accelerating extremist hysteria of the climate fraudsters, and are becoming more skeptical of the wilder-and-wilder claims of the doom-mongers.
The more clever people will also question how the climate doomsters have failed in every one of their very-scary predictions, some 50 or so false scares at last count.
The best objective measure of scientific competence is the ability to predict, and the climate doomsters have a perfectly negative predictive track record – every one of their very-scary global warming and wilder weather predictions has failed to materialize.
The climate fraudsters solution to their “failed-prediction” dilemma has been to create an ill-defined non-falsifiable hypothesis – where everything that happens is evidence of climate catastrophe. Right-o!
“A theory that is not refutable by any conceivable event is non-scientific.” – Karl Popper
“Oh! You’ve got to be pulling on my leg!
– Gru
https://www.youtube.com/watch?v=ol4TprvnB5w
Also, I believe that climate is about to get colder as part of a natural cycle, and even the stupidest people will question how “warmer equals colder”. Earth had a brief cooling period at the end of Solar Cycle 23, and we are now at the end of SC24, the weakest in ~200 years, and I believe that more cooling is imminent.
Bundle up, everyone, and Happy Holidays!
Regards, Allan
“Averaging the results of different models is nonsense.”
Averaging the ensemble to get an ensemble mean, as done in CMIP presentation in the IPCC reports, makes perfect sense to the Climate Model Cargo Cultists intent on keeping everyone in the playbox happy with their charade. Everyone’s model contributing to the model mean helps to establish GroupThink as all those playing along get to keep playing with their shiny toy, without the ugliness of deciding whose shiny toy is better. It’s all very Alice in Wonderland-like — everyone lying to each other in the IPCC CMIP game and thus everyone keeps getting a piece of the publication and money pie. And if anyone steps out of line by acknowledging it’s all just junk science, the cult leaders punish them in journals and marginalization in the community. Very effective.
Only in climate science do you find people who believe that by averaging lots of wrong answers, you can get the right answer.
…and if you don’t like the average, throw out a few selected models at one extreme until the average matches something you do like. Maybe also include some extra models from your buddies to pad-out the average in the direction you desire. Et voilà …the science of IPCC climate models.
Mark W
Very well put, indeed.
Many in the media seem to work on much the same principle; write lots of bad articles, the sum of which will equal a stellar career.
The latest piece of vomit-inducing media I encountered was an article a few minutes ago on how Greta has ‘denialists running scared’. That wasn’t in the hard left press or broadcasting (ex-Fairfax, Guardian, Aust. Broadcasting Corp, SBS etc). That was in Murdoch’s flagship national newspaper.
“observed global temperatures from 1860“…
I guess they were collected by faries, pixies, unicorns and meremaids. Cause they definitely weren’t measured by humans.
GIGO
They should have said “observed temperatures from around the globe”.
“Based on an ensemble of 25 CMIP5 models with the requisite data and the LC18 preferred median TCR estimate when using globally-complete Had4_krig_v2 temperature data. Values are anomalies from the 1869–82 mean.”
But they really mean globally-complete temperature data from 1869-82.
This makes as much sense as a discussion on the glaciology of Tatooine.
Most models incorporate CO2 as the dominant component.
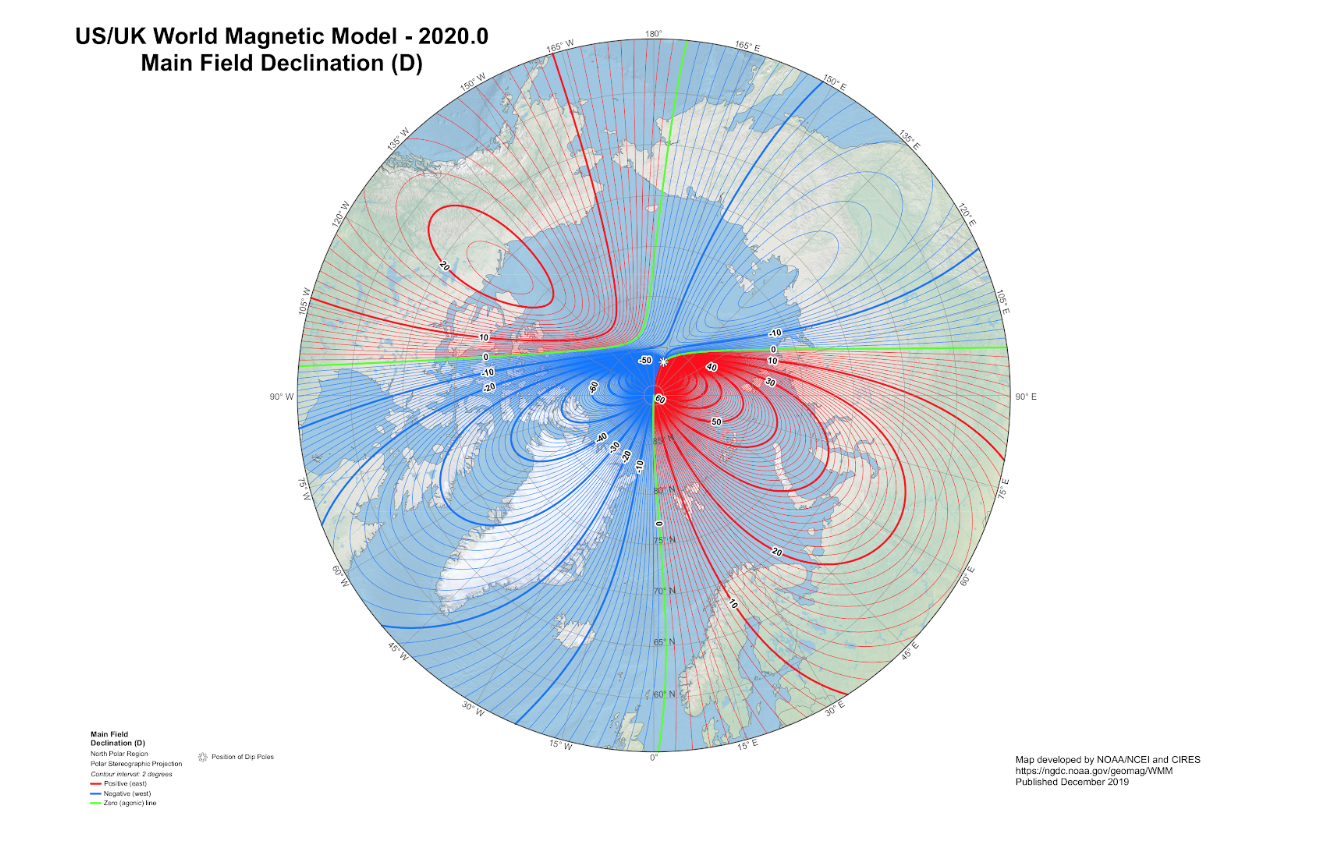
Strength of the Earth’s magnetic dipole makes much stronger case than the CO2 for estimating the global temperature natural variability trend.
http://www.vukcevic.co.uk/GMF-CT4.gif
That’s interesting but how would that work physically? There are some periods of poor agreement as well. How do you account for the 30-yr period from about 1925 to 1955 or the most recent digression? And what physical process would account for a ten-year lag?
Hi RD
Good questions, here is quick response to your query what might be going on here
Let’s look at the 1925-1955 digression, this is what the global surface temps graphs looked like 10 years ago
http://www.realclimate.org/images/adjusted_had.jpg
now compare to what they published just a month ago
http://www.vukcevic.co.uk/CT4-GMF.htm
data is continuously readjusted to get closer and closer to the CO2 curve.
It should be added that the magnetic dipole strength data also do contain certain degree of uncertainty, with the accuracy increased in the more recent decades.
“how would that work physically?”
Ocean currents transport heat energy from the equator towards the poles, faster are the currents more heat moved before it is lost to the radiation warmer the globe.
One of basic principles of electromagnetism is that a force is required to move a conductor through magnetic field, due to the current induction, stronger the field greater the resisting force.
Ocean currents due to their salinity are good conductors; as the Earth’s magnetic field weakens the oceans’ current circulate just a bit faster moving more heat and further towards the poles than is the case at the times of the stronger field.
The above might explained the delay, currents have low velocity and it might take few years for the moving subsurface volumes of water of changing temperature to take full effect.
“One of basic principles of electromagnetism is that a force is required to move a conductor through magnetic field, due to the current induction, stronger the field greater the resisting force.
Ocean currents due to their salinity are good conductors; as the Earth’s magnetic field weakens the oceans’ current circulate just a bit faster moving more heat and further towards the poles than is the case at the times of the stronger field.”
Very interesting!
I’m guessing none of this has been incorporated into the Global Climate Models. It appears “the science” is not quite settled yet.
Prompted by the comment from Rich Davis above and considering ‘my hypothesis’ of the ocean currents velocity is affected to some degree by changes in the magnetic field intensity, it is more appropriate to use global SST (sea surface temperatures) instead L+O (land & ocean) which gives far better agreement in ‘the 30-yr period from about 1925 to 1955’ as shown in the link
http://www.vukcevic.co.uk/SST-GMF.htm
Thanks for the explanation. Fascinating, I’m glad I asked.
It seems that the prediction is for about another decade of slightly cooler, but relatively unchanged temperatures if I follow your argument.
If I may throw out a further question, what might be the cause of the overall trend of the past century with increasing magnetic field intensity? Does solar activity play a role?
The right-hand scale is inverted and shows fall in the intensity of the magnetic dipole. Geomagnetic storms do have an effect but magnetic field tends to recover rapidly.
North magnetic pole has a weak long term correlation with the sunspot count, however correlation at the South pole between sunspot cycles intensity and the change in magnetic field intensity over period of 20 years, e.g. Bz(2000) – Bz(1980), is significant.
For more details see http://www.vukcevic.co.uk/TMC.htm
Note: inverted magnetic axis at right hand scale
It is unlikely that the relationship is direct, it is more likely it is indirect, i.e there is a common cause for both.
How long before a ‘peer reviewed’, ‘climate science’ paper blames shifts in the Earth’s magnetic field on CO2 from burning fossil fuels?
https://www.nature.com/articles/d41586-019-00007-1
Place your bets…
No betting from me, but readers might be interested to know that the North magnetic pole has crossed into the east hemisphere (Russians nicked it !)
Many world airports will have yet again to re-label their runways.
Maybe. Maybe not. But if all “forcings” are not equal (how I have to spit the word out), how do modelers discriminate between events past. Are these relative discrepancies between forcings constant over time, or just adjusted on an as-we-go-along basis? Or do they arise as a result of different effects arising as output from the models (which brings me back to my objection to the use of the word forcing in the first place).
Measured water vapor trend has increased faster than possible from feedback. https://watervaporandwarming.blogspot.com
“That omission reduces CMIP5-mean warming over the historical period by 0.1°C, mainly during the third quarter of the 19th century. ”
S’Truth L&C. Read this stuff out loud to yourselves and then try to get out more. Cowtan and company must be perfectly happy to be shown they are ‘off’ by only 0.1C in a science with real error bars of 1-2C. Especially when most of this ‘error’ was between 1862 and 1882!
Thank God events have rocketed past both doomsters and sceptics making the Climate Wars moot and rather silly. We are already deeply into the unstoppable ” Big CO2 Experiment”. The Western World can turn out the lights and shut down their economies in a self flagellating maniacal fervor and still CO2 will rise to double and more. We will have excellent real ECS numbers. We will have cost-benefit for CO2 (so far a greening earth and bumper crops gives ‘benefit’ a couple of orders of magnitude lead over costs). We will look at all these papers and laugh.