Guest post by Paul Dorian

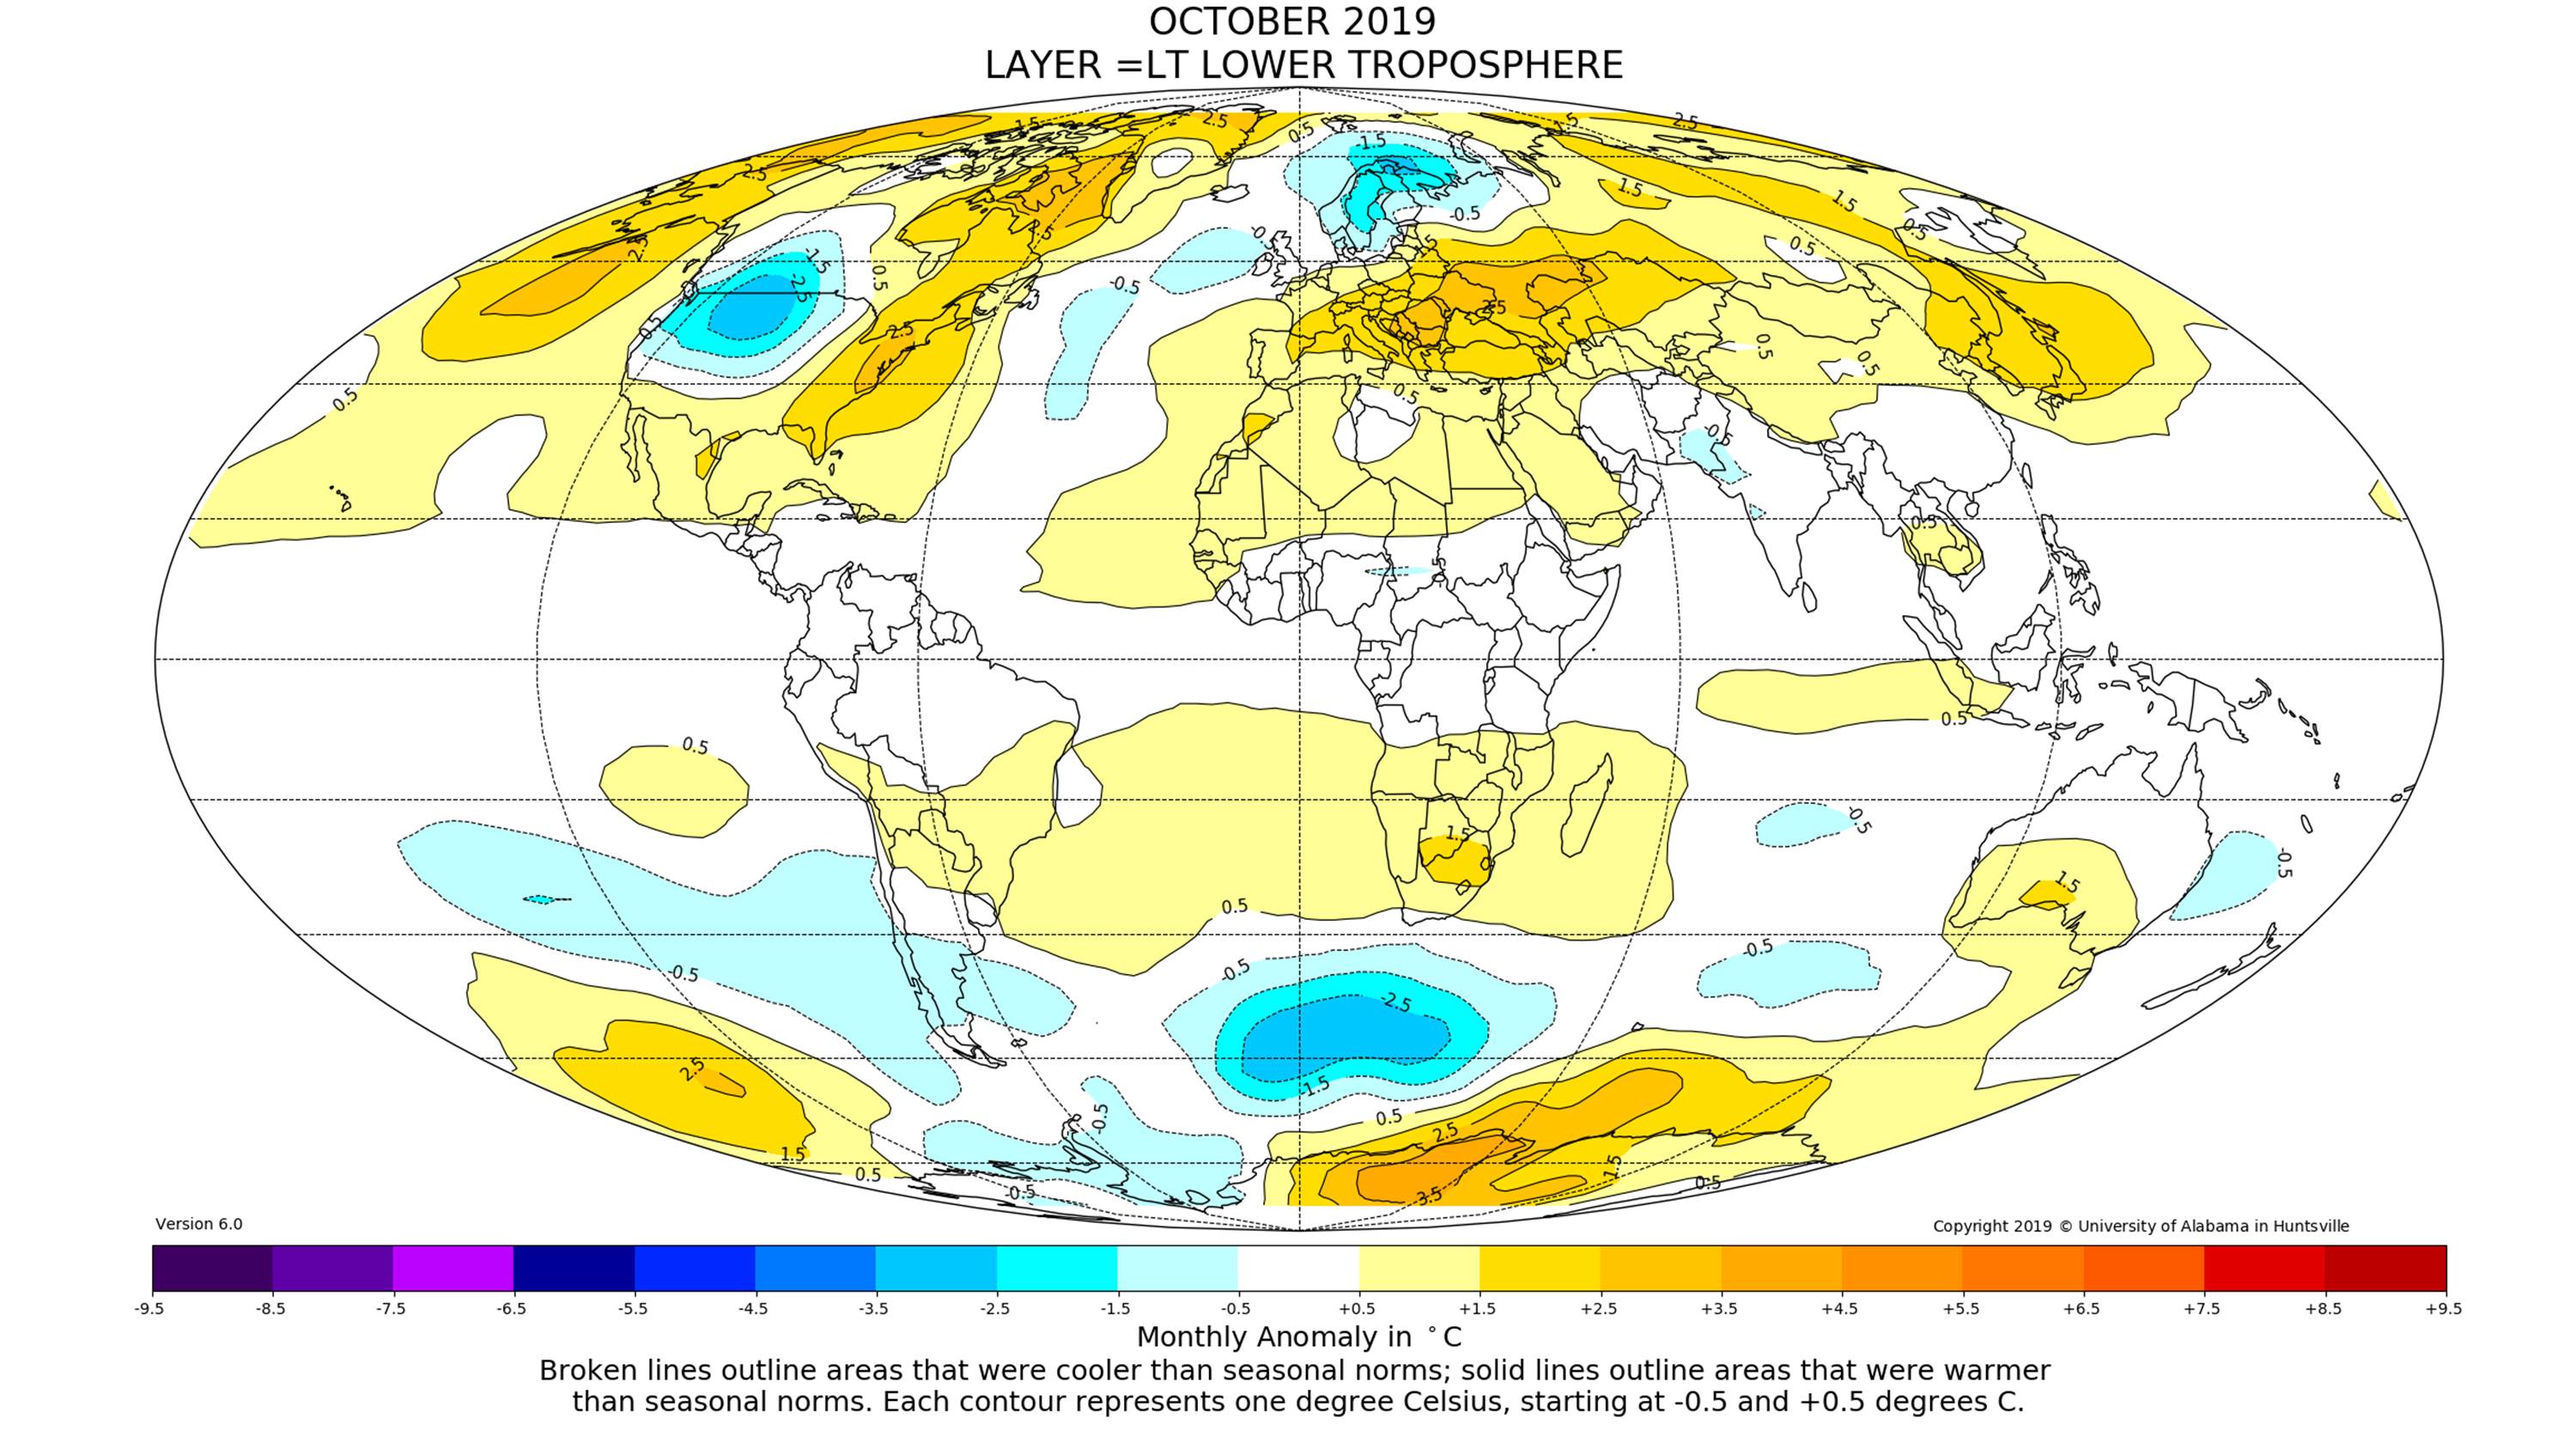
Overview
November has started off much colder-than-normal across the nation and there won’t be any let up for the eastern 2/3rds of the nation into at least the middle part of the month. The cold start to the month follows a colder-than-normal October across the CONUS with more than twelve-hundred sites experiencing the lowest temperature ever in the month of October and, even-more impressive, many locations set their monthly record for the month as a whole. Multiple cold air outbreaks will ride along the polar jet stream during the next couple of weeks from the northern part of Canada to the Mid-Atlantic/NE US with the first one arriving in the Thursday night/Friday time frame and another next Monday. The late week cold blast will also feature rain-changing-to-snow in parts of the interior Mid-Atlantic and NE US and several inches can accumulate from western New York State to upstate Maine.

Recap of the October cold
A few of the standout new monthly lows (data courtesy of NOAA, “electroverse.net”):
· Eureka, NV‘s reading of 2°F on October 30 broke the previous monthly record of 3°F set back 1971, and is now the town’s lowest-ever October temperature in 131 years of data.
· McDermitt, NV set a new cold-record in books dating back 127 years — last month’s -10°F busted the previous record October-low of -6°F set in 2002.
· Lamar, CO‘s Halloween low of 1°F is now the coldest October temperature since records began some 126 years ago, smashing 1991’s previous record of 8°F.
· Haskell, TX surpassed its previous monthly low from way back in 1917 — the 18°F observed on the 31st is now the city’s lowest-October temperature in the record books dating back to 1893.
In terms of monthly temperature records, a few of the noteworthy highlights included Spokane, WA which suffered its coldest October-ever in the record books dating back to 1881. The National Weather Service data confirms the average temperature of 42.3°F observed last month broke the city’s all-time record of 42.8°F set way back in October 1905 (the Centennial Minimum). Also worth nothing is that three out of four of Spokane’s coldest Octobers ever (in 138 years of records) have occurred this century — including 2002 and 2009. Another example included Rapid City, SD — the NWS reports that the average temp of 38.1°F registered at Rapid City Airport was the coldest-ever for the month of October in books going back 100+ years, beating out the old record of 38.7°F from 2009.
Finally, the coldest temperature ever recorded in the continental US during the month of October was likely set in Peter Sinks, Utah. Peter Sinks is a natural sinkhole in the northern part of Utah at an elevation of around 8000 feet and is known for its highly localized effects. Nonetheless, the unofficial overnight low temperature there of -43.6°F on 30 October was pretty amazing. Nearby Salt Lake City, Utah provided some supporting evidence of the extreme cold on that day as it set a low temperature record of 14°F for 30 October and records there go all the way back to 1874.

Late week cold blast
A significant cold air outbreak is headed to the Mid-Atlantic/NE US from the northern part of Canada at the end of the work week. As high pressure ridging intensifies across Alaska and western Canada, the upper-level air flow will develop in a manner which allows for the transport of air from way up in Canada to the central and eastern US. In fact, forecast maps of “backward-trajectories” ending on Saturday morning depict air movement from northern Canada into places like New York City and even into the Southeast US (Atlanta, GA). This type of upper air pattern was an important factor in the 2019-2020 “Winter Outlook” issued by Perspecta Weather in October.
As the cold air pushes to the southeast late this week, moisture will push northeast along the advancing frontal boundary zone. This should result in a rain-changing-to-snow scenario in much of the interior Mid-Atlantic and NE US with several inches of accumulating snow possible from western NY to upstate Maine by Friday morning. In addition, the Great Lakes “snow machine” will get turned on late in the week as the unusually cold air crosses over the still relatively warm waters causing instability in the lower part of the atmosphere for downstream locations. While there can be some snow shower activity in the DC-to-Philly-to-NYC corridor with the arrival of the cold air at week’s end, the bigger story in these areas will be the cold.

Cold blast early next week
All signs point to another cold air outbreak for the central and eastern US early next week and this too can feature snow in interior sections of the Mid-Atlantic/NE US and Great Lakes. Much like the late week cold air outbreak, this next air mass will drop southeastward across Canada and then push through the Great Lakes to the eastern seaboard. Once the cold air is established, we’ll have to watch for a possible wave of energy to rotate through the upper-level trough which could result in snowfall for the Mid-Atlantic/NE US by the middle of next week. Looking even farther ahead, it appears this colder-than-normal weather pattern that began in the eastern US on the very first day of the month may very well continue for much of the month of November.
Meteorologist Paul Dorian
Perspecta, Inc.
Paul
How is the cold/snow compaired with last year,? I know you guys had a long cold winter last year, are the starting dates for this current cold spell earlier than last year?
Northern and north east Europe are also into a very cold spell with cold and snow records being broken in Sweden, have a look at the total snow accumulations for the N/H note it’s way out of the average again and started much earlier, it does not cover mountain snow
http://www.globsnow.info/swe/GCW/GCW_Snow_Watch_plot_20191104_SWE_NRT_v1.3.png
Last year on Nov 30th was the 1st time I, in my 50 years on this planet, had ever been ice fishing that early.
5” of ice on a Lake south of the Twin Cities. This winter is starting out much colder 🙁
As I thought good call.
Joe Bastardi of Weatherbell Analytics has been predicting this for months–yawn.
Oh the humanity!!(wringing my hands), how will we survive???
Did you catch any ice? Inquiring minds want to know.
Have a look at Norway
Yep so cold yet MSM Completly ignore all this real climate news, I have already part funded a pending court case against the BBC there blatant biased reporting is against there charter. How much luck we will have with a increasingly left wing judiciary is to be seen.
https://www.nationalgeographic.com/environment/2019/01/climate-change-colder-winters-global-warming-polar-vortex/
You know that article is some what deceiving, it attributes a polar vortex as being driven by climate change,its not polar vortexes have been happening for ever its natural event vortexes are ethier weak or strong a weak vortex moving cold air south is due to sudden stratospheric warming.amongest other things,again this is not a new phenomenon ,what you produce is at best a interpretation of climatology goop ,you need decades of observations to show if climate change is having a perverse effect on polar vortexes ,considering climatology has been telling us for decades were going to cook and it has not happened I would take any junk article like you produce and light the fire with it.
As of yesterday, Finland broke twice the all time autumn low… -28.2 degrees C. Which is only observed in december or january…
-14C here in Finland today, ice building on the sea – snow has been on the ground 2 weeks already – exceptional for this area of Finland for October, early November.
And have a look at other places – but only if they’re cooler than average.
. . . and alarmists and the MSM industrial complex give a balanced look at hot and cold?? /snark
Krishna Gans
What about having first a look at Germany?
Berlin
1. Forecast December 2019
https://www.accuweather.com/en/de/berlin/10178/december-weather/178087?year=2019
2. Forecast January 2020
https://www.accuweather.com/en/de/berlin/10178/january-weather/178087?year=2020
Do you want me to remind you about Berlin’s temperatures in 2014, 2011?
And in 1986, 1963, 1956?
It’s amazing to see people always telling ‘nothing unusual’ when it gets warm, but cr<ying and shouting when it gets cold.
iceage.info?
Pffff.
Forcasts one and two months away, yes very convincing I am sure.
Why compare one City in a small country to half of the USA, Norway, Sweden, Finland, Southern Australia and Russia?
All of those places where Cold Records have been broken by large amounts not the 0.01 of a degree like warm ones.
Getting worried that evidence no longer supports your CAGW meme?
Haha, you’re trying to use Accuweather’s speculative long-range forecast as an argument in a discussion? I think I might have some property on the moon I could sell you!
accuweather.info?
Pfff.
i contacted “accuweather” about a couple of high temps in the 50 to 60 degree C range a while back when they still had historical data on their site. Pretty unusual temps for northern Minnesota one would think Never heard back from them.
For fun I now take a screen shot on a month by month basis for the forecast and compare it to the actual data a month later. Always interesting.
I’m laughing at all these replies.
Why?
Because while CONUS experienced harsh low temps during the last two winters (remember Cotton, MN with -49 °C, Mt Carroll, IL with -40 °C), Western Europe (and thus not only ‘a little country’) had very mild winters, including UK despite some claims about -20 °C on one or two February days.
And these two very mild winters were predicted by… exactly this NOAA so many of you discredit all the time.
When I read ‘All of those places where Cold Records have been broken by large amounts ‘, I would appreciate real information about this: that means, NOT coming from professional Coolistas like iceage.info!
Show me these officially credible COOOLD RECORDS!
Then I’ll start believing you.
You could start by looking at average temps then looking at the present readings try Scotland for a start lets see if your figures match mine, why do you not acknowledge the USA had its last winter the coldest for over a hundred years and following suit this year,have you seen the posts on here about below record breaking temps in Norway and Sweden,surley you dont think these ares are insignificant, so were exactly does co2 fit in is it not supposed to be warming the planet, are you telling me it turns off in the winter its selective and seasonal. Exactly what part is c02 playing in the above areas right now?
B d Clark
Again and again: no need for me to read prosa!
I await real information, e.g. official temperature information.
But anyway: next week I’ll download GHCN daily’s October data, that is raw raw info.
I will then see which stations worldwide did report what you write in a non-committal form.
The temperature readings are true in the given areas , i see you did not except the 10min challenge at most to do a comparison of average vs now temp readings for Scotland, nor did you explain the vagaries of cold areas in the N/H with regard to c02 influences, it does seem to be selective and seasonal does it not.
B d Clark
It’s not just 10 min. Downloading and unpacking 3 GB GHCN daily data costs 1.5 hours.
Have you seen this https://electroverse.net now you could accuse them of being selective but its huge areas of the planet and they dont lie and make things up look at the thread for Australia. Now given all time records are being broken why do the media main stream not publish this particularly the BBC who have a charter to be representative, I would say their gross denial of what’s really happening with the climate is criminal, before you say its weather,one day of heat in the summer is flounced as climate change, there is no co2 causing warming it’s getting colder and colder.
Yuo will compare “forecasts” with real temps ?? Realy ?? 😀
What are you dreaming at night ? 😀
It’s a joke, isn’t it ? 😀
Look in a mirror, and than continue laughing, with best reasons 😀
https://wattsupwiththat.com/2019/11/05/cold-pattern-continues-for-much-of-the-us-with-the-next-impressive-arctic-blast-arriving-late-in-the-week-in-the-mid-atlantic-ne-us-and-another-one-early-next-week/#comment-2840627
What a joke.
Cherry picked distant forecasts.
Tell us what the temperature actually is when it arrives.
Meanwhile, amuse yourself with the very overwarm forecasts NOAA’s weather model has been churning out, year after year, season after season, month after month.
A forecast that they deep six while their model forecasts slowly resemble the actual cold weather outside.
Speaking of “It’s amazing to see people always telling ‘nothing unusual’ when it gets warm, but cr<ying {sic} and shouting when it gets cold.";. That is pure projection coming from an alarmist troll who chases warm days, droughts, floods, melting sea ice, etc., desperately seeking their wayward lost global warming.
It is also amazing to hear the same crowd that pushes
global warming,Anthropogenic Catastrophic Global Warming,climate disruption,climate catastrophe, climate change; where they treat every major storm as caused by climate change, every heat wave is caused by climate change, every dead walrus is caused by climate change, wailing over the same low sea ice levels every year (while mostly pretending Antarctica doesn’t exist); on and on, the illogical rational of alarmists bemuses and confounds every scientist. Yet, here you are right after all the alarums raised over Eastern storms, warm Octobers, heat waves in Australia (don’t forget BOM’s bodged fudged temperatures).The article states clearly what fronts are bringing what kinds of cold weather to town.
This week and next week.
Based on the accurate to date forecasts that identified the causes and possibilities for extended cold weather.
Once snow cover forms, albedo is biased to keep it old.
A forecast about Christmasweather etc is all, but not serious.
Da rise of da stupid, sorry, finally it isn’t an argument against measured temperatures.
seriöse Meteorologen geben heute (und auch die nächsten Wochen) noch keinen Tipp ab, ob an Weihnachten Schnee liegen wird
I left Berlin in the 197x, so why shouldt I care Berlin ?
1956 I was 4, no idea and dosn’t care.
1963 was a cold one, very cold.
Over the winter, we had some waxwings (Bombycilla garrulus) from Russia in our school foyer. They escaped the Russian cold.
And now ?
The long cold winter of 2018/19 started on January 1st 2019, and lasted into May in Northern California. I expect to see similar with this winter. The comparison to date of this fall versus last fall is very similar, early rains in Sept, some early October rain, and then mostly dry all the way through December. That is exactly what has taken place in recent months. The fire danger is still elevated for the area as a result.
So the forecast is that farmers will face another miserable year for next years growing season.
Yep I watch a YouTube channel that’s not climate related hes based in northern California showing exactly what you observed ,he also showed the snow pack in the sierras several times, hes given a good account of the fires up there this year.
Central PA had fairly nice weather last October. November turned cold and rainy, and December and January had several heavy snows and cold temps. April and much of May were cold and wet delaying planting of crops like much of the mid-West.
Lousy warming trends, it’s always someplace else.
My only concern is that there are no actual references shown on Electroverse, only a general one referring to NOAA.
Some Station data or City Declarations would have been nice.
Lower Lakes region (Lake Michigan, etc.) and the cold and snow started on Hallowe’en – naturally! – in Chicago and the surrounding counties. I had 5.25 inches of snow on my front steps. I am 8 miles south of the IL-WI state line and the rest of my county and counties to the west were also inundated by it.
So I would say the traditional/official start of the winter season may be the winter solstice, but the Weather Gods have other ideas. And we’re all due for more snow over the next three days. In re: temperatures were average for snow: low to mid-30s in most places, but that may have something to do with which side of Lake Michigan you’re located on.
Does that help?
Yes thank you .it really does seem that after a very cold snowy winter last year for you guys ,its started even earlier this year, same in northern /eastern Europe.
It’s supposed to be 22F tonight, with snow before morning.
What the H E double hockey sticks happened to Globull Warming? PLEASE, I beg you – PLEASE BRING IT BACK!!!!!!!
Unprecedented!!!
You forgot the /sarc
And he’s quoting from glob snot info dot something or other
Sorry, I’ve been binge watching Corner Gas today.
My best comment, JackAss!
Ah, for a chili dog by the fireplace on a cold night…
The only PC news in a week will be about heat anomalies in the Arctic.
Yes, it’s -10 F instead of -20 F.
These severely impressive Arctic blasts make it look like the US has run right out of those old-time Global Warming effects. The Alarmists will have to fall right back onto the more reliable Climate Change to startle the proles into line. Climate Change has been going on for millions of years and can always be relied on.
This PROVES the CO2 impact, right? The US has lowered our CO2 output to 1980’s levels, and Europe has been increasing theirs! So…………we get the cold and they get the warming. 🙂 I think that analysis is about as good as the Climate Catastrophists, really.
Wait a minute…. I thought we was going to burn to death due to CO2? What will, The CO2 seeing High Lord greta have to say about this? (Sarc lol)
Seriously though, what caused the polar jet stream to be off this year? Im in england, and its been windy all year, maybe ive been to busy to notice it before, but due to climate anxiety, (this site helped the anxiety) ive started noticing the weather more, even during the hottest day of the year, we had a cool breeze… It felt weird.
Climate justice for reGretable….
Don’t Mess With Mother Nature! Shut up and Start paddling to Spain!
https://www.grrrgraphics.com/mother-nature
Impending cold explains why the alarmists are swarming crazily, just like yellow jackets before a frost. They need to write their grants and windmill contracts now, before Ma Nature turns their scam into the butt of the next generation’s eye-rolly jokes.
I think you hit the nail on the head,frantic alarmism is being pushed in the media in the UK right now,its election time we are seeing a home grown alarmism and the world realises of alarmism at the same time which in normal times the releases would be normally staggered as trickle feed.big figures of a trillion notes being banded around, and another court case finding in favour of XR.
It’s the jet stream. https://wattsupwiththat.com/2018/09/28/essay-solar-cycle-wave-frequency-linked-to-jet-stream-changes/
Yes CC is the fall back position. We should confront the Green blob by
asking them where the CC comes from,. what causes it ?
Make them admit that it all starts with the warming of the Planet. Then asks
them where is it right now.
Of course they will all pint to the Southern Hemisphere, especially to
Australia. This country is almost as good a place as the Polar Bear scare.
We are a land of fires, floods and droughts, perfect for the Greens scare
campaigns.
MJE VK5ELL
But, but, but …the BBC news tonight is saying we have had the warmest October on record!
Which record is unspecified and no doubt depends on what they can select to fit their narrative.
Meanwhile the loony in charge of the Labour Party is saying his government, assuming the asylums will be opened to bolster his vote, might ban private jets – the victory of the terminally resentful over reason (and no I don’t own a private jet). In other U.K. loony tunes news the BBC is trying to mislead people that electric passenger planes will soon be available. Good luck with that.
Yes, but the BBC doesn’t tell lies, does it, so there must be some point on the planet that was, after the adjustments, corrections and normalizations had been applied, hot enough to raise the average by 0.01ºC for a few seconds in October. Because it absolutely was the hottest October evah!
https://www.bbc.co.uk/news/science-environment-50302392
The temperature anomaly data in the BBC article they have provided is clearly faked. Temperatures in Siberia have been record cold thoughout Oct. with most of Siberia below zero continuously from the arctic coast in the north and into northern China from an early Sept freeze. Their anomaly chart does show the cooling in Britain and the US, because they knew they couldn’t fake that data and get away with it, but they have fudged the data on Siberia – if they showed the actual situation in Oct 2019 they entire bulk of the European continent east of Moscow would be blue.
Roy Spencer’s UAH TLT shows no such cold over Siberia, the land east of Moscow is not blue.
But this one shows cold very cold for northern Asia Russia, the devil is in the detail
https://www.tropicaltidbits.com/analysis/models/?model=gfs®ion=asia&pkg=T2m&runtime=2019103112&fh=0
But this one shows cold very cold for northern Asia Russia, the devil is in the detail
We were talking about the month of October not one day.
Weather article explaining cold in Russia October http://www.hmn.ru/index.php?index=1&ts=191013132047
Another article for the same period, interesting that it says the same period data is missing from noaa records no wonder I’ve had a hard time confirming what we all heard a few weeks ago https://electroverse.net/russia-breaks-multiple-116-year-old-cold-records/
Spencer’s graph is a average there is cold and warm around the centre axis so the two weeks of cold as above is well within tolerance
Temperatures in Siberia have been record cold thoughout Oct. with most of Siberia below zero continuously from the arctic coast in the north and into northern China from an early Sept freeze.
This was what Greg posted to which I responded, ‘throughout’ does not mean ‘two weeks’.
But you did not, the only reply you gave to Greg was produce Spencer’s map.ive just looked ,Spencer’s graph in this case is a snap shot a monthly average, and I’ve provided some absolute observations.it has indeed been very cold in the regions I reproduced, if you really are interested in true temperature readings perhaps your efforts would be well spent finding out why noaa appears to have lost the data for that area in the time frame discussed
But you did not, the only reply you gave to Greg was produce Spencer’s map.ive just looked ,Spencer’s graph in this case is a snap shot a monthly average, and I’ve provided some absolute observations.it has indeed been very cold in the regions I reproduced, if you really are interested in true temperature readings perhaps your efforts would be well spent finding out why noaa appears to have lost the data for that area in the time frame discussed
Greg said:
Temperatures in Siberia have been record cold thoughout Oct.
How could that be consistent with a monthly average showing a positive anomaly?
Usually monthly averages of station data don’t come out until mid month because all the data isn’t available until then. NOAA hasn’t produced their global climate report for October yet.
The mean Central England Temperature for October was – 0•6C
https://www.metoffice.gov.uk/hadobs/hadcet/cet_info_mean.html
I also heard the lie on the BBC national news that it was the hottest October ever.
Not a surprise since they now lie about almost everything to fit with their multiple agendas.
That -0.6C is of course the “anomaly”, not the actual, and it’s compared with 1961-90 because the World Met Office knows that that was the perfect 30 years in human existence.
The BBC’s claim was about global temperature, not UK, but seems to disagree with UAH.
Roy Spencer’s UAH TLT says that October temperature was the second highest they have measured.
Here in Colorado Springs, they said we had the second coldest October on record.
Well, they have to lay the groundwork for the announcement next January that 2019 was the hottest year ever. Perhaps they will relent and let it be the second-hottest ever.
And if anyone challenges the climate wisdom, it will be pointed out that “The Models” predicted the cold weather this year in North America. Don’t forget that global warming can cause cooling too, such is the wondrous power of CO2.
Don’t worry in a few months the record will be adjusted to show October was the second hottest on record.
Greta Thunberg
Am I correct, she stuck in the USA?
**********************************
Well, now she can relax and enjoy the show… I mean the snow!
She achieved her objective and cooled the USA… don’t forget to use your CO2 blanket overnight.
I know, this is unfair… in the tropics the H2O blanket much more efficient for the kids… toughen up princess 🙂
She is now traveling east, through the southern states, so won’t be personally experiencing the snow and cold until she heads north – perhaps back to NYC.
Sounds like she prefers warmer weather…
I was wondering how she was getting around…she seems to be traveling all over the country
…how is she doing that with zero emissions?
and if she isn’t….what’s the difference in flying to Spain
Her new pal, Schartzenidiot loaned her a Tesla 3.
Her carbon footprint is almost as large as Arnie’s now and slightly larger than some small countries
Maybe she’ll go through Georgia Like Burt Reynolds in The movie deliverance. A nice little boat trip would be her good.
Maybe she and Big Al have something in common. Wherever they go Mother Nature will smack in the face.
The world is pretty warm today. See the global anomaly map.
https://climatereanalyzer.org/wx/DailySummary/#t2anom
Larry the Midwest desperately needs that global warming….we are freezing
That weather anomaly map you linked to uses 1979 as its “normal”. Why 1979? Why not1969 or 1929, or the full 100+ years of temperature data available? The problem with 1979 is the 1970s were cold; so cold the scientific consensus of the time said that we could be slipping into an ice age. Then the cold stopped. Using 1979 as the “normal” makes the later normal temperatures look much hotter, just to scare the naive viewer.
Exactly, what about the 1930’s? That was some insane highs as well as droughts. Historical news articles at the time mentioned it very frequently.
Why 1979?
Yes, I notice that too. I look at the climatereanalyzer site, but why in the world would they continue to use 1979-2000 as a base? Same reason, I assume, as all the other politically-infiltrated “weather” sites — to keep the anomalies higher. The traditional standard for climate anomalies is 30 yrs, anyway. They SHOULD be using 1980-2010.
@Larry Cullen, here’s a question for you:
What is the global average temperature right now and how does that compare with the last 100 years, 1000 years, 10000 years? Not anomalies, actual temperatures.
Larry, take a look at NuSchool Earth, especailly at that really hot band over what was the old USSR.
Temperatures ranging from -10 to -30 Degrees C.
Not exactly a heatwave.
Two points about that. First note the high snow depth in that area from that somewhat warmer air as shown on the Reanalyzer. Secondly note that the sole reason for the warm spot is the surface winds moving north carry warmed air. So until someone can explain how CO2 can control surface wind flows, then it can not be said that CO2 has any correlation with warm areas anywhere around the planet. … https://earth.nullschool.net/#current/wind/surface/level/overlay=temp/orthographic=-182.82,68.27,672/loc=165.724,56.831
Not only up there. This is the coldest spring in southern Australia in at least 17 years. At least where I am.
Had the fire going at home on Saturday, looks like I’ll need it again by the end of this week with predicted high temps of 12C for Friday and Saturday. That is the BOM forecast, so best taken with a grain of salt though.
The BOM said today that Oct was the 4th warmest in Melb. (sorry hottest) on record.
What the…..
Lucky you don’t live in WA
http://www.bom.gov.au/jsp/awap/temp/index.jsp?colour=colour&time=latest&step=0&map=meananom&period=month&area=nat
“The BOM said today that Oct was the 4th warmest in Melb.”
Stop makin’ stuff up.
Don’t lecture me. That is what I heard word for word yesterday.
Whether it’s correct or not. Also, WA was not part of my comment. Why bring it in?
100 year cold records broken in Australia
https://www.iceagenow.info/100year-cold-records-broken-in-australia/
Everyone a winner!
agree have to run leccyheater last few nights and 6c out with gale winds
tomorrow 16c at best
snow on vic alps next 2 days=badly cold here
According to the BOM forecast, the next couple of days should knock out the local lowest max for Nov 8 and 9 here by 2-3 degrees C.
I’m not going to hold my breath waiting for them to mention this on the news though, but imagine if the temp record was broken in the other direction. If the high temp record was increased by 2-3 degrees C, we’d hear about how dire the “Climate Emergency” is to no end.
NOAA issued a ‘warmer than average’ winter forecast for the USA. Given the continued ‘cool’ here in the Great NorthWet and across the norther tier of the USA, m’thinks they are a bit barmy…. again.
Good comments, thank you J Mac.
The highly competent forecasters at WeatherBell updated their August 2019 Winter forecast on October 31. I will share it if I am permitted to do so.
WeatherBell’s 2019-20 Winter Forecast reminds me of 2014-15 – warmish in the West and cold in the East, completely different from the U.S. government’s National Weather Service (NWS) Winter CFSv2 model, which again projects a warm winter across the USA. I’ll vote for the WeatherBell forecast – again.
As Yogi Berra said, “It’s like déjà vu all over again”.
The U.S. National Weather Service forecast a warm winter for 2014-15, and meteorologist Joe D’Aleo of WeatherBell called me in October 2014 to say he was concerned that the NWS forecast was seriously incorrect, and that the next winter would be particularly cold and snowy, especially in the populous Northeast. This was the second consecutive year that the NWS has made a very poor (excessively warm) Winter forecast.
Joe and I had been working together on a paper on Excess Winter Mortality, and we agreed that this incorrect “too-warm winter” NWS forecast was dangerous, especially if the country and its people were unprepared.
I proposed an approach, and we sent a presentation to my friend at the US Energy Information Administration (EIA). At the EIA’s request, Joe prepared a month-by-month, region-by-region USA Winter Forecast, and the EIA re-ran its winter energy demand calculations. Using Joe’s forecast, the EIA projected 11% more winter energy required for the USA than the “too-warm” NWS forecast had projected.
After that brutally cold and snowy winter, the actual energy used was 10% more than the EIA had projected using the NWS forecast, and just 1% less than Joe’s forecast. That is a huge amount of energy for the entire USA. I’m not sure if we saved any lives, but we definitely improved the EIA’s forecast of winter energy demand.
Regards, Allan
________________________________________
Following are two relevant papers co-authored by meteorologist Joe D’Aleo and me.
Our first co-authored paper was published in 2015 on Excess Winter Mortality. We had published the paper previously and then the excellent treatise by Gasparrini et al appeared in the Lancet, so we re-issued our paper including that valuable information.
WINTERS NOT SUMMERS INCREASE MORTALITY AND STRESS THE ECONOMY – NEXT MINI-ICE AGE APPROACHING?
By Joseph D’Aleo and Allan MacRae, July 5, 2015
http://icecap.us/index.php/go/new-and-cool/winters_not_summers_increase_mortality_and_stress_the_economy/
This is the second paper I’ve written with meteorologist Joseph D’Aleo. It concerns regional cooling and the major crop failure in the North-central growing area of North America in 2019.
THE REAL CLIMATE CRISIS IS NOT GLOBAL WARMING, IT IS COOLING, AND IT MAY HAVE ALREADY STARTED
By Allan MacRae and Joseph D’Aleo, October 26, 2019
https://wattsupwiththat.com/2019/10/27/the-real-climate-crisis-is-not-global-warming-it-is-cooling-and-it-may-have-already-started/
NEXT WEEK’S ARCTIC BLAST WILL BE SO COLD, FORECASTERS EXPECT IT TO BREAK 170 RECORDS ACROSS US
USA TODAY, Nov.8, 2019
This week’s cold snap is only an appetizer compared with the main Arctic blast that’s coming next week, meteorologists said. That freeze could be one for the record books.”
“The National Weather Service is forecasting 170 potential daily record cold high temperatures Monday to Wednesday,” tweeted Weather Channel meteorologist Jonathan Erdman. “A little taste of January in November.”
The temperature nosedive will be a three-day process as a cold front charges across the central and eastern U.S. from Sunday into Tuesday.
The front will plunge quickly through the northern Plains and upper Midwest Sunday, into the southern Plains and Ohio Valley Monday, then through most of the East Coast and Deep South by Tuesday, the Weather Channel said.
_____________________________________
Some people will say this cooling is caused by CO2 and global warming. They will be wrong.
Great lakes now at very high level, oh but the climate models said they would dry up. Models are climate QUACKERY.
The missing sea level rise appears in the Great Lakes. Who’d have guessed it?
Seriously, Great Lakes water levels are to a large extent controlled by dams at the outlets of Lakes Superior and Ontario. The outlet of Lake Erie is semi-controlled by weirs and by the rate of drawdown for hydro plants on both sides of the border at Niagara Falls. And the level of Lake Erie effectively determines the levels of Huron and Michigan.
There was concern about low water levels a few years back so they started holding back more, then the exceptionally wet weather and snowfall this last year made the lakes rise to inconvenient levels. Apparently, there’s a limit to how fast the levels can be lowered – something to do with ships trying to sail upstream in the St. Lawrence and St. Clair Rivers. Great Lakes water policy is run by the IJC – International Joint Commission on Boundary Waters.
The Old Farmers Almanac, a long-time harbinger for Winters for MANY years, says we are in for an unusually hard, cold winter. They have right for much of their many years of forecasting. So, it’s nothing new.
Out of a couple of dozen Woolly Worms I’ve seen this fall, all but 2 have been completely dark, and I haven’t seen any that are completely light. Most have been larger than usual and one was as large as my index finger (I wear XL gloves).
If those critters really tell you anything, this winter looks to be bad here at 90 west and 39 north.
the Great Lakes are warmer than normal at this time so you would think there would be record lake effect snows 10-12 Nov
however, to get really good lake effect snows the wind field has to stay consistent for six hours or so and thus we may only get some moderate lake effect out of this arctic blast
So, we’re entering ‘climate change’ season.
Summer is for Global Warming.
Yes climate change is very selective and seasonal
No, record regional cooling caused by record warming.
Ground frost here this morning in northern NSW- not unprecedented but also not very kind to young tomato seedlings. More warming please.
November started off with a tornado in NJ.
Paul Dorian, please realize that the CONUS is not a significant part of the EARTH.
My guess is he knows that so what is your real point?
You don’t know?
Significant or not, the USCRN still must be explained.
Sorry, I must have missed where he made that assertion.
It’s been colder than usual in Antarctica too. Is that a significant enough part of EARTH?
While Europe was feeling the heat this past summer, an equal or larger area of Russia was equally anomalously cold. Which part of EARTH was more significant there?
The problem is that GLOBAL Warming isn’t in any way global and most of it is where no one lives.
THe point is that these are Records broken in areas with some of the longest running records in the world.
Well, I can testify that winter is here for the UP of Michigan. I just drove 405 miles from the UP to northern Indiana and the first 150 miles was nothing but snow squalls and white-out conditions on I-75, all the way from the Soo to Grayling. Global Warming my ass……hell, I wish my ass was warm……
The cold start to the month follows a colder-than-normal October across the CONUS with more than twelve-hundred sites experiencing the lowest temperature ever in the month of October and, even-more impressive, many locations set their monthly record for the month as a whole.
All this – remember – during the “hottest October ever!!”. The climate editors and script writers are getting way too greedy and forgetting the need for even a shred of credibility. As a result they’re blowing their cover and making fools of themselves.
Or you could say the obvious: “gee it must’a been hot in plenty of other places for the average to be +’ve.”
But no, they’re all fools.
I’m hoping for a pattern change soon – to a wet pattern for California. Mammoth opens on Saturday. They were fortunate to get enough cold nights to make enough snow to open one or two runs but this week has been too warm to even make snow.
Time to kick ski season off, let the flakes start flying!
Not climate change, but rather climate shift, with recurring, irregular frequency.
and there is a 50% chance of that happening 20 % of the time 🙂
Folks, just remind your family and friends at your winter’s Holiday season parties a nd gatherings that its the Democrats that want to double and triple everyones electric bills while making their natural gas too expensive to even consider.
Climate Change is nothing to fear compared to the Climate Change policies being pushed by Democrats.