By Dr. Tim Ball, from his website.
The consistent pattern of the IPCC reveals demonization and misrepresentations of CO2. Here are some basic facts about CO2 that illustrate the discrepancy between what the IPCC claim and what science knows.
- Natural levels of Carbon dioxide (CO2) are less than 0.04% of the total atmosphere; it is far from being the most important or even only greenhouse gas as most of the public understands.
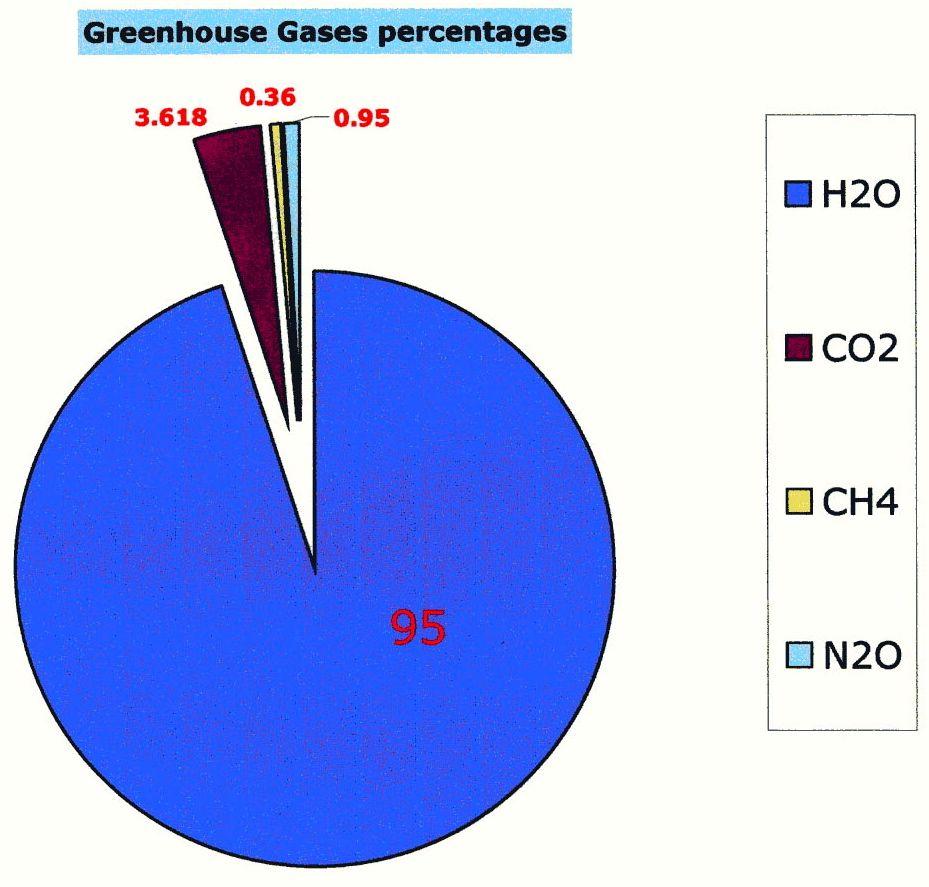
- Water vapour which is 95 percent of the greenhouse gases by volume is by far the most abundant and important greenhouse gas.
- The other natural greenhouse gas of relevance is methane (CH4), but it is only 0.000175 percent of atmospheric gases and 0,036 percent of all greenhouse gases.
- In order to amplify the importance of CO2 they created a measure called “climate sensitivity”. This determines that CO2 is more “effective” as a greenhouse gas than water vapour
- Here is a table from Wikipedia showing estimates of the effectiveness of the various GHGs. Notice the range of estimates, which effectively makes the measures meaningless, unless you have a political agenda. Wikipedia acknowledges “It is not possible to state that a certain gas causes an exact percentage of the greenhouse effect.”

- The result of determining “effectiveness” was the creation of a Global Warming Potential (GWP) chart. It was similar to the chart of Ozone Depleting Substances (ODS) created after the false claim that CFCs were destroying ozone in the upper atmosphere.
- Estimates of the amount of annual human CO2 production added to the atmosphere are produced by the IPCC. They claim it is about 3% of the total added annually.
- In the early IPCC Reports they promoted the idea that the length of time CO2 remains in the atmosphere, known as the Residency Time is at least 100 years. Although the 100 years is not mentioned, the concept is still on or implied on many government web pages. For example, Environment Canada says, “As carbon dioxide stays in the atmosphere for a long time, levels of carbon dioxide continue to build-up in the atmosphere with ongoing human emissions.” Actual Residence Time for CO2 is only 5 to 7 years after which it is cycled back through natural sinks (an area of absorption) such as plants, oceans and soils. (Figure1)
- The ocean is the major control of atmospheric CO2, but its ability varies with water temperature. A cold ocean absorbs more than a warm ocean.
- Humans produce CO2, but they also remove it from the atmosphere. Agriculture and forestry are the major absorbers, removing an estimated 50 percent of total production.
- The Antarctic Ice core record shows temperature increases before CO2. A similar relationship is shown for every single record of any duration and for any time period. Despite this, all computer models are programmed so a CO2 increase causes a temperature increase.
- Carbon dioxide is essential for all life on Earth. Research shows current levels of 392 ppm are approximately one third the optimum for most plants. Empirical evidence from CO2 levels injected into commercial greenhouses indicate optimum yields at levels between 1000 and 1200 ppm. Interestingly this is the average level of the last 300 million years.
The second major data manipulation involved CO2, the target of the entire UNEP and IPCC. How would you “get rid of industrialized nations” as Maurice Strong recommended. The source of their energy and success are fossil fuels. Compare the nation to a car. It’s a good analogy because many demonize the car as the symbol of industrialization, particularly in the US. You can stop the car by shutting off the fuel supply. You can do the same to a nation, but it would bring an immediate negative response. Just look at the reaction when fuel prices soar. You can also stop the car by blocking the exhaust and that had potential for application to a nation. Show that the byproduct of the car, or the nation, is destroying the climate and you have a powerful vehicle to push an agenda to shut down the car or the industry. It is more effective if you get the byproduct labeled a pollutant.
Isolation began with the limiting of the Intergovernmental Panel on Climate Change (IPCC) to only human-caused climate change. The definition of climate change came from the United Nations Environment Program (article 1) of the United Nations Framework Convention on Climate Change (UNFCCC)
“a change of climate which is attributed directly or indirectly to human activity that alters the composition of the global atmosphere and which is in addition to natural climate variability observed over considerable time periods.”
In another of their deceptive changes, they abandoned the original definition of climate change written by the United Nations Framework Convention on Climate Change (UNFCCC) and used in the first three Reports and replaced it in the 2007 Report. Here it is as a footnote in the Summary for Policymakers (SPM). “Climate change in IPCC usage refers to any change in climate over time, whether due to natural variability or as a result of human activity. This usage differs from that in the United Nations Framework Convention on Climate Change, where climate change refers to a change of climate that is attributed directly or indirectly to human activity that alters the composition of the global atmosphere and that is in addition to natural climate variability observed over comparable time periods.” The problem is they did not alter the Fourth Report because Reports are cumulative and so the basis for including natural variability did not exist.
Tables showing factors they considered are evidence that they didn’t change.
Here is the Table for the 2001 Report.
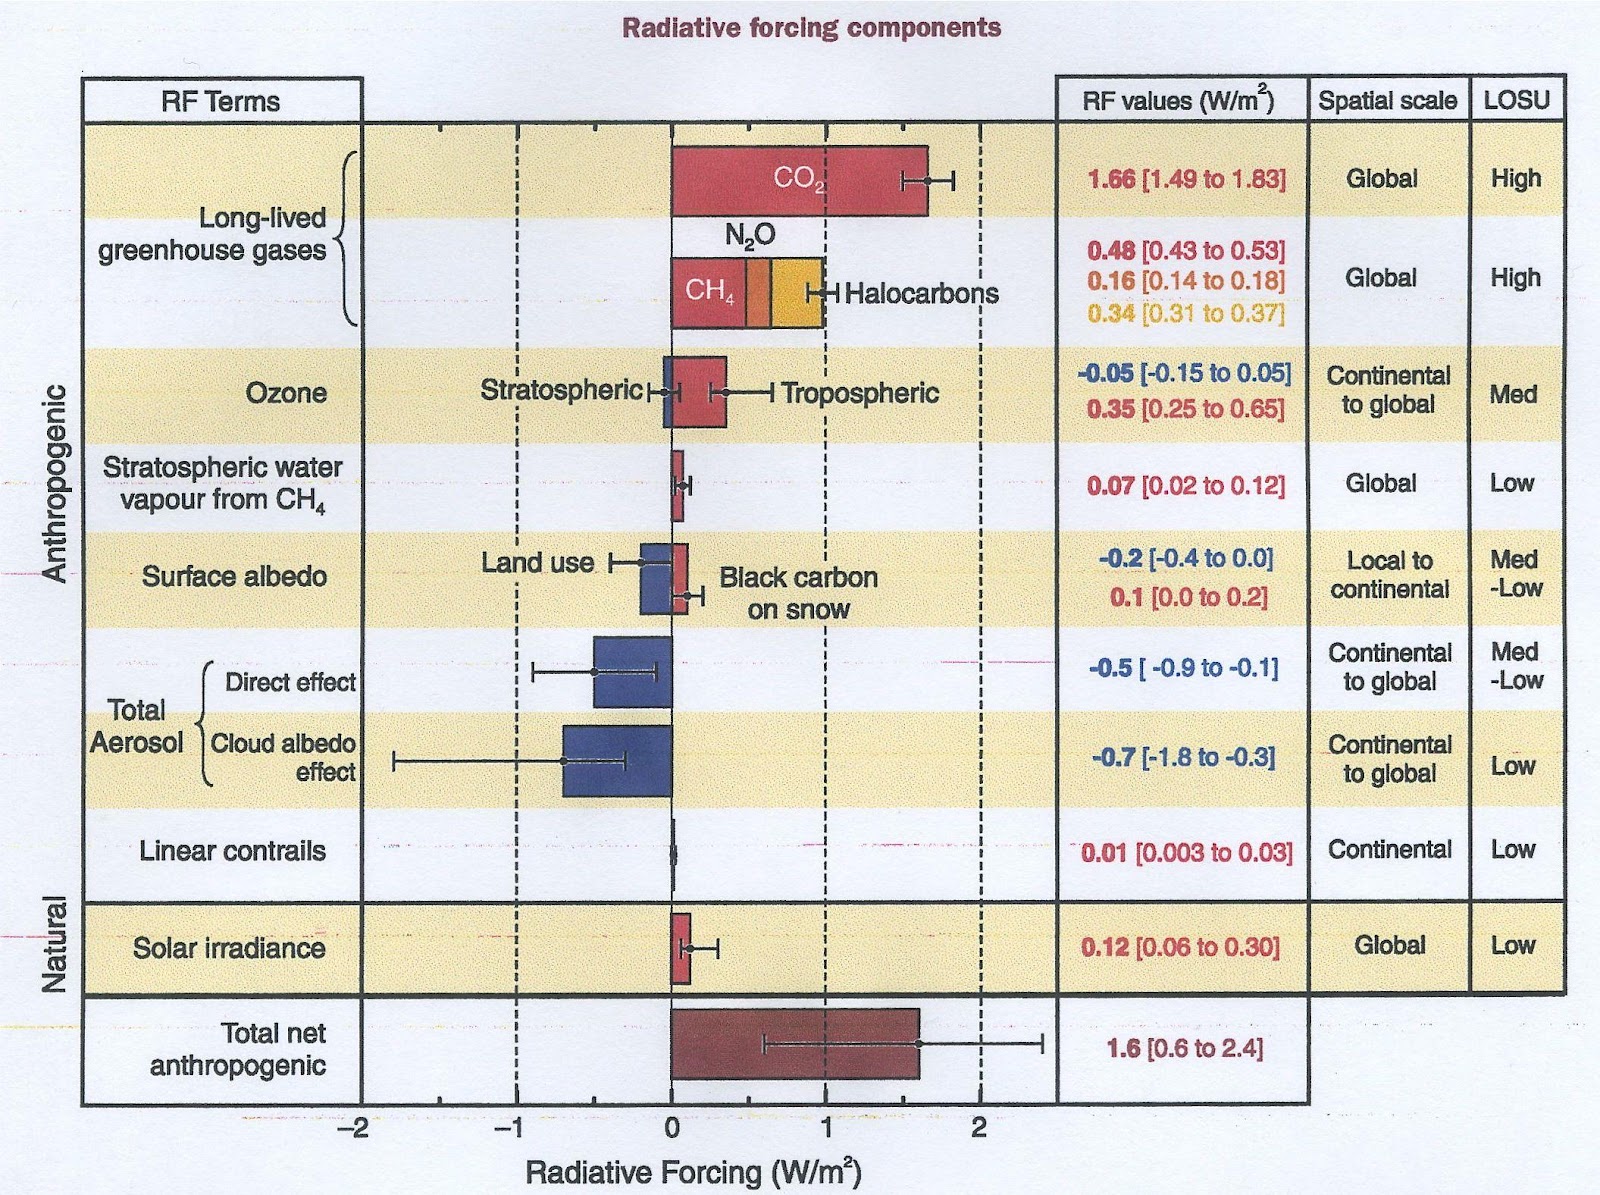
Things to note;
- Water Vapor, the most important greenhouse gas, is not listed.
- Only solar irradiance is included – this is not the only way the Sun affects climate. If you list only human causes then how do we affect solar irradiance?
- The right-hand column is the Level of Scientific Understanding (LOSU).
- Claims of “high” understanding are scientifically unjustified.
- Nine items are listed – only two are high, but four are Low and two Med-Low.
- The total change caused by humans is averaged at 1.6 W/m2 (range 0.6 to 2.4)
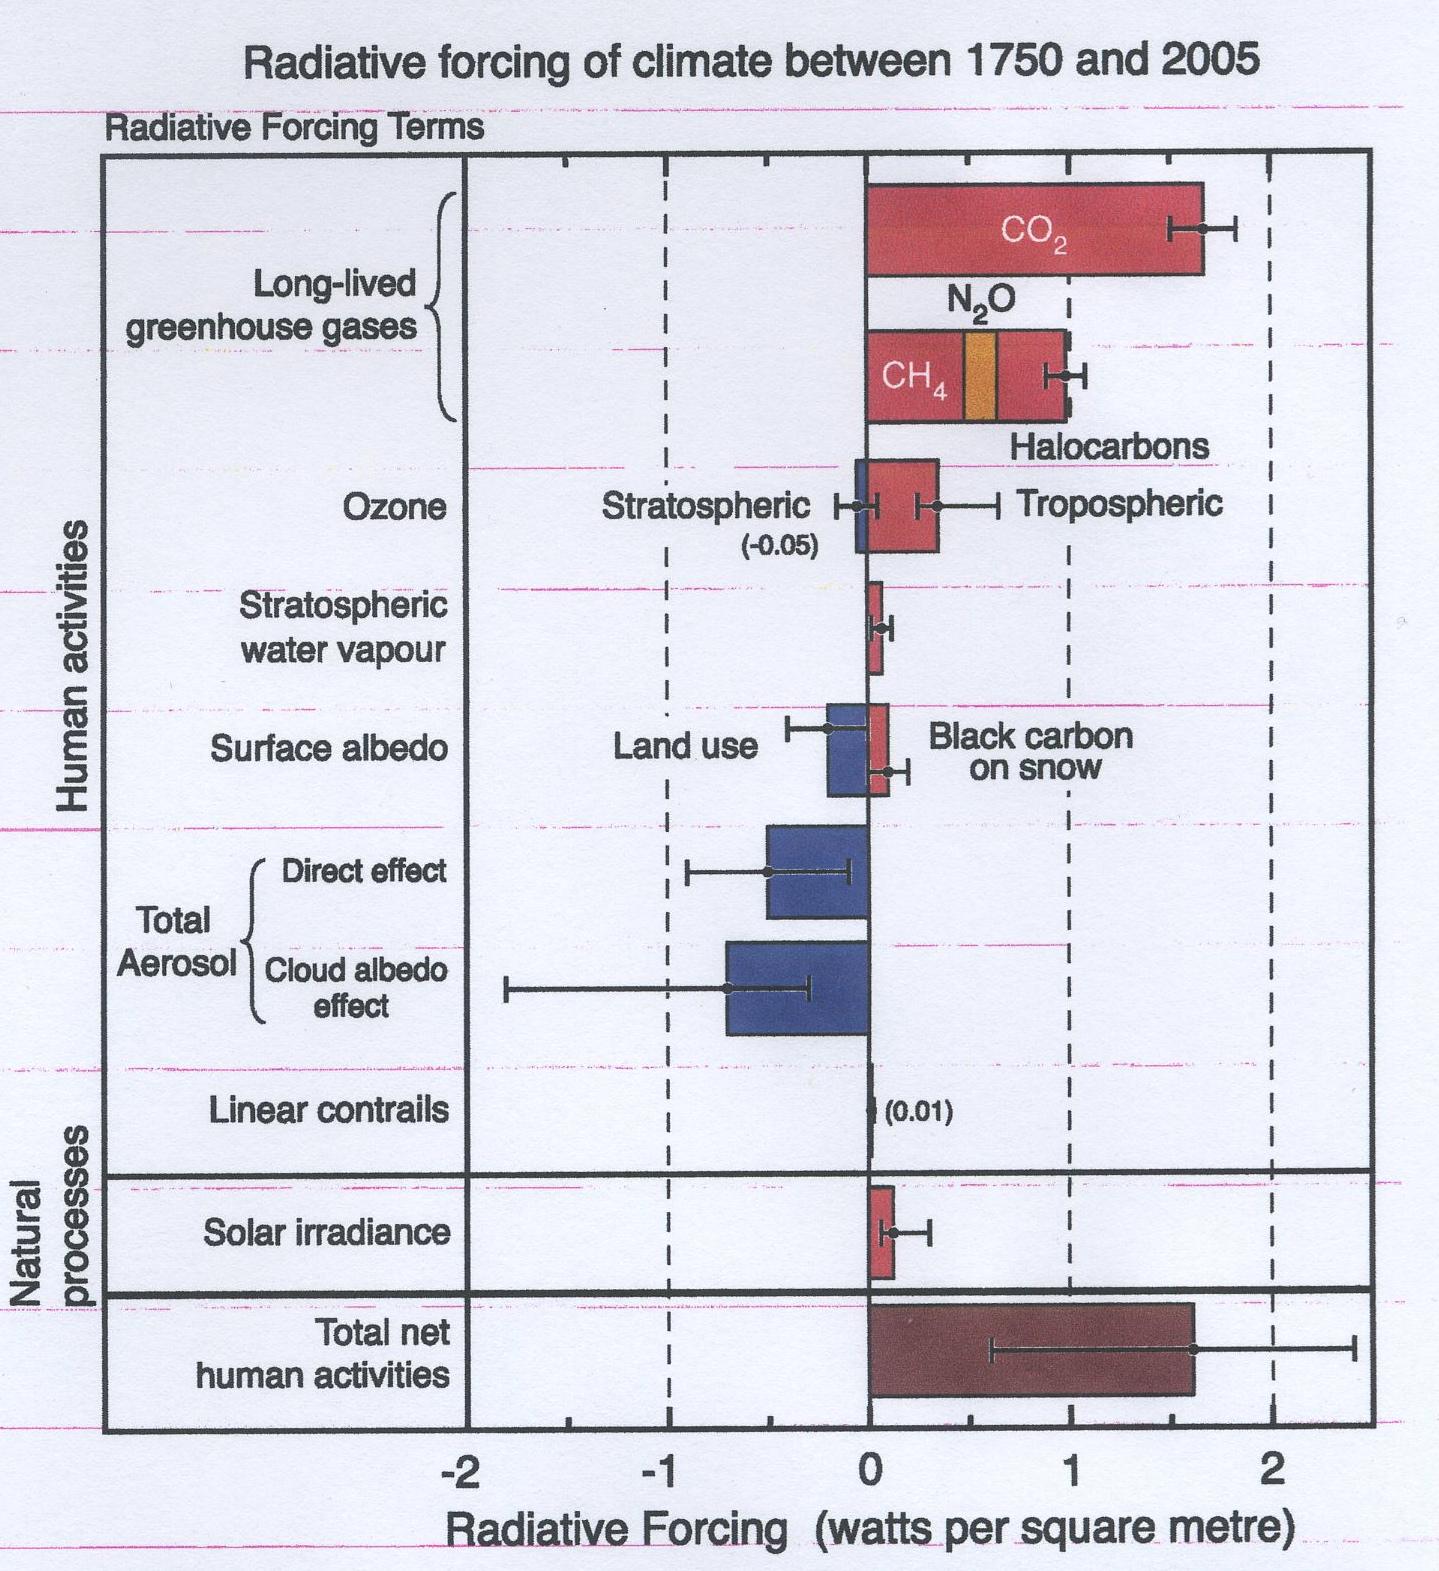
They added no new variables to the 2007 Report, despite the supposed new definition. As with everything the IPCC does it is what is missing or changed that tells the story.
- The LOSU column is gone.
- The column listing the range of estimates of RF (Radiative Forcing) is gone.
- Water Vapor is still missing.
- Numbers for the range of human forcing are missing, but eyeball readings indicate they are unchanged.
- The total net human effect appears to remain at 1.6 W/m2.
- This indicates the claimed increase of human CO2 was not included.
The problem remains that since you don’t know how much CO2 there is or how much it changes naturally, you cannot determine what portion is due to human activities. Every figure used is a very crude estimate at best.
By design all CO2 numbers used by the IPCC underline the human impact. They are meaningless figures from the total volumes to the annual flows and the human inputs as depicted in the IPCC carbon cycle diagram. In 2010 Dr Dietrich Koelle provided a table of the estimated emissions and uptakes of CO2 from natural sources and the human emissions.
EMISSIONS:
Humans and Animals 45 to 52
Oceans’ outgassing (tropical areas) 90 to 100
Volcanic and other ground sources 0.5 to 2
Ground bacteria, rotting and decay 50 to 60*
Forest cutting, forest fires 1 to 3
Anthropogenic emissions (2010) 9.5
TOTAL 196 to 226.5
* other published values: 26 Gt, resp. 86-110 Gt
UPTAKE:
Vegetation on land 55 to 62
Oceans’ uptake 87 to 95*
Algae, phytoplankton, seaweed 48 to 57
Weathering (Silica minerals) 3 to 6
TOTAL 193 to 220
* other published values: 68-110, 30-50 Gt
The difference is + 1.5 to 3 Gt C p.a. which is in agreement with the annual increase (depending on the ENSO activity).
Notice that the range of error of estimates for emissions of Oceans and Ground Bacteria exceeds the total for humans.

Human CO2 production is central to the IPCC objective, so they control production of the information. Like most things they do it is disclosed, but they know few people realize the significance. Here, they explain the process.
—————————————————————–
What is the role of the IPCC in Greenhouse Gas inventories and reporting to the UNFCCC?
A: The IPCC has generated a number of methodology reports on national greenhouse gas inventories with a view to providing internationally acceptable inventory methodologies. The IPCC accepts the responsibility to provide scientific and technical advice on specific questions related to those inventory methods and practices that are contained in these reports, or at the request of the UNFCCC in accordance with established IPCC procedures. The IPCC has set up the Task Force on Inventories (TFI) to run the National Greenhouse Gas Inventory Programme (NGGIP) to produce this methodological advice. Parties to the UNFCCC have agreed to use the IPCC Guidelines in reporting to the convention.
How does the IPCC produce its inventory Guidelines?Utilising IPCC procedures, nominated experts from around the world draft the reports that are then extensively reviewed twice before approval by the IPCC. This process ensures that the widest possible range of views are incorporated into the documents.
——————————————————————
In other words they control the entire process from the methodology, designation of technical advice, establishment of task forces, guidelines for reporting, nomination of experts to produce the reports, and final approval of what the reports say. They rely on data from individual UN member nations, but any examination of UN data quickly reveals its inadequacies. For example, look at the countries that claim 99% or higher literacy rate.
IPCC figures for annual CO2 production per nation are equally distorted and wrong. Worse, they have no scientific purpose, they are strictly for the political agenda. Professor Murray Salby shows in this video how the human portion is of no consequence. He demonstrates that variation in natural (non-human) sources of CO2 explains almost all annual changes. He shows how just a 5% variation in these sources is more than the total annual human production.
A partial explanation for the IPCC error is because climate science assumes change and variability are abnormal as the diagram illustrates. They don’t show the error in the estimates of volumes, which in at least three instances, atmosphere, oceans, and vegetation/soil detritus exceed estimates for total human production. This is true even with IPCC’s claimed annual increase.
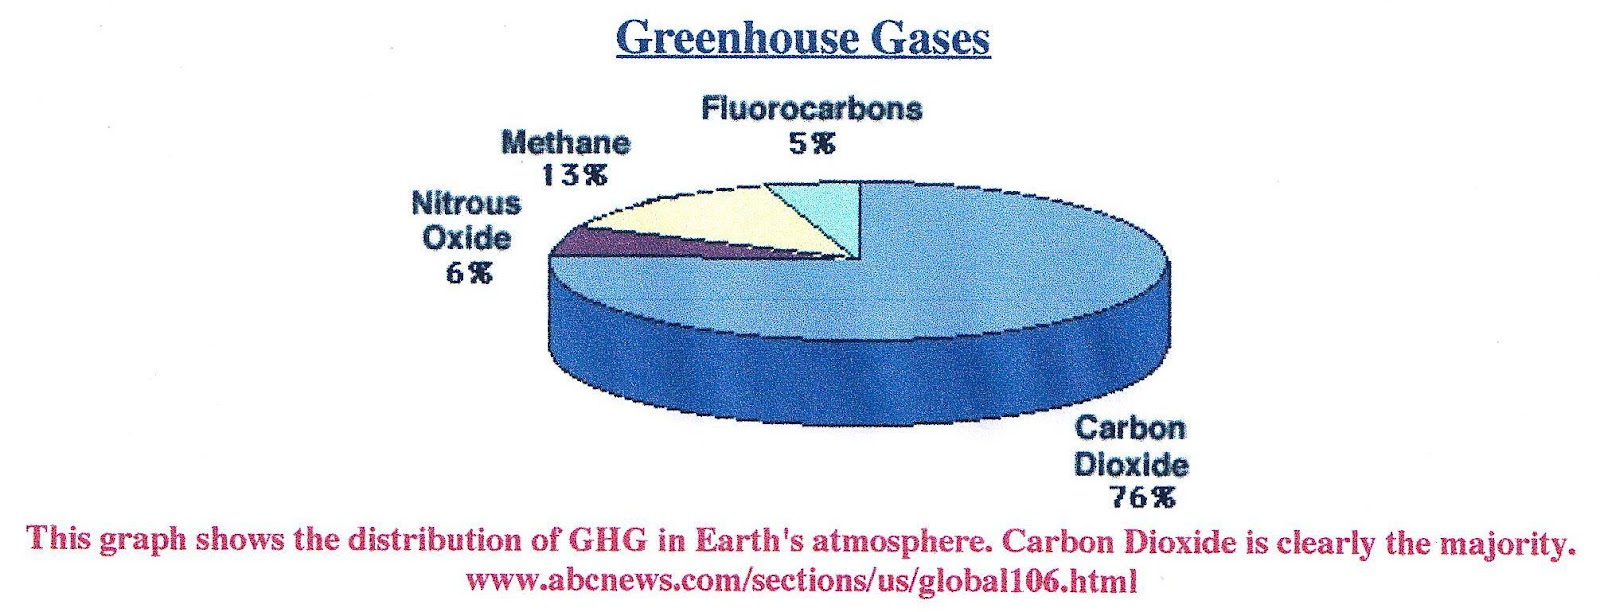
Figure – shows the percentages of greenhouse gases in the atmosphere.
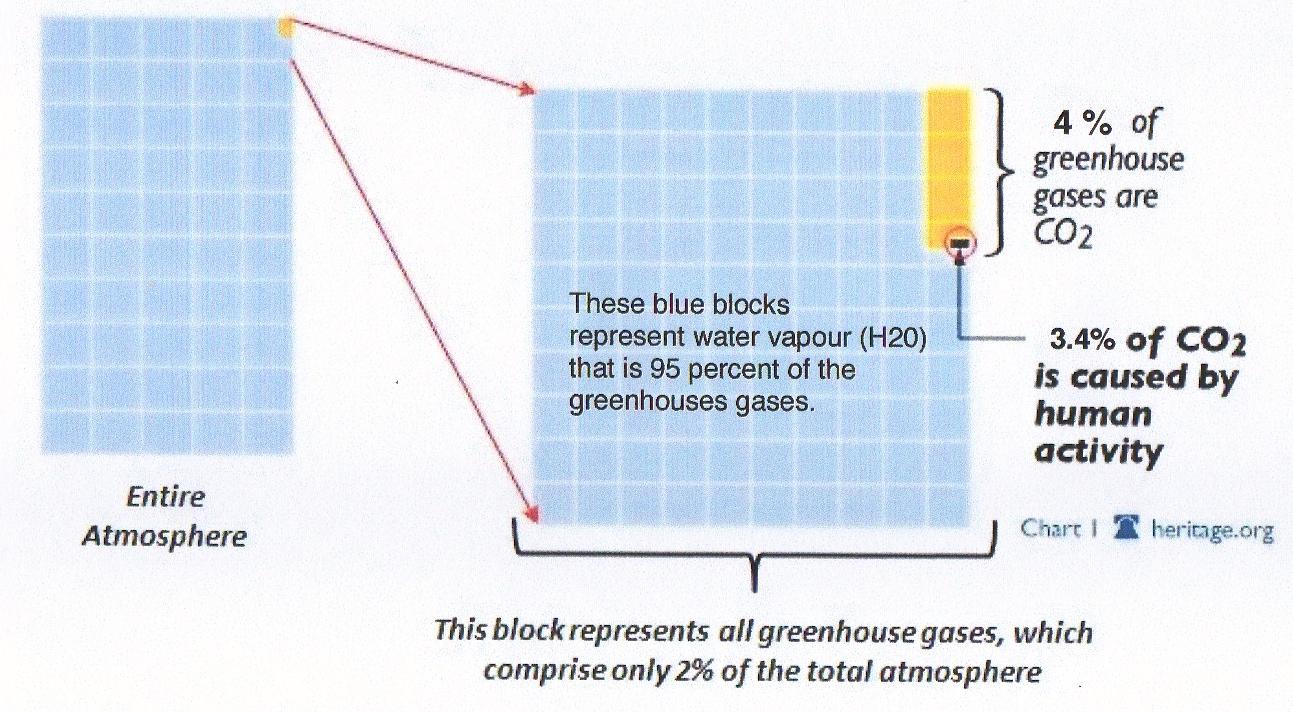
Another diagram shows the greenhouse gas percentages in a different form.
Compare that diagram with this one from the ABC News network web site. It illustrates the distortions created by the deception so the IPCC. Water vapor, the most important greenhouse gas by far, is not even shown. It is evidence of the success in placing all the attention on CO2..
There are several misconceptions about CO2, created to prove the hypothesis and raise the level of threat in various ways. For example, an early IPCC claim said atmospheric residency time of CO2 was at least 100 years. Done, ostensibly, for the political point that even if we stopped CO2 production immediately the damage done lasts for a long time. We now know the actual time residency is approximately 5 to 6 years.
The major assumption of the hypothesis says a CO2 increase causes a temperature increase. After publication in 1999 of Petit et al., Antarctic ice core records appeared as evidence in the 2001 Report.
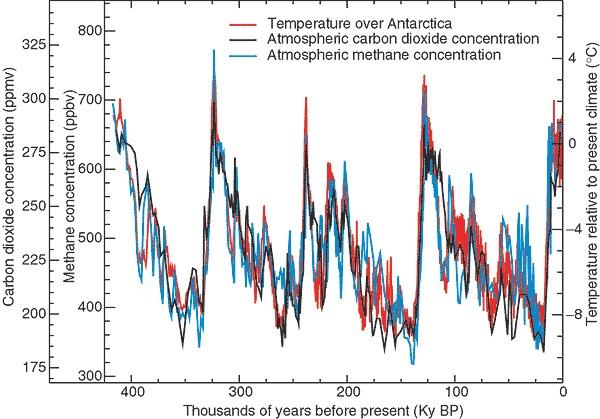
Figure : Antarctic core core record.
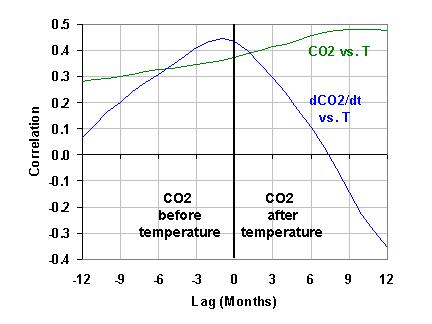
Just four years later proof that the major assumption of the hypothesis was wrong appeared. A more detailed look showed that the temperature increased before CO2 in complete contradiction to the hypothesis. Somehow it was shuffled aside, probably because of the diversionary claim that the lag was between 80 and 800 years. It doesn’t matter because it still contradicts the basic assumption. More compelling is the fact that temperature changes before CO2 change in every record for any period or duration. Most curious, the contradiction is ignored by proponents and too many skeptics. Figure 2 shows a shorter record of the relationship.

Figure 2; Lag time for short record, 1958 to 2009.
It is logical to assume that if CO2 change follows temperature change in every record then CO2 cannot be a greenhouse gas. Despite this, the assumption that a CO2 increase causes a temperature increase is in all global climate computer models including those of the IPCC.
The IPCC faced another serious challenge created by the need to prove their hypothesis, rather than disprove it as normal science requires. It paralleled the need to eliminate the Medieval Warm Period because it showed the world was warmer than today before the Industrial Revolution. It was necessary to show or claim that the pre-industrial level of CO2 was lower than today. This campaign was underway before the ice cores information was released.
Most people think ice cores are the only source of pre-industrial CO2 levels. What most people don’t know is that thousands of direct measures of atmospheric CO2 began in the Nineteenth Century. Joseph Black had studied the properties of CO2 in the 1750s and Joseph Priestly published on oxygen in 1775. Attempts to measure the various volumes of atmospheric gases, with global measures of CO2 followed these events beginning in 1812. Scientists took precise measurements with calibrated instruments as Ernst Beck thoroughly documented.
In a paper submitted to the Hearing before the US Senate Committee on Commerce, Science, and Transportation Professor Zbigniew Jaworowski states
“The basis of most of the IPCC conclusions on anthropogenic causes and on projections of climatic change is the assumption of low level of CO2 in the pre-industrial atmosphere. This assumption, based on glaciological studies, is false.”
Of equal importance Jaworowski states,
The notion of low pre-industrial CO2 atmospheric level, based on such poor knowledge, became a widely accepted Holy Grail of climate warming models. The modelers ignored the evidence from direct measurements of CO2 in atmospheric air indicating that in 19th century its average concentration was 335 ppmv[11] (Figure 2). In Figure 2 encircled values show a biased selection of data used to demonstrate that in 19th century atmosphere the CO2 level was 292 ppmv[12]. A study of stomatal frequency in fossil leaves from Holocene lake deposits in Denmark, showing that 9400 years ago CO2 atmospheric level was 333 ppmv, and 9600 years ago 348 ppmv, falsify the concept of stabilized and low CO2 air concentration until the advent of industrial revolution [13].
Jaworowski’s claim the modelers ignored the 19th century readings isn’t correct. They knew about it because T.R.Wigley introduced information about the 19th century readings to the climate science community. (Wigley, T.M.L., 1983 “The pre-industrial carbon dioxide level.” Climatic Change 5, 315-320). It did what many others have done in taking a wide range of readings, eliminating only high readings and claiming the pre-industrial level was approximately 270 ppm. I suggest this is what influenced the modelers because Wigley was working with them through the Climatic Research Unit (CRU) at East Anglia. He was the key person directing the machinations as revealed by the leaked emails from the Climatic Research Unit (CRU).
Wigley was not the first to misuse the 19th century data, but he did reintroduce it to the climate community. Guy Stewart Callendar, a British Steam engineer, pushed the thesis that increasing CO2 was causing warming. He did what Wigley did by selecting only those readings that supported the hypothesis.
Full story here
Good article, according to me, the downscaling of upper air observations and the different types of automatic weather stations and software worldwide to measure surface temperature there will always be different views and data manipulation.
The climate sensitivity uncertainty issue
https://tambonthongchai.com/2019/05/02/a-history-of-climate-sensitivity/
The good news is, When Maurice Strong and Hansen, followed by Mann and Gore chose CO2 as their go to villain they picked on the wrong candidate. They needed to force the focus on fossil fuels in order to take down capitalism. They concluded, rightly, that energy is the life blood of capitalism. That self evident situation, forced them to, come up with an energy negative with a bit of science fact attached to it, that would start the whole Man Made Global Warming/ Climate Change scam off.
They chose CO2, we must thank them for their lunacy.
They are on a mission and the Media have bought into the faux science because it makes a good story.
By the way, some will have noticed the headline name for the AGW/ CC is now morphing into the next catchy name for their endless effort to spook the rational thinking public.
The latest title to this being scam, pushed by the anti capitalists is “Climate Crisis”.
This is such a convenient name change as it allows the IPCC to hold onto its letter headed paper and advance as the “Intergovernmental Panel on Climate Crisis”.
We must thank them for their first step into economic thinking.
Tim’s big mistake, according to remarks he made not long ago, is that he never reads comments on his offerings! This gives his stuff a bit of a professorial ‘talking down’ and antique quality because lack of engagement with the many of the best minds in the business prevents polishing of his considerable knowledge. Even typos “…CO2 not a GHG” should be not a significant GHG (I know Tim knows it is a GHG). It will never be corrected and his readers therefore discount the value of his articles.
It is also arrogant and dismissive. I think WUWT should take this up with Tim for future posts. His posts are one dimensional – no one can illicit a response to a question or obtain clarifications. He also is impervious, therefore, to enhancing his own knowledge.
Knowing his material is, because of this, a whingeing dump of a rant, I read the intro and skim half the rest tather than ignore it because he is one of the most experienced practical climatologists, knows the history and has dealt with many key players.
” A more detailed look showed that the temperature increased before CO2 in complete contradiction to the hypothesis. Somehow it was shuffled aside, probably because of the diversionary claim that the lag was between 80 and 800 years. It doesn’t matter because it still contradicts the basic assumption. More compelling is the fact that temperature changes before CO2 change in every record for any period or duration. Most curious, the contradiction is ignored by proponents and too many skeptics. Figure 2 shows a shorter record of the relationship.”
It does not contradict the basic assumption at all.
CO2 is a GHG.
It absorbs and re-radiates terrestrial LWIR. (via by collision or direct re-radiation).
In order to increase that function within the Earth’s atmosphere it has to increase in concentration.
That cannot happen until the natural CC produces more OR an artificial source does it.
The CC does so by global temperature changes induced by the Earth’s orbital eccentricities (Milankovitch) – the warm part of that (for the NH where the TSI at 65 deg N can vary by over 100 W/m^2) melting land-borne ice/snowfield and slowly rising temps/SSTs.
These warmer seas are less able to absorb atmos CO2 and eventually those levels rise.
This sustaining a GHE enough to begin a feedback mechanism whereby warmer conditions cause more CO2, cause more WV, cause higher temps.
STARTING from a natural cycle in the Earth’s orbit.
Then we can have the CO2 added artificially to start that process.
It’s just a matter of where the feedback cycle is entered.
How about Mankind perhaps?
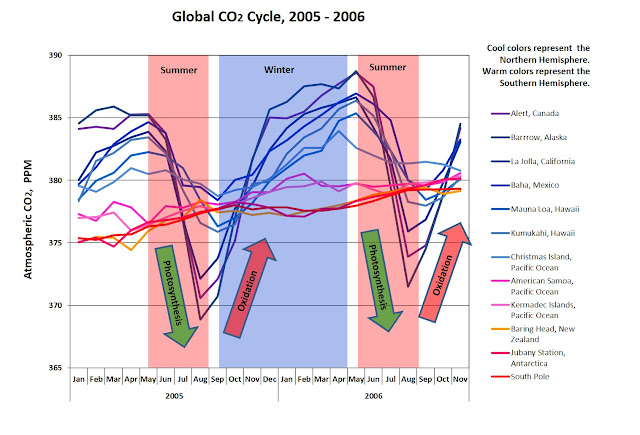
Additionally Fig2 is for the rate of change of annual CO2 vs Global temp.
The greatest rate of change in CO2 levels will lag the highest (NH) temps for the above reasons in the annual cycle also.
Spring (increasing temps) in the NH causes vegetation to respirate CO2 into O2 (CO2 levels fall) – the greatest increase coming as late summer is reached (you will find a similar but reversed response in annual O2 rate of change).
NH Autumn – falling leaves. Reduced CO2 respiration and increased atmos concentration lagging temp fall.
It is dominated by the natural CC. Which FOLLOWS NH temperature chnges (SH dominated by ocean).
Mankinds 1 or 2 ppm additional per year is superimposed on top
Just as the GMST has NV about a rising contribution by anthro CO2.
https://encrypted-tbn0.gstatic.com/images?q=tbn:ANd9GcRA4f-QlZTB9ticutCzwjouL7IVz4MjraxLlZD5AzfTilIT2499
Also:
Refer to this comment ….
https://wattsupwiththat.com/2019/05/01/a-story-of-co2-data-manipulation/#comment-2693596
For Mr Ball’s incorrect assumptions about CO2 residence time.
I’ve seen the idiotic assertion in the comment thread that water vapor in the atmosphere is a feedback, only possible if CO2 or other GHG is present to create “warmth” to vaporize some of the water in the first place. This is total horse pucky. Think of the experiment run by this planet for billions of years. There has almost certainly been a water cycle, with liquid oceans and water vapor in the Earth’s atmosphere for almost all of our history, since the oceans formed. And what about volcanoes? They pump huge amounts of water into the sky. The only periods during which there may have been no liquid water to evaporate are due to massive collisions that vaporized MOST of the water (and huge chunks of the crust and some mantle, too), as when the moon was formed. And other collisions happened, perhaps creating geological hot spots, such as the Yellowstone and Hawaiian hot spots. Collisions continue to this day. We ignore them, but if a frozen Earth existed, and there was ice everwhere, every collision would release water vapor. Above ground volcanoes emit water vapor into the air, too. And submarine volcanoes heat frozen water from below. What about sublimation, in which wind ablates water molecules right off the frozen ice, probably how Antarctica loses most of the ice it loses after glacial calving. In a snowball Earth situation, a dicey proposition at best, there would still be pressure gradients and winds, and tropical ice would still be under direct onslaught wind, ablation, sublimation from all spectra of light, due to no clouds. Wouldn’t that work to melt surface ice, even on frozen oceans? Of course it would. And once you have a little tropical surface water, you have evaporation, and now you have all the water vapor you need to start the water cycle. The ridiculous hypothesis that CO2 is necessary in the atmosphere before any liquid water could exist on the planet is STUPID!
The water cycle does NOT depend on CO2 to occur, it is only marginally boosted by CO2. That’s why water vapor is the dominant GHG. And water vapor is not JUST a GHG as CO2 is. Water vapor also carries potential energy, in the work done to evaporate it, to lift it (along with all atmospheric gasses) in the convection process, energy which it then dumps high in the high atmosphere when it condenses. Freezing and thawing work the same way, giving energy more ways to move in the atmosphere and oceans, without requiring any radiation processes.
Show me the science that proves that without CO2, there would be no liquid surface water on this planet. You can’t. Show me an experimental design that you would perform that could demonstrate that a totally frozen Earth would not soon have water vapor in it’s atmosphere. And what’s most important, it is a fact that the Earth is a 4 billion year old history of mostly liquid oceans. So, go ahead, those of you who make this ridiculous argument. Impress me by putting some meat into your sophistry.
The definition of climate change and subsequent manipulation was done to suit a political objective
and I wonder who exactly wrote and approved the definition change ?
It appears they hijacked a term to fool the public and to date have gotten away with it .
Now we have the newest campaign slogan ” climate crisis ” , soon to be followed by the super duper
climate crisis as desperation sets in on this overblown fraud .
Given the number of scientists studying the issues it is surprising tens of thousands of them just stood by while a clique of faceless and biased promoters undermine the credibility of science .
There are so many errors and misunderstandings in Tim Ball’s article it would take far too long to address them all. I’ll just pick out three to illustrate his errors.
1. Tim Ball states, “Here is a table from Wikipedia showing estimates of the effectiveness of the various GHGs. Notice the range of estimates, which effectively makes the measures meaningless, unless you have a political agenda.”
There is no “range” of estimates. The two figures for each gas refers to different scenarios. For example, the 9 – 26% figures given for the contribution of CO2 to the total greenhouse effect, do not mean that the figure is somewhere between 9 and 26%: it is not a range. What those figures mean is as follows:
i) if all the CO2 in the atmosphere was suddenly removed (and all other things, including the other greenhouse gases, remained equal) then the total greenhouse effect would fall by 9% of its previous level,
ii) if all the other greenhouse gases, except CO2, in the atmosphere were suddenly removed (and all other things, including CO2, remained equal) then the total greenhouse effect would fall to 26% of its previous level.
2. Tim Ball has completely misunderstood the meaning of “residency time” in his statement “Actual Residence Time for CO2 is only 5 to 7 years”. That statement is true, but it is completely irrelevant when asking the important question “How long will human additions of CO2 to the atmosphere remain in the atmosphere?”, as even a moments thought shows to be the case. After all, if human additions of CO2 were removed in 5-7 years, then all of the additional c.110ppmv of CO2 added to the atmosphere by humans up to c. 7 years ago should have been removed by now: it hasn’t been.
The problem is that “residence time” does not mean what Tim Ball thinks it means: “residence time” means the average time before a particular molecule of CO2 is removed from the atmosphere. As that molecule is (nearly always) replaced by another molecule (as is the way with equilibria), the figure of 5-7 years provide no information whatsoever about how long human CO2 will remain in the atmosphere.
3. Tim Ball then goes on about the fact that “the temperature increased before CO2 [during glacial to interglacial transitions during the recent Ice Age,] in complete contradiction to the hypothesis”.
There is no contradiction whatsoever.
Of course temperatures increased before CO2 – that is what would be expected:
In the absence of human intervention, or a big change in volcanic activity, or some other external perturbation, the CO2 in the atmosphere is in approximate equilibrium with that in the oceans and biosphere. When warming occurred during glacial to interglacial transitions, due initially to orbital factors (Milankovitch), some CO2 was expelled from the oceans and biosphere into the atmosphere. (CO2 is less soluble in warmer waters; rotting, which produces CO2, occurs more rapidly in warmer conditions, and ocean currents changed).
That fact about increase of CO2, by itself, provides no information whatsoever concerning CO2’s properties as a greenhouse gas. Tim Ball’s claim that this fact provided “proof” that the increased CO2 did not also contribute to the subsequent warming (as a positive feedback) or that it provides a “complete contradiction” of that contribution, is just nonsense.
If Tim Ball had wished to demonstrate his substantial lack of understanding of climate science, the above article stands as a worthy demonstration of that lamentable situation.
In addition, it does not help the skeptics’ cause when Tim declares “CO2 is not a greenhouse gas”. This is so contrary to a wealth of observations (upward- and downward-looking spectrometers observing the atmosphere; thousands of spectroscopic measurements of IR absorption by CO2 in laboratories) that it really does verge on “denialism”.
https://www.technocracy.news/tim-ball-the-evidence-proves-that-co2-is-not-a-greenhouse-gas/
“Humans produce CO2, but they also remove it from the atmosphere. Agriculture and forestry are the major absorbers, removing an estimated 50 percent of total production.”
Total production by humans or total production of all CO2 produced human or otherwise?