By Dr. Tim Ball, from his website.
The consistent pattern of the IPCC reveals demonization and misrepresentations of CO2. Here are some basic facts about CO2 that illustrate the discrepancy between what the IPCC claim and what science knows.
- Natural levels of Carbon dioxide (CO2) are less than 0.04% of the total atmosphere; it is far from being the most important or even only greenhouse gas as most of the public understands.
- Water vapour which is 95 percent of the greenhouse gases by volume is by far the most abundant and important greenhouse gas.
- The other natural greenhouse gas of relevance is methane (CH4), but it is only 0.000175 percent of atmospheric gases and 0,036 percent of all greenhouse gases.
- In order to amplify the importance of CO2 they created a measure called “climate sensitivity”. This determines that CO2 is more “effective” as a greenhouse gas than water vapour
- Here is a table from Wikipedia showing estimates of the effectiveness of the various GHGs. Notice the range of estimates, which effectively makes the measures meaningless, unless you have a political agenda. Wikipedia acknowledges “It is not possible to state that a certain gas causes an exact percentage of the greenhouse effect.”

- The result of determining “effectiveness” was the creation of a Global Warming Potential (GWP) chart. It was similar to the chart of Ozone Depleting Substances (ODS) created after the false claim that CFCs were destroying ozone in the upper atmosphere.
- Estimates of the amount of annual human CO2 production added to the atmosphere are produced by the IPCC. They claim it is about 3% of the total added annually.
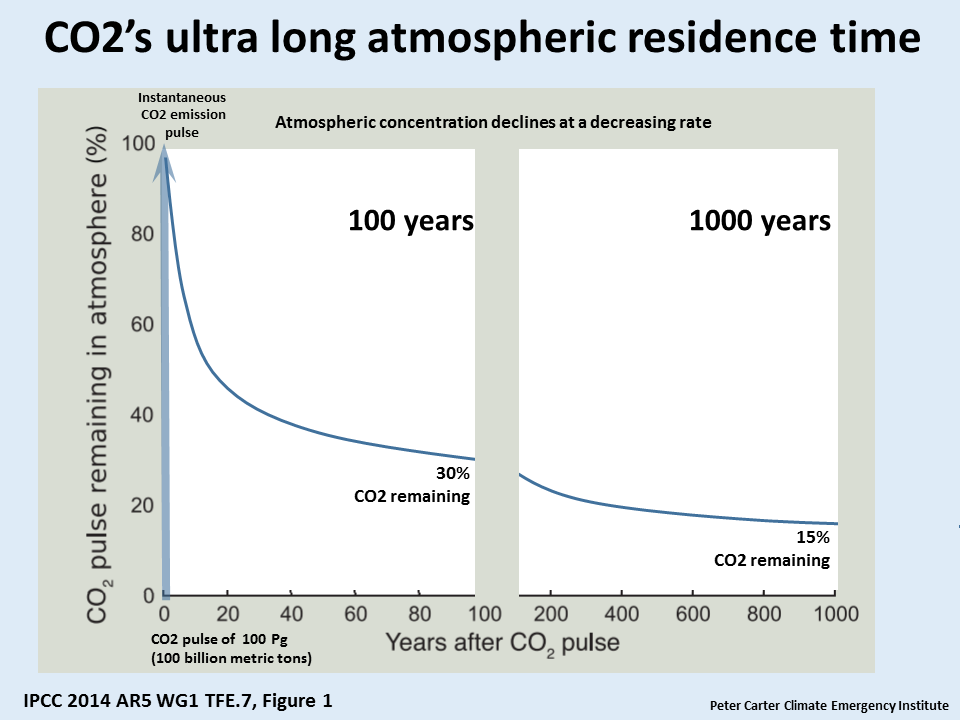
- In the early IPCC Reports they promoted the idea that the length of time CO2 remains in the atmosphere, known as the Residency Time is at least 100 years. Although the 100 years is not mentioned, the concept is still on or implied on many government web pages. For example, Environment Canada says, “As carbon dioxide stays in the atmosphere for a long time, levels of carbon dioxide continue to build-up in the atmosphere with ongoing human emissions.” Actual Residence Time for CO2 is only 5 to 7 years after which it is cycled back through natural sinks (an area of absorption) such as plants, oceans and soils. (Figure1)
- The ocean is the major control of atmospheric CO2, but its ability varies with water temperature. A cold ocean absorbs more than a warm ocean.
- Humans produce CO2, but they also remove it from the atmosphere. Agriculture and forestry are the major absorbers, removing an estimated 50 percent of total production.
- The Antarctic Ice core record shows temperature increases before CO2. A similar relationship is shown for every single record of any duration and for any time period. Despite this, all computer models are programmed so a CO2 increase causes a temperature increase.
- Carbon dioxide is essential for all life on Earth. Research shows current levels of 392 ppm are approximately one third the optimum for most plants. Empirical evidence from CO2 levels injected into commercial greenhouses indicate optimum yields at levels between 1000 and 1200 ppm. Interestingly this is the average level of the last 300 million years.
The second major data manipulation involved CO2, the target of the entire UNEP and IPCC. How would you “get rid of industrialized nations” as Maurice Strong recommended. The source of their energy and success are fossil fuels. Compare the nation to a car. It’s a good analogy because many demonize the car as the symbol of industrialization, particularly in the US. You can stop the car by shutting off the fuel supply. You can do the same to a nation, but it would bring an immediate negative response. Just look at the reaction when fuel prices soar. You can also stop the car by blocking the exhaust and that had potential for application to a nation. Show that the byproduct of the car, or the nation, is destroying the climate and you have a powerful vehicle to push an agenda to shut down the car or the industry. It is more effective if you get the byproduct labeled a pollutant.
Isolation began with the limiting of the Intergovernmental Panel on Climate Change (IPCC) to only human-caused climate change. The definition of climate change came from the United Nations Environment Program (article 1) of the United Nations Framework Convention on Climate Change (UNFCCC)
“a change of climate which is attributed directly or indirectly to human activity that alters the composition of the global atmosphere and which is in addition to natural climate variability observed over considerable time periods.”
In another of their deceptive changes, they abandoned the original definition of climate change written by the United Nations Framework Convention on Climate Change (UNFCCC) and used in the first three Reports and replaced it in the 2007 Report. Here it is as a footnote in the Summary for Policymakers (SPM). “Climate change in IPCC usage refers to any change in climate over time, whether due to natural variability or as a result of human activity. This usage differs from that in the United Nations Framework Convention on Climate Change, where climate change refers to a change of climate that is attributed directly or indirectly to human activity that alters the composition of the global atmosphere and that is in addition to natural climate variability observed over comparable time periods.” The problem is they did not alter the Fourth Report because Reports are cumulative and so the basis for including natural variability did not exist.
Tables showing factors they considered are evidence that they didn’t change.
Here is the Table for the 2001 Report.
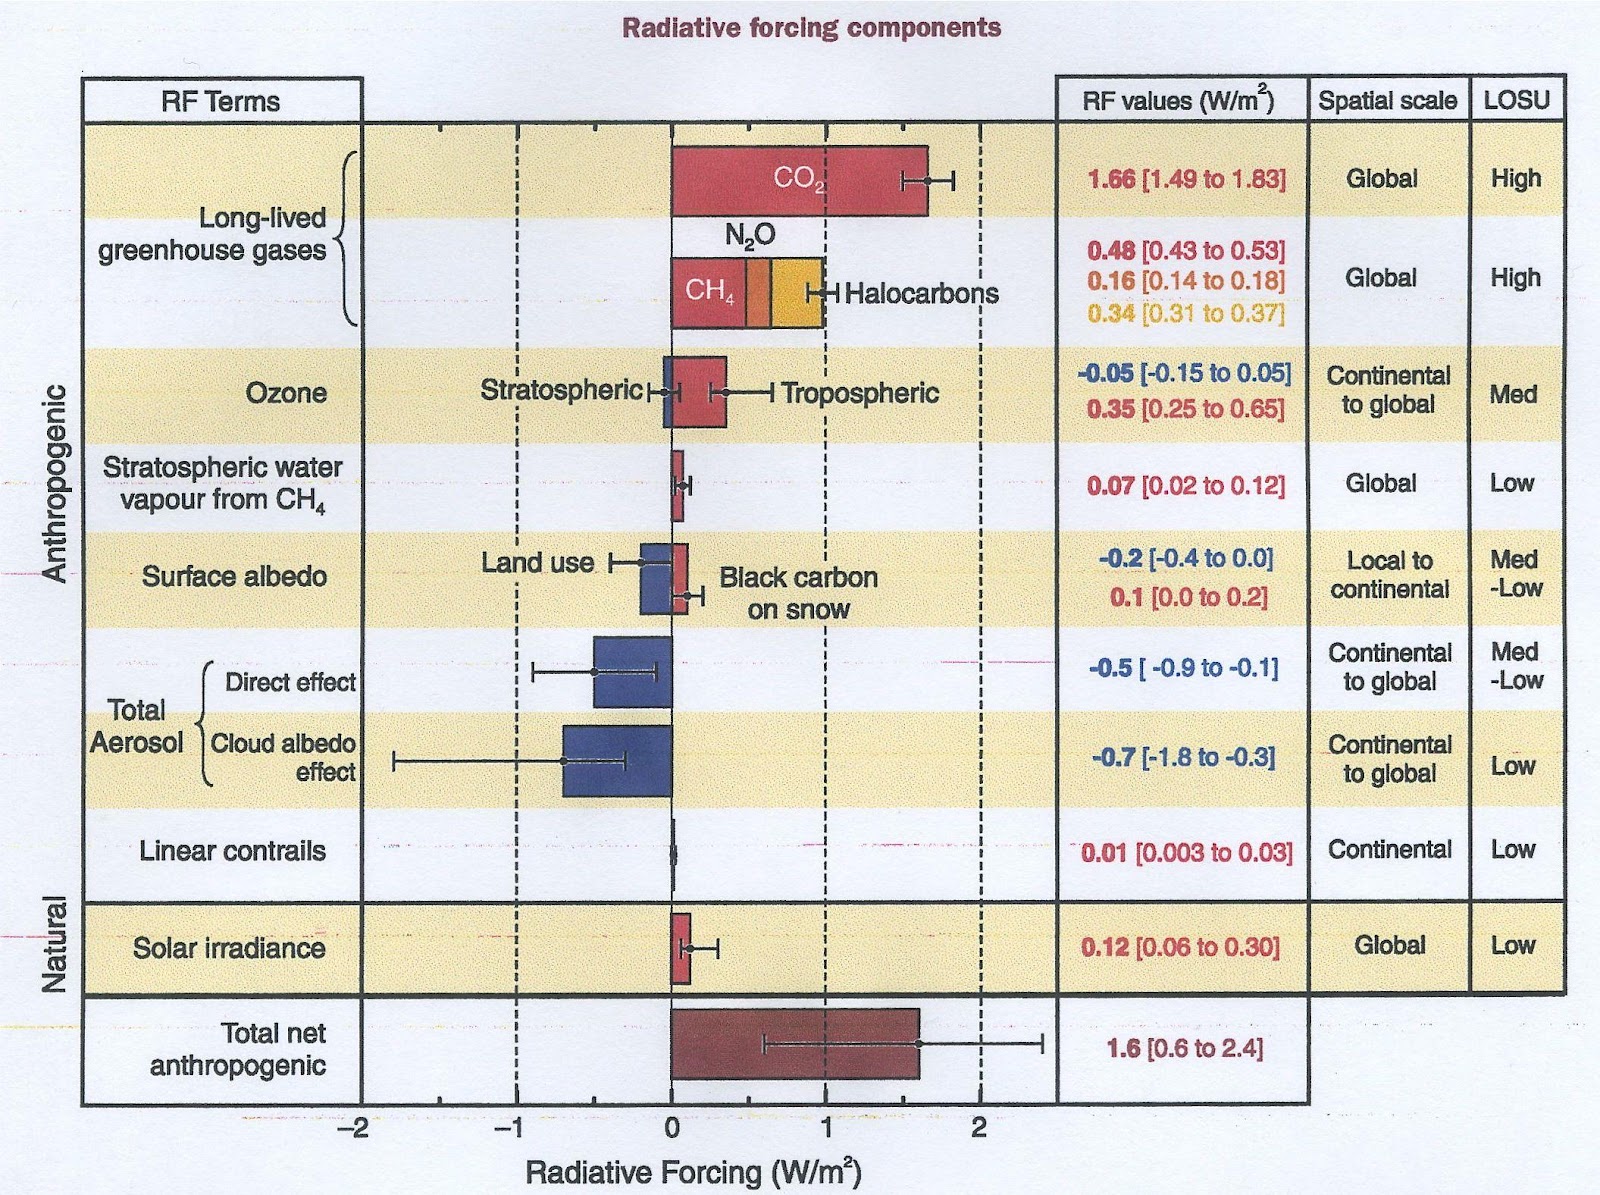
Things to note;
- Water Vapor, the most important greenhouse gas, is not listed.
- Only solar irradiance is included – this is not the only way the Sun affects climate. If you list only human causes then how do we affect solar irradiance?
- The right-hand column is the Level of Scientific Understanding (LOSU).
- Claims of “high” understanding are scientifically unjustified.
- Nine items are listed – only two are high, but four are Low and two Med-Low.
- The total change caused by humans is averaged at 1.6 W/m2 (range 0.6 to 2.4)
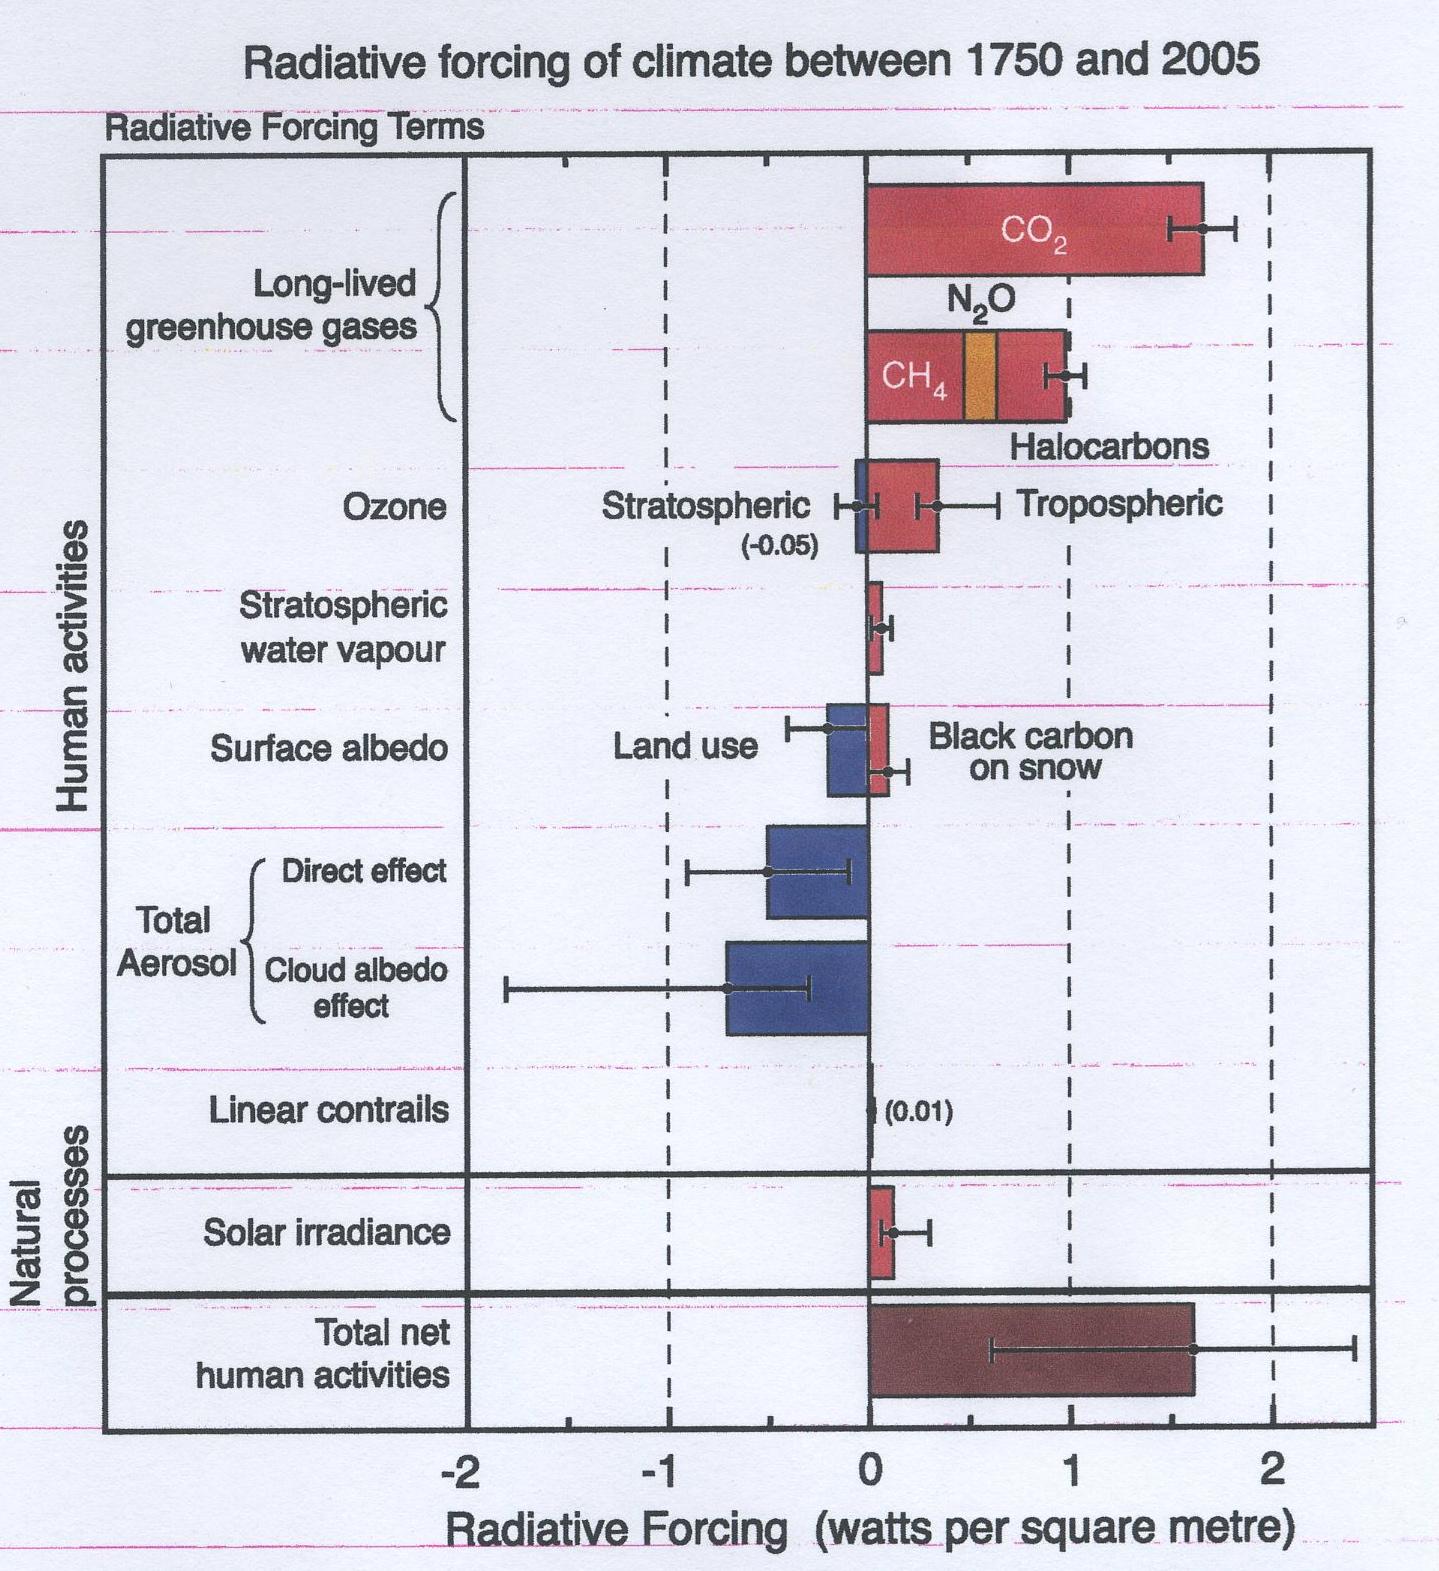
They added no new variables to the 2007 Report, despite the supposed new definition. As with everything the IPCC does it is what is missing or changed that tells the story.
- The LOSU column is gone.
- The column listing the range of estimates of RF (Radiative Forcing) is gone.
- Water Vapor is still missing.
- Numbers for the range of human forcing are missing, but eyeball readings indicate they are unchanged.
- The total net human effect appears to remain at 1.6 W/m2.
- This indicates the claimed increase of human CO2 was not included.
The problem remains that since you don’t know how much CO2 there is or how much it changes naturally, you cannot determine what portion is due to human activities. Every figure used is a very crude estimate at best.
By design all CO2 numbers used by the IPCC underline the human impact. They are meaningless figures from the total volumes to the annual flows and the human inputs as depicted in the IPCC carbon cycle diagram. In 2010 Dr Dietrich Koelle provided a table of the estimated emissions and uptakes of CO2 from natural sources and the human emissions.
EMISSIONS:
Humans and Animals 45 to 52
Oceans’ outgassing (tropical areas) 90 to 100
Volcanic and other ground sources 0.5 to 2
Ground bacteria, rotting and decay 50 to 60*
Forest cutting, forest fires 1 to 3
Anthropogenic emissions (2010) 9.5
TOTAL 196 to 226.5
* other published values: 26 Gt, resp. 86-110 Gt
UPTAKE:
Vegetation on land 55 to 62
Oceans’ uptake 87 to 95*
Algae, phytoplankton, seaweed 48 to 57
Weathering (Silica minerals) 3 to 6
TOTAL 193 to 220
* other published values: 68-110, 30-50 Gt
The difference is + 1.5 to 3 Gt C p.a. which is in agreement with the annual increase (depending on the ENSO activity).
Notice that the range of error of estimates for emissions of Oceans and Ground Bacteria exceeds the total for humans.

Human CO2 production is central to the IPCC objective, so they control production of the information. Like most things they do it is disclosed, but they know few people realize the significance. Here, they explain the process.
—————————————————————–
What is the role of the IPCC in Greenhouse Gas inventories and reporting to the UNFCCC?
A: The IPCC has generated a number of methodology reports on national greenhouse gas inventories with a view to providing internationally acceptable inventory methodologies. The IPCC accepts the responsibility to provide scientific and technical advice on specific questions related to those inventory methods and practices that are contained in these reports, or at the request of the UNFCCC in accordance with established IPCC procedures. The IPCC has set up the Task Force on Inventories (TFI) to run the National Greenhouse Gas Inventory Programme (NGGIP) to produce this methodological advice. Parties to the UNFCCC have agreed to use the IPCC Guidelines in reporting to the convention.
How does the IPCC produce its inventory Guidelines?Utilising IPCC procedures, nominated experts from around the world draft the reports that are then extensively reviewed twice before approval by the IPCC. This process ensures that the widest possible range of views are incorporated into the documents.
——————————————————————
In other words they control the entire process from the methodology, designation of technical advice, establishment of task forces, guidelines for reporting, nomination of experts to produce the reports, and final approval of what the reports say. They rely on data from individual UN member nations, but any examination of UN data quickly reveals its inadequacies. For example, look at the countries that claim 99% or higher literacy rate.
IPCC figures for annual CO2 production per nation are equally distorted and wrong. Worse, they have no scientific purpose, they are strictly for the political agenda. Professor Murray Salby shows in this video how the human portion is of no consequence. He demonstrates that variation in natural (non-human) sources of CO2 explains almost all annual changes. He shows how just a 5% variation in these sources is more than the total annual human production.
A partial explanation for the IPCC error is because climate science assumes change and variability are abnormal as the diagram illustrates. They don’t show the error in the estimates of volumes, which in at least three instances, atmosphere, oceans, and vegetation/soil detritus exceed estimates for total human production. This is true even with IPCC’s claimed annual increase.
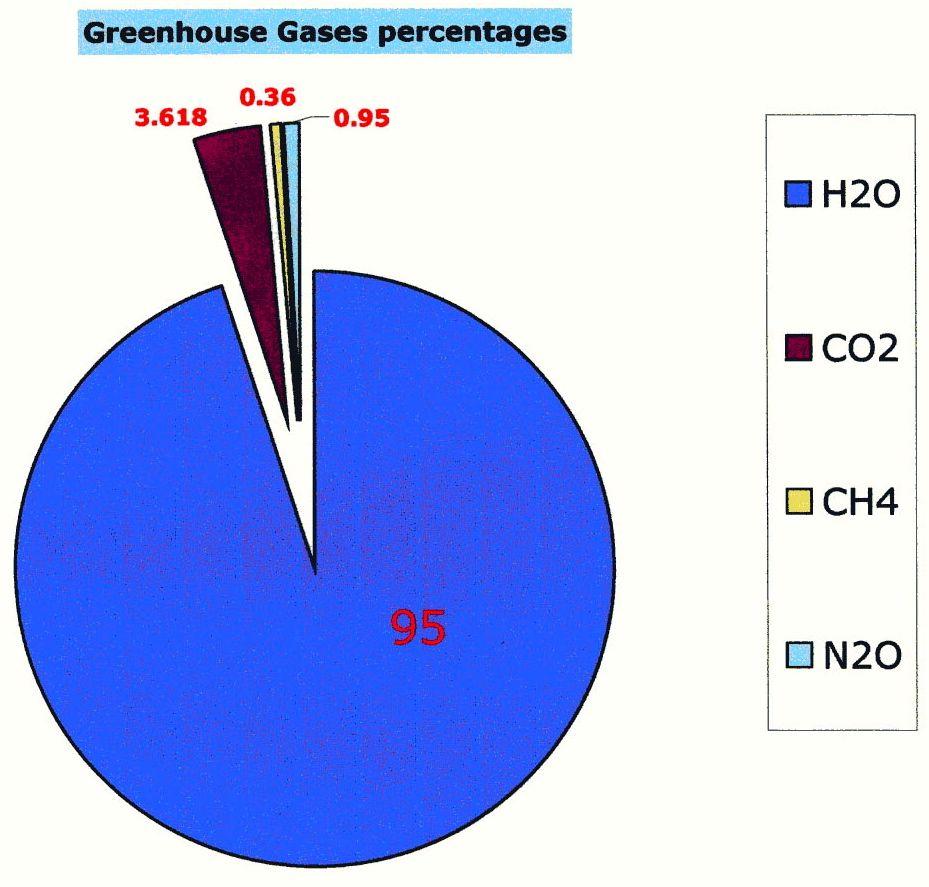
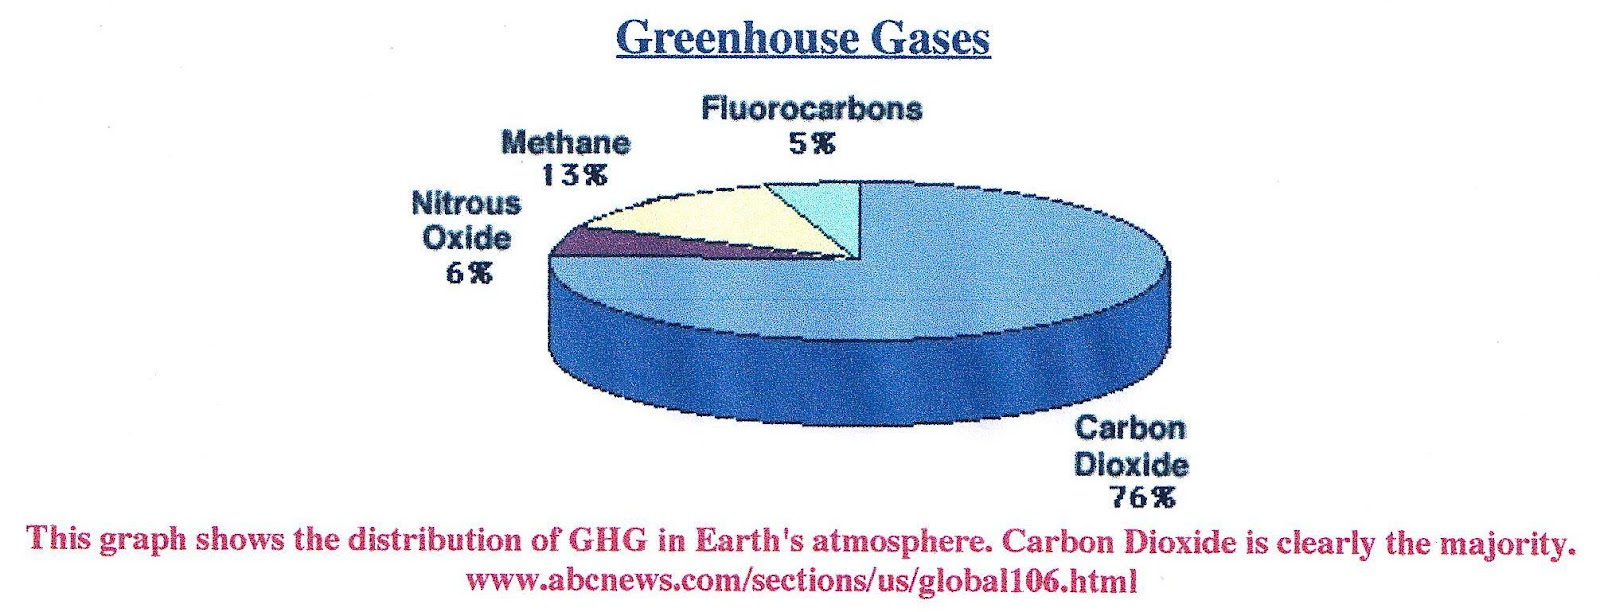
Figure – shows the percentages of greenhouse gases in the atmosphere.
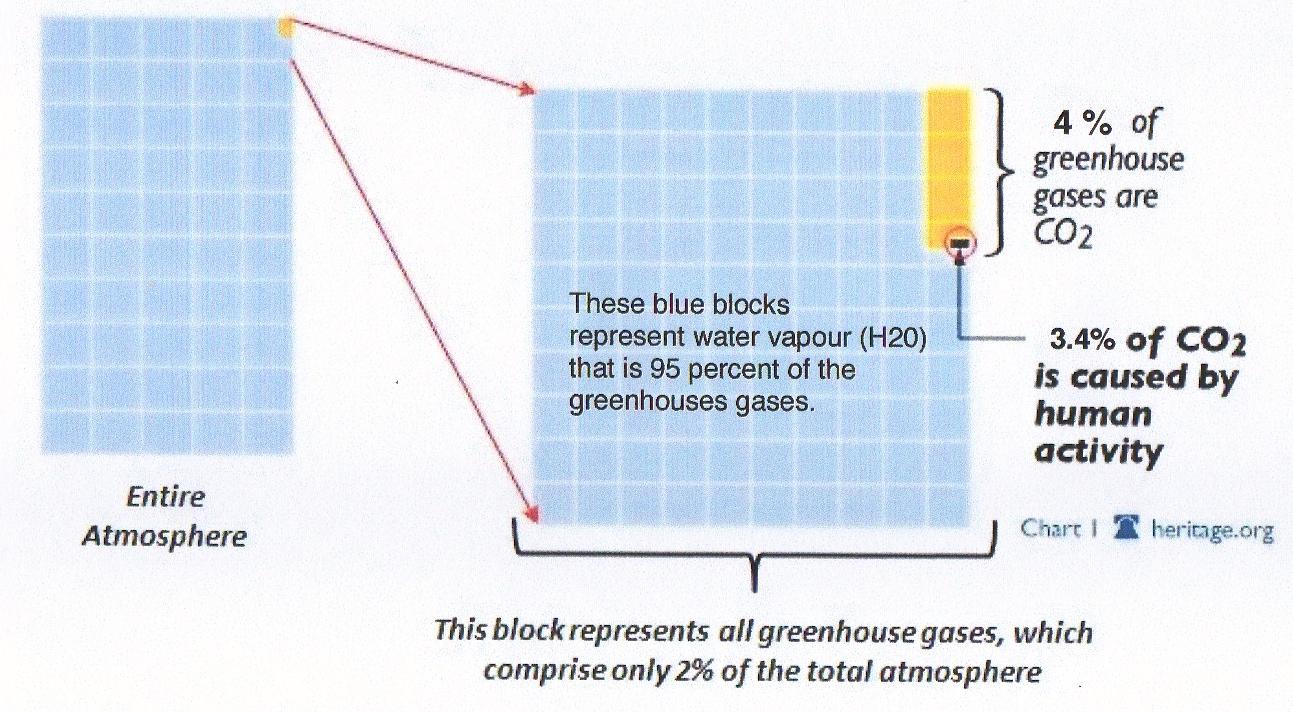
Another diagram shows the greenhouse gas percentages in a different form.
Compare that diagram with this one from the ABC News network web site. It illustrates the distortions created by the deception so the IPCC. Water vapor, the most important greenhouse gas by far, is not even shown. It is evidence of the success in placing all the attention on CO2..
There are several misconceptions about CO2, created to prove the hypothesis and raise the level of threat in various ways. For example, an early IPCC claim said atmospheric residency time of CO2 was at least 100 years. Done, ostensibly, for the political point that even if we stopped CO2 production immediately the damage done lasts for a long time. We now know the actual time residency is approximately 5 to 6 years.
The major assumption of the hypothesis says a CO2 increase causes a temperature increase. After publication in 1999 of Petit et al., Antarctic ice core records appeared as evidence in the 2001 Report.
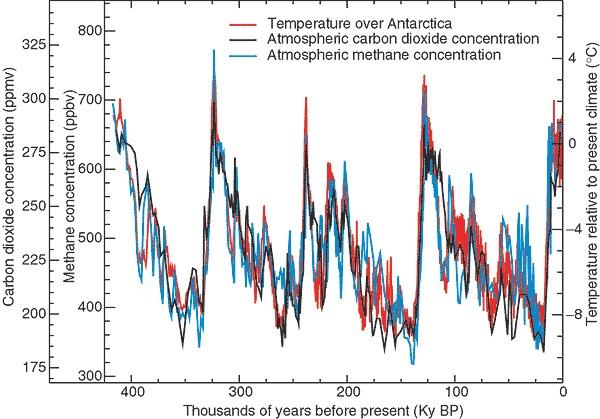
Figure : Antarctic core core record.
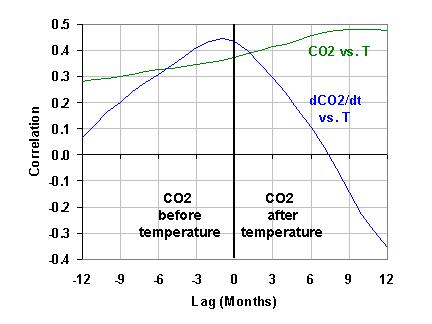
Just four years later proof that the major assumption of the hypothesis was wrong appeared. A more detailed look showed that the temperature increased before CO2 in complete contradiction to the hypothesis. Somehow it was shuffled aside, probably because of the diversionary claim that the lag was between 80 and 800 years. It doesn’t matter because it still contradicts the basic assumption. More compelling is the fact that temperature changes before CO2 change in every record for any period or duration. Most curious, the contradiction is ignored by proponents and too many skeptics. Figure 2 shows a shorter record of the relationship.

Figure 2; Lag time for short record, 1958 to 2009.
It is logical to assume that if CO2 change follows temperature change in every record then CO2 cannot be a greenhouse gas. Despite this, the assumption that a CO2 increase causes a temperature increase is in all global climate computer models including those of the IPCC.
The IPCC faced another serious challenge created by the need to prove their hypothesis, rather than disprove it as normal science requires. It paralleled the need to eliminate the Medieval Warm Period because it showed the world was warmer than today before the Industrial Revolution. It was necessary to show or claim that the pre-industrial level of CO2 was lower than today. This campaign was underway before the ice cores information was released.
Most people think ice cores are the only source of pre-industrial CO2 levels. What most people don’t know is that thousands of direct measures of atmospheric CO2 began in the Nineteenth Century. Joseph Black had studied the properties of CO2 in the 1750s and Joseph Priestly published on oxygen in 1775. Attempts to measure the various volumes of atmospheric gases, with global measures of CO2 followed these events beginning in 1812. Scientists took precise measurements with calibrated instruments as Ernst Beck thoroughly documented.
In a paper submitted to the Hearing before the US Senate Committee on Commerce, Science, and Transportation Professor Zbigniew Jaworowski states
“The basis of most of the IPCC conclusions on anthropogenic causes and on projections of climatic change is the assumption of low level of CO2 in the pre-industrial atmosphere. This assumption, based on glaciological studies, is false.”
Of equal importance Jaworowski states,
The notion of low pre-industrial CO2 atmospheric level, based on such poor knowledge, became a widely accepted Holy Grail of climate warming models. The modelers ignored the evidence from direct measurements of CO2 in atmospheric air indicating that in 19th century its average concentration was 335 ppmv[11] (Figure 2). In Figure 2 encircled values show a biased selection of data used to demonstrate that in 19th century atmosphere the CO2 level was 292 ppmv[12]. A study of stomatal frequency in fossil leaves from Holocene lake deposits in Denmark, showing that 9400 years ago CO2 atmospheric level was 333 ppmv, and 9600 years ago 348 ppmv, falsify the concept of stabilized and low CO2 air concentration until the advent of industrial revolution [13].
Jaworowski’s claim the modelers ignored the 19th century readings isn’t correct. They knew about it because T.R.Wigley introduced information about the 19th century readings to the climate science community. (Wigley, T.M.L., 1983 “The pre-industrial carbon dioxide level.” Climatic Change 5, 315-320). It did what many others have done in taking a wide range of readings, eliminating only high readings and claiming the pre-industrial level was approximately 270 ppm. I suggest this is what influenced the modelers because Wigley was working with them through the Climatic Research Unit (CRU) at East Anglia. He was the key person directing the machinations as revealed by the leaked emails from the Climatic Research Unit (CRU).
Wigley was not the first to misuse the 19th century data, but he did reintroduce it to the climate community. Guy Stewart Callendar, a British Steam engineer, pushed the thesis that increasing CO2 was causing warming. He did what Wigley did by selecting only those readings that supported the hypothesis.
Full story here
This is basically the ‘Duffers Guide’ to climate change I have been fiddling about with for ages now.
Much better explained by Tim (obviously) but it’s something the public needs to be shown.
If there is a generous, wealthy, philanthropic sceptic out there, he/she could do the world a favour by having this presented in a modern infographic and posted by every enthusiastic sceptic on social media, as well as each of us physically posting it through our neighbours letter boxes.
I’ve noticed a number of errors or misunderstandings in the post and that’s only after a brief scan.
Thanks John. Please list them.
1. Tim Ball is confused about “residence times”. The 5-7 years refers to the ‘average’ residence time of a individual molecule in the atmosphere. The longer ~100 years residence time refers to the the pulse of excess CO2 which has accumulated in the atmosphere since about 1800. Willis
Eschenbach provides a decent explanation of the distinction here
https://wattsupwiththat.com/2015/04/19/the-secret-life-of-half-life/
2. Tim Ball shows that “only” 3.4% of atmospheric CO2 are from human emissions. This is a misleading figure shows a lack of understanding of the carbon cycle. The 3.4% proportion is pretty much exactly what we would expect if fossil fuel burning were responsible for the i increase in airborne CO2 since 1850.
Hypothetical Example: Let’s suppose that the natural pre-industrial level
of CO2 was 300 ppm. Let’s also suppose that 60 ppm is recycled each year, i.e. 60 ppm is sequestered and 60 ppm is released (i.e. average residence time = 5 years as per (1)) .
Now consider what happens if fossil fuel burning adds 3 ppm per year. This is 5% of the natural carbon cycle – but over time this will grow until it becomes 5% of the TOTAL when that proportion will be become part of the proportion of the natural cycle. You need to think about this.
HOWEVER, this DOES NOT mean that humans are only responsible for a 5% (or 3.4%) increase in atmospheric CO2. The ‘human’ CO2 is taking the place of the ‘natural’ CO2
in the sequestration part of the carbon cycle which means both the ‘human’ and ‘natural’ CO2 levels are increasing. Humans are responsible for most of the 40% increase since ~1850..
3. Tim Ball complain complains about Water Vapour (WV) not being included as a greenhouse gas. The reason is that WV is a feedback. It is transient. Water Vapour needs warmth for it to reside in the atmosphere. Without the other greenhouse gases there would be very little Water Vapour.
From this we can conclude that Tim Ball does not understand the table which gives Global Warming Potential of greenhouse gases. But I’m going to leave it at that for now but I’m beginning to despair at the level of argument being presented by ‘our’ side.
To support you, John Finn, and all the other sociopaths pushing AGW, the Canadian Government raided Russ George’s offices and took his data that proved a little iron sulfate sucks up hundreds of millions of tons of CO2 into the ocean and causes a salmon fishing bonanza. The criminal cabal that is behind the anti-CO2 cult should be jailed. CO2 is a resource, not a problem. RussGeorge.net These criminals don’t want us to know.
Tom Schaefer May 2, 2019 at 8:12 am
Could you show me which bit of my comment you disagree with? I am aware CO2 is a resource. However, I also know increasing CO2 in the atmosphere will result in a warmer world. Whether that warming will cause a problem is a separate issue.
But there is no point in AGW sceptics presenting bogus arguments.
Finn says:
“Tim Ball complains about Water Vapour (WV) not being included as a greenhouse gas. The reason is that WV is a feedback.”
WV is the most important greenhouse gas.
Do you deny that ?
We’ve had 78 years of adding a lot of CO2 to the atmosphere,
since about 194, … so where, oh where, is all the dangerous global warming that was predicted ?
Finn says (in another comment):
“I also know increasing CO2 in the atmosphere will result in a warmer world.”
You DON’T know that — you assume that.
Big difference.
There is no scientific proof, and nothing in the temperature data that could not have been caused by natural causes of climate change.
“Let’s also suppose that 60 ppm is recycled each year, i.e. 60 ppm is sequestered and 60 ppm is released (i.e. average residence time = 5 years as per (1)) .”
There’s your mistake. The amount sequestered is not static, but rises and falls in response to input forcing. This is why simple bookkeeping analogies to interest free-bank accounts fail. It is a dynamic system that continuously adjusts itself in a drive towards equilibrium.
John Finn,
I do completely agree with you. All skeptics agree on one point: the influence of CO2 on temperature is small to modest. There is no need to use false arguments that are easily refuted, as that makes the real arguments also suspect…
– Residence time is how much CO2 is exchanged in a given year. That is completely unimportant in terms of increase or decrease of CO2 in the atmosphere. It may be 2 days or 200 years. As long as there is as much input as output the net effect on the amounts in the atmosphere is zero. Currently the residence time is around 5 years. Everybody, including the IPCC agrees on that.
– Adjustment rate is how fast CO2 decreases if there is some extra CO2 in the atmosphere above the (dynamic) equilibrium between ocean surface and atmosphere. That is about how much CO2 changes in a give year, or the difference between CO2 inputs and outputs. That is currently about 51 years, or a half life time of about 35 years. In the past 60 years nicely linear with the excess CO2 above equilibrium.
The IPCC uses the Bern model which assumes saturation of the oceans, which is true for the surface, but not for the deep oceans, which still have an enormous capacity, but a relative small exchange rate with the atmosphere.
Bartemis,
That is your theory, which violates about every single observation in the real world…
There is zero evidence that the natural cycle substantially changed over the past decades, to the contrary: the residence time estimates slightly increased in the past years due to the increased CO2 mass in the atmosphere, while the throughput remained about the same.
What is observed is that human emissions quadrupled in the past 60 years and so did the increase in the atmosphere and the net sink rate. Thus the net sink rate is a simple linear process where the extra CO2 partial pressure (pCO2) governs the extra uptake.
The huge in/out fluxes which make the residence time are mainly (seasonal) temperature dependent and are hardly influenced by the increase of CO2 in the atmosphere. Here the seasonal trend of different periods compared where it is clear that the amplitude (= vegetation + oceans) is near unchanged despite +30% CO2 pressure, only the residual CO2 increase doubled with a doubling of human emissions:
http://www.ferdinand-engelbeen.be/klimaat/klim_img/seasonal_CO2_MLO_trend.jpg
Yes the biggest being that 392 ppm of CO2 has any heat induced effect. Quite the opposite.
Also not noted is the exhaled contribution of 8.5 billion humans. Compare this CO2 load to the industrial discharge in 1950 and it is statistically impossible to return to any of the Pre-19xx dates touted under any plan.
When I graduate from College with my degree in Mass Communications this December, I will endeavour to use my skills to expose the fraud of CAGW using video and podcasts. Sceptics are Great at graphs, mathematics, and articles to debunk the preposterous and false claims of the Climate Alarmists, but we live in the age of video, and we need video to inform a public that relies on video for information.
Mathematics? This is a faith based science, you either “believe” and follow the consensus of the willingly deaf, dumb and blind who believe with the fanaticism of a jihadist.
Or you apply a fifth grade education of reasonable thinking to the green movement and it’s proposals of solving earth’s problems through “taxation” to change the weather.
What does the fake consensus of 99% of scientists believe 400 ppm carbon dioxide can do? Divide 400 into 1 million to see that every carbon dioxide molecule is responsible for heating 2,500 air molecules each, continuously. For each carbon dioxide molecules to do its part, just to raise the temperature of the air 1° for one second, each CO2 molecule would need to be a minimum of 2,500°. Magic or miracle? (Not science, no cause or affect has ever been shown)
Today where I live, the temperature rose 30° over the low of the night by 10 o’clock in the morning. 30×2,500 =75,000 degrees, each CO2 would need to be nearly 8 times hotter than the surface of the sun continuously to achieve this. Ridiculous.
They say carbon dioxide is like a blanket holding in heat. If we use mathematics to convert the air molecules into threads of a blanket 1/64 of an inch in diameter (about the size of fishing line) The carbon dioxide thread will reoccur once every 2,500 threads.
Every 3’3″. If you turn every other thread perpendicular to make a crosshatch, fishing net pattern, the Squareholes in your blanket atmosphere that are not covered in CO2 would be 6’6″ across. This visual should give you a good idea how little CO2 can collect heat to influence our atmosphere because there is so little of it.
79% nitrogen is like winter clothing. 20% oxygen is like thermal underwear over your skin. Water vapor is like the perspiration from your skin, covers your entire body and is more pronounced when it is warmer. But it’s purpose is to cool. Water always cools. CO2 at .04% covering on your body, holds in the heat equivalent of a friendship bracelet, or necklace.
Hi Max. Thanks for that contribution from a “fifth grade education”.
Here is a contribution from a “first class education” at a first class university that you may possibly find interesting:
Tutorial provided to the United States District Court in San Francisco, March 21, 2018, by Myles Allen:
“CO2 cannot be a greenhouse gas”
Really?
Try the full quote:
“It is logical to assume that if CO2 change follows temperature change in every record then CO2 cannot be a greenhouse gas.”
It helps when you don’t chop off most of a sentence to try and make a point.
Cherry picking and projection are the only mental skills most AGW acolytes have been able to master.
True, the original statement is conditional. Loydo made it absolute by editing.
In form it is conditional. But the conditional is true, and yet, CO2 is a greenhouse gas.
Tim simply forgot to add ”potent” in that sentence it seems.
If a scientist “misses out ” such a key word in order arrive at an obviously false statement then he needs to be ignored. As usual half of what Dr Tim Balls produces is a load of balls.
Probably a case of an aptronyms or “the compulsion of the name”.
I don’t understand why our host continues to post his stuff here. It simply helps those who would discredit WUWT and in fact does discredit WUWT.
Nick Stokes
To all intents and purposes atmospheric CO2 makes no difference to the planets temperatures.
If we listed all the misleading and downright untrue statements made by alarmists we would be here all year.
And it should always be mentionet that CO2 is warm related greenhouse gas. It doesn´t heat atmosphere, it rises after warming. As has empirically measured.
In closed and already warmed greenhouses it helps plants to grow.
And that is against all this UN organised hysteria.
It is still a false statement.
The lag is probably a good indication that CO2 is not the primary cause of global temperature change. That is totally different from saying that it is not a GHG. That clearly a load of BALLS. ( no pun intended ).
“The lag is probably a good indication that CO2 is not the primary cause of global temperature change.”
It indicates that CO2 was not the primary cause on those occasions. It says nothing about what will happen if large masses of carbon are dug up and burnt, as we are doing now. That hasn’t been done before.
And your point is? Nick Stokes is still mired in this ignorance.
It’s always going to be different in the future for you alarmists, Strokes.
No actual climate change xperience in the past matters ?
78 years of experience with rising man made CO2 since 1940 and only harmless, intermittent warming, mainly in colder areas, mainly in colder months, and mainly at night.
300+ years experience with global warming since the 1690’s low point during the Maunder Minimum — up about +3 degrees C. in central England since then — perhaps up +2 degrees globally — good news all the way to 2018.
But never mind reality Strokes — it’s gonna be different next time, right ?
Over 60 years of scary global warming from CO2 predictions, starting with Roger Revelle in 1957, and the actual climate keeps getting better, and better .. while the anti-science scaremongers, and fools, keep crying “wolf”.
What is “climate change”?
It’s scary always wrong predictions of a coming climate change catastrophe that never shows up — nothing more !
There’s also wild hand waving if Robert Francis O’Rourke is talking about the subject.
Amazing that you, Mr, Strokes, would chose to be on that climate scaremonger team of losers, instead of doing something of value for the world.
Yeah, I got a problem with this statement as well. Saying “it’s logical to assume it is not a greenhouse gas” goes against what CAN be tested in a laboratory – That CO2 does indeed absorb certain wavelengths of infrared energy gaining kinetic energy.
What I do believe, is that it is possible that despite CO2 being a greenhouse gas, the climate system as a whole reduces its effects (maybe a little, maybe a lot). So I would accept that “it is logical to assume that within the existing climate system, CO2 does not behave as an important greenhouse gas”.
What I KNOW to be true, because I exist at all, is that CO2 cannot cause catastrophic run-away warming by itself. If that were possible, it would have already happened over the last 4 billion years. The climate system is bounded by positive AND negative feed backs. As long as the Sun’s output is stable, the Earth will remain within a narrow band of temperatures (assuming no catastrophic events like asteroid strikes or giant out pourings of basalt.)
I also KNOW to be true that the Earth’s climate is always in flux. This is what any geology class teaches you.
The presumption that climate should not be changing is just flat-out WRONG.
“That CO2 does indeed absorb certain wavelengths of infrared energy gaining kinetic energy. “
Absorption of infrared radiation by molecule does not gain kinetic energy to it. Such absorption changes energy of VIBRATIONAL and ROTATIONAL energy levels of molecules:
https://en.wikipedia.org/wiki/Infrared_spectroscopy
The temperature of a gas is defined according to L.Boltzmann by average kinetic energy of TRANSLATIONAL motion of molecules.
http://hyperphysics.phy-astr.gsu.edu/hbase/Kinetic/kintem.html
Does absorption of IR-radiation change the temperature of a gas? In any case, we know that gas can not absorb more heat than than the value of its heat capacity permits. Nitrogen and oxygen do not absorb IR-radiation, but they absorb heat. The heat capacity of carbon dioxide does not differ significantly from such values for nitrogen and oxygen.
CO2 absorbs IR and IR from a warm Earth’s surface radiates through the atmosphere where it may be absorbed by CO2. Nobody argues against this but the whole GHE is nothing like a greenhouse so saying its not a greenhouse gas is merely stating that the concentration in the atmosphere is irrelevant to what the surface temperature would be. He points out that at natural concentrations, this is what modelling should show since CO2 increase follows temperature increase in ice cores.
Its a simple argument to follow.
PS We also all believe that CO2 is produced when burning fossil fuels.
“PS We also all believe that CO2 is produced when burning fossil fuels.”
Yes, and that is the way to bring CO2 back where it belongs. We, bad bad people, help nature to blossom again. (If it is our fault at all.) And that means food to growing population.
How is the proportion of CO2 from human activities determined? Is it an estimate based on fossil fuel usage or from empirical measurements? I heard a comment on a podcast saying it can be measured as ‘natural’ CO2 has different isotopes to man-made CO2. Is this true?
Wow Loydo! You almost can read a whole sentence. Good.
“It is logical to assume that if CO2 change follows temperature change in every record then CO2 cannot be a (significant) greenhouse gas (as the term “greenhouse gas” is usually used and understood.“
ITS THAT SIMPLE. keep yabbering about it if that’s all you’ve got.
I find it interesting that the Total Radiative forcing of the CO2 component is almost exactly identical to the radiative forcing of the Human Activity Induced component.
No wonder they think Humans = Bad
The “residency time” of CO2 is on the order of 5-7 years, however that’s not really relevant. While humans are a relatively insignificant source of CO2 on an annual basis, we take carbon out of geologic sequestration and put back into the active carbon cycle. Little by little, we have increased the total “pool” of carbon in the cycle. There is a cumulative effect. It will take the Earth time to move that carbon back into geologic sequestration… Anywhere from 30 to 500 years… No one really knows for sure.
Regarding the “abnormality” of the modern atmospheric CO2 concentration (~400 ppm). Fossil plant stomata and Greenland ice cores clearly indicate that 300-350 ppm has not been unusual during the Holocene, with possible excursions to the 400 ppm vicinity. Apart from the DE08 ice core from Law Dome, all of the other Antarctic ice cores are incapable of resolving short-duration CO2 shifts, most have resolutions coarser than 100 years. If Law Dome was reduced to the resolution of the Vostok core, the modern rise in CO2 would not be resolved, and barely detectable.
This is a composite CO2 chronology from multiple Antarctic ice cores:
These ice cores are of vastly different resolutions. Petit et al., 1999 indicate that the CO2 resolution for Vostok is 1,500 years. Lüthi et al., 2008 suggest a CO2 resolution of about 500 years for Dome C. The Hockey Stick blade (368 ppm spike) is from Law Dome DE08. It appears that the high resolution Law Dome DE08 core was just spliced on to the lower frequency older ice cores.
If I use a 500-yr smoothing filter (Dome C resolution), the Hockey Stick loses its blade completely:
https://wattsupwiththat.com/2017/03/28/breaking-hockey-sticks-antarctic-ice-core-edition/
“The “residency time” of CO2 is on the order of 5-7 years, however that’s not really relevant. While humans are a relatively insignificant source of CO2 on an annual basis, we take carbon out of geologic sequestration and put back into the active carbon cycle. Little by little, we have increased the total “pool” of carbon in the cycle. There is a cumulative effect.”
If the aim is to define the evolution of carbon dioxide in the atmosphere and not to quantify the carbon cycle, the residence time is important. The CO2 content of the atmosphere is what has the potential to effect atmospheric temperature and the whole anthropogenic part of AGW is the amount that our emissions change the atmosphere. Because there are natural and human of the same molecule and nature’s sinks cant distinguish the source the flux equations must include the residence time. when it is short the time to equlibriberate is short and, if the partial source is constant it will not build up in the system. Salby’s sea bath example is easy to visualize and is very similar to Berrys preprint ( https://edberry.com/blog/climate-physics/agw-hypothesis/contradictions-to-ipccs-climate-change-theory/ ). Interestingly his paper now has this introduction
“On April 1, 2019, the American Journal of Climate Change rejected my paper for the following reason:
The conclusion of this paper is completely opposite to the consensus of the academic community.
Yes, it is. But the journal did not forward any evidence that there is an error in my paper and did not acknowledge that my paper proves the “consensus” is wrong. So, if it is unacceptable to publish a paper that contradicts the “consensus” how can there be progress in science?
Richard Courtney and Hermann Harde have sent emails stating they were reviewers and that they strongly recommended publication. “
Just alittle sticky point
Shouldn’t your X axis be labeled as K year increments?
The Ice core records go back 800,000 years with a quasi 110,000 year glaciation cycle
Look at the bottom right-hand side, where it says “Thousands.”
Residency time is important when discussing the assertion that little by little we have increased the pool. I was interested in an 1954 article where the degree increase in temps in the then past 100 years may have been due to increases in CO2 due to changes in Earth’s terrain. It does state a 10% increase in CO2 lead to a 1°C rise in temp. He also suggests that it might have been due to human emissions.
Estimates have changed since then (the propaganda, not so much) but it does highlight how quantitative claims that require a fickle Earth need to be taken with a punch of salt.
“Residency time is important when discussing the assertion that little by little we have increased the pool.”
No, it isn’t. David is quite right that what counts is the movement of total mass of carbon, not whether C atoms are exchanged along the way. An analogy is that, if you persistently overeat, little by little you will increase your mass. That is despite the fact that the excess carbon ingested is a small fraction of the carbon you breathe out and excrete every day. Residency time of carbon atoms in our bodies is short, but excess weight persists.
Over eat what? Borrowing from Monty Python, are emissions really like Mr Creosote’s wafer thin mint?
Ignoring my doubts as to the accuracy of the Keeling curve, that CO2 levels have increased is all the evidence that this pool has increased due to human emissions and no other reason. All natural sources are wild guesses and as well as all sinks. I was pointing to how once it was thought that changes in terrain could have accounted for by the large changes in CO2 that led to interglacial and glacial periods via weathering of rocks when large mountain ranges were present or when there was a flatter Earth with many swamps. There are many other reasons for large natural changes, that are not reversible.
Back to the Keeling curve, I wrote why I doubt it is a proper measurement for reasons expressed here a few years ago. There is way too good a correlation with rate of change ofCO2 with SH SST and the old RSS after 1990. There were a couple of things that I left out and while some seem to have noticed that picking a better t rather than the mid point that you get a more damning result (as well as the error for T being 1 not 2 SD) it seems that nobody noticed that it was strange that no only did the one scaling get the lines of best fit to be the same, the deviation from the line of best fit didn’t need to be scaled to compare the two ie. the plots of the difference between readings for consecutive months is a different dimension to the temperature so in order to compare apples with oranges, you would detrend each by subtracting the line of best fit for each. You would then scale the remainder by dividing the by the sum of the absolute values in order to compare. Simply scaling by the one constant does both. Strange is it not and good reason to doubt the Keeling curve until the method is properly verified?
“I was pointing to how once it was thought”
Well, I wish you would actually point. Just mentioning a 1954 paper with no identifying details and no quote of what they actually said is not helpful. Nor is the other ramble on why you think the Keeling curve is wrong. It is just a set of actual CO2 measurements.
On weathering, that goes back to Arrhenius at least, and hasn’t changed. Rocks weather very slowly and expose basic surfaces which absorb CO2. This roughly balances the also slow accumulation of CO2 via volcanic emission. Nether gives any explanation of why we are now at 410 ppm CO2, about a 40% increase over just a century, and also about 40% higher than any level attained in the previous million years.
“about 40% higher than any level attained in the previous million years.”
Nick, you are totally ignoring the top of this message thread you are replying too where David very clearly shows the fallacy of this argument due to the lack of resolution of proxy data.
Greg,
“David very clearly shows the fallacy of this argument due to the lack of resolution of proxy data”
No. For a start, it isn’t proxy, it is actual CO2 concentration. But what he says is that some data has a resolution of centuries. OK, but some doesn’t. Law Dome is 10-15 years and goes back 2000 years. Epica Dome C has varying resolution, but goes back 10000 years with 80 year or so resolution. So even there we have a long period in which CO2 is observed not to rise above about 280 ppm. But even earlier, there are a lot of observations from different cores, and all within that range. OK, it might be possible to squeeze in a spike that got smoothed out. But this just isn’t physical. A spike requires a huge mass of carbon; hundreds of gigatons. Where could that have come from back then? We know where it is coming from now; our mining. That is unprecedented.
Its not a ramble. I point out how it follows the temperature anomalies too closely to be actual measurements. Everybody is familiar with Murray Salby’s claim. I’m just saying that that the correlation that he found is way too good for it too be real.
I refer to the 1954 article below but my original reply was about how having a short residency time creates doubt that such a small amount extra can accumulate. No need to point out how sinks are not a constant to someone so wise as yourself.
The “Present” was about 70 years ago. Today’s figures are quite different. What is your point?
Atmospheric mass causes the greenhouse effect via conduction and convection. The thermal effect of GHGs is zero but they do have an effect on global circulation patterns so small as to be indistinguishable from natural variability.
“It is logical to assume that if CO2 change follows temperature change in every record then CO2 cannot be a greenhouse gas.“. It might sound logical, but it’s not necessarily correct. It could be that the effect of CO2 on temperature is much smaller than the effect of temperature on CO2.
Yep. Anthropogenic CO2 emissions didn’t prevent the mid-20th century cooling, which was so significant, that it caused a hiatus, possibly even a decline, in atmospheric CO2, so pronounced that it shows up in the DE08 ice core.
MacFarling-Meure, C., D. Etheridge, C. Trudinger, P. Steele, R. Langenfelds, T. van Ommen, A. Smith, and J. Elkins (2006), Law Dome CO2, CH4 and N2O ice core records extended to 2000 years BP, Geophys. Res. Lett., 33, L14810, doi:10.1029/2006GL026152.
Agree. Warming and cooling during past glaciation cycles were not primarily driven by changes in atmospheric CO2 concentrations, although that was probably a secondary driver. After oceans began to cool (likely from orbital effects on NH insolation), some CO2 moved from atmosphere into oceans, and warming events reversed this process.
I’ve always considered that the lag is the consequence of the time it takes biology to catch up with changing temperatures. Once ice melts, it takes centuries to establish a boreal forest and it requires CO2 to build a forest in the first place. The CO2 coming from natural sources is a limiting factor for the expansion of biomass as the climate warms and it takes a while for biomass to expand and sequester enough naturally released carbon for biomass to grow further. As it gets colder and biomass dies off, it takes time for the increased CO2 levels established in the previously warmer climate to gradually reduce.
As far any temperature dependent ocean intake and outgasing is concerned, this will be almost instantaneous relative to the centuries of measured lag times.
If currents had a larger role to play, changes to upwelling of nutrients to feed phytoplankton would have been a bigger factor.
Not so. Although CO2 exchange between air and surface ocean is quick, ocean mixing to depth is much slower, many centuries to deep ocean. During glaciation, that mixing occurs over thousands of years, and time is required for deep CO2 to come back out again.
donb,
The requirements of deep ocean mixing relative to ocean CO2 content is a red herring. The temperature of the ocean beneath the thermocline is constant and independent of the surface temperature. If the temperature of most of the water in the ocean doesn’t change in response to changes in the surface temperature, neither does its CO2 solubility. Besides, most of the CO2 in the oceans originates from biology and not the absorption of CO2 from the atmosphere.
A question regarding this statement in Dr Ball’s article: “Actual Residence Time for CO2 is only 5 to 7 years after which it is cycled back through natural sinks…”
My question: Isn’t it true that while a CO2 molecule should settle into the ocean in just a few years, this is a two-way process: the ocean receives and gives off CO2 at roughly equal rates.
So the atmospheric concentration of the gas isn’t really changing?
Please comment on that– I’m no expert on the matter.
The issue is: if you add an additional x% of CO2 to the atmosphere, how long does it take to get that same x% back out of the atmosphere. Dr. Ball correctly states that the half life residence time for CO2 is on the order of 5-10 years, but that is not the issue.
E.g. paint half the CO2 molecules in the air BLUE (since CO2 molecules are obviously liberal)….and emit no more CO2 molecules into the atmosphere. In 5 to 10 years, half of those blue CO2 molecules will have left the atmosphere (absorbed into the ocean or became part of a tree)…but the % of the atmosphere that is CO2 hasn’t changed much, because for every BLUE molecule exiting the atmosphere, there is (almost) one normal CO2 molecule entering the atmosphere…because atmospheric and terrestrial CO2 stores are (nearly) in equilibrium.
Any increase in atmospheric CO2% from a pulse (as from annual emissions) will eventually reach some equilibrium level with terrestrial CO2. This atmospheric equilibrium level will be lower than the “pulse” %, but at a bit higher % than before the pulse. The smaller numbers you see (~20 yrs.) are for the time to reach the slightly higher equilibrium %…the big numbers, like 200 years, is for getting back to the CO2 % before the pulse…I’m not sure how it EVER gets all the way back down to the pre-pulse levels.
The ocean absorb it and stores it as calcium carbamate. that is why we have so much limestone sitting around and the CO2 levels bellow 1000 ppm and not at the 4000 ppm that was the norm for so long.
The claim that CO2 resides in atmosphere for 5-7 years only is barely wrong. CO2 has multi-scale residence time and 5 years is only the shortest scale. Several hundreds of years is a more relevant scale.
“5-7 years”. “Several hundreds of years is a more relevant scale.” Say what? When did someone tag a single Co2 molecule to see how long it say afloat in the atmosphere?
Exactly that happened back in the fifties when H-bomb tests put a largish quantity of radioactive C14 into the atmosphere. The decline of this “Bomb pulse” showed that the half-life of coal atom in the atmosphere is on the order of 7 years.
The evidence that it has a short lifetime is in the Moana Loa CO2 record, where the response to the N hemisphere seasons is clearly seen in the data. It’s actually much bigger than the data suggests, as the opposite effect from the S hemisphere cancels a lot of it out. The same is seen in the global average temperature where the N hemi seasonal variability is 3X that of the S hemi, so even though from month to month the 2 hemispheres are always changing in opposite directions, when averaged together, they don’t cancel and the global variability retains the signature of the N.
More evidence comes from the fact that the amount of CO2 in the atmosphere and attributed to burning fossil fuels, making cement, refining Aluminum. brewing beer and other industrial scale producers of CO2 is significantly less than the amount of CO2 industrialization has generated.
Nope.
As shown in Salby’s recent talk, carbon 14 decreased exponentially following the halt in nuclear testing. This shows that CO2 absorption from the atmosphere occurs at a single dominant time scale – no longer than about a decade. In fact, as also shown there, CO2 absorption must occur even faster. The fast absorption of CO2, avoided by the IPCC crowd (understandably), makes the human contribution to increased CO2 small, likewise demonstrated by Harde and Berry.
https://edberry.com/blog/climate-physics/agw-hypothesis/what-is-really-behind-the-increase-in-atmospheric-co2/
https://edberry.com/blog/climate-physics/agw-hypothesis/my-poster-presentation-for-the-ams-annual-meeting-jan-8-2019/
As I said. 5 years is the shortest time scale. The nuclear tests are ok. They show this scale because the oceans did not contain the nuclear made isotope.
But there is not a single time scale. The oceans are saturated with the usual CO2. They absorb and emit CO2. The 100 and 400 years scales are relevant for us, not the 5 years scale.
I do not know if you went to school or college. If you did, remember the overcritically damped oscillator. It has two time scales: a short one and a long time scale. The damping happens on the longer time scale, not on the shorter one!
The same is with CO2. It dies have the short life time of 5 years. But it is irrelevant. It is the long lifetime important.
This is correct. The “5 year residency” is a red herring. For individual molecules it may be true but for a pulse you’re still looking at 15% residual after 1000 years.
It means a lag of about ten years from emission to maximum effect. In other words if emissions dropped to zero tomorrow, warming would continue and temperature would not plateau for ten years.
Emissions are increasing.
Loydo and Alex
I don’t see either of you mentioning the rate of CO2 absorption, which is not constant. Many of the discussion above are written in the idea that the absorption rate is not increasing logarithmically, which it is. The greater the concentration, the greater the rate of growth, and the more water efficient that growth is, and the ground coverage is increasing in areas where nothing grew before. Thus the size of the sink is increasing, at a rate that increases with the CO2 concentration, and the overall footprint of the biomass is also increasing due to (at least some) warming, even if episodic.
Much is said about the draw-down based on an equilibrium, an exchange, for example in and out of the ocean, but not much is said about the fact that the terrestrial sink (biomass) is not constant like the oceans. As permafrost land melts and deserts are wetter, the land base is increasing, and the rate of spread is itself increasing. Let me guess that the total read supporting biomass could eventually double, and the rate of biomass production could double per unit area.
The fact that the concentration is rising is interesting, but not only from human-sourced contributions. There is still a lot of parsing to be done.
Another factor you might consider is the reducing effectiveness of the ocean to act as a sink as it warms.
Nowadays the yearly CO2 emissions are about 10 gigaton carbon (GtC) and the atmospheric CO2 amount increases yearly by 5.5 GtC. The CO2 amount in the atmosphere has increased from 600 GtC in 1750 to 860 GtC today. If the CO2 residence would be 5 years, the present CO2 amount of 860 GtC should decrease to 600 GtC in 4*5 = 20 years, if the CO2 emissions would be stopped totally. It would mean a yearly decrease of 13 GtC per year. It is not possible. The real residence time of atmospheric CO2 is few tens of years. A rather good estimate is that the same time is needed for coming from 860 GtC to 600 GtC as it took to come from 600 GtC to 860 GtC. IPCC says that the residence time is ten thousand years and it is not true, either.
Residence time for human-added CO2 molecules is not primary in determining the atmospheric CO2 concentration. When atmospheric CO2 increases, that alters the CO2 exchange equilibrium between atmosphere and other reservoirs, e.g. oceans and plants. As human-added CO2 enters these other reservoirs, it is replaced with natural CO2 moving from oceans & plants into atmosphere. Slowly the human-atmosphere fraction goes down, but after some time even that human CO2 in these other reservoirs re-enters the atmosphere.
The operative question here is how much new CO2 entered the atmosphere in order to alter the natural exchange equilibrium and what was the source of that?
Regarding “Actual Residence Time for CO2 is only 5 to 7 years after which it is cycled back through natural sinks (an area of absorption) such as plants, oceans and soils”: This is the residency time of an individual molecule of CO2. The residency time of a quantity of CO2 added to the atmosphere is much longer, because as one molecule of excess CO2 (in comparison to previous equilibrium) is taken up ny the ocean, another “gases out”. Willis Eschenbach came up with time constant (tau) of 41 years, or half life of 59 years, assuming the decay of a “pulse” or injection of CO2 into the atmosphere is exponential. He shows this in https://wattsupwiththat.com/2015/04/19/the-secret-life-of-half-life/
Donald and Alex
The absorption of atmospheric C14 after the bomb test ban in the 60s show the residence time is short. The assumption that atmospheric CO2 was nearly constant before the industrial revolution and our emissions pushed the absorbers to saturation so the atmospheric content grew is falsified by that C14 data. See Salby’s video at ( https://edberry.com/blog/climate-physics/agw-hypothesis/what-is-really-behind-the-increase-in-atmospheric-co2/ ) to see how several analysis that use the conservation equation and CO2 data to explain why the IPCC “adjustment time” is not a valid concept when evaluating atmospheric CO2 flow.
DMA: The bomb test results show the average residence time of individual CO2 molecules, not the time constant or the half life of a CO2 concentration change from an equilibrium returning towards that equilibrium. That is longer, because when extra CO2 molecules are pushed into a sink, some others get pushed out.
Even this is not quite correct. CO2 has many exponents, each time scale associated with its own process. It is the longest time scale that is relevant – depending on the initial conditions as usual.
Climate science does not “that CO2 is more “effective” as a greenhouse gas than water vapour”, as the author says. Rather, climate science claims that warming produced by increasing CO2 increases water vapor content of the atmosphere, which then produces additional warming, one of the feedback effects.
Over a given region and at a given time the ratio of amount of warming produced by CO2 and H2O can vary considerably, because water vapor content of the atmosphere can be quite variable. Satellite data show this in their acquired IR spectra.
Would the areas of greater effect be arid regions?
Arid desert regions primarily show CO2 emissions in satellite measurements, with little water. Over tropical oceans water is dominant, and water IR overlaps some with the 13 micron CO2 IR absorption. On a global scale, problem is averaging all such effects.
** Rather, climate science claims that warming produced by increasing CO2 increases water vapor content of the atmosphere, which then produces additional warming, one of the feedback effects.**
“claims” but where is the proof?
Feedbacks have not been measured – still theory.
Folks, I do not wish to be an alarmist (nor threadjack once again), but something seems to be going on with the Oroville dam spillway.
Current water level is 884 feet, just 17 feet below topping emergency spillway, input is almost 14.5 kfps with output flatlined at 9.5 kfps (hydroplant at bottom, I suppose).
Using the live webcam – great inclusive link from this site’s March 4, 2019 post, there are 3 workers inspecting spillway.
More perplexing (troubling?) is the water flow emanating from some slabs on the ‘dry’ portion of spillway.
Noise on the internet claims some shortfalls in construction of new spillway.
I have been watching the webcams and lake level graphs too http://oroville.lakesonline.com/Level daily and I believe they are just doing inspections after they let the new spillway rip for a week/10 days a few weeks ago. After they close the spillway gates, they directed the leakage flow from the gates to the west side of the spillway and now the last 3-4 days they directed the minimal leakage to the east side as can be seen from the webcams. They are probably inspecting every joint in detail and wasn’t safe to walk unless the surface was dry which is why the re-direction of the leakage. I doubt anything is wrong with the spillway since at a minimum the reinforced concrete is 5 feet deep and now on solid bedrock. Can barely see the humans on the spillway, being so huge.
With the lake level now coming up at about a foot a day and falling off, (.03 ft/hr from 2 Pm to 3 Pm) it looks to me that the spillway (and total rebuild) was a resounding success. It looks like the freshet probably peaked the week they spilled, and now I think they fill the reservoir to near the emergency spillway. Although that is still being built, or at least the upper concrete sills to the emergency chute, and I don’t think the emergency spillway is ready yet unless they had to use it. I was wondering where you got the cfs discharge info through the turbines? I haven’t been able to easily find that info.
The March 4, 2019 post on this site had some great info – both in the article and the comments.
There is/was a real time link in that post that has daily in/out figures.
The data for the power plant came from one of the commentators, so I do not know how much outflow is spillway versus plant.
While I certainly hope your evaluation is correct, one disturbing thing seems to be visible on the live webcam.
That is the water flowing OUTSIDE the spillway on the far lower right hand side.
While it takes a 10 to 20 second watching – in daylight- to see the differing appearance of this outside-the-spillway flow to know that it is – indeed – water, confirmation of same can be had by seeing the flow at the very bottom of the spillway.
A big unknown, and concern, to me is if that water is present now at absolute minimal flow, what will happen when things really start rippin’?
I loathe speculative doom porn, but some sites on the web have posited some concerns about this situation.
I think that water flowing outside the spillway at the lower right hand bottom is the leakage coming down the spillway and spilling out the side into and down the the rocks to the spillway basin. Or it is possible that it is the drainage doing its job along the side of the spillway where we can see the pipes coming up out of the ground for clean out and atmosphere pressure. There will be a long pipe down the spillway walls to gather up that water and pipe it to the bottom like Big O pipe around a house foundation. All good spillway and dam designs have some form of planned collection of rain, leaks/groundwater that is is forced under high psi thru the rock and dirt. Plus the right hand side was where the original breech of the spillway happened with all the fallen rock and washout of the old spillway slab floor. It seems that is where the transition is from subterranean bedrock to the earthen soils towards the main dam fill so that would be a place to really keep watch. When the dam is at full pool and up to the emergency spillway, especially with all this new construction, then it must be tested and checked and re-checked, forever. With really tall dams, especially earth fill tall dams, it is good to be a bit paranoid, within reason. What worries me is a major earthquake.
The link from the highlighted proof about CO2 leading doesn’t work
Regarding 19th century measurements of CO2 levels well above 300 PPMV: CO2 measurements close to the surface over or downwind of land that has a lot of biomass are often unrepresentative of overall atmospheric CO2. Such measurements tend to diverge with an overall tendency with a net upward unidirectional characteristic. Note records of projects CO2 measurements from various altitudes on towers. There is an explanation why this happens: When the sun is shining, biomass is a net sink of CO2, but the sun is heating the surface and convection causes the troposphere in the region to be mixed, and near-surface concentration of CO2 is close to the overall atmospheric concentration. When there is no convection stirring things up, there is usually little or no sunlight, so the local biomass is a net source of CO2 and near-surface concentration of CO2 often rises well above the overall atmospheric level. Average CO2 near the surface over one day will then be higher than the overall atmospheric concentration.
The terms “albedo” and reflectivity get used rather loosely in these discussions (and IPCC reports!). I would prefer to use the term “albedo” to characterize the back-scatter or retro-reflection of a diffuse reflector. However, virtually all natural reflectors have a specular component as well as a diffuse component. The specular component has a directional vector associated with it, in contrast to a diffuse reflector, which approximately reflects equally in all directions (a pseudo-Lambertian reflector). It is best to model the reflectivity of an object or class of substances (such as grass or sand) using a Bidirectional Reflectance Distribution Function (BRDF), which incorporates the diffuse and specular components.
Something that got left out of the diagrams above is that water has a much stronger specular component than almost anything else we encounter. However, water still has a BRDF and humans can effect the diffuse component in different ways.
The BRDF of ocean water is a combination of the macro-specular reflection from the average surface; there is a micro-specular reflection component from waves that redirect reflections, effectively acting as a diffuser. White caps actually produce a diffuse reflection. Oil spills can suppress the diffuse component from small waves and whitecaps and accentuate the specular component, although it changes the reflectivity because oil has a different (higher) refractive index than water. Another aspect of the diffuse component of reflection from water is the (usually) light-colored bottoms in shallow waters such as bays and coastlines. Yet another, are suspended particles such as plankton and silt. Now, here is another anthropogenic influence. If land use practices contribute increased silt and clay, it will both obscure shallow bottoms and mask suspended plankton, thereby dominating the diffuse reflectance with whatever the characteristics of the suspended particles are. The anthropogenic influences on the diffuse component of reflectance (albedo) tend to be limited to coastlines, but it is still a significant component. The situation is much more complex than is typically presented by NASA and other would-be climatologists.
Here is the Table for the 2001 Report.
No, it isn’t. It’s Figure SPM.2 from the 2007 report WGI SPM. Here’s the actual equivalent from the 2001 report:
[In the 2007 report…]
1. The LOSU column is gone.
2. The column listing the range of estimates of RF (Radiative Forcing) is gone.
That figure is from an FAQ box in the AR4 radiative forcing chapter. The proper radiative forcing table in Chapter 2 includes LOSU. It doesn’t specify RF values in numbers (though neither did the 2001 report figure), but as you’ve shown the number values are on the 2007 SPM figure.
4. Numbers for the range of human forcing are missing, but eyeball readings indicate they are unchanged.
5. The total net human effect appears to remain at 1.6 W/m2.
The figures in the 2007 report are unchanged from the 2007 report, yes.
This indicates the claimed increase of human CO2 was not included.
No, it indicates they are from the same report. As should be obvious to anyone.
By the way there is another error in those forcing tables. For ozone they (correctly) show that tropospheric ozone has a net heating effect and stratospheric ozone a net cooling effect. The same applies to CO2, but this is ignored.
http://nla.gov.au/nla.news-article69971042
An interesting article from a chemist, Dr Gerald Wendt, working for UNESCO in science education, from 1954.
IT WAS COLDER WHEN WE
WERE YOUNGER
Apart from playing down that anyone could have seen themselves the effects of climate change despite the claimed 1°C of warming in the past 100 years ( up to 1954), its also the claim that this could be due to a 10% increase in CO2 since the IR. He names a few reasons for it including the human burning of fossil fuels. While quantitative details have changed as the actual science catches up with the assertions, the propaganda hasn’t changed much. Occasionally a climate scientist has to correct the misunderstanding by vocal people in the media that not every weather event is due to climate change.
What I find the most interesting thing is how most of his other writing is promoting nuclear power.
Because of the larger mass of oceans compared to atmosphere and their deep mixing of heat, oceans contain over 90% of near-surface heat. But the process that produces greenhouse warming occurs in the troposphere. When any greenhouse gas absorbs an IR photon emitted by the surface toward space, it later emits a photon. But because the RATE of IR release (not absorption) depends on the fourth power of temperature, and because higher atmosphere is generally colder than the surface (lapse rate), that process causes less energy to be lost to space. Less energy loss means Earth warms. A simple concept.
The issue is: if you add an additional x% of CO2 to the atmosphere, how long does it take to get that same x% back out of the atmosphere. Dr. Ball correctly states that the half life residence time for CO2 is on the order of 5-10 years, but that is not the issue.
E.g. paint half the CO2 molecules in the air BLUE (since CO2 molecules are obviously liberal)….and emit no more CO2 molecules into the atmosphere. In 5 to 10 years, half of those blue CO2 molecules will have left the atmosphere (absorbed into the ocean or became part of a tree)…but the % of the atmosphere that is CO2 hasn’t changed much, because for every BLUE molecule exiting the atmosphere, there is (almost) one normal CO2 molecule entering the atmosphere…because atmospheric and terrestrial CO2 stores are (nearly) in equilibrium.
Any increase in atmospheric CO2% from a pulse (as from annual emissions) will eventually reach some equilibrium level with terrestrial CO2. This atmospheric equilibrium level will be lower than the “pulse” %, but at a bit higher % than before the pulse. The smaller numbers you see (~20 yrs.) are for the time to reach the slightly higher equilibrium %…the big numbers, like 200 years, is for getting back to the CO2 % before the pulse…I’m not sure how it EVER gets all the way back down to the pre-pulse levels.
“Water vapour which is 95 percent of the greenhouse gases by volume is by far the most abundant and important greenhouse gas.”
That is not a discrepancy with what the IPCC claims. The first report, FAR p 11, said:
“Water vapor has the largest greenhouse effect, but its concentration in the troposphere is determined internally within the climate system and, on a global scale, is not affected by human sources and sinks.”
That is why it is treated as a very important feedback, but not a forcing. Water is different in that there is an effectively infinite source, the ocean, always in medium term equilibrium with the atmosphere. You can’t change it by letting off steam, which only adds to rainfall. It changes only by shifting the terms of the equilibrium, which is why it is a feedback to temperature change.
**which is why it is a feedback to temperature change.**
Have they measured any feedbacks?
There is no instrument to measure feedback, either in the atmosphere or electronic circuits. It is inferred. In the atmosphere, it comes through an increase in the water vapor content (total, not RH). The AR5 has a section 2.5.5 which surveys the observations of this. They say:
“In summary, radiosonde, GPS and satellite observations of tropospheric water vapour indicate very likely increases at near global scales since the 1970s occurring at a rate that is generally consistent with the Clausius-Clapeyron relation (about 7% per degree Celsius) and the observed increase in atmospheric temperature.”
The IPCC’s science is so full of errors it’s an embarrassment to those responsible, starting with the definition of forcing. How can an instantaneous 1 W/m^2 of additional post albedo solar energy arriving at the surface have the same effect on the surface temperature as an increase in CO2 that instantaneously decreases emissions at TOT by 1 W/m^2, as the definitions of forcing and sensitivity predict. All of the W/m^2 of solar input adds energy to the surface. Only about half of the instantaneous absorption caused by increasing GHG concentrations will eventually return to the surface while what remains is emitted into space contributing to the radiant balance.
I just can’t understand why it’s so hard for some people to wrap their heads around the immutable fact that what goes in to the atmosphere must exit the atmosphere and that geometry dictates that about half leaves to space and the rest returns to the surface. The reason is no different than the justification for the factor of 4 attributed to solar forcing arriving across the area of a circle while the planet’s emissions leave across the surface area of a sphere of the same radius which is 4X the area.
Furthermore, the definition of forcing indirectly includes albedo effects eliminating them from consideration relative to the sensitivity. More importantly, this obfuscates the undeniable fact that the 33C or so of warming in excess of the 255K equivalent temperature of the incident solar energy can only occurs in conjunction with about 16C of cooling arising from the reflection of solar energy by clouds, ice and snow. Technically, the energy reflected by snow, ice and clouds as part of the response to forcing should be included in the total forcing whose equivalent temperature would be just a bit below freezing. Adding insult to injury, about to 2/3 of the excess warming comes from clouds, 2/3 of the rest comes from water vapor while less than 1/3 of what’s left is contributed by CO2, or less than 2C for all of the atmospheric CO2 combined. Clearly, the next doubling will never cause 3C.
Greenhouse warming has little to do with the amount of incoming solar energy or how it moves around the atmosphere. Warming occurs when LOSS of IR energy to space is slowed. IR from the surface to space occurs at a higher temperature than IR loss to space from gases in the upper atmosphere, where it is cooler — the T^4 effect.
donb,
While GHG’s and clouds effect the instantaneous rate of cooling, the AVERAGE loss of energy by the planet, relative to the emissions of the surface, is suprisingly constant from pole to pole at about 62% of the surface emissions. The data is quite clear that this average ratio is maintained within a couple of percent across the entire planet for averages as short as a few weeks, moreover; this ratio is independent of temperature, insolation and GHG concentrations and appears to emerge as the running average of cloudy and clear skies. Testing this is relatively easy and the results are very repeatable.
The vast majority of the gas molecules in the atmosphere don’t emit radiation, thus the kinetic temperature profile of the atmosphere is mostly irrelevant to the planets radiant emissions. Only GHG’s and the water in clouds emit photons that can leave the planet and only the emissions by the water in clouds are subject to the T^4 dependence. The kinetic temperature of the atmosphere is a consequence of the translational motion of gas molecules and the transfer of heat by conduction between the atmospheric gas molecules and space, i.e. molecular contact/collisions, is zero.
The whole duration of a molecule in the atmosphere is irrelevant and a great non-sequitur to change the discussion. The only thing that should matter in their world is the percent of the atmosphere that contains a given gas; if that gas cycles through quickly, who cares? Doesn’t matter.
But saying it stays around for 100 years certainly is scary sounding!
The IPCC’s climate models make no predictions thus the claims that are made by these models are not falsifiable. It follows that the views which are expressed in the IPCC’s various assessment reports are non-scientific and provide neither the IPCC or anyone else with information about the outcomes of the events of the future for Earth’s climate system.
Alarmists “don’t do simple”, but most people do if it gives good answers. This CO2 rebalancing method seems to work:
PREPRINT: Human CO2 has little effect on atmospheric CO2 – edberry …
https://edberry.com/blog/climate…/contradictions-to-ipccs-climate-change-theory/
Salby [17] shows how surface temperature changes the CO2 level. … Harde [18] showed how both inflow and outflow depend on surface temperature, … plot of Harde’s equation (17) which shows CO2 level as a function of surface temperature.