Guest Post by Willis Eschenbach
After the turn of the century, I became interested in climate science. But unlike almost everyone else, I wasn’t surprised by how much the global temperature was changing. As someone with experience with heat engines and engine governors, I know how hard it is to keep a heat engine stable under a changing load. As a result, I was surprised at how little the temperature was changing.
Over the 20th Century, for example, the temperature changed by a trivially small ±0.3°C. Since the average temperature of the planet is on the order of 287K, this means that the global temperature varied only about a tenth of one percent in a hundred years … that that is amazingly stable.
So I started my climate science investigations by looking for some kind of long-term mechanism that would keep the temperature stable. I read about the slow weathering of the mountains that constrains the CO2 levels. I thought about long slow changes in the ocean overturning. I looked at all kinds of long-term mechanisms … and found nothing that could constrain the temperature for 100 years. I thought about this for over a year. No joy.
Then one day I had an insight. I’d been looking at the wrong end of the time spectrum, the long-term, century-long end. I should have been looking at hours and days instead. I realized that if there were some mechanism that kept each day from getting too hot or too cold, it would keep the week from getting too hot or cold, and the month, and the year, and the century.
I was living in Fiji at the time. Every day, I watched the daily parade of tropical clouds and thunderstorms, and one day I realized that I was looking right at the very mechanism that I sought. But I still didn’t understand it. Where in all of the comings and goings of the clouds and the thunderstorms was the understanding that I sought? I thought that it might have something to do with the timing of the clouds and storms, but what?
I finally had another insight, that there was a point of view from which it all made sense. This was the point of view of the sun, which is a most curious point of view.
From the point of view of the sun, it’s always daytime, and there is no night. Not only that, but there is no earth time. From the sun, the left edge of the earth is always at dawn. Right under the sun, it’s always noon. And the right edge of the earth is always at dusk.
Intrigued by this, I went and got a series of pictures from the GOES-West satellite, taken at the same time of day. I averaged all of these photos, and this was the result.

Figure 1. Average of one year of GOES-West weather satellite images taken at satellite local noon. The Intertropical Convergence Zone is the bright band in the yellow rectangle. Local time on earth is shown by the black dashed lines on the image. Time values are shown at the bottom of the attached graph. The red line on the graph is solar forcing anomaly (in watts per square meter) in the area outlined in yellow. The black line is the albedo value in the area outlined in yellow.
It’s an oddity. By looking from the point of view of the sun, I’ve traded the time dimension for a space dimension. This lets me look at the evolution of the tropical day.
As you can see in the black line at the bottom of Figure 1, at around 10:30 in the morning the clouds start to build up. Within an hour the cumulus field is fully formed, and it maintains that level throughout the rest of the day.
My hypothesis was that this combination of cumulus clouds and thunderstorms formed a moveable sunshade. On warmer days, the sunshade moves to the left in Figure 1, and the clouds and thunderstorms start earlier in the day. This cools the day down. And on cooler days, the sunshade moves to the right, and the sun warms the surface.
As I said, all of this took some years. Finally, in 2009 I published my hypothesis as The Thermostat Hypothesis here at WUWT. Then I re-wrote it and submitted it to Energy and Environment, where it was peer-reviewed and published in 2010.
Since then I’ve been gathering supporting evidence for my hypothesis and developing it further. I realized that there are other emergent phenomena that contribute to the planetary thermoregulation. These include inter alia the El Nino/La Nina pump that moves warm water to the poles where it is freer to radiate to space; dust devils that move heat on land from the surface to the troposphere; the PDO and other ocean current shifts that alternately impede and assist the polar movement of warm water; cyclones moving heat out of the ocean and into the atmosphere; and squall lines that increase the efficiency of thunderstorms in refrigerating the surface.
I wrote a number of posts on various aspects of these emergent phenomena. However, what I didn’t have was data on the response of thunderstorms to surface temperatures. According to my hypothesis, both clouds and thunderstorms should increase with increasing surface temperature. In 2015, I was able to approach demonstrating this indirectly using the CERES data, by showing the correlation of tropical albedo and temperature. Figure 2 shows that relationship.

Figure 2. Correlation, total albedo and surface temperature.
As you can see, towards the poles the two are negatively correlated. This is because ice and snow melt with increasing temperatures and the albedo goes down. But in the tropics, as my hypothesis predicted, they are positively correlated—clouds increased with increasing surface temperature.
However, this still didn’t show that the thunderstorms were also correlated with temperature. However, in the most recent edition of the CERES data, Edition 4.0, there are four new datasets. These are cloud area, cloud top temperature, cloud top pressure, cloud area (percent), and optical depth.
Now, I got to thinking the other day about the El Nino 3.4 area of the ocean. This is one of the most variable areas of the Pacific as far as temperature goes because it is at the heart of where the El Nino/La Nina phenomenon occurs.
I also found that I could convert the CERES data to actual cloud top height. To do the conversion you need the sea level pressure, the cloud top temperature, and the cloud top pressure. I had two of these, so I got the HadSLP2 gridded dataset of sea level pressure. Using those three I calculated the cloud top altitude.
Now, where is the Nino 3.4 area? It’s in the mid-Pacific. It’s the blue rectangle in Figure 3 below.

Figure 3. Average cloud top altitude, CERES data, Mar 2000 – Feb 2017
You can see the preponderance of the tallest thunderstorms over the “Pacific Warm Pool” above Australia. A couple of months ago I posted about my first look at the CERES cloud dataset in a post called “Glimpsed Through The Clouds“. At that time I made a movie of the cloud height overlaid with contours of the sea surface temperature. I repost that movie below to show the close correspondence of temperature and thunderstorms.
 That showed the general agreement between thunderstorms and temperature, but nothing in detail. So to return to the El Nino 3.4 area, the area shown as the blue rectangle above, I graphed the sea surface temperature of that area alone. Figure 4 shows those temperatures.

Figure 4. Sea surface temperature in the Nino3.4 Region.
As I said, the Nino 3.4 area has some of the most variable sea surface temperatures in the tropical Pacific. In Figure 4 you can see the large El Nino of 2015/16, along with the three smaller El Ninos in 2002/3, 2006/7, and 2009/10.
Next, I took a look at the cloud heights in that area over the same period. Figure 5 shows both the sea surface temperature and the heights of the cloud tops.

Figure 5. Sea surface temperature (black) and cloud top heights (red) in the Nino3.4 Region.
Wow! I expected a correlation, but I never expected something that close. I figured that there might be other factors involved such as CAPE or wind shear, but they seem to be very minor players.
These CERES cloud datasets have provided the first clear evidence supporting my hypothesis that tropical thunderstorms are critical parts of the global thermoregulatory system, not in a general sense, but in a clear, step-by-step, month after month sense.
Finally, I wanted to take a look at the tropical cumulus cloud area. As with the thunderstorms, my hypothesis requires that the cumulus field begin earlier in the day and cover more area. Here is the temperature, along with the cloud area as a percentage of the sky.

Figure 6. Sea surface temperature (black) and cloud area (blue) in the Nino3.4 Region.
Once again, we have an extremely close correlation between the two variables, temperature and cloud area. Since thunderstorms do not generally cover a large amount of the sky, these would be mostly cumulus clouds.
CONCLUSIONS:
• As I hypothesized a decade ago, tropical cumulus clouds and thunderstorms do form an active governing system that acts to oppose any temperature variations by changing the timing and the strength of the daily emergence of the cumulus field and the associated thunderstorms.
• The thunderstorm connection is demonstrated by the very close correspondence between the temperatures and the strength of the thunderstorms as measured by average cloud height.
• The thunderstorm connection is demonstrated by the very close correspondence between the temperatures and the strength and timing of the thunderstorms as measured by average cloud height.
• The cumulus field connection is demonstrated by the very close correspondence between the temperatures and the strength and timing of the cumulus as measured by average cloud coverage.
• More clouds and thunderstorms when the ocean is warm cool the surface in a variety of ways, including cloud albedo changes, increased evaporation, cold rainfall, and as I’m writing this I remember one more thing … surface albedo changes. Hmmm … hadn’t thought of that in a while.
In my original hypothesis, I said that one of the ways that the thunderstorms increased the albedo was by forming breaking waves and spume, both of which are white and reflect more sunlight. In addition, the albedo of rough water is greater than that of calm water. So I hypothesized that thunderstorms would increase the surface albedo in a couple of ways … I should look at that as well. Hang on while I pull up that data … OK, here’s Figure 7, hot off the presses …

Figure 7. Sea surface temperature (black) and surface albedo (purple) in the Nino3.4 Region.
More good news. This is the first evidence I’ve found for this minor part of my hypothesis, the claim that thunderstorms cool the surface in part by increasing surface albedo. And while the change is small, about half a percent, it represents a change of ~ 4 W/m2 in absorbed solar energy. This is more change in absorbed energy than would result from a doubling of CO2.
So that’s what I found out today about the situation in the Nino 3.4 region …
After midnight here. It was hot today for the first time this year, but now it’s deliciously cool outside. Jupiter is blazing in the night sky, what a wonderful world we inhabit.
Best to everyone,
w.
OH, YEAH, ALMOST FORGOT: When you comment please quote the exact words you are discussing. Sources that are crystal clear in your mind may be invisible from this side of the screen, so please do everyone a favor and QUOTE THE EXACT WORDS YOU ARE REFERRING TO.
Very well done, Willis. A possible next step might be to connect your work to Lindzen’s adaptive infrared iris (BAMS 2001 IIRC). Judith Curry and I did back to back posts on it at Climate Etc. when it was added to a climate model and reduced sensitivity by about half. Judith even interviewed Lindzen to get his back story on how his hypothesis played out in the climate wars.
The adaptive infrared iris is an indirect consequence of tropical thunderstorms, working via regulation of high cirrus. More tstorms => more rainout => less high altitude moisture => less cirrus => more cooling, since high thin cirrus being made of ice is transparent to sunlight but opaque to IR, reflecting IR rather than letting it escape to space. Cirrus warms.
These CERES cloud datasets have provided the first clear evidence supporting my hypothesis that tropical thunderstorms are critical parts of the global thermoregulatory system, not in a general sense, but in a clear, step-by-step, month after month sense. ?dl=0
?dl=0 ?dl=0
?dl=0 ?dl=0
?dl=0
That’s a really good way to put it, as it’s always developing one way or the other.
Nino34 develops one way or another as the sun’s energy output changes over time.
It’s not just what happens at the surface with evaporation that regulates equatorial Nino34 temperature.
The sub-surface ongoing solar energy absorption that varies with changing daily TSI is the major influence over time on Nino34, making cloud generation yes a critical part, but secondary part of thermoregulation.
Nino34 temperature regularly changes under the influence of variable solar energy absorption from changing daily 1au TSI:
Today’s 90 day TSI trend is +0.0007, whereas the 2017 annual trend was -0.0002, so TSI has recently hit at least a local minimum in time, and is now slightly climbing, driving the Nino34 anomaly upwards with it.
Willis: I find your articles on cloud cover etc. fascinating as it all seems to fit in with my own views on the way the global temperature is controlled.
To me it is water that provides the basic thermostat. That is my hypothesis.
This is based on the following facts as I perceive them:
The mean global temperature is determined by
The solar position of the earth and consequent insOlation plus volcanic activity.
Earth’s gravity.
The vapour pressure of water and its relationship with temperature.
The high Latent Heats of evaporation and fusion.
The molecular weight of gaseous water wrt dry air.
An ancillary factor being the water concentration and thus partial pressure at the local water/air interface.
If you make the incorrect assumption that items 1 to 5 are all constant; then one can say that the temperature will be constant. However as there are variations this would account for a natural hunting around this mean value. A value which as you rightly point out has been remarkably constant over millions of years.
However none of this explains why until the actual mechanism and behaviour of water is considered in detail from an enthalpy viewpoint, with matters of radiation being merely part of the process, where here matters of the Albedo and emissivity of water come into play.
To this end the thermodynamics of the Rankine Cycle serves well and I suggest provides the explanation based on the simple observation that my kettle boils faster when I turn the heat up but the temperature remains constant. This being a very specific case relating to the factors above. Namely at sea level.
The conclusion being that within bounds, where water is concerned changes in heat input do NOT affect the temperature, providing the pressure remains constant.
If you now take the view that the Hydrocycle is in fact a Rankine Cycle then a great deal falls into place.
( briefly: Surface evaporation = The boiler. Rising against gravity = The piston. Dissipation of heat = The condenser. Precipitation = The feed pump. Enthalpy receipt on falling = The feed heater.)
Add to this that the steam tables tell us that for every Kilogram of water evaporated from the surface some 680 WattHrs. are dissipated into the atmosphere and/or space and one can get a handle on the powerful nature of this controlling mechanism when compared with the minor changes taking place in the heat inputs.
Calculations on what is actually happening at various locations in a cloud are quite possible and it can be established whether evaporation or condensation is taking place and the Constant temperature at which this happens bearing in mind that the top of a cloud will behave very differently from the bottom. And I suspect here that the height of the clouds is a function of the initial temperature at the surface evaporation stage which determines the rate at which this takes place and hence the height at which the latent energy gets depleted.
All this taking place at very low pressures and temperatures with the balance dictated by the respective values of the Vapour and Partial pressures involved.
What I find fascinating about your meticulous observations on a global basis of the cloud behaviours is that it appears to support the hypothesis I have in my mind. I all seems to fit; but, of course needs a great deal more consideration before reaching any conclusions.
A good idea if I now read your article in greater detail!
I would welcome any comments.
My regards
Alasdair
But still, you’re only paying attention to just one observable effect of a much larger overarching mechanism that acts as the thermoregulator on this planet and all other planets with atmospheres — convection.
Not that your work isn’t providing an excellent display of the mechanism at work.
@ATheoK- Typical trollop response:
*Not nice Theo- trollop, a woman perceived as sexually disreputable or promiscuous.
I’m a male, and a typical trollop response to me has always been, “500 baht for short time.”
I’m really sorry your response has been as you’ve stated. You need to find better trollops.
Sandy, Minister of Future
@ATheoK said- A) Respond with an ad hominem to demean the commenter.
My response to your first comment, ‘you need a refresher course in trolling 101 hahaha.’ is hardly an attack with your obnoxious, confrontational style of interaction, eg ‘1. Then you, Sandy, demand futuristic Earth cooling explanations for unnamed mechanisms…’
It was a subtle attempt to suggest you not act like a troll. Obviously i failed, heh.
Sandy, Minister of Future
Interesting post Willis. You’re quote above compares the 20th century change in earth’s surface temperature against the absolute temperature scale (K), which, as you correctly state, is very small (though I get 0.6 – 0.7C from the published data, not 0.3C). However, I would say that the Kelvin scale is hardly a useful metric for this task. A change in human body temperature barely noticeable on the Kelvin scale might nevertheless be more than sufficient to put a person in hospital!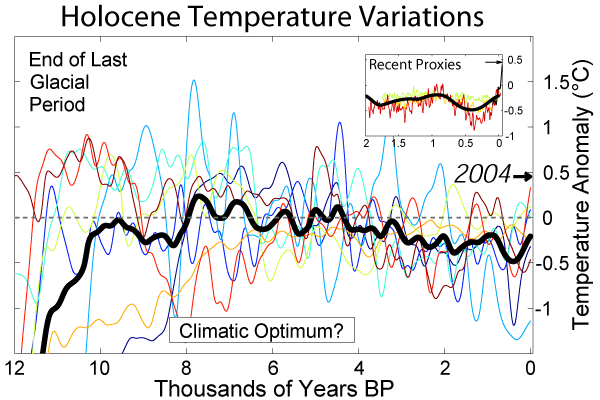
From what I read, global surface temperatures throughout the Holocene (the past ~10,000 years) have scarcely varied much +/- 0.5K from the mid 20th century average. See this chart, for instance:
This suggests that a change in excess of +/- 0.5K relative to mid 20th century average global surface temperatures may well be of some significance, despite it’s smallness on the absolute temperature scale.
The change in global surface temperatures since the mid 20th century now stands at about 0.9K (average linear change reported by GISS, HadCRUT and NCDC), which is substantially larger than any change seen in the averaged palaeo-data over the past 10,000 years. Clouds may well have acted to dampen warming since the mid 20th century, but it seems they have not been completely successful.
DWR54 May 9, 2018 at 8:50 am
First, 0.6C is ± 0.3C.
Second, the climate is a giant heat engine. It converts solar energy into work. To analyze such a system, you cannot work in °F or °C. You have to work in Kelvin.
Best regards,
w.
Thanks Willis.
Would you say though that using the absolute temperature scale, which ranges between 0- 288K, to assess the impact of variations on a system that rarely fluctuated by +/- 0.5K over 10,000 years was proportionate?
Also, your comment doesn’t really address the question of the observed 0.9K increase in temperature reported since the mid 20th century. This is far removed from the normal Holocene departure from average. Does your cloud theory account for this? Thanks.
With 288K being the upper limit of current global surface temperatures, I should have said.
DWR54 May 9, 2018 at 12:09 pm
Thanks, DW. The climate is a huge heat engine, which converts heat to work. As Bejan pointed out in Constructal and Climate:
When you analyze the stability of a heat engine, you can’t use °C or °F …
We have no idea what happened during the Holocene to this level of detail. Heck, we have maybe a dozen Holocene reconstructions that vary by more than that. In addition, just about all proxies going back that far have some level of integration, change their relationship with temperature over time, are often only sampled at 50-year or more intervals, and have uncertain temporal accuracy.
In short, we cannot say with any certainty what happened in the Holocene.
Next, the recent warming is not unusual even in the historical record, viz:
As to what causes slow drift in the thermally regulated climate, see my post below.
Best regards,
w.
Slow Drift in Thermoregulated Emergent Systems 2013-02-08
In my last post, “Emergent Climate Phenomena“, I gave a different paradigm for the climate. The current paradigm is that climate is a system in which temperature slavishly follows the changes in inputs. Under my paradigm, on the other hand, natural thermoregulatory systems constrain the temperature to vary within a…
Thanks again Wills,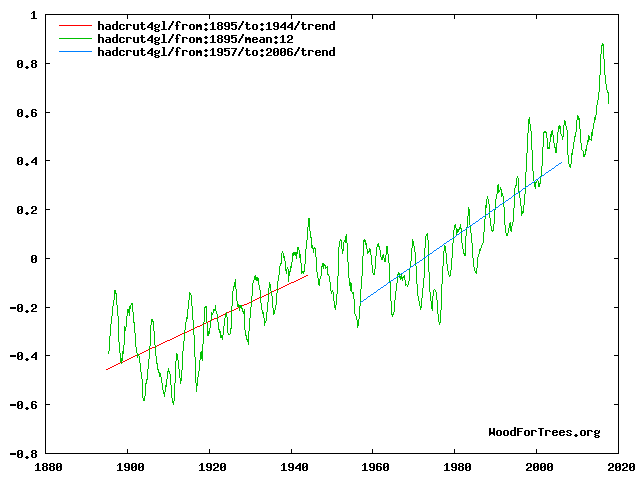
I should make it clear that I don’t dispute your observation regarding the use of the Kelvin scale in thermal engineering. Indeed it wasn’t your use of the Kelvin scale that I was questioning; rather it was your observation that the change in global surface temperature over the course of the 20th century amounted to variation of “only about a tenth of one percent” on the Kelvin scale of absolute temperatures.
Whilst that is technically true, it tends to downplay the potential significance of that change. Returning to the body temperature analogy, if this increases from my normal 98.5F to 100.5F, then on the Kelvin scale it has varied by a mere 0.3%. Whilst that may give me a pshycological boost, it’s unlikely to make me feel any better physically.
Regarding your HadCRUT charts that appear to show similar rates of increase for two 48 year periods, 1895-1943 and 1957-2005, in fact the early period’s rate of increase is 0.8C/dec, whereas in the latter period the rate of increase is 0.12C/dec; about 1/3 higher. The difference is more apparent once trend lines are added (chart below).
If we consider the period since the mid 20th century to the present, over 66 years in total, the trend of 0.12C/dec in HadCRUT4 continues. Does your cloud theory allow for such an extended period of sustained warming, or would you have expected that natural cloud activity would have intervened to dampen it before now? (Perhaps it has?)
Keep up the interesting posts.
DWR54 May 10, 2018 at 1:14 am Edit
Thanks, DW. I see I’m not making myself clear, so let me try again.
The issue is not whether temperature change X will be significant to humans. I make no judgment on that. Instead, the issue is, why is the temperature of the planet so stable?
Your example is perhaps unwittingly very revealing because as you point out, a corresponding change in human body temperature is a big issue … and you know why that is?
It is precisely because the temperature of the human body is thermally regulated … and me, I think the same is true about the planet. Human bodies, and our planet whose temperature is dependent on the vagaries of winds and clouds, don’t stay that remarkably stable under varying loads through luck or happenstance. Instead, both of them have strong thermoregulatory systems that keep them from varying much.
All the best,
w.
During interglacials, temperature varies by ~3.0 degrees C, ie +/- 1.5 degrees C, or more in hotter ones like the Eemian.
During the longer-lasting glacials, the range is much greater.
But our current Icehouse interval isn’t typical of most of the Phanerozoic Eon. Comparable episodes occurred during the Ordovician and Silurian Periods, and again during the Carboniferous and Permian. The latter glaciation endured much longer than has the Cenozoic Icehouse so far, which started about 34 Ma, with the buildup of ice sheets on Antarctica, then spread to the NH about 2.6 Ma.
Earth’s climate is indeed homeostatic, but can switch rapidly between Hothouse and Icehouse modes, in terms of geologic time. There should have been a Mesozoic Icehouse, but it was stillborn, given the general heat of the era and arrangement of continents. A Jurassic-Cretaceous cold snap did however encourage the development of feathers among dinosaurs.
How did a Jurassic-Cretaceous cold snap encourage the development of feathers among dinosaurs, exactly? I can understand that better insulated dinosaurs would indeed tend to survive better, but where did the information necessary to build feathers (a very complex structure) come from in the first place?
“Clouds may well have acted to dampen warming since the mid 20th century, but it seems they have not been completely successful.”
I’m not surprised as warming requires a reduction in cloud cover, especially tropical low cloud.
Willis -Excellent post. I’m surprised you did not calculate the actual correlation in figure 4, 5, 6 . My Mark II eyeball says its about.95, so obvious that it doesn’t need to be calculated. It would be good to see the formal correlation results with confidence level.
Interesting in figure 7, the albedo doesn’t respond the same in 2003 and 2015. Almost anticorrelated. There clearly are some other factors involved.
Willis,
You present a well told, intriguing tale of personal and professional enlightenment that leads to defining the primary convective and radiative heat transfer mechanisms modulating the equatorial pacific region. The intuitive reference frame shifts between a sun-based perspective of ‘cloudy’ planet Earth versus the on-the-beach view of daily thunderstorm development is one of those pattern-recognition-leaps that is unique to an observant and inductive/deductive mind.
This is exceptional work – a master piece of direct observation leading to insight, analyses, and revelation. Well Done!
Albedo also has a controlling and stabilising effect on ice age temperatures.
My paper on ice ages theorised that surface albedo controlls interglacial warming. More specifically the lowering albedo caused by ice sheets melting, was the primary feedback system that aided interglacial warming. While CO2 did not a lot.
This may explain the remarkably similar temperatures achieved in every interglacial. When ice sheets retreat to the very far north, there are no further significant albedo changes to warm the climate further. (Interglacials are never triggered by southern hemisphere warming, presumably because of the lack of continents and continental ice sheets there).
See: Modulation of Ice Ages by Dust and Albedo
P.S.
The differential warming in each hemisphere caused by precession can be seen in Willis’ other recent post, where the southern hemisphere is receiving greater summer insolation than the north. (See image below). Unless Willis has any other explanation, this difference is caused by precession favouring the southern hemisphere at present (the red plot-line). This is what I call a Great Winter (from a northerner’s perspective). The Great Years are much the same as normal years, except they last about 21,500 years, but climatically they are much the same, rotating through Great Springs, Summers, Autumns, and Winters.
However…
Like normal seasons, the precessional Great Seasons do not alter the total insolation incident with the Earth, they merely redistribute it. A Great (northern) Summer puts much more insolation into the northern polar regions, and much less into the south. And vice versa. Another complication is that in eras of low eccentricity, as now, there is only a small variation between Great Summer and Winter. Think of this eccentricity-difference as spring tides and neap tides – but this is a tidal system with a cycle of 400,000 years.
The other orbital cycle is obliquity, which has a 41,000 year cycle. This has a different result to precession, because eras of high obliquity take insolation from the equator and redistribute it equally to both poles.
Ralph
This was a joy to read. Willis has earned and achieved a mastery of the topic and a vindication of his intuition. It is such a great reminder that science can be a vibrant human endeavor, as opposed to the dominant dry, obtuse drudgery that masquerades so often as science. Also, sitting on a log to learn from a master beats the blind being led about by the blind on a campus run by poseurs.
@tty- Thanks. 1. So the slow change in insolation above 65dg changes the set point target for regulation.
2. An as for “a rapid decline to little ice age of 12 degrees C” there hasn’t been any. The decline from MWP to LIA was on the order of 1 degree grobally. Just what are you thinking of?
*The 12 is wrong. I had been looking at the German govt record from1760 to 2010 and the Dalton Min had several years with 2 dgC drops. The average was a drop from 7.5 C to
about 7.25 for 17 yrs.
So the rapid decline into a solar minimum cold spell is a rapid temporary change to the set point?
Sandy, Minister of Future
Sandy, do you have a link to the “German govt record from1760 to 2010”?
Willis, Minister of Curiosity
Germany uses absolute temperatures rather than anomalies in its reconstruction:
https://www.dwd.de/DE/klimaumwelt/klimaatlas/klimaatlas_node.html
Couldn’t find data going back to the Seven Years’ War (or World War of the 18th Century, in which Prussia, Britain, Portugal, Hanover, three other small German states and the Iroquois Confederacy beat France, the Holy Roman Empire, Russia, Spain, Sweden, the Mughal Empire, Bengal Sultanate and Abenaki Confederacy), however, only since the Second Reich.
Felix and Willis – here is name of chart …
Temperaturreihe_Deutschland,_Jahr,_30-10.
Not sure extension .jpg, . png etc.
Sandy, Minister of Future
This does contradict your comment on your previous post:
“El Nino is causing changes in the clouds, which decrease the local albedo and allow in more sun”
https://wattsupwiththat.com/2018/05/05/symmetry-and-balance/#comment-2808840
Great post.
A tiny nit: dust devils don’t move heat; they’re just the visible fingerprints of the rising masses of air that are actually transporting the heat — but that’s obviously what you meant. However is more analysis necessary to demonstrate what percentage of that heat makes it above the boundary layer and into the troposphere?
Thanks, Ted. Actually dust devils do move heat. What makes you think they don’t? And no, they are not simply “fingerprints of the rising masses of air”. Air masses are rising (and sinking) all the time without dust devils being involved.
See below for a further discussion.
w.
Dust In My Eyes 2014-02-13
I was thinking about “dust devils”, the little whirlwinds of dust that you see on a hot day, and they reminded me that we get dulled by familiarity with the wonders of our planet. Suppose, for example, you that “back in the olden days” your family lived for generations in…
Thank you for another fine essay.
About watching the clouds form in Fiji, I first noticed the regularity of cloud buildups in the Philippines and Taiwan, then later in mid-Missouri. I wonder if your posts only make sense to people who have systematically watched the phenomenon day after day in some place and season. An obvious question is: As long as the water is there (e.g. early summer in mid-America; tropical islands), won’t cloud cover of 65% (50%, 75%, etc) occur earlier in hotter mornings than cooler mornings? And if so, Isn’t that an obvious if seldom measured negative cloud feedback? You have systematically supplied a lot of information toward good answers to the questions.
Dr. Spencer says there’s nothing original about Willis’ observations and analysis of CERES data, and that had he reviewed the literature, he could have avoided reinventing the wheel.
http://www.drroyspencer.com/2013/10/citizen-scientist-willis-and-the-cloud-radiative-effect/
His response to Willis’ conclusions might be outdated by now, however. I haven’t followed the controversy, if that’s the right word.
In any case, such cloud and other feedbacks operate on the time scale of weather. They can’t account for climate change, unless the averages of cloud and other “emergent” phenomena changes on the scales of decades, centuries, millennia and longer time intervals. Which well might be the case. The tropic and temperate zones get squeezed geographically during glacial phases.
Felix:
You make two points and I write to refute each of them.
Firstly, you say,
“Dr. Spencer says there’s nothing original about Willis’ observations and analysis of CERES data, and that had he reviewed the literature, he could have avoided reinventing the wheel.”
Roy Spencer is mistaken about this
Some years ago he asserted that the mechanism postulated by Willis is the same as the hypothesis of Ramanathan and Collins (R&C) which they published in Nature in 1991. He refused to agree when I tried to explain to him that there is significant difference between the works of R&C and Willis Eschenbach; i.e.
(a) in their 1991 paper R&C postulated that cloud cover associated with thunderstorms provides the observed limit to maximum sea surface temperature in the tropical warm pool,
and
(b) Willis Eschenbach provides an hypothesis of the mechanism by which thunderstorms in the tropical warm pool react to temperature such that cloud cover acts as a negative feedback on sea surface temperature changes with the resulting phenomenon of the observed limit to maximum sea surface temperature,
Secondly, you also assert,
“In any case, such cloud and other feedbacks operate on the time scale of weather. They can’t account for climate change, unless the averages of cloud and other “emergent” phenomena changes on the scales of decades, centuries, millennia and longer time intervals. Which well might be the case. The tropic and temperate zones get squeezed geographically during glacial phases.”
No. Your assertions are wrong.
Willis is considering data obtained from the present climate state and what may – or may not – happen in other climate “phases” is not relevant to his analysis of climate behaviour in the “phase” which now wxists..
Climate is average weather by definition
(see the IPCC Glossary https://www.ipcc.ch/pdf/special-reports/srex/SREX-Annex_Glossary.pdf ) .
A change to the behaviour of weather phenomena alters the average weather; i.e. it changes climate.
Richard
richardscourtney May 10, 2018 at 7:16 am
Thanks, Richard. For those wondering what this is about, some five years ago Dr. Spencer, for whom I have the highest respect, went seriously off the rails when he accused me of not acknowledging Dr. Ramanathan. I pointed out to him that Dr. Ramanathan’s work was very different from mine, and I pointed out that when I discussed the area of Dr. Ramanthan’s work, I gave him full credit.
The whole story is described in my post linked to below. Sadly, the story continues to have credibility, in part because Dr. Spencer has never admitted that he was wrong … but he’s still one of my scientific heroes despite that, everyone makes mistakes.
Anyhow, Richard, I’m glad to find out that you tried to convince him he was wrong, I was unaware of that.
Best regards to all,
w.
Dr. Roy Spencer’s Ill Considered Comments on Citizen Science 2013-10-09
Over at Roy Spencer’s usually excellent blog, Roy has published what could be called a hatchet job on “citizen climate scientists” in general and me in particular. Now, Dr. Roy has long been a hero of mine, because of all his excellent scientific work … which is why his attack…
Very nice data, and an excellent article!
It’s been my view for a while that CO2 is effectively bypassed in the air column by the water cycle, and this confirms it. Warmth at the surface evaporates more water, converting the actual heat to latent heat of evaporation. The gaseous H2O then diffuses to the troposphere via Willis’ thunderstorms, condenses and re-releases the heat in the form of IR – which is radiated to space above about three quarters of the GHGs. So ECS is much lower than classic physical chemistry suggests it should be, because most of the CO2 never sees the IR, which is hidden in latent heat being physically transported to the top of the atmosphere.
I’m also interested by the very large W/m2 forcing anomaly data below Willis’ first graphic. It shows just how powerful cloud cover is in modulating energy flows. Only a small change in cloud cover therefore would have a large impact on global temperature.
Which is what we’ve been saying all along.
@Willis- The charts often show up here …
http://notrickszone.com/
This link wont load from thailand …
https://www.dwd.de/EN/Home/home_node.html
Sandy, Minister of Future
@Willis, Felix- I pasted the chart name in Google and guess what …
Sandy, Minister of Future
Vielen dank!
“Jupiter is blazing in the night sky, what a wonderful world we inhabit.”
==============
Just set up my 20-60X spotting scope on the tripod, it is easy to see 3 of the moons near the 1-2 o’clock position, fun.
Wow indeed! Those correlations look too good to be true! Excellent work.
People might find this article interesting – particularly in light of Willis wonderful result.
Why Do the Long-Term Periodicities in the ENSO Appear in the Flux Optical Depth Anomalies for Water Vapor in the Earth’s Atmosphere?
http://astroclimateconnection.blogspot.com.au/2010/03/why-do-long-term-periodicities-in-enso.html
The correlations presented are as expected but they do not offer any relevance to global temperature stability.
To have temperature regulation there must be a balance of heat in and heat out. This does not occur over any portion of a tropical ocean. All tropical oceans absorb more heat then they lose, year round. This image shows the net TOA radiation:
https://neo.sci.gsfc.nasa.gov/view.php?datasetId=CERES_NETFLUX_M&year=2017
Note that all tropical oceans are net heat absorbers.
Hence the thermostatic control works on a much wider geographical scale than just cloud cover of tropical oceans.
Heat absorbed in the tropics is transported through air and ocean circulations to higher latitudes where the oceans have net heat loss. Since the Southern Ocean Circulation began, following the opening of Drakes passage, the higher heat absorption of the Pacific has been redistributed into the Atlantic. That heat is transported through thermocline circulation. Hence sea ice growth and retreat plays an important role in the global heat distribution and the thermostatic control of surface temperature.
I speculate that the formation of sea ice at 271.2K is the basis of the prime thermostatic control of global temperature. The formation of ice in the atmosphere at 273C is likely a significant factor as well but that is more a local affect rather than the fine temperature control across the planet.
CERES data also confirms that loss of sea ice is a negative feedback with reduced ice cover increasing heat loss – the so-called iris effect. Recall the increased loss of sea ice extent in Antarctica following the 2015/2016 El Nino. The high heat content in the Coral Sea was transported down the east coast of Australia and into the Southern Ocean where its unusually high level caused the iris to open a little wider than average.
I am new to this and have not posted it here before. And this might have been well known but still not clear to me: the solar point of view in Fig-1 would be so for two short periods of a year, once in the Spring and once in the Fall depending on where you are NH/SH, when the earth’s equatorial plane cuts the sun. Is this correct?
If you separate the analysis in Fig-1 into 12 monthly average figures, do they look very differently?
This post is very interesting. Thanks!
Newbee513
I have a thought/question on cloud formation/direction of movement of emergent storm tracks such as thunderstorms and other ‘moving’ warm surface developments. This is a little OT and just something bouncing around my mind for the past several years so give a country boy a little slack in my vague presentation but beat me down if need be.
Storm tracks in general seem to follow surface heating with all other atmospheric, wind and pressure things being equal. US hurricanes often track along the eastern US seaboard over the gulf stream if they approach from much north of Cuba. On land in the US Thunderstorm development which ‘appears’ on radar seems to move while may actually be a continuous development of the storm following the ground/surface heat. That’s the vague thought. Better description as follows. My focus is on the effect of the heated surface as the cloud bank begins to cover the surface.
Anyway, is there an influence of the seemingly ‘doubling’ DWIR from the cloud added to the UWIR from the surface on a parcel of air? A vague explanation being that as the already developed storm cloud’s leading edge progresses over a previously sunny and hot ‘new’ surface would there be a period of time that the surface would be radiating from a hot surface (not yet cooled by clouds, convection, etc) while the overlapping cloud progression would be radiating downward creating an increased IR influence (from above and below) on the ‘air’ sandwiched in the leading edge of the cloud’s/storm’s progression/direction/movement as the surface emitted at a higher temp and the clouds horizontal progression heated it from above. Could this ‘super-heating’ of that air ‘pocket’ create increased uplift and energy into the leading edge of a storm and possibly cause the storm to move in that direction?
Not to confuse/blend land based storms with the sea which I’m doing now but I have watched several hurricanes over the gulf stream that tend to slow their northward progression (Sandy was a good example) and stall as the gulf stream was moving faster than the storm and thus fed warm water into the backside of the storm thus ‘confusing’ the hurricane’s natural progression northward into trying to follow the surface heat coming from the south. Sandy’s eye did just that and left the storm to the south and collapsed. Several other hurricanes just stalled/slowed for days in their ‘confusion’ as well.
If we are going to name hurricanes with human names and remember them like a porn queen, then I’m gonna give them the right to be ‘confused’ in a descriptive sense and not lose any sleep. 😉
Nice idea re “superheating” of leading edge of a storm over land! Solar heating of land mid-day in the lower latitudes is huge (consider desert or blacktop temperatures)! As the Stefan-Boltzmann law says total emission varies as the 4th-power of absolute temperature, the surface emission is huge! Only a portion (roughly 32%) of this is absorbed by greenhouse gases CO2 and water vapor, with the other 68% escaping as IR photons to outer space on a clear day (see MODTRAN spectrum available at https://en.wikipedia.org/wiki/Radiative_forcing ). If suddenly covered by clouds, which are made up of liquid droplets with emissivity approx. 0.98, nearly 100% of the IR photons emitted by the Earth’s surface will be absorbed. This will be followed by nearly 100% emission (in accord with Kirchhoff’s law that a good absorber is a good emitter), but some of the absorbed energy will be transferred by collision to the main molecules of the air, N2 and O2, which cannot and do not re-emit any significant amount of IR (the molecules have zero electric dipole moment). So for a short period of time, until the ground cools off due to blockage of the solar radiation, the air sandwiched between surface and cloud bottom might actually warm up more than on a clear day. Warm air expands, decreasing its density. A rotating Earth acts as a centrifuge, driving less dense material towards the poles (just as cream floats to the top of skim milk, in the opposite direction to gravity). The Coriolis force appears to deflect moving air parcels in the Northern Hemisphere to the right, explaining the path of tornadoes in the flat plains of Kansas, and hurricanes over land, as well as the Gulf Stream. Because of the high heat capacity of water, and the fact that it moves (unlike land), perhaps the extreme temperature rise is not as large for air over hot spots in the oceans, explaining any stalling of hurricanes whose motion in the centrifuge depends on DIFFERENCES in density.
rogertaguchi ——-> thanks for the reply.
The surface radiated IR hitting the cloud bottom would (I assume) warm that creating additional lift on the leading edge. Rinse and repeat. Is it significant?
Could the introduction of warm H20 entering a hurricane from ‘behind’ have an effect of slowing it down?
Allan MacRae May 9, 2018 at 3:57 am
I’ve said a number of times that using the integral is less than meaningful. I’ll go over it again.
First, an integral can take any slope, depending on what you take as your zero point. Here are three integrals of the sunspot data which differ ONLY in the value chosen as the zero point.
Pick a trend, and you can fit the sunspot integral to that trend
Second, integrals are very sensitive to their starting point. If you start when the variable is at a high value compared to your chosen zero point, the resulting curve will look totally different than if you start it at a low value compared to your zero point.
As a result, by a judicious choice of zero point and starting point you can fit a sunspot integral to lots of natural datasets … but that doesn’t mean a relationship actually exists.
Regards,
w.
Just saw this post, thank you Willis.
Don’t all three of your curves have the same starting point? Hard to tell without seeing the math. Looks to me like you are scaling them differently, but I do not understand what you are saying in this post.
In any case, I am open to better interpretations of what drives long-term Earth temperature – over centuries, not necessarily many thousands of years. Physically, the integral of solar activity makes sense, moderated by the PDO and AMO multi-decadal cycles. If not the Sun, then what? Proving it is another matter though.
As I stated above, I think we understand the sub-decadal ENSO cycle reasonably well.
Allan MacRae May 13, 2018 at 9:47 am
Hi, Allan. An integral of digital data is a cumulative sum. If we use raw sunspot numbers, they are all positive values, and some are fairly large. As a result, the integral will go almost vertical. Hang on … ok, here’s what that looks like …

Totally uninformative.Now, if we choose a different zero point (convert the sunspot number to an anomaly around some given number) we get curves like I showed above:
Actually, the title on that one is incorrect, it’s the integral (cumulative sum) from 1900 on. The middle one is an anomaly around the mean. As such, it starts and ends at zero. The other two use anomalies around numbers a bit below (top curve) and a bit above (bottom curve) the mean.
If this is not clear, please ask again.
w.
Fully understood now Willis. Thank you.
Couldn’t the cloud characteristics (top height, albedo etc) be a CONSEQUENCE of the temperature of the ocean rather than a CAUSE as implied here?
They are definitely a consequence of the temperature, they only occur when the temperature gets above a certain point. Sorry if that wasn’t clear.
w.