
Guest essay by Eric Worrall
The grumbling Bali Volcano Mount Agung has not erupted yet, but experts are already talking up the dramatic short term global cooling it will cause when it blows.
Bali volcano: Here’s why the Earth will get a little cooler after Mount Agung erupts
By Alle McMahon
Something very interesting will happen when Bali’s Mount Agung finally erupts: the Earth will become a little bit cooler.
Yep. It’s not exactly what you’d expect after a volcanic eruption, which will see molten lava spewed into the air.
But don’t get too excited, it will far from reverse the effects of global warming.
Here’s why:
Global temperatures dropped last time Agung erupted
Mount Agung last erupted in 1963 after laying dormant for decades.
When it erupted, experts said global atmospheric temperatures dropped by 0.1-0.4 degrees Celsius.
That might not sound like much, but it’s quite a significant drop when you consider the last ice age occurred when global temperatures were only 5C cooler than they are now.
…
But the effect didn’t last for long
According to Professor Arculus, that sulphuric acid haze can persist in the stratosphere for a few years, but eventually the droplets will drop back to Earth.
“They’re small enough that they can stay up there for a while … but eventually they get rained out,” he said.
And that’s why the temperature drop will far from cure global warming.
…
Last time Mount Agung erupted in 1963-4 just under 2000 people died. Indonesia is taking evacuation of the region around the volcano very seriously.
A few years? BS. Maybe 50 months.
Do you know how many months in a year?
if it were one, you would say ‘a year’
If it were two, you would say a ‘a couple of years’.
If it were six you would say a ‘half dozen years’
So ‘a few’ is 3,4, or 5 years.
Q.E.D.
Do you?
50/12 = 4.17 = A FEW . BS? Have another peanut , Dumbo.
A major eruption will make the GCM projections, which don’t have any volcanic input post 2000, more closely match observations with an eruption. MSM will over look that and say models are correct.
Guardian is already reporting “unprecedented seismic activity” in recent days despite the 1963 eruption being probably the second biggest of the 20th century.
This excuse to use their favourite word was that the Indonesians did not have any monitoring back then, so despite a rather obvious sign of activity throwing half the mountain into the air, the current activity is unprecedented.
Methinks peanut’s tongue is firmly in his cheek. Grow some antennae, folks.
You can almost feel the wishful thinking of those that know the Global Warming overheated meme is reaching its natural weather decline, and anything is welcome ? to assist them in a gentle retreat from the out on a limb potential for a fall from grace, when the cycle of weather makes inevitable changes and they cannot keep adjusting any more, as other scientists are watching, commenting here and on social media, exposing when data is corrupted for convenience. How inconvenient that they would want other people to suffer to shy off this meme, but then of course there are others that use disaster anywhere and any type to push their non science agenda.
Monkeys are fleeing the mountain. Other monkeys are making predictions.
The SMART ones are fleeing, the not so smart ones (other monkeys) are de-fleaing
I’ll believe it when monkeys fly out of the mountain’s arse.
I thought we’d already passed the runaway warming tipping point?
Did I mis-hear?
Which time? We’ve had so many tipping points in the past that I’ve lost track.
Almost a Ping-Pong action……. Sounds like normal climate behaviour to me…..
It has been extended another 5 – 15 years. The tipping point is always 5-15 years from now. That never changes.
The saga of Miller and the mountain has been ever thus. https://en.wikipedia.org/wiki/Millerism
Sort of like the time horizon for “practical nuclear fusion power generation”, which as been “about 20 years away” for the past 40 years.
We have passed the ice loss tipping point, according to [ahem] Peter Wadhams, “the world’s leading expert on sea ice” and author of “A Farewell To Ice”. He’s at it again, having been on Thom Hartmann’s radio show yesterday. The arctic will be ice free soon, Greenland’s ice sheet will disappear soon, and Antarctica is not far behind, according to Wadhams, no matter what humans do now. Oh, and we’re all gonna be sorry.
Is there any way at all to send someone like Peter Wadhams to Pangaea or Gondwanaland to let him know what real warming is like?
Just askin’.
One can only hope for the local population above all else, but also to disappoint the warmists, that the eruption is not as bad as feared and quickly subsides.
What number is this in the incredibly long list of epic fail excuses for none of the alleged death by heat rays we are supposed to have suffered over the last thirty years? I’ve lost count.
Who’s making excuses? There has been no eruption and no cooling. It’s just an ABC journalist speculating.
At least she didn’t refer to it as a holiday island, all too common in the Western media. It’s a real community with real issues, and I certainly hope an eruption doesn’t add to them. The 1963 eruption was bad, but just two years later came the anti-communist purge, which was even more destructive.
If you want to believe speculations, believe the one speculating a strong La Niña. Let’s see what it does to satellite measured global temperatures. I don’t want to use land-based temperature datasets because, you know, there seems to be a lot of adjusting go’in on.
Nick Stokes said:
“just two years later came the anti-communist purge, which was even more destructive.”
No Nick, you’ve got that one wrong too.
What is destructive is any Communist presence in any country.
You want destruction?
Talk to Pol Pot. Talk to Stalin. Talk to Mao Tse Tung. Talk to Kim Jong-un. Talk to the greens. Talk to anybody who has experienced the depravity of the Marxist dictatorships around the world.
Indonesia, as a result of the removal of the Communists, has developed into a free democratic vibrant society. A society that is free of the slaughter, the poverty, the secret police that infest all socialist /communist/Marxist dictatorships.
I’m surprised that you, who can at least use a computer, haven’t discovered that for yourself.
From the information I have read, Nick, in regards to the anti-communist purge in Indonesia it appears that there are some pretty horrible estimates in regards to loss of life. 500,000 people lost their lives and the PKI was wiped out. I can’t imagine what a heartbreaking and frightening time that was for all Indonesians.
Communism is such a horrible scourge. It destroys lives, destroys minds, destroys institutions and destroys families.
Of course, like any other cancer, digging it out of society is a devastating experience.
Really Nick? Bali is “a real community with real issues”, suffering from the aftereffects of a “destructive” anti-communist purge? Not just “a holiday island” as portrayed by evil Western media? We sure wouldn’t want those nasty media to help the Balinese by advertising their island as an attractive spot.
You are a talented contortionist. I hope you didn’t hurt yourself going through all that twisted logic.
Let’s try it with this filter instead: “After the successful purge of the communists, Bali enjoyed a time of peace and prosperity as a popular capitalist holiday destination. Then, the Muslims bombed the crap out of it, destroying the tourist industry and bringing hardship to many Balinese.”
To most leftists, the greatest crime in the world, is opposing communists.
Following this logic, the antihuman environmental protection logic tipping point will be one of their craziest zealot casting TNT into a caldera.
As long as he holds onto it as it flies we will be one loon less. BTW I doubt a human could heft enough TNT to cause an eruption. Even a truck bomb wouldn’t do it, but it certainly would make for some interesting press.
Now, if you mean tossing Turner Network Television into a caldera…I’m all for it.
All fine and good. Except there is no lack of warming.
Try living on planet Earth for a while.
That will be why my central heating is on then.
The only reason for me to wish for global cooling is to disarm environmentally insane mankind-haters progressively, sustainably and peacefully. Having a glance at US, UK and German elections, every minute counts, don’t you agree?
Turn your central heating down then Simon.
“there is no lack of warming”, but there is a shortage of warming.
I have a great business idea that should make any environmentalist happy. Set up a fund to supply Puerto Rico with wind turbines. All AGW fans are welcome to chip in. Oh wait! I forgot. Wind power increases as the cube of the wind’s velocity. What’s the cube of 125 mph?
What kind of brain falls for numbers this small…..0.1-0.4 degrees Celsius
No warming in 20 years except for the current, now fading El Nino.
I made this very point a few days ago on one of the usual blog sites (it might have been this one, but I am not sure).
Personally, I want to see what a La Nina and a quiet sun and a will do for temperatures in the coming 24 to 36 months. I do not wish to see the waters muddied by a volcano eruption.
In fact, i consider this to be especially important. If a La Nina develops, as forecast, at the end of this year/early 2018, it will mean that by the time AR6 is being written, the impacts of a La Nina should be appearing in the temperature data sets, and this will make the writing of AR6 far more difficult since (i) the pause may well have reappeared, but this time it will be nigh on 20 years in duration, and (ii) the discrepancy between model projection and observed temperature will become more of an issue since temperatures will once again be tracking around the bottom end of the confidence levels further supporting the recent claims that models are running too warm, and (iii) it will further confirm that ECS is set too high, and that both the higher end and the lower end should be reduced by at least 0.5degC..
It will mean that there will once more be some difficult issues for AR6 to explore, which were largely ignored in AR5, If the IPCC were to lower the range for Climate Sensitivity to say 1 to 4 degC (or better still 1 to 3.5degC), it would mean that all the models would have to be reworked.
Although it is probable that we will not know the position until around 2020, by the Summer of 2018, if there is a La Nina as presently forecast, we will have much more of an indication as to whether the strong El Nino of 2015/16 (which has bordered on being a double El Nino) produces only a short lived temperature spike, like that seen with the strong El Nino of 2010, or whether there will be a long lasting step change in temperature as was coincident upon the Super El Nino of 1997/98.
Interesting times lie ahead but a Volcano will throw a spanner in the works.
ot really a pause, but the gradual process of entering the next ice age, if we prefer the record of what actually happens to what catastophists invented their nasty divisive anti poor people pseudo science to enhance their own power and wealth.. The end of the “Northern” world is nigh, coming at a glacial rate to a country above the 50th pararallel. All infrastructure scraped off the face of the earth, slowly.
http://www.cleveland.com/weather/blog/index.ssf/2017/09/noaa_farmers_almanac_predictin.html
Isn’t it true that with a quiet sun there are more volcanic events? How about earthquakes? More or less?
Here is another excuse for the 1940s to early 1970s cooling, which changes/adjustments/homogenisation of the temperature record since 1980 have gradually been eroding and flattening off, and another excuse as to why Michael M@nn’s and Briffa’s tree rings showed that there was no net warming between 1940 and 1996, and hence the need to carry out Mike’s nature trick and splice on the highly adjusted thermometer record in MBH98.
It is good to know that the temperature reconstructions have such wide error margins that they cannot say whether temperatures dropped by 0.1degC or 0.4degC. That is a wide margin.
Best wishes to all who may be caught up in this incidence, and let us all hope for their sakes that the volcano does not erupt, or if it does then the eruption is only a small one.
I am probably being a little harsh. It does appear there was cooling coincident with the 1963 eruption, whether this cooling was caused by the eruption, or if the cooling episode was aided to by the eruption, and if so by how much, is of course moot, since we do not know sufficient about natural variation and what factors may have been at play in and around 1963 to 1966. Upon reflection, the Alle McMahon statement that the eruption brought about relatively short lived cooling in the range of 0.1 to 0.4degC is a reasonable view to hold.
1966 is a famous year for the English, since it is the one and only time that England have won the football world cup. Perhaps this victory was caused by the eruption and its aftermath. (sarc/)
The big unknown is the possible effect of a large blank shiny yellow orb, amid the noise it’ll be hard to see the signal.
Just looked at Hadcrut4 for 1883 when Krakatoa blew, doesn’t even register in the global average temperature anomoly. Was it the wrong type of volcano?
I once made that point to Willis. If I remember correctly the temperatures were falling one or two years earlier, and whatever caused that cooling in say 1881 may well still have been operative in 1883 to 1885.
As you know, the late 19th century warming was the period 1860 to 1880. It started cooling shortly thereafter, and prior to Krakatoa.
Wasn’t that Greg Goodman?
I think that there will be a warming spike approximately 1 year from now which will be linked to the heavy heavy rains which occurred in California and the Pacific Northwest last winter. The reason why I say that is it can be seen in the record that approximately 20 months after such heavy rains in the PNW it is typical to see such a spike in temps.
Richard, this comment was meant for your comment right below this.
Are you suggesting there was some forcing that was more powerful than Krakatoa?
Incidentally, one of the regular commentators on this site, holds the view that volcanoes cause short lived cooling, but lead to longer term warming. That there is a temperature bounce that exceeds the cooling.
I cannot remember the commentators name, but he often refers to data that has lead him to that conclusion. Probably, this can be found on one of articles by Willis where Willis discusses the impact of volcanoes. If I recall, my comment to Willis about Krakatoa, pre-dated the Volcano blog post by Willis, and was raised when natural variability or the sensitivity of thermometer records was being discussed on another article.
Hello Richard,
I cannot see evidence “that volcanoes cause short lived cooling, BUT lead to longer term warming” in the Lower Tropospheric (LT) data – see the plots below. Major volcanoes like El Chichon and Pinatubo caused ~0.4C to 0.5C of global cooling in the LT, with recovery taking up to ~4 years after the last eruption, but I see no evidence of subsequent warming in the LT after the recovery.
I did see a recent post that plotted stratospheric warming from a major volcano, and this makes sense – I assume the solar radiation to the LT is reduced by stratospheric aerosols and particulates, and then the heat
in the stratosphere dissipates into space. This conclusion is a guess because I have not studied this component.
Regards, Allan
[excerpt of previous post]
My simpler equation using only the Nino3.4 Index Anomaly is:
UAHLTcalc Global (Anom. in degC, ~four months later) = 0.20*Nino3.4IndexAnom + 0.15
Data: Nino3.4IndexAnom is at: http://www.cpc.ncep.noaa.gov/data/indices/sstoi.indices
It shows that much or all of the apparent warming since ~1982 is a natural recovery from the cooling impact of two major volcanoes – El Chichon and Pinatubo.
Here is the plot of my equation:
https://www.facebook.com/photo.php?fbid=1106756229401938&set=a.1012901982120697.1073741826.100002027142240&type=3&theater
I added the Sato Global Mean Optical Depth Index (h/t Bill Illis) to compensate for the cooling impact of major volcanoes, so the equation changes to:
UAHLTcalc Global (Anom. in degC, ~four months later) = 0.20*Nino3.4IndexAnom + 0.15 – 8*SatoGlobalMeanOpticalDepthIndex
The “Sato Index” is factored by about -8 and here is the result – the Orange calculated global temperature line follows the Red actual UAH global LT temperature line reasonably well, with one brief deviation at the time of the Pinatubo eruption.
Here is the plot of my new equation, with the “Sato” index:
https://www.facebook.com/photo.php?fbid=1443923555685202&set=a.1012901982120697.1073741826.100002027142240&type=3&theater
Regards, Allan
Don’t know about this, but can imagine the foundations for the conjecture. CACA greenhouse model planet Venus has 75 times more sulphur dioxide than it has water vapour.
Source NASA. https://nssdc.gsfc.nasa.gov/planetary/factsheet/venusfact.html
Correction 7.5 times more
Son of Mulder wrote:
“Allan, How do I determine which temperature record I should choose to make an observation? These temperature records are a fiasco!
I agree, especially wrt surface temperature records, which have limited credibility.
Post 1979:
Of the satellite records, UAH by John Christy and Roy Spencer is the most credible, imo: RSS is less credible.
Pre-1979:
Of the surface temperature records, I would use Hadcrut3, although all surface temperature records are “sketchy” due to highly irregular sampling intervals and frequent “adjustments”.
.
Nit-picky correction to ,y formula – it’s a timing thing:
UAHLTcalc Global (Anom. in degC) = 0.20*Nino3.4IndexAnom (four months earlier) + 0.15 – 8*SatoGlobalMeanOpticalDepthIndex
Son of mulder:
Try Hadcrut3:
Major Volcanoes Caused Global Cooling of ~0.4C to 0.6C
Krakatoa 1883+ vs Pinatubo 1991+
https://www.facebook.com/photo.php?fbid=1450244615053096&set=a.1012901982120697.1073741826.100002027142240&type=3&theater
See my point above about cooling started prior to Krakaoa.
http://woodfortrees.org/graph/hadcrut3gl/from:1881/to:1885
Hi Richard.
You wrote: ” See my point above about cooling started prior to Krakatoa.”
Agreed – also apparent in my graph – and a similar phenomenon occurred prior to the eruption of Pinatubo. Coincidence? Probably.
Still, it is probable that most of the global cooling post-1883 was due to Krakatoa – it was a huge volcano that erupted several times over a decade, finally settling down in late 1992.
Pinatubo only erupted for less than ~3 years.
Allan, How do I determine which temperature record I should choose to make an observation? These temperature records are a fiasco!
So it’s a case of
“Those who control the present, control the past and those who control the past control the future.”
I’m sure they’ll iron out their error in the past in Hadcrut 4 in the future Hadcrut 5.
Alan, is there any way at all to stretch those charts out into a more realistic timeframe? I know space is limited on a computer monitor screen but sometimes, the jaggedness of these charts makes the differences seem exaggerated, when they should not.
Thanks.
Hi Sara,
Not sure I understand your question. Hope this helps….
If you can access the raw data you can plot it in Excel at any scale. For example, see my 2008 paper here:
http://icecap.us/images/uploads/CO2vsTMacRaeFig5b.xls
WoodForTrees does not seem to have user-programmable controls for scale.
If you just want to stretch the x-axis, then snip the image from WoodForTrees, paste it into Outlook, Word or other, and then stretch it horizontally. The x-scale numbers will also stretch and may look too wide,
Best, Allan
I think that’s the real problem, Allen. The spikes or temperature differences are so compressed that they appear to be alarming. If the scale were much wider, they would flatten out. But that would require a very wide means of displaying them.
Sara wrote:
“The spikes or temperature differences are so compressed that they appear to be alarming.”
Perhaps, but we know that these temperature spikes are entirely natural, as explained here:
https://wattsupwiththat.com/2017/09/26/bali-volcano-the-latest-excuse-for-the-lack-of-warming/#comment-2620679
Since 1982 (and possibly earlier), multi-decadal changes in Global Lower Tropospheric Temperature are adequately explained by just two parameters, Nino3.4 temperatures four months prior, and the impact of MAJOR volcanoes as measured by the Sato Global Mean Optical Depth Index. Bill Illis did earlier and more comprehensive work on this subject.
My formula is:
UAHLTcalc Global (Anom. in degC) = 0.20*Nino3.4IndexAnom (four months earlier) + 0.15 – 8*SatoGlobalMeanOpticalDepthIndex
Dan Pangburn has modelled multi-century global temperature changes that he attributes to the integral of solar activity – I believe his approach is rational and credible. Dan’s model projects imminent global cooling due to reduced solar activity. This is consistent with a global cooling prediction that I published in 2002, to commence by about 2020-2030.
[My prediction record is excellent to date, so Bundle Up!] 🙂
I am confident that increasing atmospheric CO2 has an INsignificant impact on global temperature, and there is no real global warming crisis.
Furthermore, atmospheric CO2 is not alarmingly high, it is alarmingly low for the continued survival of terrestrial carbon-based life on this planet. The impacts of increasing atmospheric CO2, whatever the cause, are overwhelmingly positive for humanity and the environment.
Best personal regards, Allan
Pinatubo also caused a drop in temps which lasted about two years. And I believe there was a third one in Mexico but can’t recall the name…
Otter: El Chichon Mexico 1982+
https://wattsupwiththat.com/2017/09/24/240000-flee-imminent-bali-volcano-eruption/comment-page-1/#comment-2619546
Bill Illis wrote: “Mount Agung eruptions in March and April 1963 caused 0.3C to 0.4C temperature declines”
Sounds about right Bill – the Agung eruption of ~1963 was the biggest since Krakatoa in 1883+, about the same size as El Chichon in 1982 but smaller than Pinatubo in 1991.
This is based on “Global and Hemispheric Mean Aerosol Optical Depth at 550 nm” at
https://data.giss.nasa.gov/modelforce/strataer/tau.line_2012.12.txt
https://data.giss.nasa.gov/modelforce/strataer/
[NASA GISS data so not sure how good it is.]
If Agung has a major eruption like 1963, can we expect some global cooling, and will cooling primarily impact the Southern Hemisphere or the Northern Hemi as well?
Will Agung help push the Pacific further toward a La Nina?
This could be interesting…
https://wattsupwiththat.com/2017/09/24/240000-flee-imminent-bali-volcano-eruption/comment-page-1/#comment-2619751
Mount Agung is rumbling again.
https://data.giss.nasa.gov/modelforce/strataer/
https://www.facebook.com/photo.php?fbid=1449574658453425&set=a.1012901982120697.1073741826.100002027142240&type=3&theater
Hello moderator – when posts go into “awaiting moderation” they are degraded as follows:
1. Vertical spacing is lost.
2. Figures do not display – only the URL’s do.
Any way to fix this? (other than avoiding posts that require moderation)
Not that I’m aware of. I’m not sure whether it’s a moderation issue or a wordpress issue. I suspect the latter. sorry – Mod
Yep, Dr. Spencer used to label the cooling from the 1991 Mt. Pinatubo eruption on the UAH graph. He also wrote a very informative post on measuring the effect of the eruption on climate sensitivity.
http://www.drroyspencer.com/2010/06/
One of the interesting things about Pinatubo is what it suggests about Climate Sensitivity.
As you are aware, warmists would have one believe that the temperature is the sum of the forcings. Now warmist suggest that Pinatubo had a forcing (negative forcing) of 4W/m2. The strength of this forcing (forgetting its sign) is far higher than the forcing attributed to CO2, and is nearly as high as the combined forcing of CO2 and the claimed water feedback that accompanies a rise in CO2.
<b.So Pinatubo allows us to have a look at the effect of a forcing of 4 W/m2. Pinatubo produced a cooling of around 0.35 degC, which suggests that 4 W/m2 of forcing leads to 0.35Deg C of change in temperature. If that is the case, that would put Climate Sensitivity to CO2 and accompanying water feedback at around 0.5degC per doubling.
You got a problem with predictions?
No. Just Climate “science” predictions.
They tend to be inversely related to reality.
You got a problem with ridiculing ridiculous predictions?
Moi? I love predictions! Peter Wadhams’ predictions are some of my favorites. Did you know the Arctic has been ice-free since 2015? Must be true since “the world’s foremost expert on sea ice” so predicted in 2013.
The desperation of the climate glitterati is really starting to show.
Manic unproven claims abound
Unverified rants, Failed Paris agreements, Lies and deceit about Arctic sea ice.
Blaming Earthquakes and volcanoes.
They KNOW that a cooling period is coming, and they are desperate to lock the anti-CO2 scam in, with all its economic destruction, before it is well and truly busted by Mother Nature.
Well, then, Andy, start stocking your pantry and buy a freezer chest if you don’t have one, because you may need it in the future when warming doesn’t happen.
I’m being facetious, but at some point, you may have a chance to ask them why they didn’t see the ice sheets coming. Not that I want it to go quite that far.
If the Mt. Agung eruption is a big one and the predictions of the ENSO turning sharply negative come to pass:
http://notrickszone.com/wp-content/uploads/2017/09/ENSO-2017-Sept-forecast-768×661.png
It would seem the alarmists are in for a rough patch, and so are many of us in a more practical way.
Not to make light of the matter but if it does blow it will really muddy the waters, so-to-speak.
ENSO is currently neutral and sea surface temperatures (SSTs) have cooled in the central to eastern tropical Pacific since mid-winter. These SSTs are currently cooler than average but within the neutral range. Southern Oscillation Index (SOI) and trade winds, also remain at neutral levels. All international climate models suggest further cooling of the tropical Pacific Ocean is likely. Five of the eight models suggest SSTs will cool to La Niña thresholds by December 2017.”
Good luck then – to anybody – hoping to tease-out a real La Niña and/or any other natural – non volcanic – cooling in the event of any eruptions!
These large stratospheric eruptions only occur 4 to 6 times per century.
While Agung is stirring now and has produced one of these large eruptions in the recent past, the odds of it happening now are extremely, extremely small. 20 days of eruptions every 36500 days.
It is a good thing these large eruptions happen so rarely. Because they destroy 5% to 10% of the Ozone layer each time they happen. Then it takes 30 years or more for the Ozone to rebuild.
If they happen 4 to 6 times per century, then we always have 80% to 90% of the potential Ozone layer there. If they occurred twice as often, Earth would be a different planet.
Hi Bill.
Not sure what statistical point you’re trying to make here. As we’re now more or less 20% into this century then surely we are overdue one of these eruptions based on 4-6 per century?
No one yet knows the size or even if an eruption will occur. It’s only 80% certain at the moment according to the vulcanologists.
I guess I’m saying it might erupt but odds are it will not be a +20 km high stratospheric eruption which are the ones that cause the cooling and the Ozone destruction.
Bill,
Can you shed some light on the source of your claims? It was my impression that ozone had a short half-life even in the absence of photocatalytic destruction, and was being renewed constantly in the tropics.
Well, “DUH”, of course the earth will become a wee tiny bit cooler …… simply because a portion of the earth’s internal thermal (heat) energy will be, per se, ….. vented into outer space.
Both Regional and Global if the eruption is large enough. Particulates and sulfuric acid droplets are ejected high into the stratosphere and circle the globe over the equator.
UAH graph marking Mt. Pinatubo effect on global temp
http://www.drroyspencer.com/wp-content/uploads/UAH_LT_1979_thru_April_2015_v61.png
And? World oil prices dipped below $10 a barrel on 1/4/1986. Why isn’t it recorded on the graph? Oh, wait.
So askith: Forrest Gardener – September 26, 2017 at 4:24 am
I really don’t think that it is possible for temperatures to change or be changed uniformly” across a wide surface area …….. and for sure not across the surface of the earth.
RAH – September 26, 2017 at 4:38 am
And a similar UAH graph “marking” Mt. Pinatubo “cooling” effect on ocean surface water temperatures …… resulting in a “pause” of the 2 ppm yearly average increase in atmospheric CO2.
http://i1019.photobucket.com/albums/af315/SamC_40/1979-2013UAHsatelliteglobalaveragetemperatures.png
Yep, CO2 follows temps and basically always has. Not the other way around which is the premise upon which the whole of modern climate astrology is based.
Forrest Gardener – September 26, 2017 at 2:14 pm
Forrest G, in actuality, …… it matters not one (1) twit whether or not the observed “period” covers a “geological time frame” or a ”bi-yearly time frame”, …….. the increase/decrease in measured atmospheric CO2 ppm quantities always follows increase/decrease in earth’s average surface temperature.
And given the fact that the oceans cover 71% of the Earth’s surface, it is the temperature of the surface waters of the oceans (and lakes, rivers, etc.) that is the primary “driver” of both the bi-yearly and yearly ingassing/outgassing of atmospheric CO2 as denoted on this copy of a Keeling Curve Graph, to wit:
http://i1019.photobucket.com/albums/af315/SamC_40/keelingcurve.gif
Forrest G continues:
“YUP”, Forrest G, you above statement is correct. And likewise, each and every time you exhale (your breath) there is a small change in CO2 levels which has not followed temperatures.
And iffen you check the Mauna Loa CO2 Record you cannot find a “human signature” anywhere within the 59 years of recorded data that can be associated or correlated with anthropogenic CO2 emissions.
And iffen there no “human signature” to be found anywhere within the Record …… then it is silly and asinine to be blaming humans for increases in atmospheric CO2 ppm.
But given the nature of “religious beliefs”, ….. one can “pick n’ choose” what they want to blame on what.
Forrest Gardener – September 27, 2017 at 1:27 pm
Forrest G, I sure as hell wouldn’t know what said “human signature” would look like to you …… given the fact that it is pretty damn obvious that you are utterly ignorant of the definition of the word “signature” when used in discussions involving science …… or you are just acting like the typical SA lefty liberal lemming by asking such a question.
Forrest G, iffen you don’t have a clue what is meant by “human signature”, then it is pretty damn obvious that you were SIMPLY plagiarizing, paraphrasing or mimicking this “statement-of-fact” that you posted previously, to wit:
Forrest Gardener – September 26, 2017 at 2:14 pm
FG, please cite a reference to the “signature proof” evidence to justify the aforenoted claim of a “change in CO2 levels”.
Anyway, …….. here ya go, ……. increase your IQ by 0.0004%, to wit:
“DUH”, it’s a literal fact, …….. “Ignorance can be fixed, …. but stupidity is permanent”.
And it is a lefty liberal nurtured “thingy” when girly-men tout their silliness rather than admitting their mistakes and/or ignorance.
Forrest G, the per se “sawtooth” pattern of the Keeling Curve Graph represents the plotted “seasonal (bi-yearly) signature” of the ingassing/outgassing of an average 6 ppm of CO2 between the atmosphere and the ocean surface water.
And Forrest G, the per se “upward curve” pattern of the Keeling Curve Graph represents the plotted “yearly signature” of the outgassing of an average 2 ppm of CO2 from the ocean surface water into the atmosphere.
But, but, but, …… Forrest G, the is absolutely no CO2 outgassing patterns, points, curves, spikes or blobs on the Keeling Curve Graph or anywhere within the Mauna Loa CO2 Record that can be directly or indirectly associated with or attributed to anthropogenic activities during the past 60 years.
http://i1019.photobucket.com/albums/af315/SamC_40/keelingcurve.gif
“HA”, fer shur, a typical girly-man response.
Forrest G, the truth “hurts”, doesn’t it? And “sorry”, there is no “pain-pills” that will lessen the emotional “hurt” of a bruised ego.
Yup, yup, …… shur you did, shur you did, ……. I believe yuh, I believe yuh, ….. cause you would druther drink poison than to fib about what you actually say, think, believe, did or do.
Any attempts of “communicating politely” with badly nurtured adolescents and young millennials who truly believe they are one of the “sharpest-crayons-in-the-box” will only cause you frustration …. and only embolden their silly personal beliefs and actions, ……. because they perceive your “politeness” as being weakness.
End of discussion.
Gaia is so distressed by global warming she’s passing gas. Listen to her, people!
What would be interesting …. is if the trifecta of La Niña, low solar, and volcano, …. along with the coming flip of the AMO that I keep hearing about, results in a significant drop and thus phase shift down in temps such that even the adjustments will be incapable of covering up the natural impacts on global temperature.
Maybe the CO2 myth is about to be destroyed.
Many graph model projections show correct prediction 1993 temperature drop. Models no make accurate forecast but fit backtest to volcano. On graph, appear great forecast but time on out of sample data, forecast begin to depart from accuracy. Example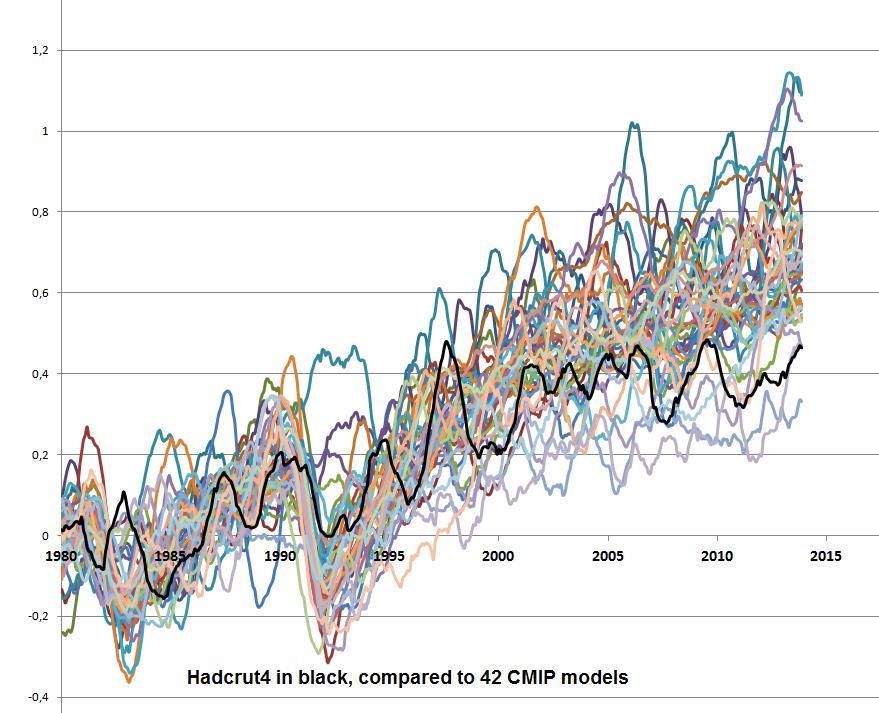
1993 no accurate. Backfit
“Models. Ugh. What are they good for? Absolutely nothing.”
Research grants are not nothing. They may, in fact, be the only thing.
It will be interesting to see what actually happens. If, God forbid, there is a major eruption, it will be another chance to use “aerosols” and SO2 to patch holes in the “CO2-is-responsible-for-temperature” models.
Back when the modelers admitted to cooling 1940-75, it was aerosols and sulfur dioxide that was blamed.
Tom Halla wrote:
“Back when the modelers admitted to cooling 1940-75, it was aerosols and sulfur dioxide that was blamed.”
True, but there was only one major volcano in the time period, Agung in 1963. The data was simply “cooked”- fabricated to force-fit the cooling.
The attribution was mostly to industrial SOx emissions, if I recall correctly, and other aerosols.
True Tom – but the alleged opacity of the atmosphere DID NOT EXIST!
Here is supporting correspondence with Douglas Hoyt dating back to 2006:
https://wattsupwiththat.com/2015/12/20/study-from-marvel-and-schmidt-examination-of-earths-recent-history-key-to-predicting-global-temperatures/comment-page-1/#comment-2103527
Warmunists love to latch on to volcanoes, because they believe it gives them wiggle room on ECS. To them, “carbon” is still in the driver’s seat, but sometimes it isn’t. Somehow, through the magic of CO2 heat, CO2 takes a backseat for a while. I guess it just gets tired, and needs some R & R for a while, perhaps hiding in the deep oceans which it really loves. What they don’t understand is that it actually undercuts their ECS claims.
If the volcano does erupt soon as anticipated, we are in the best ever position to monitor its effects via instrumentation. I do not expect big changes in the ENSO as a result, but changes of insolation should be measurable, as should albedo, ocean surface pH, ash deposition patterns, crop productivity… all sorts of things.
I think only the climate scientists will care, I think the world has moved on and worked out there are much bigger more immediate problems to deal with and we have decades to deal with AGW, assuming predictions prove true. The avoidance window is all but closed and I think an eruption and cooling would be the nail in the coffin. Really if AGW pans out mitigation is the only option that is going to work with world politics being what they are.
Now if it was the current US President that had just detonated an underground “super bomb” the Gruniad writer “experts” would be in full flight blaming him for shaking up Volcanic activity round the world along with social and fake media echoing the wailing and chest beating. Maybe they will settle for the more scientific “chaos theory” of the flapping of butterfly wings in some remote equatorial forest and blame him for that too – sarc/
There are conspiracy groups that would already be blaming him just google HAARP waves and enjoy 🙂
There are sections of the CAGW crowd already moving down that sort of crazy path connecting CAGW to Earthquakes and so because of the Presidents actions they will blame him.
So it probably isn’t sarcastic those of the true faith will have him firmly to blame.
A Gunung Agung eruption will be Trump’s fault. Mark it in advance.
If we have all this warming, with all these warmest years ever, why should the AGW sock-puppets of the UN elitists be worried, surely the adjusted temperatures will remove all cooling effects.
“Yep. It’s not exactly what you’d expect after a volcanic eruption, which will see molten lava spewed into the air.”
This is how scientifically illiterate the average person has become, when relatively well known and easily understood science ‘isn’t what you’d expect.’
“But don’t get too excited, it will far from reverse the effects of global warming.”
This guy is one of those science illiterates that has confused what is good and what is bad.
“the last ice age occurred when global temperatures were only 5C ”
And he removes all doubt when he expresses ignorance about the Earth currently being in an ice age, and the 5 C cooler is about half as cold as the glacial maximums.