Guest essay by Todd “Ike” Kiefer, Captain, U.S. Navy (retired)

Figure 1 – Symmetric Sigmoid (red) v. Classic Sigmoid (blue)
This piece is a response to the excellent discussion begun by Andy May on 17 Feb. I am in firm agreement with the substance of his essay, but would like to expand and explore a bit further. Dr. Marion King Hubbert did not fit a generic or Gaussian bell curve to his data plot of oil production numbers. Rather, his eponymous curve is a specific mathematical construct that emerges from his mathematical assumptions. I will show below why I believe that those assumptions and the curve are both wrong, and suggest a substitute curve and worldview for crude oil production.
The Math of the Hubbert Curve
There are dozens of different mathematical constructions that yield bell-shaped curves. The “Hubbert” or “Peak Oil” curve is actually a special case of a class of s-shaped functions called sigmoids. While most sigmoid functions begin and end at different values, Hubbert’s curve is constrained to begin and end at zero by the formula and boundary conditions imposed that represent a perfect mathematical translation of Hubbert’s worldview. The curve reflects a battle between two competing forces or trends – one for growth and one for contraction – where the balance shifts between the two along the way.
The curve is usually plotted as the annual quantity of oil produced on the vertical scale against the year of production on the horizontal scale. However, the math of the curve is best understood as a relationship between the rate of oil production (dQ/dt) and the cumulative quantity of oil so far produced (Q). This is because Hubbert derived the curve by assuming the forces that affect oil production were related to Q, not a function of the year of production. There are three variables that are adjustable to shape the curve: first is Q0 that starts the curve and is usually set to be zero in the year 1859 when the first commercial oil was produced in the USA; second is a rate scalar r that symmetrically adjusts the steepness of the rising and falling slopes; third is Qmax – the postulated maximum amount of oil which can ever be produced from the geographic area under consideration, and which corresponds to the area under the curve. By adjusting r and Qmax, Hubbert and others have been able to get a good fit to historical U.S. oil production through about 1990 with some significant caveats. Hubbert’s 1956 predicted production curve for USA based on his estimate of total recoverable reserves of 200 billion barrels is shown below. It is followed by a plot of his curve overlaid with actual historical production through 2015.

Figure 2 – Excerpt from Hubbert’s 1956 Paper (annotated)

Figure 3 – Hubbert’s Curve v. Historical U.S. Crude Oil Production
The formula for the rate of production dQ/dt shows the two trends that are competing with each other. First there is a term rQ that tries to increase production in linear proportion to how much oil has already been produced. This term essentially models a scenario where more oil production stimulates proportionally increased consumption, driving more producers to enter the oil business and drill more wells. Unchecked, this portion of the formula would cause the curve to grow exponentially. However, the check comes in the second term, 1- Q/Qmax, that applies brakes on the rate of production in proportion to how close Q approaches a pre-determined maximum value. The second term essentially models a scenario where there is a fixed amount of a resource in the ground and it becomes harder to find and extract as the balance remaining decreases. Qmax is the key assumption and guiding worldview of Hubbert’s approach and curve. The two terms work together to produce a symmetric sigmoid, where unconstrained growth dominates initially, but is eventually overtaken by insurmountable resistance, and production reaches zero as Q reaches Qmax. Hubbert’s curve is an elegantly simple model of more and more people looking for a scarcer and scarcer resource.
Limitations and Hidden Assumptions of Hubbert’s Worldview:
The Hubbert curve is appealing because of its simple logic and because of its close apparent fit with the data through the U.S. production peak in 1970. But is the math too simplistic? Indeed, there are three principal weaknesses that flow from questionable assumptions. First of these is the global assumption baked into Hubbert’s mathematics that the rules are largely fixed for the entire lifespan of production, and particularly the rule that oil is monotonically more difficult to extract with every barrel. To be fair, Hubbert did allow for some minor growth in reserves over time due to continued exploration and improving technology, and this is seen in the fattened post-peak tail of his curves as plotted in his 1956 paper. But he did not allow for the possibility that technological progress and evolving geophysical understanding might be great enough to actually reverse the overall trend of slowing production that was supposed to be inexorable beginning with the 1952 inflection point he saw in U.S. production data and built into the Hubbert Curve. Another key assumption made by Hubbert and continued by his disciples today is that scarcity is the one and only dominant force that shapes all actual oil production curves, both regional and global, with little credit given to other economic factors that are known to grossly affect other international commodities. Some of these other factors include producer competition, shifting market share, and substitution. Third, the Hubbert approach simplistically focuses only on production, with no separate consideration for the demand side of the economic equation. Whatever is produced is assumed to be readily consumed and thereby to maintain a constant economic pressure favoring increased production (i.e., keeping the rate coefficient r positive and stable).
In the real world, each of these assumptions has been invalidated. A host of technological and scientific innovations has dramatically recalibrated reserves, costs, and efficiencies for both terrestrial and offshore oil. Whole new realms of reserves have become accessible and economic, including terrestrial source rock and offshore pre-salt oil, upending long-held geologic assumptions. As oil production has continued beyond the 1970 U.S. peak, neither the U.S. curve nor the global curve has cooperated in following the mathematical predictions. Instead, U.S. production has waxed and waned and waxed again dramatically reflecting how, like all commodities, oil production remains responsive to factors which have always affected competitiveness and market share such as government policy and regulation, capital investment cycles, and economic boom and bust cycles. Hubbert’s initial prediction in 1956 was that U.S. oil production would peak between 1962 to 1967 at no more than 3 billion barrels per year (8.2 Mbpd) based on 200 billion barrels of ultimately recoverable oil. His global prediction was for production to peak in 2000 at 12.5 billion barrels per year (34.2 Mbpd) based on 1.25 trillion barrels of ultimately recoverable oil. Instead the USA has now twice peaked at 3.5 million barrels per year (9.5 Mbpd). Global production has already exceeded Hubbert’s estimate of ultimately recoverable oil, and proved reserves have been growing faster than production since 1980. Global crude oil production is already 150% of his predicted peak production rate, yet refuses to peak, and continuing to refute Peak Oil doomsayers. Apologists have tried to excuse Hubbert’s poor fit with U.S. production data after 1970 by saying he could not have anticipated Alaskan oil. But he probably also could not have anticipated the fact that the oil-saturated California coast would soon be virtually barred from oil production, and this knowledge would have reduced his production estimates. Another contrived effort to redeem Hubbert’s prediction consists of ignoring all production that falls outside a recently invented narrow categorization of “conventional oil” comprising only heavy crude produced by terrestrial vertical rigs from classic geological traps. Peak Oil theory is thus supposedly excused from failing to address the flood of new light-sweet crude being produced by directional and horizontal wells from terrestrial source rock and ultra-deep offshore reservoirs. Earlier generations of oil producers would have categorized “conventional oil” differently as the years marched on as only oil collected from surface ponds and pits, or only oil produced from human-drilled wells less than 100 feet deep, or only oil from east of the Mississippi river, etc. Even using this specious category of “conventional oil,” there is no evidence of a peak or cliff in global crude production, but rather continued responsiveness to capital investment. So obvious has been the absence of the predicted scarcity that many governments and activist organizations are now frantically trying to figure out how to pile on new regulatory and tax burdens to keep oil production and consumption from accelerating further. Concern about scarcity has been replaced by concern about how to “keep it in the ground.”

Figure 4 – Global Peak Oil Predictions
A New Curve
Rather than trying to patch up the Hubbert theory, it is past time to reconsider the assumptions and choose a better curve. The better curve is the classic sigmoid, also known as the logistics curve. The logistics curve is one of the most ubiquitous naturally-occurring mathematical forms in science and nature, empirically emerging as titration curves in chemistry, population growth curves in biology and demographics, and market penetration curves in economics, to name but a few. The math of the logistics curve is very similar to the Hubbert curve, but it substitutes P (the rate of production) for Q (the quantity of production), where P = dQ/dt. In other words, the logistic function has the appearance of the integral of the symmetric sigmoid, and where Hubbert’s curve was limited in maximum quantity of production, the logistic function is limited in maximum rate of production. So the first term in the logistics equation produces exponential growth in the rate of production, and the second term sets a maximum boundary on the rate of production. Instead of total oil production being limited by Qmax, oil production rate is limited to Pmax, which in logistics terminology is known as a carrying capacity. Such natural limits to growth often appear in complex systems with many interdependent variables. Real-word systems tend to display self-constrained behavior like this from internal negative feedbacks that prevent disastrous overshoots, rather than running away like many overly simplistic human models (e.g., actual climate v. climate GCMs).
Below is a logistics curve fit I did in 2012 for U.S. oil production data available at that time. I have since updated the data through 2015, but have had no need to adjust the curve. The logistics curve best fit to empirically match the data revealed a natural plateau for U.S. production of about 3.5 billion barrels per year (9.5 Mbpd). A positive and premature spike to that level in the early 1970s was explainable by a set of special circumstances including a surge in Vietnam, the Apollo program, record cold winters, and the oil embargo. Alaska oil production, rather than being an anomaly, actually appeared to be a natural progression that fit the curve perfectly. A major break with the curve occurred in 1986, which was a year when the global oil market belatedly recognized a glut of overproduction, and prices collapsed for a period that would last 17 years until 2003. U.S. oil, made uncompetitively expensive by the world’s most restrictive drilling policies and environmental regulations, could not compete, and market share quickly dwindled even as global production and consumption continued to rise. Another contributor was the fact that U.S. oil majors since 1950 had been making the bulk of their capital investment in exploration and production overseas in Saudi Arabia, Venezuela, Nigeria, etc., with most domestic spending limited to refineries. These E&P investments continued to pay off handsomely in increased oil production overseas, but this was accounted as imported crude oil when fed to domestic refineries. Thus the dip in the curve is more about a limitation in data accounting – there is no EIA data tag to demark oil production that is the fruit of U.S. foreign investment. However, there was a coming revolution in domestic production that would indeed show up in the data.

Figure 5 – Kiefer Curve
Based on 3 previous boom and bust cycles in global production in the 20th century, it was clear that it was only a matter of time before the march of U.S. technology would improve oil exploration and production efficiency enough to again make U.S. domestic production competitive and recapture market share. In fact, this was already well underway in the form of a massive wave of capital investment by the world’s remaining privately held oil and gas companies benefiting from the rising prices accompanying another cycle of perceived scarcity that had arrived in 2003. As had happened many times before in its history, panic about the end of oil helped create profit margins that financed the investments that renewed the supply. By 2006, all of the technologies that enabled the fracking revolution were already fielded (3-D seismology, directional and horizontal drilling, sophisticated bore-head sensors and real-time telemetry, bore cementing and sequential perforation, hydraulic fracturing, advanced drilling fluids and proppant, etc.). Additionally, the first commercially successful ultra-deep “pre-salt” offshore well in the Gulf of Mexico was drilled in 1993, and by 2007 similar wells were being drilled off Brazil, ushering in another revolution of less notoriety but likely equal import with fracking that has yet to really make itself felt. Both of these revolutions depend upon specific technology and expertise for which the USA is unsurpassed. The stage was set by 2010 for U.S. oil production to come roaring back. The trend lines in 2012 indicated that U.S. production would reach the logistic curve carrying capacity of 9.5 Mbpd sometime before the summer of 2016. In January of 2014 I specifically predicted a price collapse to $50-$60 bbl approaching this natural limit. According to EIA data after the fact, U.S. crude oil production hit 9.0 Mbpd in September 2014 and peaked at 9.6 Mbpd in April of 2015. WTI Cushing spot price peaked at $108/bbl in June of 2014 before beginning the plunge that would see prices below $50/bbl by January 2016. Current U.S. production is stable at 8.8 Mbpd. I expect to see U.S. production remain somewhat south of the 9.5 Mbpd limit, though not dip as low as it did following the 1986 glut. This is because most global oil companies have now been nationalized and foreign innovation and technology migration is thus slower today, allowing the USA to maintain a more enduring competitive advantage and preserve more market share. Private land and mineral rights ownership is also key to the economics of oil and gas, and this almost exclusively favors the USA as well. I don’t believe perceived scarcity will again come into play to significantly boost prices for well beyond a decade. Of course the global market is always susceptible to short-term spikes from geopolitical crises.
The Global Carrying Capacity for Crude Oil
We have already seen that Hubbert’s prediction for U.S. oil production was pessimistic and completely failed to predict our current condition. His prediction for global production was equally flawed.

Figure 6 – Hubbert’s Global Oil Prediction
According to Hubbert’s prediction, 2017 global crude oil production should be 12 billion bbl/yr and falling irretrievably. Instead it is over 30 billion bbl/yr and climbing steadily. And while oil is now being more properly priced as a premium transportation fuel and industrial feedstock rather than as a bulk combustion fuel, there is still an unquenchable thirst for this commodity in the developing world representing a huge latent demand. Applying the same logistics curve fit technique to global production data is illuminating.

Figure 7 – Kiefer’s Global Oil Prediction
If trustworthy, this logistic curve shows that global production and consumption are only halfway to the natural plateau. You can see in the figure some reasons for why progress may have departed from the ideal curve to a more linear path of growth. I primarily believe this is due to a breakdown in international markets since the world transitioned to a pure fiat currency system and governments have universally abused this to incur crippling levels of debt. The fiscal economy of the entire globe is way over-leveraged and is operating with a huge drag on it. All ability to fiscally stimulate economies has been exhausted by the central banks. The only way out now is for a massive influx of cheap energy to cause a surge in the creation of goods and services that will elevate the real GWP to catch up with the global money supply, and thereby reduce the leverage. Right now, the USA seems to be uniquely positioned to benefit from the cheap energy revolution of fracking, while pre-salt hydrocarbons may be more globally accessible.
Nevertheless, continued growth in global production toward the predicted carrying capacity is indeed my prediction – one which will not bring much comfort to those who demonize CO2 and think the Earth is on the knife edge of climate catastrophe. I’m not sure which nations will be contributing which fractions to this production peak, but I believe it will come to pass. Even if we built 2 MW of nuclear plant every week for the next 50 years, we would not displace the need for this transportation energy, particularly for air and sea travel, when the growing demand of developing nations is considered. Fortunately, fossil fuel energy has proven an excellent resource for helping civilizations cope with a host of threats. Hydrocarbons excel at reducing human exposure to and harm from severe weather, and in making crops much more fruitful and far less dependent upon the vagaries of nature. Climate change adaptation and mitigation would appear to be the only reasonable strategy going forward, as it has been for all of human history.
Finite v. Sustainable
If the logistic curve is indeed the better fit than the Hubbert curve, what does that tell us about the underlying commodity and the forces shaping its production? The essential difference between the two curves is that a Hubbert curve describes a finite resource whose production is being observably choked down by scarcity, while a logistics curve describes a sustainable resource who production is stabilized by potentially a host of factors. The question of finite v. sustainable is really were the prevailing worldview is most challenged. For oil to appear to be a resource that can be sustainably consumed, there are two possibilities. First is the possibility that the amount of ultimately producible oil is very, very large compared to its stabilized consumption rates, and essentially dwarfs demand, so that true scarcity is not a factor. A second possibility is that oil is indeed a renewable resource, and that the geologic processes that created the oil already extracted are still at work creating more at a significant rate compared to consumption. A combination of these two is also possible. David Middleton recently submitted an excellent guest post on what is known and theorized about the thermogenic processes that produce oil. He makes a point about how much reservoir quality sedimentary rock there is in the oil and gas zones of the Earth’s crust. The amount is so vast that every 10 ppm of its volume can hold a trillion barrels of oil, though we really don’t know how much of it is charged with oil. Pre-existing oil may be enough to sustain the logistics curve for generations, or for millennia. Additionally, there is every indication that kerogen continues to be cooked into crude oil and gas according to ancient processes. He also acknowledges abiotic methane production, though he does not believe it oligomerizes to become long-chain hydrocarbons and thus contribute to the oil supply. He holds firmly to the dominant view that crude oil is produced from biological feedstock such as ancient buried bacterial and plankton. One need not take sides in biogenic-abiotic debate to still accept the evidence that oil is behaving more like a sustainable resource than a finite one.
There are other reasons why I hold to the sustainable oil view, including my own research and analysis of fossil fuel energy return on investment (EROI) and oil production versus drilling effort. An essential part of this analysis that many get wrong is to ignore the often lengthy delay between oil industry capital investment and ROI. During the crisis window of perceived scarcity, there is much capital investment and negative cashflow as a flurry of wildcatters chase prospects. Once the glut is recognized, the capital investment dries up and there begins a lean period of low prices which includes a painful battle for market share and brutal consolidations, as most of the wildcatters fold up and are absorbed by larger companies with more fat to live on. Then finally comes a long period of steady, profitable production from reserves that seem to miraculously grow and grow without much further investment – this is the payback period that is usually ignored because the crisis is long past. Any ROI or EROI analysis that does not include the full bust-and-boom cycle will yield false results. When the accordion-effect lag between capital investment and ROI is properly considered, U.S. oil production EROI has remained above 10:1 for its entire commercial history. Oil yields today are still about 40 barrels per foot drilled, the same as in the mid 1980s. If scarcity starts to rear its head as an emerging force in shaping oil production, we should first see it in falling EROI and yields per foot. I don’t yet see that signature.
Captain Todd “Ike” Kiefer, USN (ret.) is director of government relations and economic development for East Mississippi Electric Power Association and president of North Lauderdale Water Association. His career in public utilities follows 25 years as a naval officer and aviator. He has degrees in physics, strategy, and military history, and diverse military experience that spans airborne electronic warfare, nuclear submarines, operational flight test, particle accelerators, Pentagon Joint Staff strategic planning, and war college faculty. Deployed eight times to the Middle East and Southwest Asia, he spent 22 months on the ground in Iraq and Commanded Al Asad Air Base and Training Squadron NINE. Author of several published papers on energy and energy security.
interesting modeling. Seeing as how most predictions were wrong, this is a fair exposition on why they were wrong.
Reading this and some other articles made me wonder about predictions:
Are there any (not obvioulsy frivolous):
(i) optimistic predictions that didn’t come true? I struggle to think of well-known optimistic predictions anyway; or
(ii) pessimistic predictions that did come true?
Todd “Ike” Kiefer Encourage reviewing the literature. See ref below that the Hubbert curve is a logistic function. and comparative reviews etc.
I have reviewed a great deal of the literature, thank you. I have corresponded directly with Laherrere and Charles Hall and Nate Hagens and others over the years. I am a proponent of the school of biophysical economics which includes many peak oilers, though I am not one. However, math is not fungible to fit worldviews. A logistics curve is not a symmetric sigmoid. I have explained the math above. The first is limited by capacity, the second by quantity. In fact, a logistics curve is the integral of a symmetric sigmoid. This distinction is of fundamental importance and cannot be glossed over.
About 7 years ago I was talking to a fervent warmist who said “In 5 years we will hit peak oil.”
5 years went by and of course peak oil didn’t happen. Instead, oil production skyrocketed. But what strikes me is that most warmists believe (or pretend to believe) in the peak oil nonsense. So they say that curtailing fossil fuel use makes sense even if the climate change theory is complete fabricated garbage.
But peak oil is nonsense, and in addition in the near future our technology will progress toward developing non-carbon based forms of energy. So it makes sense: use oil now when our economies and our very lives depend upon it, and as the future unfolds we will naturally move to other forms of energy.
What doesn’t make sense, at all, is the US and the West decapitating themselves on energy while “third world” China, our probable military foe, is given free reign to expand its fossil fuel use through the roof. It’s the self-loathing suicidal lunacy of the the left:

Any extension of the Hubbert Peak Oil curve is OBVIOUSLY owed to the increasing number of electric cars on the road … Elon Musk, the smartest man in the whole world, told me so. And Elon told me that OIL would last FOREVER … if we just elected “green” politicians who continue to line his pockets with green.
Woof!
If you trust Elon Musk you’re barking up the wrong tree.
Well Kenji,
Elon Musk is flying off to Mars to look for more non-oil electricity supplies. It is there somewhere on Mars stored in whacking great big batteries.
So just grab a bowl of Alpo, and calm down. It’ll all come out in the wash. Trust me; I know these things.
g
The public does not purchase crude oil to burn in their vehicles, boats and aircraft, they purchase highly technical refined fuel products. This is primarily an economic activity. Nobody purchases fuel to have, they purchase fuel to use as a means to other ends, like driving to work or moving goods. As such all aspects of oil production are subject to rational economic calculations. It is also subject to adaption and substitution.
These fuels could be made by refining any feedstock containing hydrocarbons. That is where “biofuels” come from. But at present it is far more economical to use crude oil as the feedstock. The instant that coal or methane hydrates cost less is the moment when those feedstocks will start to be used in quantity.
I say this to show that the statistics and projections in the article cannot be divorced from the totality of the economic calculation that the users of the end product are continually making. The earth is literally awash in hydrocarbons. The only question is the total cost of their use. I fully realize that part of that cost should be the subjective cost to the environment.
The issue of “sustainability” is fraught with who gets to decide when we are running out especially when that person is ignorant of or hostile to the power and function of the free market. And what does sustainability rally mean when we have almost infinite energy available by extracting uranium from seawater or using abundant nuclear fuels like thorium? In light of the fact that a mere one gram of matter has the same amount of energy in it as 695,000 US gallons of automotive gasoline has.
In my experience, when someone on the left lists “sustainability” as his first reason to justify any proposal, he is far more interested in how well it will expand government, reduce liberty and suppress prosperity than any other factor.
It is not possible that biofuels could ever replace current crude derived liquid transportation fuels. See essays Salvation by Swamp and Bugs, Roots, Biofuels for the detailed analysis.
Biofuels could not, basically not enough land Solar could do it, or at least would not run up against lack of land as the limiting step.
Never say never. It would be interesting to produce a heavily modified plant for biofuel rather than using things like corn, And then use hydroponics in multi-level buildings to grow it. Get the plant to put all of its efforts into the parts you want for the fuel rather than all that frivolous other stuff!
Biofuels are a thermodynamic dead end. The “heavily modified” plants that Tim Hammond theorizes below are already tried. They are the hundreds of strains of algae that have been worked in lab and field for over 80 years and were chosen expressly because they don’t have to grow roots or stems or leaves, but put all their biosynthesis energy into the minimal organs necessary to survive and reproduce in the most favorable conditions possible, being awash in nutrients and protected from predators. Even so, the maximum theoretical yield of biodiesel (crudely processed triglycerides not remotely close to real diesel fuel) is only 6.5 watt/m2 of land covered by ponds or bioreactors. This yield is what we get today from the cheapest solar panels, without the need for massive perpetual inputs of water, ammonia, phosphate and pumping energy that algae require. This link that was in my post above discusses biofuels in depth (http://wici.ca/new/resources/occasional-papers/#no.4 )
Solar would never come close to providing enough power. Even if we were to cover every square inch of the planet, including the oceans, it still wouldn’t be enough.
You are correct, Todd. Algae yield more usable oil per square meter of production facility than any of the dirt-based crops. They also consume the nutrient pollutants that wash into waterbodies, altering their ecology. So why don’t we have many algae projects working? They don’t pay.
MarkW could you show your workings please? I have seen many analyses that show a relatively small area could provide all our energy needs in principle. Your assertion is totally contrary to these, so I would be interested to see how you came to such a controversial conclusion. If you don’ know the numbers yourself a reference or link would do.
I largely agree. Sustainability s used to constrain businesses, to prevent growth and to increase the power and scope of the state. There is no economic or even environmental justification for it as a guiding principle.
Is there a way to transform all of that one gram of matter into 695,000 US gallons of automotive gasoline.
I can use the 695,000 US gallons of automotive gasoline as is; I can even put it in my car.
I have no use whatsoever for the one gram of matter that has built up on my four spark plugs.
G
Now if you had one gram of anti-matter as well, you could really make a big bang.
Good choice of words – “feedstock.” Great idea to take land for food and turn it into “feedstock” for the replacement of a different feed stock that doesn’t take food off the table. I like that depopulating logic. Do you intend to give up eating so someone else can drive to work? It would probably benefit the world in the long run.
Peak oil was never about scarcity, just cost of production versus alternatives.
oil cannot be sustainable: there is not an infinite resource.
Nuclear power at 2MW/week is peanuts. with a typical power station at 4GW and an individual country being fully capable of building three power stations a year that/s 12GW/year or ~30MW a DAY.
At some point oil will be replaced – as it already is – in applications where cheaper alternatives exist. Natural gas displaces it for domestic heating and electricity generation.Nuclear power will displace natural gas in turn.
in the UK peak coal was around WW2: we didn’t run out, it just wasn’t worth digging what was left.
North sea reserves of conventional oil and gas have peaked. Fracking may release more reserves, but they are not infinite either.
Modern data does not disprove either Malthus or Hubbert. Merely adjusts the time scales. With any finite resource, production must eventually decline: Its just a matter of time….
Yes. The timing does matter, though.
“..oil cannot be sustainable: there is not an infinite resource….”
Only nothing is infinite.
“Only nothing is infinite.
What about stupidity?
“Only nothing is infinite.”
What about ignorance?
Two points if I may, Leo: Your comments re displacement may be true for some applications of these fuels, but by no means all – e.g. nuclear cannot replace hydrocarbons for producing plastics, or replace coal for producing a host of valuable chemicals from say coal tar. Was this oversight accidental? And AFAIK there is still scientific disagreement about how oil and gas are created, leaving open the possibility that they may both be perpetual resources (like trees!) if harvested sustainably. Maybe I’m just an optimist, but at my age (nearly 70) I think I can afford to be.
There is also disagreement regarding whether the moon landings were faked. Just because there is disagreement is not evidence that all sides in the disagreement have a scientific leg to stand on.
That depends on where it adjusts the timescales to.
If it adjusts the timescales so as there will, near certainly, be another technological change that once again adjusts the timescales…
Then Malthus and Hubbert are near certainly wrong.
So far, after about 300 years fo data, it looks like that is the case.
1. “Peak oil was never about scarcity.” I cannot speak to what individuals might be thinking in their mental models or rationales for peak oil, but I can definitively speak to what was in Hubbert’s 1956 paper and what is in the math of his curve. This post discusses the math, and it is purely descriptive of the supply side of oil as limited by scarcity. Scarcity is the explicit variable Qmax. You cannot generate a Hubbert curve without first locking in a value for Qmax, and once you lock it in, the curve is static, with no mechanism to be influenced by changes in demand or price, which are both essential elements of all economic theory.
2. “2MW/week is peanuts.” You are correct. Thank you for catching this typo. I have been working with solar generation of late and have MW on the brain. Of course GW are appropriate for nuclear and other thermal generation. Current global total electricity consumption averages 2,200 GW and total primary energy consumption averages 17,000 GW. By the year 2100, when the UN predicts the human population will peak at 11 billion, 17,000 GW is my projection for just the electricity portion of global energy consumption. This is equivalent to 25 billion tons of coal per year, not counting thermal efficiency losses in conversion). To get there requires adding 3.4 GW of additional new generation every week for 83 years, and more if any existing plants are retired. Even if all of this were nuclear, there would be huge annual CO2 emissions associated with the building of these plants. You don’t even want to do the math on how much environmental destruction would have to occur if we tried to cover this demand with solar at 12 W/m2 or wind at 2 W/m2 (double today’s power densities for these technologies at utility scale).
3. “we didn’t run out [of coal]”. There is a common quip that “the stone age didn’t end because we ran out of stones.” Well, the truth is, the stone age didn’t end. We today use far more stone than at any other time in history. Stone is quarried by the millions of metric tons per year for use as aggregate in concrete, the modern world’s single most ubiquitous construction material. Of course, almost every material used in modern life including oil begins as a mineral we dig out of rocks in the ground. Ages do not displace each other. Each new age is simply overlaid upon the pre-existing ones as new technology improves the quality of life. The stone age still exists, but has been overlaid by the iron age, the coal age, the oil age, and the atomic age. The agricultural age still exists, but has been overlaid by the industrial age, the information age, and the space age. Globally, coal is going stronger than ever, with a secular annual growth rate in consumption of about 3% (similar to the world’s anthro CO2 emissions growth). In 2016, coal was the number one energy source consumed by the G20 (https://www.enerdata.net/publications/reports-presentations/peak-energy-demand-co2-emissions-2016-world-energy.html). The fact that it is no longer economically competitive to mine coal from the world’s oldest deep-shaft mines in fully developed, urbanized, high-population density, high wage-rate, environmentally uber-regulated England is hardly surprising — it is part of a natural progression of globalization that such heavy industry migrate to other nations. There is so much coal already known in the world that there has been little interest in prospecting for more for a century. Coal is the perfect example of a commodity that is demand-limited, not supply limited. Developing nations are building super-ultra-mega coal-electric plants (4-16 GW) as fast as their stuttering economies can afford them (India, Indonesia, Malaysia, South Africa, Egypt, etc.). China seems to be recovering from the recession that slowed its coal plant construction campaign since 2010, but even more telling is how much the Chinese have invested in using coal as a petrochemical feedstock–more substitution not factored into oil Hubbert curves or climate change scenarios.
I can’t remember the exact dollar figure, but it was something like 17 billion dollars that China had chosen to invest in Underground Coal Gasification, a technology developed by my late Uncle Doug Stephens at Livermore Laboratories near San Francisco – yet another substitution neither factored nor predicted…
Leo Smith:
“Sustainability” is nonsense. It deserves no consideration other than ridicule.
For example, you say,
But the Earth “is not an infinite resource” so no part of it – including oil – can be sustainable.
That knowledge has no practical use: it is nonsense.
So, you attempt to justify your promotion of the nonsensical concept of “sustainability” by spouting falsehoods; for example you assert
No! I was the Vice President of the British Association of Colliery Management and I know your assertions are absolutely untrue! UK coal burned in UK power stations was the cheapest source of UK electricity when the coal mines were closed for entirely political reasons.
The nonsense of “sustainability”derives from the repeatedly disproved Malthusian idea which wrongly assumes humans are constrained like bacteria in a Petri dish: i.e. population expands until available resources are consumed when population collapses. The assumption is wrong because humans do not suffer such constraint: humans find and/or create new and alternative resources when existing resources become scarce.
The obvious example is food.
In the 1970s the Club of Rome predicted that human population would have collapsed from starvation by now. But human population has continued to rise and there are fewer starving people now than in the 1970s; n.b. there are less starving people in total and not merely fewer in percentage.
Now, the most common Malthusian assertion is ‘peak oil’. But humans need energy supply and oil is only one source of energy supply. Adoption of natural gas displaces some requirement for oil, fracking increases available oil supply at acceptable cost; etc..
In the real world, for all practical purposes there are no “physical” limits to natural resources so every natural resource can be considered to be infinite; i.e. the human ‘Petri dish’ can be considered as being unbounded. This a matter of basic economics which I explain as follows.
Humans do not run out of anything although they can suffer local and/or temporary shortages of anything. The usage of a resource may “peak” then decline, but the usage does not peak because of exhaustion of the resource (e.g. flint, antler bone and bronze each “peaked” long ago but still exist in large amounts).
A resource is cheap (in time, money and effort) to obtain when it is in abundant supply. But “low-hanging fruit are picked first”, so the cost of obtaining the resource increases with time. Nobody bothers to seek an alternative to a resource when it is cheap.
But the cost of obtaining an adequate supply of a resource increases with time and, eventually, it becomes worthwhile to look for
(a) alternative sources of the resource
and
(b) alternatives to the resource.
And alternatives to the resource often prove to have advantages.
For example, both (a) and (b) apply in the case of crude oil.
Many alternative sources have been found. These include opening of new oil fields by use of new technologies (e.g. to obtain oil from beneath sea bed) and synthesising crude oil from other substances (e.g. tar sands, natural gas and coal). Indeed, since 1994 it has been possible to provide synthetic crude oil from coal at competitive cost with natural crude oil (using the Liquid Solvent Extraction – LSE – process) and this constrains the maximum true cost of crude.
Alternatives to oil as a transport fuel are possible. Oil was the transport fuel of military submarines for decades but uranium is now their fuel of choice.
There is sufficient coal to provide synthetic crude oil for at least the next 300 years (probably 1,000 years). Hay to feed horses was the major transport fuel 300 years ago and ‘peak hay’ was feared in the nineteenth century, but availability of hay is not a significant consideration for transportation today. Nobody can know what – if any – demand for crude oil will exist 300 years in the future.
Indeed, coal also demonstrates an ‘expanding Petri dish’.
Spoil heaps from old coal mines contain much coal that could not be usefully extracted from the spoil when the mines were operational. Now, modern technology enables the extraction from the spoil at a cost which is economic now and would have been economic if it had been available when the spoil was dumped.
These principles not only enable growing human population: they also increase human well-being.
The ingenuity which increases availability of resources also provides additional usefulness to the resources. For example, abundant energy supply and technologies to use it have freed people from the constraints of ‘renewable’ energy and the need for the power of muscles provided by slaves and animals. Malthusians are blind to the obvious truth that human ingenuity has freed people from the need for human slaves to operate treadmills, the oars of galleys, etc.. Indeed, there is a mechanical slave in my kitchen: I put my clothes in it and it washes them.
And these benefits also act to prevent overpopulation because population growth declines with affluence.
There are several reasons for this. Of most importance is that poor people need large families as ‘insurance’ to care for them at times of illness and old age. Affluent people can pay for that ‘insurance’ so do not need the costs of large families.
The result is that the indigenous populations of rich countries decline. But rich countries need to sustain population growth for economic growth so they need to import – and are importing – people from poor countries. Increased affluence in poor countries can be expected to reduce their population growth with resulting lack of people for import by rich countries.
Hence, the real foreseeable problem is population decrease; n.b. not population increase.
All projections and predictions indicate that human population will peak around the middle of this century and decline after that. So, we are confronted by the probability of ‘peak population’ resulting from growth of affluence around the world.
The Malthusian idea is wrong because it ignores basic economics and applies a wrong model; human population is NOT constrained by resources like the population of bacteria in a Petri dish. There is no existing or probable problem of overpopulation of the world by humans.
And that is why the notion of “sustainability” is daft.
Richard
Welcome back Richard, your comment went into spam due to it’s length.
It tells us nothing. It is one thing to acknowledge that a model is necessarily over-simplistic because the underlying assumptions do not and cannot fully represent the real world. It is another thing entirely to then turn the same model on its head and derive new assumptions as an out put.
Why? If the old assumptions are obviously wrong, it seems to make sense to pick new assumptions that seem to work better. In fact, that seems like the only rational thing to do!
Consider this one….
Y =cX^a * Exp(-kX) where the fitting constants are c, a, and k
Take Ln of both sides.
Y = Ln(c) + aLn(X) -kX
a controls the left side of the rising curve.
-k is the decay constant on the right side.
Estimate c, a, and k via linear regression.
There are numerous variations of this form, all using linear regression.
That should have been Ln(y) =
This model predicts an infinite amount of oil present on a finite sized earth. Clearly it is wrong
at some level. All over models predict a finite amount of oil that can be recovered. The question is
when will the remaining oil run out. And depending on which prediction you believe the answer is
somewhere between 50 and 150 years.
No matter which number you pick for the amount of oil reserves the fact is that within a comparably
short amount of time we are going to have to go to getting approximately 100% of our energy from renewable resources. This is hard and will need a lot of planning and development and the question we should be asking is should we do it now when we have lots of spare cheap energy or do it 50 years down the track when we have no spare resources for it.
Also for what it is worth Hubbard’s original prediction for the US oil supply holds up remarkably
well if you restrict to conventional oil deposits. You would then need to calculate a seperate curve for the results of fracking and other sources and then you could add the seperate curves for each distinct source to get an estimate for the total reserves.
G, the issue is not running out. The issue is the economics of higher crude prices as scarcitynof productiin sets in. We will never run out of oil. It will just be too expensive tomuse as we now do. That is disruptive.
There is no significant different between “running out” and being too expensive to use. And what is likely to make oil reserves un-tapped is the energy return on energy invested. At some point long before we run out of oil that number will be less than one and there will be a shift to renewables.
The significance of the 2 terms is this. Changes in economic situation and technology changes the viability of oil production. That’s why people make the distinction.
At some point, we will stop most if not all oil production. The question is when. I speculate that we may use liquid hydrocarbons for a long time for transportation even if we use them as energy storage, akin to hydrogen, where we get it from something else.
By your definition, Germinio, renewable energy is also a finite resource. The sun will eventually burn out and the wind will stop blowing. I am not going to worry about it. In the same way, I am not going to worry about running out of fossil fuels. Based on the fact that oil scarcity has been predicted for over 100 years and the trend in both oil production and oil reserves continues to be positive, why would I believe those tends are suddenly going to reverse, just because some people who have always been wrong, say that they are right this time.
Saying that Hubbards orginal prediction for the US oil supply holds up remarkably well if we ignore all the things that made it completely wrong is just stupid! I am a forecasting meteorologist who would love to argue that all of my forecasts have been completely accurate, if you ignore the things that made them wrong! I have actually used that line as a joke, generating a lot of laughter, but I think you are trying to be serious!
Renewable energy are finite resources but on a much longer time scale – billions of years as opposed to decades to centuries. Personally I am likely to be dead long before oil runs out but I am still concerned about it. If we want technologically advanced civilisation to last for another 1000 years then we need to start planning for the transition to renewables now. We can put off worrying about the end of solar energy for another billions years or so.
My point about the Hubbard curve is that each type of oil deposits appear to follow a seperate Hubbard curve. Thus you can get a more accurate prediction of oil production by adding a sum of Hubbard curves than you can by using a single model. And I would state that using a sum of Hubbard curves is likely to be more accurate than the logistic curve suggested in the article above.
Adding up Hubbard curves has the same flaw as a single Hubbard curve…there is no accounting for innovation and new technology in a single Hubbard curve or a summation. The forecasts will always be overly pessimistic and incorrect.
If we did not have other problems in the world besides where our energy is going to come from 100 years from now, I would be all for spending resources on solving the futuristic problem. Unfortunately, we have lots of problems right now that need to be addressed, like clean water and inexpensive electricity for the Third World. Spending resources on something that may be problem in 100-200 years, while a large percentage of the human population is suffering right now, seems like a very foolish use of our resources.
Germinio. Do you think renewables could replace oil and other fossil fuels?
“…getting approximately 100% of our energy from renewable resources.”
That is all you can think of today. Technology has a way of leapfrogging resource scarcity. We have trended to more and more dense sources of energy, not diffuse ones like “renewables.”
Except that we know how and when crude oil originated. It was formed from microscopic algae at the bottom of shallow seas in certain periods of Earth history and not others.

And we have extracted a good portion of it. We know because now we have to fracture the rocks to get small streams out of them. We wouldn’t do it if we still had plenty that could be extracted easily just by making a well in the ground. Some people will just refuse to see the obvious.
The U.S. Geological Survey publised a summary about Gas (Methane) Hydrates — A New Frontier. It stated:
“The worldwide amounts of carbon bound in gas hydrates is conservatively estimated to total twice the amount of carbon to be found in all known fossil fuels on Earth.”
see:
http://physics.oregonstate.edu/~hetheriw/projects/energy/topics/doc/fuels/fossil/methane_hydrate/methane_hydrate_japan_geo_survey/usgs_hydr
So, yes, we could eventually run out. Someday. Apart from nuclear power.
BW, even if the methane hydrate estimate is correct (it probably isn’t) most can never be produced. Covered that in some detail in essay Ice that Burns in ebook Blowing Smoke.
“It was formed from microscopic algae at the bottom of shallow seas in certain periods of Earth history and not others.“.
= = = = =
So the story goes. You forgot the part of the story about miraculous preservation in the mysterious sediments, followed by the spontaneous upgrading of carbohydrates into higher energy hydrocarbons, perhaps because that story (i) breaches thermodynamic constraints and (ii) doesn’t account for the nanodiamonds, hydrogen sulfide, or helium attached to crude. Perhaps it’s because (iii) wherever we look we see dead things decay, owing to the fact that dead things don’t harness energy to maintain system integrity.
You also forgot that part of the story that isn’t fictional, in which (iv) petroleum is food for microbes that infest every corner of the planet.
Mussels made from methane.
http://pubs.acs.org/cen/images/8229/asphaltflow.jpg
Tubeworms and crabs making a living from an asphalt seep.
How amazing it is to see so much “dead stuff” come to life in the blink of an eye!
I find it astonishing that billions of years after microbes started chowing down on “fossil fuels,” we can still find enough ancient corpses to power billions of human lives, line our roads, and make plastics and pharmaceuticals.
What an incredible story it is!
Khwarizmi,
Crude oil or petroleum originated under anoxic conditions in a similar way as peat originates today at the bottom of some wetlands, by anoxic decay. Peat can turn into coal given the right conditions.
Except for that vegetable oil sitting in your pantry that was grown economically last summer in about three months…
I feel a little more intelligent after reading Captain Keifer’s article. (Probably not, but it is nice to feel this way.) Once again, we find that results of modelling things that are largely unknown, are a product of the assumptions put in the model, not of the available data or the known science. GCMs do not add anything to our knowledge of climate. They are simply the pre-existing opinions of the modelers expressed in very expensive and complicated creations designed to disguise the fact that the whole thing is just a WAG (wild-ass guess), The worst part is that these pre-existing opinions are derived from the assumption that humanity is a disease to Mother Earth, which is scientifically unfounded and likely some kind of mental illness.
😎
The only way anyone could possibly know “peak oil” would be if they already knew (somehow) exactly how much oil (or other ‘fossil fuels’) exist.
We’re finding more everyday (when allowed) and finding ways to reach what before was thought to be unreachable (when allowed). It pays for itself in the long run.
Renewables? When subsidized … by the taxpayers … it cost everybody in the long run.
GD, both true in a way, but misleading. See the immediately following ‘brief’ comment, then go do the hard digging on the ‘truth’. We can actually statistically answer with good precision questions like ‘how much more conventional oil remains to be discovered?’ Methods experimentally proven in basins like North Sea, Permian, Siberia, Middle East.
Wrote about this extensively in both Gaia’s Limits and Blowing Smoke ebooks. Way to complex to fully summarize here. But there are several salient factoids that lead me to conclude this post is far too optimistic. Factoid defind precisely by Kip Hansen in his magnificent Alt Facts post over at Judith’s Climate Etc.
1. In the 1990’s there were several books and papers looking at peak conventional oil production using the logistics curves advocated in this guest post. The general expectation was a peak followed by decline ~ 2005. In fact, conventional oil peaked in 2007, and a 2008 IEA study of ~800 oil fields (including all supergiants and giants) that produce >2/3 of all global crude found the average annual production decline to already be 5.1%. (That is partly offset at present by new fields.) Conventional oil is defined as API>10, from a reservoir with porosity >5% and permeability >10 millidarcies. Petroleum geophysics matters.
2. Creaming curves by basin are always inverse hyperbolic, and they enable a good estimate of conventional oil TRR remaining to be discovered. My analysis in essay Peeking at Peaks was ~1700Bbbl discovered, creaming curve total total 2300 Bbbl, so only 600 remaining. The EIA estimate is 565, so a nice ballpark cross check. That means about 75% of all the conventional,oil to ever be discovered already has been.
To that must be added unconventional: Orinoco tar sands 513 per USGS (probably high by 2x; PDVSA’s own ‘official’ OPEC estimate is 235), Athabascan bitumen sands 280 (per CAPP), and tight shale oil 345 per EIA (again probably high by about 2x for reasons explained in essays Matyroshka Reserves and Reserve Reservations in ebook Blowing Smoke). So a total something about 3300 Bbbl TRR. Using standard logistic curves, this suggests an annual global production peak from all sources around 2023-2025. See essay Peeking at Peaks for a sensitivity analysis. Note I do not count the Green River ‘oil shale’ kerogen as TRR, since there is no water available for production and 3-5bbl water is needed per barrel of syncrude produced from the kerogen shale by retorting.
3. Orinoco and Athabasca are by definition API<10. What cannot be strip mined has to be heated (SAGD process in Canada) and so produce slowly? They do not produce as much transportation fuel per barrel even after hydrogen upgrading, so count for about 1/3 less in finished products rather than a simplistic 'all crude is equal'. So their price/bbl is about 2/3 of conventional crude.
4. While horizontal drill/frack enables production from source rock shales, the recovery factor is only ~1.5%. We can expect that to double to ~3% with a combination of tighter lateral spacing, more perfs with plug and perf rather than sleeve perf, and higher proppant loading. There may be a lot of source rock, but there is not a lot of TRR.
I don’t need to know what innovations are going to occur…I just need to realize that innovations do occur, especially when clever humans are given the freedom to make those innovations. We do not have a shortage of energy. That is not the problem, nor will it ever be. The problem may be the restriction of ingenuity!
Forecasts that do not factor in some constant of creative solutions and innovations are inherently wrong and overly pessimistic from the very start. Humanity is a non-linear, creative species. Making linear predictions based on current situations will always fail. That is why it is so stupid to start preparing for what the climate will be 100 years from now. Our ancestors 80 years from now will be several order of magnitude more able to handle the problem (if there is one, which is unlikely) than we are right now. It is like tasking the people of 1917 to spend resources on building solutions for congested airports, or putting humans on mars! It is just dumb!
I hold several issued patents in energy storage materials. So am actually something of an SME. Just what innovation in energy storage will replace kerosen for jet fuel, diesel for ag/construction/shipping/trucking? It had better be just around the corner, else the shoe starts pinching soon. And I am aware of nothing, even theoretical, except for LIC for ev autos (see Nov 2016 guest post at CE for technical details on that speculation). Blind faith in innovation overlooks the timing problem. We ALREADY have a foreseeable timing problem for crucial liquid transportation fuels.
“We ALREADY have a foreseeable timing problem for crucial liquid transportation fuels.”
And as the main economic ‘enabler’ that is a big problem. You just can’t dig up and transport millions of tonnes of ore with anything else.
But South Africans extracted liquid transport fuels from coal for several decades?
SASOL started out in the mid/late 1950s, and by the late 1970s/early 1980s, South Africa was able to get about half of its oil needs from coal. By then it was producing some 120,000 bbls a day at a cost of around US$17 per bbl. This compared very favourably with the then OPEC price of around US$20 – 22 per bbl. Steady increases followed and this is why sanctions did not break ap@rtheid. It is a proven system.
Around 10 years ago, I recall reading an article (written prior to the shale oil revolution), that suggested that now the break even point for oil from coal was circa US$100 to 110 per bbl of crude. The higher cost was partly due to differences in the quality of US coal compared to that of South African. The article suggested that no one would look at it until oil reached around US$140 per bbl for a sustained period of time. This was no doubt because of the costs of building the plants. Since that article, I suspect that some of the costs involved have now increased, but then again I suspect that today there may be some improvement in the efficiency of extraction thereby offsetting some of the rising costs.
Of course, one has to sit on a coal field, if not other costs will be involved, but there are plenty of large coal fields left. With cheap energy, almost anything is possible. Our problem is that we are stupidly making energy far more expensive than it needs to be. Future generations will come to their senses.
The neat thing about innovations, ristvan, is that no one knows what they are until they occur…but they do occur on a regular basis, and often in ways that no one would have predicted. They can come in combinations that add up to a solution to an unrelated problem. If we knew how it was going to happen, it would already be happening.
Perhaps the solution will not be with better batteries, but with some form of neighborhood nuclear reactors that are safe, cheap and portable. Maybe our growing understanding of Quantum Physics reveals the answer. I have faith in an innovative solution because such solutions have always occurred, and over the last 200 years, have been occurring at an every increasing rate. In every generation, there are always those who believe that we have gone about as far as we can go, and they have always been wrong. I am betting that they are also wrong in this generation. I think it is a pretty safe bet.
Well said.
I am not at all worried what will happen in a 100 years time. I am not at all worried about what we bequeath our great grandchildren. This is not because I am selfish, but rather because I have faith in man’s ingenuity. Problems that we perceive today, will not be problems in the future.
Mankind’s history is one of adaption and invention. The problems that we perceive to be problems today, will tomorrow have their own solutions. We cannot second guess the future, other than to note that it has always been brighter than the past.
Thanks Captain Kiefer. I had the privilege to work for the USN for over 25 years as an avionics tech rep for helicopters. I was always amazed how well the USN did in selecting Naval officers at the Captain and above levels. Can’t think of any that I knew who weren’t super people. I think you did a great job with your essay. I think that many of the scientists who are on the CAGW bandwagon are doing so because of their fear for the world when the oil runs out because they don’t believe anyone will come up with good alternatives soon enough.
Thanks for the kind words. I was always impressed by the military and civilian avionics techs who I worked with in the fleet and in operational test. The taxpayers bought me a pretty good education and kit bag of life experience, and I am trying to give back.
People with a blighted vision of the future are not the type of people we should invest money with since that kind of blindness automatically preempts innovation… for example, the UEA CRU mob are a prime example… it is impossible for them to bring new understandings and, as a consequence, open the way to new technologies to solve existing and pressing problems… which is why they do what they do. Like driving by constantly looking in the rear view mirror.
Oops… how did my comment end up in this spot? Getting old, fat finger syndrome, I guess.
Applying mathematics to things like peak oil is utter nonsense because human activity cannot be turned into a formula, algorithm or curve.
It can be and is, every day, on a statistical basis.
well, it can and is, but may not. By chance it sometime works, it usually doesn’t, and never works when we want it most.
I agree with Steven. People aren’t particles; you can’t plug free-will into DEQs. The best one can do is to make generalized statements using averages, but averages are largely devoid of information, as they do not capture that human action is at the margin, not at the central tendency.
Steven & Max. I agree with ristvan, it has been done for a long time statistically. Think of actuarial tables. The are based on statistical lifetimes of men, women, and children. And the life insurance companies have prospered a long time too.
Doubly wrong example:
1) those tables must regularly be changed; because, of, you know … human activities (btw i would define dying as such. Rather, trying to prevent death IS human activity) that make life longer. There may be some “peak life duration”… or not.
2) Life insurance do not care about your death or mortality tables. The main business that cares is pension funding, and it is in deep trouble because, well, … see 1) just above
Leonard, I get your point, but dying is not human action. Exploring for and recovering oil is. Statistics is applicable for the former, but not the latter.
paqyfelc.
No actuarial tables have been successfully used for a century or more, and, quite successfully and the life insurance companies are still doing well with this method. 1) Of course the actuarial tables are updated as required. I couldn’t understand the rest of your comment #1. 2) Pension funding is something that hurts most people in the cities where it goes wrong. It goes wrong when the politicians pander to unions and increase their benefits and pensions without appropriating money to cover the costs. Then when its time to pay the bills, the politicians successors must then raise taxes to keep the ponzi scheme from collapsing or they must start cutting promised benefits. The actuarial tables work fine, it is the crooked politicians promising them everything when they know the system is unstable and the benefits will be a burden for the next generation or never be paid.
Actuarial tables represent a statistical method that been proved tried and true for many, many decades. Blame the crooks not the statistical models.
Yes actuarial tables, as a method, have been successfully used for a century or more, and they will, too, in the future. However each and every actuarial table will eventually be a failure, so you have to change them for newer one, sooner or later. You cannot assess you own probability to live or die by looking at these table anymore than you can assess the future oil production by looking at some current table/curve.
Modeling is good even-though each model fails.
My bad if you couldn’t understand the rest of my comment #1. I wrote “i would define dying as such [human activity]” where i meant “I would NOT define dying as such”, meaning exactly the same as Max Photon March 2, 2017 at 8:41 am “dying is not human action”. Trying not to die IS human action, and this eventually ruins even the best actuarial tables.
Life insurance (those i know of, at least) do not care about mortality and don’t use actuarial tables: they just give you a capital, up to you to use as you see fit. Death insurance does, but that’s another business, which works fine, because actuarial tables they used when contracting with old customers overestimated risk of death, which turned to a profit for death insurance companies (less death is more cash in and less and delayed cash out for them).
I agree with you about Pension funding. The fact is, they don’t use actuarial tables to fit pensions to fund they have. That’s the way a scheme that made sense when people died 20 years earlier than they do now, turned into a Ponzi.
Speaking of overly simplistic models.
The K-T et. al. power flux, W/m^2, diagrams and models are based on a model of the earth as a ball suspended in a hot fluid with heat entering (ISR minus albedo = ASR) equally over the entire ToA surface. (342 W/m^2) That’s nice and simple and bears almost no resemblance to how the earth actually heats and cools which is extremely complicated especially on a W/km^2 basis.
Because of the oblique angle of the incoming rays due to the axial tilt and elliptical orbit the actual W/m^2 distribution over the lit surface is extremely complicated.
The earth is losing heat constantly upwards through the ludicrously thin atmosphere (100 km, aka 62 miles) per Q = U A dT. This rate varies across the surface as the earth rotates because the surface temperature rises from dawn to afternoon, falls afternoon to evening and then all through the night and varies across the surface from pole to pole, over deserts, jungles, water, etc..
The ASR on the lit half must replace the total energy lost from the U dT surface/ToA process otherwise the temperature will change. If more solar energy enters than is lost, the atmosphere/ocean/surface warms up. If less enters than is lost the atmosphere/ocean/surface cools off.
ISR minus albedo = ASR so albedo is the key. If albedo increases there is less ASR and the earth cools, more ice forms at the poles, less water in the air, less albedo = more ASR. Kind of a self-correcting water vapor/ice/clouds/oceans thermostat. Well, until Milankovitch shows up.
going through the rote, GHGs are refractory insulation. Refractory insulation between a fire and object warmed, reduces surface energy density. Currently GHGs refract 20% of total sunlight.
You don’t place a blanket of refractory insulating media between a fire and an object
and keep placing more and more refractory insulation in suspension between them
and create conditions such that as less and less light gets in, more and more comes out.
This is why GHG warming believers don’t let people sit down in front of them and step through the thermodynamic steps of rock, fire, cold atmosphere of nitrogen/oxygen, add enough GHGs to reduce surface energy by X%, etc.
All frauds
hate the laws of thermodynamics
and will not allow them to be spoken of around them, if there’s any chance of it having to do with whatever it is they’re scamming in.
Iterating the logistic equation (even in, say, Excel) is simple, great fun, and absolutely fascinating, and I highly recommend it to anyone — especially if you have young people you can share the experience with.
I found intermittency to be especially interesting!
“One need not take sides in biogenic-abiotic debate to still accept the evidence that oil is behaving more like a sustainable resource than a finite one.”
Just out of curiosity, why not a biotic answer? There are extremophile bacteria that live in the rocks, some have even been found in deep mines. They could either produce it directly or be a source for the abiotic process described.
“Well the American people aren’t stupid. You know that’s not a plan – especially since we’re already drilling. It’s a bumper sticker. It’s not a strategy to solve our energy challenge. It’s a strategy to get politicians through an election. You know there are no quick fixes to this problem, and you know we can’t just drill our way to lower gas prices.”
“Anybody who tells you otherwise either doesn’t know what they’re talking about or they aren’t telling you the truth.”
Just about sums up the issue for me. Leftists want America to fail, and they believe in their heart of hearts that it already is failing. They should be scorned.
I used to keep old copies of the World Almanac. (Had to get rid of most of my belongings during a personal crises. Wish I still had them. Excellent resource on recent history.)
I had copies from the mid-80’s to the late-00’s. One of the things they put in the almanac is estimates of worldwide oil reserves. Interestingly enough, with all of the oil consumed during that time, the total estimated reserves GREW every single year.
I am of the opinion oil is ultimately a finite resource, and, as a gesture to future generations, we would be wise to use other things (nuke, coal) in strong preference to oil, even at a somewhat higher cost, if necessary. However, it’s pretty obvious that the oil situation is not even close to being an emergency, and likely won’t be while I’m still on the planet.
I suspect that someone comparing the almanacs from the year of my birth (decades ago) to the year of my death (hopefully decades ahead) would find a substantial increase in oil reserves. How many generations until my (hypothetical) children should be concerned, I couldn’t say.
Bell Phillips:
You say
Yes, such growth of reserves is a matter of basic economics. In the simplified case of all other economic factors being constant, as any mineral is consumed its reserves and its cost both increase.
This is because
(1) ‘reserves’ and ‘resources’ are economic terms
and
(2) to obtain a mineral ‘low hanging fruit are picked first’
I explain the matter as follows.
A reserve of a mineral (e.g. stone, metal ore, coal, crude oil, etc.) is the known amount of the mineral which can be obtained at economic cost using existing technology.
A resource of a mineral is the estimated amount of the mineral which can be obtained using existing or imagined technology.
The value of a mineral is affected by its availability and, therefore, its reserves usually INCREASE as resources are depleted.
To understand this, please consider the simplified case of 3 men who each own a field which contains diamonds.
Man A has one diamond on the surface of his field.
Man B has 10 diamonds 10 meters below the surface of his field.
Man C has 100 diamonds 100 meters below the surface of his field.
The resource is 111 diamonds (i.e. 1+10+100 diamonds).
But the reserve is only one diamond. This is because Man A can find and obtain his diamond at much cheaper cost than Man B and Man C can find and obtain theirs. So, Man A can undercut the price for a diamond demanded by the others.
Then Man A sells his diamond. This reduces the resource to 110 diamonds (i.e. 10+100 diamonds).
But the reserve is increased to 10 diamonds because Man B can now undercut Man C. Also, the cost and price of diamonds increases.
Then Man B sells his diamond. The resource reduces to the 100 diamonds owned by Man C but the reserve then increases to 100 diamonds.
This, of course, assumes the need for diamonds is such that there is no alternative to paying the cost of Man C to obtain his diamonds. Diamonds from somewhere else or an alternative to diamonds may be cheaper, and – in that case – the alternatives become the reserves.
Importantly, at any time there are limits to the minimum magnitude of reserves
People do not pay to find more reserves when they have the reserves they need.
This is why oil reserves were equivalent to ~40 years of supply throughout the twentieth century and will be at least ~40 years of supply throughout this century. Oil companies have a maximum planning horizon of ~40 years so pay for more oil to be found if they have less reserves than needed for the next ~40 years. But they do not pay to find more reserves when they have enough.
And there are limits to growth imposed by the finite nature of resources (aka Peak Oil)
In the real world, for all practical purposes there are no “physical” limits to natural resources so every natural resource can be considered to be infinite. This also is a matter of basic economics which I explain in an above post that is hidden while awaiting moderation.
I hope this helps.
Richard
Cleantechnica claims that renewable energy now accounts for over 30% of the total global installed power generation capacity, Pretty amazing!
And worldwide growth of photovoltaics has been fitting an exponential curve for more than two decades, and costs continue to plummet. As a GC, I get offers of mainstream panels below $0.50 per watt, wholesale.
Assuming the growth in solar continues to hold, PV (and wind) will displace more and more fossil fuel except for peaking use, and Elon Musk looks like he has a practical solution to deal with that.
What’s amazing is that 1. You believe them, and 2. You don’t know the difference between capacity and generation.
There is a reason why Cleantechnica and their ilk speak of “capacity” instead of actual energy production. It is because intermittent terrestrial wind only produces the equivalent of 30.5% of its nameplate capacity and PV solar only 21% per 2016 EIA industry data. And the energy produced does not come on demand or when needed, but when the weather dictates, making these MWhs far less valuable than those from controllable (i.e., “dispatchable”) plants that follow consumer demand. Economics suffer directly because adding intermittent resources to the grid does not allow any reductions of existing dispatchable capacity: the grid must continue to have the same amount of controllable capacity as ready reserve to back-up and buffer the unreliable intermittents. The result of adding more wind and solar to the U.S. grid over the past ten years has been a reduction of the overall utilization rate (i.e., “capacity factor) of the nation’s fleet of generators from 47% to less than 40%. There has also been binge of about $7B/yr on new transmission line construction to connect remote and diffuse RE to the grid and the urban load centers, and all these new transmission lines also have a similar low utilization rate (“load factor”). Electric ratepayers are paying higher rates to maintain more generation and transmission capacity than ever, while all if it is working less efficiently. The subsidized push for “renewable” energy is why national electric rates have been going up faster than inflation since 2005, and why we have much more generation capacity today, even though there has been virtually no load growth over that period.
BTW, Tina Casey banned me from Cleantechnica a couple of years ago. I am also banned from Ars Technica. Some people don’t want facts to intrude on their worldviews.
See Ray Kurzweil’s suggestion that solar industry dominance will occur in just 12 years because trajectories are exponential:
https://cleantechnica.com/2016/04/15/futurist-ray-kurzweil-predicts-solar-industry-dominance-12-years-trajectories-exponential/
In 2012, PV produced 0.5% of the world’s energy. By 2016 (4 yrs), it had doubled again twice to 2%. And it is only six more doublings (12 years) to 100%.
1) Does Ray mention all the money our corrupt, lying politicians forced us to pay to subsidize your crusade against reliable energy, and the impact those subsidies have on his numbers?
I don’t want to subsidize the solar cult.
2) re: your response to my logistical and thermodynamic point above, that petroleum is food, not fossil.
I don’t keep vegetable oils in my pantry, precisely because they spontaneously degrade at a rapid pace. Oxidized oils are unhealthy and taste disgusting. I tend to use saturated coconut fat (solid at room temperature) or saturated animal fat for cooking.
However, I did once try to preserve some vegetable oil in the sediments of a shallow inland sea, but it all floated to the top of the water column immediately. What an unexpected surprise!
Because I am such a huge a fan of the fossil hypothesis, I actually expected it to stay there for a few million years. What did I do wrong?
Khwarizmi that’s some smooth commenting I find myself lovin’ it. I love a fraud buster, there’s nothing like watching it happen
Todd,
A truly fascinating analysis. Thank you.
I was particularly interested in the part where you state:-
“Pmax, which in logistics terminology is known as a carrying capacity.”
Given that the increase in atmospheric CO2 has stimulated plant growth and so increased the biological carrying capacity of our planet, would you now like to perform the same critique for the Malthusian catastrophe?
The carrying capacity of Earth has always been a function of human interaction. Humans first began changing it when they started participating with nature in a partnership called “agriculture” that includes selecting optimal plant species, suppressing pests and predators, collecting and saving seeds for future crops, plowing and planting, irrigation, managed application of nutrients, fertilization using colonized bees, selective breeding to increase hardiness and yields, crop-rotation, greenhouses and hydroponics, direct genetic manipulation, etc. In my paper on biofuels (http://wici.ca/new/resources/occasional-papers/#no.4 ) I discuss the practice which I believe has had the most impact, and that is the 20th-century innovation of converting fossil fuel natural gas into ammonia fertilizer. Essentially, humans have figured out how to accelerate and densify plant growth by supplementing ATP energy created by solar photons in the leaves with ATP energy provided by ammonia artificially fixed in the soil. This has increased average U.S. corn yields by a factor of 6, with some cutting-edge farmers today getting a 16-fold increase. We have really only begun this journey and are not as far along with some other plants yet — for example, only a 3-fold increase in U.S. wheat to date. The genetic modifications are largely to enable this rerouting of energy, as much of what these agronomical engineers are doing is making corn more biased to pull artificial fertilizer energy from the soil and reducing dependence on leaves. Corn plants are now being planted tightly packed together more than 50,000/acre when the historic norm was 12,000/acre to give them room to spread their leaves to capture sufficient sunlight. The balance of the genetic modifications are to work on the loss side of the equation, to improve resistance to drought, freezing, and pests, and to make the plants specifically compatible with certain proprietary pesticides such as glyphospate.
The world now has an agricultural economy that is absolutely dependent on fossil fuels. And the huge input of fossil fuel energy into agriculture is one of the core reasons why biofuels from any cultivated biomass are a ludicrous proposition — it is attempting perpetual motion in chemistry by converting fossil fuel hydrocarbons into plant biomass carbohydrates and back again into hydrocarbon fuels. It is much more efficient and sensible to use fuel for fuel and food for food.
One of the best empirical metrics of how farming efficiency is improving is how farmland is shrinking in developed nations. From 2003-2012 (most recent statistics), the USA lost 288 acres of farmland per hour converted to housing developments, shopping malls, and conservation. The USA now raises all its food, including a considerable surplus for export, from about 230 million acres. When the population was half what it is now, we were using more than 400 million acres. About 40 million of today’s acres are for the crime against humanity that is corn ethanol. The USA currently grows more corn to put into our gas tanks than Russia’s entire annual grain crop. And the small amount of gasoline being displaced is far less than the surplus gasoline we are already exporting (mostly to South America and Venezuela at the moment), so there is not even an energy security benefit.
Rather than cutting down forests for fuel and food as was the norm for the pre-industrial world that many “greens” seem to want to return to, the forests and conservation land of all developed nations are growing. High power density, subterranean energy sources like fossil fuels and nuclear power have actually freed us from destructively and unsustainably raping the biosphere for our energy. I believe the Earth and humans in partnership are easily capable of sustaining a peak population of 11 billion people at a standard of living equivalent to what Americans enjoy today. In fact, the faster we help the developing world transition from wood and charcoal and dung open-pit fires to coal and gas and nuclear electricity, the faster fertility rates will drop, the lower will be the peak population, and the less will be our peak environmental footprint and carrying capacity burden.
Malthus and Jevons and Hubbert have all been foiled by fossil fuels coupled with human ingenuity. If fossil fuel scarcity ever does start become a dominant factor, the first and last place we will see it is in food prices. Transportation is secondary to eating.
Todd,
Thanks for your additional comments.
Are you on Research Gate?
No, not on Research Gate. Hadn’t really considered it till you mentioned it. What do you think of that community?
You should join!
The Logistic distribution is a classic example used to show chaos, but before chaos, comes period doubling much like the data shown. The equation, and it is just an equation, needs to be pushed hard to bifurcate.
Todd “Ike” Kiefer Claerbout and Muir show that Hubbert’s curve IS a logistic function
Hubbert Math
Jon Claerbout and Francis Muir
Logistic Equation, WolframMathWorld
I encourage you to review the literature. There have been numerous papers studying Hubbert’s and similar curves. E.g.
National Academy of Sciences Report on Energy Resources: Discussion of Limitations of Logistic Projections: DISCUSSION, JM Ryan – AAPG Bulletin, 1965 -pp
Wow Captain! a) What a CV and b) What a magnificent, novel article on the subject. I met the elderly Dr. King Hubbert at a ‘quietly’ historic meeting of industry and government experts in (IIRC) 1976. He was a special guest. The meeting was convened by the USGS to evaluate the availability of lithium in the world and in North America for future electrification of transportation. I was the only foreigner invited because I was a specialist in lithium resources from the Canadian government. I had caused some concern in my Minerals Yearbook chapter (Cdn) in which I apparently calculated fairly closely how much lithium was purchased for the US hydrogen bomb use and research in the 1950s.
Chatting with Dr King I asked him what he thought would happen with the oil crisis about which he appeared at the time to be right on. He smiled and said that there would be no crisis. Human ingenuity would solve the problem before it became one.
I have great respect for Hubbert’s intellect and his ability to write on a technical subject in a way which captured people’s imagination. I wish I could have met him. Most people think his seminal paper was on oil, when it was really about nuclear power. I hope we continue to achieve his dream which was migration from chemical energy to nuclear energy. France is 75% of the way there, but seems to be reversing course. So much needless human misery has been perpetuated by people opposing the world’s safest, greenest, most sustainable, most revolutionary energy source. Organized ignorance has proved to be a powerful force. But even founders of GreenPeace have been known to come around. I believe if Hubbert was alive today, he would be testifying in lawsuits against the Sierra Club and EPA.
Javier
March 2, 2017 at 12:42 am says
Crude oil or petroleum originated under anoxic conditions in a similar way as peat originates today at the bottom of some wetlands, by anoxic decay. Peat can turn into coal given the right conditions.
Bacteria/algae(CHO) can turn into oil just as
Peat ( CHO) can turn into coal
Neat. I taught that for 40 years. However now I have read this
http://www.pnas.org/content/99/17/10976.full
I have changed my mind.
Coal is carbon(C) and
Oil is hydrocarbon (CH)
CHO can turn into C
CHO can only produce CH4 but not C2H6 and larger
David Middleton touched on this toward the end of his post (https://wattsupwiththat.com/2017/02/18/oil-where-did-it-come-from/) . However, I think he dodged the real question. The key puzzle for me is the origin of kerogen. Once we have kerogen, I think the theory of how it is cooked into shorter-chain hydrocarbons at shallow depths is sound. But we can’t explain the origin of oil without getting to the origin of kerogen.
The biogenic theory of oil essentially begins with sugar molecules. How do we start with sugar molecules with equal ratios of carbon and oxygen, strip them of their oxygen content, and get them to oligomerize or polymerize into 1,000-Dalton chains — particularly when the thermodynamics says that at depths shallower than 100km, the chemistry should proceed in the opposite direction toward oxidation and decomposition?
What I think this PNAS paper proves is that, whatever is the process that creates kerogen, it must happen at depths far below 100km. And once we are that deep, this paper (and many others I have read), indicates we can create hydrocarbons from water and calcium carbonate, without any need for biotic material.
I know from other reading that in crustal subduction zones, sea water and sea floor material can be carried to depths of 400km, and that this is an ongoing geological process. So it would seem that biosediment carbohydrates, or biosediment calcium carbonate and sea water, or inorganic calcium carbonate and sea water, any of which are transported to such a depth, would have the opportunity to become liquid hydrocarbons and methane. And the physics says that higher temperature and longer duration favor the formation of longer molecules when the pressure is high enough.
But if the biomass never goes below 100km, then it should decompose into carbon and methane and CO2 (coal and coal gas), not kerogen. It is also very difficult to envision source rock formations being pushed to hundreds of kilometers depth by gradual sedimentation and overburden, and then rising again to the shallows, rather than being moved by something more powerful like subduction or asteroid impact.
Comet Haley is 1/3 kerogen, but fossil fanatics don’t want to know about it
They spout the word “kerogen” as if words themselves were evidence.
The biological origin of kerogen in sedimentary oil prone source rocks is indisputable.
Let’s start with the most obvious proof, the Victorian Oil Shale industry of Scotland, and the industrial oil produced from the Carboniferous shales of West Lothian.
The oil-shale bings of West Lothian
History of the oil shale industry
The next proof I have is the waxy oils of the Beatrice Oil Field in the Moray Firth that are sourced from Devonian Lacustrine Shales, the waxes in the oil come from the land plant leaves washed into the ancient lake at the time of source rock’s formation.
Then we have the deep marine oil prone source rocks that contain the remains of animal biota that used lipids as a fundamental part of their life processes. For example in the modern ocean there are about 85 species of the deep water shrimp which are planet’s most abundant animal biomass and a good source of fish oil (ask the whales) 😉
The final link in the chain of biological oil is the presence or absence of deep water anoxia in the world’s oceans. The deep water of the modern world ocean is cold and well oxygenated and derived from cold water down welling at the poles. This thermohaline process fundamentally requires the existence of polar continental icecaps to work well, i.e. Antarctica & Greenland, producing cold katabatic air and coastal latent heat polynya, for example in the Weddell Sea. An abundant supply of well oxygenated deep water in the open ocean means little potential to preserve organic remains.
During geological periods when there were either no icecaps or extensive mid-latitude oceans, such as the Tethys Ocean, then the world ocean bottom waters were dominated by the tropical shallow water thermohaline mechanism producing an abundant supply of dense warm saline deep water and not polar waters (e.g. The modern Mediterranean exports warm dense saline oxygen deficient water into the Atlantic Ocean via the straits of Gibraltar). The deep water of the Cretaceous Pacific Ocean reached +16C, this dense warm saline tropical deep water more easily became anoxic in ponded basins, such as the northern polar Boreal Sea, leading to the formation of the Lower Cretaceous marine oil prone source rocks of the North Slope of Alaska. The Black Sea is a modern example of an anoxic ponded basin containing dense warm saline water at depth.
Which of the words and phrases in your post are we supposed to accept as real world evidence, Philip?
* “shale bings”?
* “spoil”?
* “parrafin”?
* “waxy oils”?
* “Devonian Lacustrine Shales”?
* “the waxes in the oil come from the land plant leaves”?
* “deep marine oil prone source rock”?
* “contain the remains of animal biota that used lipids”?
http://www.ucmp.berkeley.edu/quaternary/smilodon.gif
(what La Brea tar pits are made from: smilodon lipids)
* “there are about 85 species of the deep water shrimp which are planet’s most abundant animal biomass”?
http://oceanexplorer.noaa.gov/explorations/03windows/logs/jul30/media/iceshrimp_600.jpg
(“ice shrimp congregate beneath the overhang that caps the methane hydrate” – WHOI) – [shrimp made from hydrocarbons]
“the final link…presence of absence of deep water anoxia..”?
*****
“Microorganisms living in anoxic marine sediments consume more than 80% of the methane produced in the world’s oceans.”
(Science 20 Jul 2001: Vol. 293, Issue 5529, pp. 484-487 / DOI: 10.1126/science.1061338 )
*****
The phrase “source rock” doesn’t say anything about the origin of the oil and gas it contains:
= = = =
“The chance you’re counting on is that oil and gas formed somewhere in the vicinity millions of years ago, could have migrated into the dome through layers of permeable rock, and have accumulated there, hemmed in by an impermeable layer above.”
Shell Oil Company, youtube
= = = =
Oil migrates upward from deep below (~100kms) through natural fractures.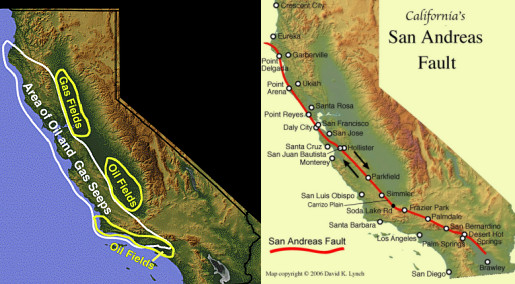
“Source rock” is just a sponge.
The issue being discussed is the origin of the immobile substance kerogen which you first raised when you said:-
“Smilodon Lipids” 🙂
I am trying to “wrap my head” around the oil origin matter. This business of “oil is biogenic is indisputable” bothers me. OK, then, explain to me the chemical pathways of how it comes to be.
First there is biology-to-kerogen — I think the call that “catagenesis” followed by kerogen to “mature oil” that they call “diagenesis”?
On the catagenesis question, I believe that “they believe” that the source of oil is not sugars or carbohydrates but rather lipids from certain algae or cyanobacteria species? I don’t know if people have a better handle on the chemical thermodynamics of lipids to kerogen, but if one claims sugars/carbs/cellulose to kerogen, you will be met with “Aha, responsible people know coal comes from carbs, oil comes from fats!”
As to kerogen to oil, that is what people do in extracting oil from oil shale — they heat it up. This gets back to the question of equilibrium chemistry. The “endpoint” of the Fischer Tropsch process was explained to me to be methane — you have to “quench” the reaction by extracting the longer-chain alkanes before the reaction reaches equilibrium. I believe this is the difference between a synthetic fuels plant and the processes taking place in nature? What is the endpoint of heating up kerogen in the lab or the synthetic fuels plant — does it all go to methane like with Fischer Tropsch?
I am still searching for a confirmation/corroboration/explanation of this matter of equilibrium chemical thermodynamics, Gibbs Energy, and the impossibility of converting oxygenated un-saturated things (bio sources) into anything other than methane as claimed by J. F. Kenney. J. F. Kenney is a fraud someone may claim, but OK then, where is the error in his argument? This is a case where the burden of proof is on disproving him, not dismissing him as chemical thermodynamics by now must be well understood? A distinguished Chemical Engineering synthetic fuels researcher could not offer any disproof (answering that the chemical pathways by which bio matter turns into oil are unknown — I purposefully didn’t mention J. F. Kenney at the time, but the answer at the time astounded me).
@ur momisugly Paul M.
Thank you for the thoughtful reply. I think you have catagenesis and diagenesis reversed. Diagensis is the theoretical transition of biological organisms to kerogen and catagenesis is the process of breaking down the huge kerogen molecules into the hydrocarbon species of crude oil.
You make a good point about lipids versus sugars being the theoretical source of the kerogen in the prevailing view. However, it is important to note that lipids are a minority fraction of even the most lipid-intense organisms — algae — typically comprising only 10-15% of dry cell mass compared to 50% for saccharides and 40% for proteins (and a minuscule fraction for nucleic acids). So the biological feedstock for kerogen is overwhelmingly not lipids, and if we subscribe to the conventional theory, we have to deal with the question of where does all the oxygen and nitrogen from the majority constituents go, and why is it not incorporated into the kerogen?