Guest opinion: Dr. Tim Ball

In a previous article, I noted the treadmill created when you convince politicians to form policy based on untested hypotheses. The anthropogenic global warming (AGW) hypothesis was untested because the Intergovernmental Panel on Climate Change (IPCC) and others determined to prove, rather than disprove it. Professor Richard Lindzen explained years ago that the consensus was reached before the research even began. Despite AGW proponent’s best efforts to ignore and obfuscate, evidence continues to emerge. Their efforts included writing limited definitions of terms, making false and assumptions and ignoring, manipulating or creating evidence as required. They focused on specific issues in isolated places with a great emotional appeal. Classic examples include people under threat of drowning on remote, supposedly idyllic, Pacific islands, or people in Arctic lands threatened as the symbol of their struggle, the polar, is also starving and drowning. Wonderful, fanciful environmental fairy tales are woven to spread the falsehood of AGW, but as Shakespeare wrote, “at the length the truth will out. “
Climate science was hijacked for the political agenda of showing that there were too many people using up too many resources. The original objective of the political exercise was global population control only possible through a world government. A global threat created by these humans was necessary to transcend national boundaries, and so CO2 induced global warming became the vehicle. Al Gore was central to this political agenda. His climate connection and contribution was rewarded with the Nobel Prize. His population connection included organization and participation in a 1994 world population conference in Cairo Egypt.
Gore’s activities and machinations gained far more media and public attention than virtually anything the IPCC or its promoters did. It is likely that more people watched Gore’s political propaganda movie, An Inconvenient Truth in one day than ever read the Physical Science Basis Report. One measure of Gore’s influence on the public information was exploitation of the Arctic sea ice conditions. To emphasize and emotionalize the situation, he misrepresented the impact on polar bears.

The falsity of all that is emerging as the evidence continues to appear. For example, Susan Crockford reports that,
Polar bears off the ice in W. Hudson Bay are “well fed and in great shape” this year.
Two recent articles speak to the evidence of changing ice conditions that contradict the AGW hypothesis.
Frank Lansner’s “Interesting and positive changes in Arctic sea ice volume”is a good article but I don’t think “positive” is the right adjective. It is a subjective judgment about conditions or their change. This is important because alarmists tell people that warm is bad, but cold from a human survival perspective is much worse. Even in these warm interglacial years, more people die from cold than warm every year. The change Lansner reports is positive because it shows the anthropogenic global warming (AGW) alarmists are wrong.
The second article reports that,
“The area of 1.5+meter ice in the Arctic has tripled over the past four years, and volume has increased about 50%”
Al Gore did more to bring melting Arctic ice to global attention than anyone. Polar bears became victims and poster animals for the destructive human production of CO2. He’s done more than most in creating false ideas and images for his political and economic agenda.
When asked what’s wrong with global warming people invariably reply after some thought that glaciers will melt, and sea level will rise. Gore made this a major part of An inconvenient Truth with animated scenes of Florida and other low-lying areas inundated. He never explained the difference between sea ice and land-based ice or how the former does not affect sea level.
He furthered the confusion with the false story of polar bears drowning. I flew search and rescue in Arctic Canada and saw polar bears at sea swimming comfortably. Gore used an illustration of polar bears climbing up on ice fragments implying they were taking their last available refuge (Figure 1). Here is what was going on.
The photo used by Al Gore in An Inconvenient Truth was taken in the month of August. This is when it gets puzzlingly funny. Remember this iconic and oh-so-heartrending photograph of two polar bears on a melting icecap published by the Associated Press that was on every darn mainstream publication? What you probably don’t know is that this image was taken in August, a time when polar icecaps naturally melt and the wider shot would have shown that the bears were near land mass. Even the photographer, Australian marine biology student Amanda Byrd, didn’t think the bears were in any kind of jeopardy.

Polar Bears are naturally curious and seek high vantage points. No doubt the passengers on the cruise ship were a potential hunting opportunity.
People were easily fooled because few know anything about the Arctic Ocean and the ice conditions. For most, the Arctic Ocean is a thin line across the top of most world maps that give no idea of its size or shape. It is over 14 million km2 and every year an area approximately equal to the US (9.8 million km2) melts and refreezes at the average rate of 60,000 km2 per day. These figures are based on satellite information that only became available in 1978; then it took two years to create useable data. That 36 years of record is the only semi-empirical data we have. I say semi-empirical because there is even disagreement among the various analysts.
As people began to grasp the normal mechanisms of Arctic ice it became necessary to introduce another threat, namely “thinning ice.” Hence the significance of the report of thickening, however, like all information it requires caution.

Gore and other alarmists used the summer 2012 melt to bolster their failing anthropogenic global warming (AGW) hypothesis. As usual, information was selective, limited, and mostly wrong; only the lowest area estimate was reported from a range of estimates that varied by 1 million km2 or 25 percent. They claimed air temperatures were higher, but that depended on the sector; Alaska and the Bering Sea had record winds, ice, and cold. Even the Arctic Climate Impact Assessment (ACIA), the primary source of information for the Intergovernmental Panel on Climate Change (IPCC) said a four sector approach was necessary.
We now have a better idea of why that is important. The entire ice pack slowly rotates round the Pole driven by the polar easterlies. Some already knew that the extent and condition of the ice are directly affected by wind patterns. We knew because of the anomalous conditions, including extreme Meridional flow, triggered by the eruption of Tambora in 1816. On November 20th, 1817 the President of the Royal Society, London, wrote to the Admiralty:
“It will without doubt have come to your Lordship’s knowledge that a considerable change of climate, inexplicable at present to us, must have taken place in the Circumpolar Regions, by which the severity of the cold that has for centuries past enclosed the seas in the high northern latitudes in an impenetrable barrier of ice has been during the last two years, greatly abated.”
NASA finally acknowledged this caused the changes in 2007 and again in 2012. The change to more Meridional flow after 2007 caused greater variation in ice amounts as the anomaly diagram shows (Figure 2), although the rate of loss leveled. The pattern follows the temperature record of the hiatus including increased variation.

It is informative to know the story of thinner Arctic ice and Gore’s involvement. In the original claim, they compared two sets of submarine derived measures. The first was between USS Nautilus in August 1958 and HMS Sovereign in 1976. In 1992, more under-ice runs were obtained to provide further evidence of the global warming. They were comparing frozen apples and oranges. Worse, they did not measure thickness. The scientists had no say in the data and how it was recorded. The submariners were recording variations in the bottom of the ice as under transits became regular events. Like aircraft pilots need to know the height of the land, they needed to know how far down the ice extended.
I was an operations officer and aircrew in the North Atlantic and Canadian Arctic during the Cold War tracking Soviet submarines. Our job was to keep track of their positions in the event of war. We discovered there were more submarines, especially in the Atlantic than we were tracking through our surveillance barriers between Iceland, Faeroes, and Scotland. They were transiting under the Arctic ice especially in the deepest exit, the East Greenland Channel.

A major problem is that the bottom of the ice is very irregular (Figure 3). Downward extending ice was called a keel.
“To qualify as a keel, an ice draft must be at least twice as deep as the local minimum draft measured from undeformed ice, it must be the deepest draft among all local drafts, and it must be deeper than 5.0 m.”
They concluded,
“Several errors can occur because of the limitations of the data, collection hardware, and methods selected to do the processing. Studies of the magnitude of errors in data gathered by upward-looking sonar systems indicate a 5% cumulative error and an absolute error of 0.3 to 0.5m.”
That was only part of the problem;
“A substantial effort was spent filtering and attempting to recover useful information from these data sets. The data had frequent ‘dropouts’ or sections of missing data. Additionally, the speed information which was critical for determining distance was often corrupted. Obvious errors were removed but questionable data remained which could effect the results.”
Despite this, they concluded,
“In summary, ice draft in the 1990s is over a meter thinner than two to four decades earlier. The mean draft has decreased from over 3 meters to under 2 meters”.
Approximately a 1meter change with a 0.5meter error.
The trouble is the were not measuring ice thickness but ice draft, the amount of ice below the water line which varies with snow load. Change is naturally dramatic from week to week and decade to decade in the Arctic. The first set was measured in the cold period from 1940 to 1975, the second in the warmer period of the 1990s. Measurements were taken in different months, in different areas, with different equipment, one with narrow and the other wide beam sonar.
An important question is how did they get the second set of data when, because of the Cold War, data gathered by US submarines was top secret? I tried for years to get temperature data from all the submarine work made available for climate and ocean research without success.
By 1992 Gore was Chair of the House Committee on Science and Technology responsible for NASA and apparently able to provide access to another piece of data in the ongoing deception.
In 1992 the US Navy (USN) approved the boundaries of an area within which environmental data from Arctic submarine exercises could be released. It was called the “Gore Box” by the USN, so there is no doubt of the origin.

Maybe Al Gore, whose credibility is on thin ice, can explain how the ice is now thickening, and polar bears are flourishing. He could also explain how the Bears survived the 1817 conditions or any of the other extreme natural variations of weather and ice in the historic record.

Excellent article. Climate “science” has put the cart before the horse from the outset for social/political purposes. The scientific method has been turned on its head, and well-meaning people don’t have a clue that their fear and anxiety about “man-made global warming” is not founded on science at all.
Indeed Dave Andrews, an excellent article. Dr. Tim Ball is high on my “Must Read” list. Well-meaning people don’t have a clue – that is the problem.
I concur, Mr. Ball is a very dangerous man . . in a charming sort of way ; )
John, Prof Ball is only dangerous to liberal megalomaniacs who want to squelch science in the name of false consensus claims. You know, right?
Well, I wouldn’t say only, Stephen ; ) and I don’t call the sort you speak of “liberal” . . but yes, I meant it as a high compliment.
“Climate “science” has put the cart before the horse for ‘social/political purposes’.” Should read ‘social/political and financial purposes’.
Bush’s biggest mistake was listening to Condoleezza Rice-A-Roni, climate expert, who convinced Dubza that CAGW was scientific fact and off to the Gobmint pig trough we went. And she wants to be the NFL Commissar—there goes football down the toilet.
Huh?
I recall Bush being called “anti-science” for dismissing the CAGW “experts”.
Now I am very confused.
czechlist
No, Bush was continuously insulted by the liberals, but he only failed to accept CAGW as a religion with the fervor needed by Gore and the democrats to destroy the US economy. He “did” however appoint science advisors who do NOT propose the wholesale death of billions of innocents solely to make their world “more environmentally friendly” and “sustainable”. (One of these appointees DID require Hansen to stop abusing his government position to make private political statements against the government. Essentially, Hansen was told to do his job – and THAT simply was not tolerated by the tolerant liberals. Can’t have that, only democrats can criticize government policies.)
Now, in truth, Bush, becoming president in January 2001 and leaving January 2009, did NOT have evidence like the 18 year pause to create a case against CAGW – He, in fact, came into office right after the 1998 El Nino jump that made it even more credible for a while.
But wait!
You’re both right!
Condy did indeed promote Climatism in the Bush WH, but she wasn’t able to get him to support ratifying the Kyoto Treaty. She did however persuade him to condone climate conferences.
Climate was one of the areas in which Condy butted horns with Cheney.
Concur.
I have to say my biggest problem with this whole thing about arctic ice from the beginning is this was global warming bait. Telling us the arctic was going to be ice free is sort of pointless. It’s obvious the arctic has been free of ice many times in the last few million years and animals and life went on fine. The ice has no impact on sea level. The most likely impact of the loss of the sea ice is freeing up massive resources under the ice which most nations are dying to get their hands on. This controversy over the ice is stupid in my opinion. Undoubtedly, the sea ice will go away at some point. While it is funny and instructive to see how the AGW’ers have predicted prematurely its loss over and over it may very well go away and I fail to see why anyone is the least worried about this. Are we crying over the loss of ice? Seriously? There is plenty I can tell you. The Earth is covered in miles-thick sheets of ice that aren’t going anywhere.
I have heard some theories that the sea ice will reveal large methane pools that will cause massive heat gains. This theory has been disproven but even if there is something to that it’s going to happen eventually anyway. Nothing we can do will change the temp in 2100 by 0.1C even by climate people’s reckoning. To do something significant to temperature would involve impoverishing a billion people. It’s not going to happen. So, the temperature is what it is and what we’re going to get is pretty much what we’re going to get. I am sorry if this seems pessimistic but so far in spite of the caterwauling of AGWers the unstated truth is that temperature change has been GOOD for the world. The IPCC admitted this. Up to 1.5C they said was positive but they don’t admit how positive it is. We know now that agricultural productivity has been boosted by at least 20% by the CO2 we’ve put in during the last 50 years. Satellites prove this and peer-reviewed scientific articles show this. Not that we’d need that. Greenhouses for decades have been using enhanced CO2 to generate double the productivity up to 1400ppm of CO2. So, does it take a couple science studies to show that boosting co2 would up plant productivity?
During this 1.3C or whatever they want to claim from the last 200 years of civilization, life has gotten incredibly better for humans. Study after study shows more people die in the cold than the warmth and that whatever incredibly small and irrelevant effects of warmer temperatures they describe as the “damage already occurring” it is trivial compared to the gains we’ve gotten from improved weather and co2.
Very insightful analysis of the situation. We must add that all dire predictions are based on worst case scenarios and unsupported assumptions.
If you think the science of global warming has holes all you need is to take the smallest look at the literature on “projected impacts”. This has to be the worst science being done in the country. These predictions of effects are so unbelievable a high school student could easily read apart most of them as comlletely stupid.
It is one thing to predict something next year based on scads of data and little interaction. However when projecting something 50 years or more ahead you have to consider all the logical mitigations. It is assumed in most of these studies that no mitigations are taken. It’s assumed we all walk into a hurricane without even consulting the weather forecast or looking outside. But such mitigations are relevant only if the proposed negative actually occurs in the first place. They have a historically incredibly bad track record of this as evidenced by the above article. They have been predicting this demise for years over and over and been wrong. What makes anyone think any of their other predictions have any more likelihood of occurring?
I have a blog where I point out some of the predictions and failures of climate science. https://logiclogiclogic.wordpress.com/category/climate-policy
If I remember correctly, Al Gore flunked out of divinity school, and finally got a degree in government studies, or whatever they called it. A reasonably effective politician, which says quite a lot about the general grade of politicians in the US.
The utterly horrible thing is that fool nearly became President.
After Al Gore received his Nobel prize, I remember some lefty academician saying, “Well, you know, I think it was nice he got a Nobel prize since he lost the election.” I thought to myself, “Yeah if it has to be a choice, I won’t begrudge him receiving it. It is a lot better than suffering through him being potus.”
“The utterly horrible thing is that fool nearly became President.”
Even more horrible is that a greater fool did.
At least Bush didn’t turn us into a nation of bicycle riders…
Bush’s récord was poor. It’s hard to tell if Gore would have been worse. Presidential candidates gave been very low quality for almost three decades.
I was thinking in the context of this site–that Gore proved to be a rent-seeking public green propagandist–as evaluating him as horrid.
As far as foreign policy, Bush made the naive/stupid assumption that the Democrats would support their own policy, as stated in the Iraq Liberation Act, or stand by their votes (Hillary voted for the war). A rather bad mistake.
The greater fool is Obama, not Bush.
@ Fernando Leanme: My list is JFK, Nixon and Reagan (not necessarily in that order). They weren’t all great, but they were the best I’ve known. Clinton got lucky with the internet explosion and took ample credit for it but didn’t really do anything, he was just there when it happened.
Of course Al invented it 🙂
Right you are, Bartleby.
None of the per se “experts” in DC or anywhere else foreseen the “Dot.com Explosion” and thus the reason that both the DNC and RNC backed a “nobody” from Arkansas (Bill Clinton) for the job of POTUS …… simply because the US economy was on “fast-track” to the cesspool of socio-economic “rack n’ ruin” and Clinton would be blamed for the “stench” of it all.
But after Bill was elected POTUS …. tax monies generated by the “Dot.com Explosion” came pouring into the Treasury by the “truckload”, ….. so fast that the Politicians couldn’t spend it all and that caused a Budget Surplus for the 1st time in many years …… which Clinton got the credit for. If not for the “Dot.com Explosion” ……. Bill and Hillary Clinton would have been branded as “losers” and chased back to Arkansas from whence they came.
@Samuel C Cogar,
They should be “chased back to Arkansas” for causing the Great Recession of 2008. But Americans are as stuck on stupid about this as they are about CO2.
* Does not apply to state and local governments which must earn income in order to survive. State and local goverments (and provinces) cannot create the currency. They are income-constrained. Not so the federal government. The US Treasury issued $60.8 trillion in new US dollars in fiscal year 2015 to provision itself and pay its debts. (From TABLE-IIIA in the US federal government daily checkbook.)
I like the pun on the word “Gore” i n the first cartoon.
@ MRW
Great minds think alike.
Cheers
For the record, you can see the “fiscal balance (even surpluses)” periods since the inception of the USA on Table 1.1 here:
https://www.whitehouse.gov/omb/budget/Historicals.
Bartleby August 14, 2016 at 2:45 am wrote: “Clinton got lucky with the internet explosion and took ample credit for it but didn’t really do anything, he was just there when it happened.”
Let’s see, Clinton had the rise of the Internet on his watch and all the business activity that generated; oil was selling for $10 a barrel; thousands of companies were spending hundreds of millions of dollars in a short period of time, in order to fix the so-called “Y2K” computer problem that was due to strike after Dec. 31, 1999. Clinton had nothing to do with any of these economic stimuli. As Bartleby said, Clinton was just a bystander.
Clinton did do one thing that helped the U.S. economy: He signed the Republican bill that cut taxes, and this *did* spur extra economic growth.
About all a president can do to help the economy is cut taxes and eliminate regulations, which unleashes the U.S. economy. Anything else they do is usually negative for the economy.
The key to the U.S. economy is freeing up the free market system. The freer the market, the better it is going to do.
Perhaps President Trump can do a little budget cutting along with his tax cuts and regulation cuts. I would like to see President Trump go through the entire Federal budget line by line. Would love to hear what he had to say about all that waste.
Cutting government budgets is another thing a president can do to help the economy, but that’s a very difficult job, at least up to now. About the only way a president could do that is with a “Line-Item” veto authority, which I think he should have.
The Supreme Court has ruled that the president having “line-item” veto power is unconstitutional, but I would have to disagree. A line-item veto does not take power away from Congress, it merely add an additional step. The Congress can always override anything the president vetoes, just like they can override it now, if they have the votes. If an expenditure is important enough, then it will get the required votes.
Since the Supreme Court has ruled it unconstitutional, the Congress should pass a new law allowing the president the line-item veto. Every expenditure should have to be justified, and one budget cutter, the president, is much better than 435 members of Congress, plus tens of thousands of lobbyists.
@TA, off topic but I couldn’t resist agreeing with you, I think your solution is the absolute best first step. I know it doesn’t have anything to do with arctic ice or Dr. Ball’s most excellent essay, but I heartily agree.
Outside the liberal echo chamber, almost nobody agrees with that assessment.
Bartleby: Other than dying before he could do anything of note, what did JFK do to be considered one of your greatest presidents?
“Other than dying before he could do anything of note, what did JFK do to be considered one of your greatest presidents?”
JFK cut taxes and he initiated putting the first humans on the Moon, to name a couple of things. I don’t know that that puts him in the category of “greatest”. His life was cut short so we will never know what he might have accomplished had he lived out his full term.
The main reason JFK is so celebrated is because he is a Democrat. The Leftwing News Media promotes Democrats, and trashes conservatives and Republicans. They’ve been doing it this way for a long time.
They promote JFK and turn him into a “bigger-than-life” personality. The Left doesn’t have any really good politicians, and hasn’t had for a long time, other than Bill Clinton, to promote so they fall back on JFK when they need an ego boost. The Left has an ongoing love affair with JFK. He is the only thing legitimate they can cling to.
MarkW asks: “Bartleby: Other than dying before he could do anything of note, what did JFK do to be considered one of your greatest presidents?”
For me, JFK’s resistance to escalating the war in Vietnam was his legacy. I believe it cost him his life. That’s why he makes the list and also why Nixon, who ended that war and achieved a diplomatic solution with China is also on that list.
Bartleby
Are you ever so sure that is really the case? Sure, it is CLAIMED that way by the re-writers of history. The hero-worshipping throng who want their vision of a white knight immaculate. Instead of a corrupt womanizing son of a corrupt bootlegger who bought his nomination, bought his Chicago votes to clinch the Nov election, and who used LBJ’s crooked south Texas vote schemes to squeeze by Nixon. He was highly drugged due to back pain after his PT boat was run over by a far larger destroyer in WWII. He did well getting home after that collision.
But Kennedy was hurt badly by the soft-on-communism image. He was the one who traded image for action by backing out of the Bay of Pigs invasion, the aborted schemes against Castro before that, the loss of the entire east Germany, Czechoslovakia, Hungary, and Poland behind the wall, the spitting of Berlin by itself, the continued failure to do anything between all of those inept half-responses. He traded off our rockets in Turkey for theirs in Cuba. And deliberately made sure that trade was kept secret from the US public. Not the communists who gained.
No, the is only one private letter opposing his long years of expansion of the war in Vietnam. Everything else was driven by his ego – he could not let himself be made to look in public what he was in private. And Kennedy had shown himself to be sneaky, inept and underhanded (duplicious) in foreign affairs.
But he
great article…I wonder how much of the boundary conditions of change might be illuminated by previously classified military observations.
Regarding “He (Al Gore) never explained the difference between sea ice and land-based ice or how the former does not affect sea level”: Gore said that collapse of the ice sheet on Greenland or the one on West Antarctica would each raise sea level 20 feet. Melting them, or moving them from their land-supported positions to sea by any means would do that.
“Climate science was hijacked for the political agenda of” defeating the miner’s unions.
It was Margaret Thatcher who pushed Global Warming onto the world political stage. Had it not been for her, I doubt that many people would have paid much attention to Gore.
http://www.john-daly.com/history.htm
http://www.abc.net.au/environment/articles/2013/04/09/3732680.htm
http://www.dailyclimate.org/tdc-newsroom/2013/04/thatcher-climate-speech-119
Yes, she changed her mind later, when she was out of office and the damage was done.
She also threatened to nuke an island so it could remain an active naval base… I don’t think she had the right bolts tensioning the head.
Precisely why we shouldn’t elect a woman president… (☺)
I can think of about thirty thousand other reasons, in the present context anyway ; )
No, I blame Richard Nixon for establishing the EPA, and thus giving the greens a continuing source of funding and institutional support.
No matter what the EPA has mutated into, at the time it was needed. Real pollution was a serious problem. Unfortunately, having done such a good job of cleaning up our air and water the EPA was in danger of becoming irreverent and needed a new cause. One that by it’s very nature could not be solved or fixed.
Wasn’t Lord Monckton her climate advisor while she was in office?
NO, it was Crispin Tickell
Thanks, Dave. Much appreciated. Monckton had something to do with Thatcher, IIRC, was it to convince her she was wrong?
He was until 1986 or there abouts.
Thanks, Patrick MJD. So he didn’t have much effect. (?!?)
Your link to the “second article” leads
to
https://www.carbonbrief.org/guest-post-piecing-together-arctic-sea-ice-history-1850?utm_content=buffer489fd&utm_medium=social&utm_source=twitter.com&utm_campaign=buffer
“Most fundamentally of all, the new dataset allows us to answer the three questions we posed at the beginning of this article.
First, there is no point in the past 150 years where sea ice extent is as small as it has been in recent years. Second, the rate of sea ice retreat in recent years is also unprecedented in the historical record. And, third, the natural fluctuations in sea ice over multiple decades are generally smaller than the year-to-year variability.”
“First, there is no point in the past 150 years where sea ice extent is as small as it has been in recent years. Second, the rate of sea ice retreat in recent years is also unprecedented in the historical record. And, third, the natural fluctuations in sea ice over multiple decades are generally smaller than the year-to-year variability.”
Sorry Steve but you have no way of knowing this. You might be able to say with some accuracy about the last 40 or so years, using satellite data but 150 is off the table. You are not old enough. Anyway 150 years is considerably less than a blink of an eye on a 4.5 billion year old planet.
“Sorry Steve but you have no way of knowing this.”
Mosh was actually quoting from the linked article, which uses various historical sources to estimate pre-satellite summer Arctic ice cover. It’s obviously not as reliable as direct observation from space, and is subject to the conscious or unconscious bias of the compiler. Nevertheless it seems plausible, though unproven, that summer Arctic ice cover has generally declined from the time of the Little Ice Age
Big deal. Polar bears don’t seem to mind, the northwest and northeast passages open up occasionally, and declining summer ice opens the possibility of greater resource exploitation in the Arctic basin. At various times in the past the poles were ice-free and somehow the Earth survived. So I won’t lose any sleep over it, and I won’t try to prevent summer ice decline.
Now for something more important: what’s for dinner? 🙂
Exactly, Gary.
Plus the North Pole has only had permanent ice for the past 2.6 million years, the Quaternary Ice Age. For over 90% of the past 540 million years the North Pole has been ice free every single summer. That’s what? Half a billion summers? Clearly the end of the world didn’t come.
Plus polar bears survived the Eemian interglacial, when it is thought that the Arctic also got ice free every summer for many thousands of years. It is even possible that during the Holocene Hypsithermal the Arctic might have gotten ice free for many centuries or even thousands of years.
Javier
August 14, 2016 at 3:48 am
“Plus the North Pole has only had permanent ice for the past 2.6 million years, the Quaternary Ice Age. For over 90% of the past 540 million years the North Pole has been ice free every single summer. That’s what? Half a billion summers? Clearly the end of the world didn’t come.”
————————————-
Javier.
I am very interested to know about your above claim.
What evidence or valid data do support your above claim?
Remember there is an AGW claim and a kinda of so called hypothesis about it, based in much better and richer data and evidence….and still is no better than rubbish….
Please help me to see the validity of such a claim as yours above, enlighten me please.
What actually is the current certainty of such as claimed, and what % of consensus is at the moment about it. Is it something like 97%, OR BETTER STILL.
Do you know of any such evidence existing, or you just take it on “faith” by the source, or is it just your own conclusion?
From where I stand it seems more like your own conclusion…….
As far as I know the very definition of “ice age”, stands the way it is as a cooked up definition because there is no data or evidence of the North Pole for North Pole about such as…..
Please, if the only main evidence you can brink is the age of ice, evidence that comes from South Pole, please don’t bother to brink it up as that actually shows the opposite of claims such as yours and in close examination defaults and renders the very definition of the term “ice age” meaningless, and it contradicts the very existence of such as periods..
Looking forward for your reply.
Any little bit will help, thanks.
cheers
Gosh, whiten, I really thought this was common knowledge. Do you really don’t know when the current Quaternary Ice Age started?
Bartoli, G., et al. “Final closure of Panama and the onset of northern hemisphere glaciation.” Earth and Planetary Science Letters 237.1 (2005): 33-44.
“The Greenland ice sheet is accepted as a key factor controlling the Quaternary “glacial scenario“. However, the origin and mechanisms of major Arctic glaciation starting at 3.15 Ma and culminating at 2.74 Ma are still controversial.
The final closure of the Central American Seaway, induced an increased poleward salt and heat transport. Associated strengthening of North Atlantic Thermohaline Circulation and in turn, an intensified moisture supply to northern high latitudes resulted in the build-up of NHG, finally culminating in the great, irreversible “climate crash” at marine isotope stage G6 (2.74 Ma).”
Before that there was only permanent ice sheet in Antarctica, and before 34 million years ago not even there. There have been four ice ages in the Phanerozoic period (540 million years), but most of the time the planet has been warmer than during those periods. The time at which both poles have been frozen all year probably does not exceed 10% of total.
@Javier
Now I understand! The real culprit is the Panama canal! We’ve reopened the Central American Seaway! /joke
Javier
August 14, 2016 at 5:34 am
Javier…..
Thanks for your reply.
Let me say it again.
The AGW is more intricate and based in better data and evidence than what you offer, and still is rubbish.
Now I ask for evidence and data that you based your own specific conclusion.
So far as I can tell you offered no any.
What I will say about your offering is only in the terms of circular reasoning.
I s like you asking me why I demand evidence about AGW when every one knows about it
What you have offered is no evidence of any kind, you see because there is not such evidence from the North pole for the North pole as to support what you claim.
Again let me ask you:
What is the level or % of certainty of what claimed?
You are portraying it as a high certainty or a very high one, which in such a case with no evidence to support it.means one thing among, delusion or deception or a plain con…….
cheers
So sayith: Gary Hladik
Of course the Polar Bears “don’t mind”.
The less “sea ice” there is the better they like it.
And that is because the Seals come onshore to the Polar Bears ……. instead of the Polar Bears having to go searching out on the “sea ice” a looking to find a Seal.
What the Seal “birthing season” means to the Polar Bears is that ….. “Dinner is being served.”
whiten,
“you see because there is not such evidence from the North pole for the North pole as to support what you claim.
Again let me ask you:
What is the level or % of certainty of what claimed?
You are portraying it as a high certainty or a very high one, which in such a case with no evidence to support it.means one thing among, delusion or deception or a plain con…….”
And how would you know that there is no evidence from the North pole for the North pole as to support ice free Arctic summers for millions of years?
Have you even run a search before opening your big mouth and start talking about delusion or deception or a plain con……?
Stein, Ruediger, et al. “Evidence for ice-free summers in the late Miocene central Arctic Ocean.” Nature communications 7 (2016).
Now you can go to hell and remain an ignorant there.
Javier
August 14, 2016 at 8:23 am
“Although the permanently to seasonally ice-covered Arctic Ocean is a unique and sensitive
component in the Earth’s climate system, the knowledge of its long-term climate history
remains very limited due to the restricted number of pre-Quaternary sedimentary records.”
—————————-
Is the above the evidence you referring to, about the “wild” claim of:
“The time at which both poles have been frozen all year probably does not exceed 10% of total.” ???
Does not seem much to start with!!!!!!
And you ask:
“And how would you know that there is no evidence from the North pole for the North pole as to support ice free Arctic summers for millions of years?
Have you even run a search before opening your big mouth and start talking about delusion or deception or a plain con……?
I have no come across so far of any evidence “from the North pole for North pole, and as far as I am concerned it does not exist, that is why I asked you to enlighten me, as you proclaimed a high or very high certainty as for such as.
Second, you do not have to feel offended when I meant con or delusion.
Maybe I was not clear enough, but I was not referring to you when I mentioned the ” delusion,deception or the con…………I was referring to the subject and the situation, as per my point of view.
That what is to me a 97% certainty and consensus when not validated or forced by data and evidence, but instead exist as based in flimsy data which does not make it even as circumstantial evidence, and is hyped further more by some intricate “mind blowing” hypothesis, which never the less have no any support by any evidence……
Sorry if I did hurt your feelings….it was not my intention….if that the case.
cheers
Javier is just a Goddard clone guys. not very good for WUWT credibility
Allowing people who do not agree with generally held beliefs to comment here, is extremely good for WUWT’s credibility, I say, Steven. And yours suffers greatly (in my eyes anyway), when you act as though you don’t grasp why . .
PS ~ That is not to say I agree with him on this matter . . or approve of his behavior on this thread.
Steve Mosher quotes: “Second, the rate of sea ice retreat in recent years is also unprecedented in the historical record. ”
There’s that word again. “Unprecedented”. It causes the reader to believe historical records of rates of change in something have never been observed before, which f course is true since we have no accurate records for those data prior to 1979 when we began satellite based measurement; in fact we have never observed those rates of change, but this is because we weren’t looking, not because they haven’t happened.
We see this sort of amplification all over climate science, it’s a re-occurring theme. “Never before observed”. “Unprecedented”. Also unfortunately useless. To say we’ve never seen this before therefor it must be significant is simply a lie by omission. No emphasis is given to the fact we have no data beyond the range of instrument measures and the reader is encouraged to conclude for themselves something unusual is happening.
The historical reconstruction presented in the article simply doesn’t have the temporal resolution to make the claims it implies. It may be true that arctic sea ice extent is falling, but the implication that it is accelerating isn’t supported by the data, nor is the implication the rate is abnormal (i.e. inconsistent with natural variation).
“in something have never been observed before” should be “in something never observed before”
So funny to watch skeptics first deny that there is data. Then when data surfaces they deny the simple truth.
It’s even more funny to watch them make snap judementia about data the never even downloaded.
Mosh says: “There’s that word again. “Unprecedented”.”
————————-
I seem to recall that “unprecedented” and it’s variants are spoon fed to us by the alarmist contingent with monotonous regularity. “Hottest year ever recorded”… “unprecedented sea level rise”… need I go on?
“Steve Mosher quotes: “Second, the rate of sea ice retreat in recent years is also unprecedented in the historical record. ”
WRONG.
I quoted the article CITED BY BALL
So the good author here, Tim Ball, cited this article. His Cite.
I quote from an article he used as an authority.
You have a problem with Ball, not me.
Steve, it was you who quoted Dr. Ball’s citation. I was responding to your interpretation, which is why I wrote “Steve Mosher quotes:”
It was your quote.
How about, “never before concocted”?
So it is not true that satellite data, of a different technology than 1979 onward, was used to compile Arctic Sea ice extent measurements from 1972 until the changeover in 1979?
No, not true. Satellite measurement began in 1979. Before that (and after also) sea ice was measured using aircraft like the C-130 I mention. We had other planes in the air doing recon but the real records begin in 1979. Prior to that it’s all ship logs to the best of my knowledge. A very few ground stations.
Sorry Steve, why is it you think I wasn’t able to download the data again? And why do you think records prior to 1930 have temporal resolution equal to the instrument record today? The charts shown very clearly show a resolution change, it should be obvious to anyone familiar with data like these, it certainly is indicated. The author goes to some length to describe the missing data and how it was filled in and adjusted. I don’t believe ‘ve jumped to any conclusions.
If you’d prefer, I could provide snark also, but it doesn’t seem very productive. I’m not a “denier” by the way, I’m a former member of both NOAA and NASA and have actively collected arctic sea ice data for those organizations aboard a research platform now known as NCAR’s EOL as I mention later in this thread.
I’d not only be happy but actually interested to review the raw data if you happen to have access to it. Do you? I didn’t see the source mentioned in the article you cited, which is coincidentally why all I have to go on is the author’s fairly detailed description of its quality.
Just to give a concrete example in support of Dr. Ball’s observations;
In 1979 I was given the task of moving the EOL (then called the NERDAS), which is a C-130 equipped with an array of downward looking radar that was deployed in flight through its clamshell loading doors, from our facility at Johnson Spaceflight outside Houston to its new home at Ames Research Center, Moffett Field CA.
The NERDAS platform employed a nine track PCM recorder to collect data from the sensors. One of my tasks was to figure out how to integrate that data collection system with the ground based data analysis facility at Ames I worked in. I also flew on the lab during several arctic surveys. I can testify to the fact that joining all of these disparate measures is both difficult and error prone.
I have over 500 hours on NASA’s Kuiper Airborne observatory and was a member of a team led by Dr. Charles Townes (Nobel Laureate) that mapped the central parsec of our galaxy in the infrared spectrum. I served aboard the Galileo II, an airborne lab operated by NASA (Convair 990) under the direction of NOAA and was among a small group who flew that lab through the Mt. St. Hellens plume during the May 1980 eruption collecting data on the ejecta. I also had the privilege of serving on an unnamed Lear jet during a series of expeditions performed by NOAA collecting data on clear air turbulence under the direction of Dr. Peter Kuhn.
My interest in this subject is professional Steve and I was serious when I offered to look at the data. I’m qualified to do it and I’m also qualified to critique the article quoted.
It’s even more funny to watch them make snap judementia about data the never even downloaded.
That assemblage of letters “judementia”; is it an actual word, and if so, what is it supposed to mean? It sounds like an antisemitic slur or a failed attempt to sound like the smartest guy in the room. Or could it be a pretentious way of saying “judgement”?
I know Mr. Mosher has BA’s in both English Literature and Philosophy, but do US academics really talk like that? And can you imagine the fuss if Donald Trump were to utter it?
Map of some of the Arctic Expeditions (in non-ice-breaker ships).
Look at Nansen’s trip in 1893 !!! Not a chance anyone could make this trip today in a non-ice-breaker.
All these reconstructions from the NSIDC and Walsh and Mosher are garbage.
https://en.wikipedia.org/wiki/Nansen%27s_Fram_expedition
http://media.web.britannica.com/eb-media/82/64882-004-CCF232EA.gif
The science is settled, only the data is uncertain. — Eugene WR Gallun
Denying made up data is not denying the existence of data.
Bill Illis August 15, 2016 at 5:41 am
Map of some of the Arctic Expeditions (in non-ice-breaker ships).
Look at Nansen’s trip in 1893 !!! Not a chance anyone could make this trip today in a non-ice-breaker.
Do you know what you’re looking at? Nansen didn’t need an ice breaker then and you wouldn’t need one now! All you need is a ship you can freeze into the ice without being crushed.
And the patience and non-schedule and money and food and energy to survive 2 years up there.
it is NOT commercially viable unless yo can predict the route and the time and safety 4 weeks in advance, unless you can show valid year-long cost savings in fuel, time, and outside expenses … And renting an icebreaker ain’t cheap.
“First, there is no point in the past 150 years where sea ice extent is as small as it has been in recent years. Second, the rate of sea ice retreat in recent years is also unprecedented in the historical record.”
Mosh is good at what he does, which is a red herring farmer. Notice how he implies that the historical record is 150 years? It is not. He and his ilk pretend that the “historical record” for Arctic ice began in 1979, when Arctic ice was at its recent high. There are record back into the 1950’s, but these are never mentioned. And, ANTArctic ice is never ever allowed to enter into the discussion.
Give the man his props, he does earn his money, egregious as his profession may be…
“Notice how he implies that the historical record is 150 years? It is not.”
__________
He refers to claims made in a reconstruction recently published in peer reviewed literature: http://onlinelibrary.wiley.com/doi/10.1111/j.1931-0846.2016.12195.x/abstract
That group added new data from contemporary newspaper reports, ship observations, aircraft observations, diaries, aerial surveys, Canadian and Danish maritime observations, whaling ship logbook records and more to the already extensive records used by previous groups.
Obviously these aren’t as concise as data derived from passive microwave sensors on satellites; but together they still appear to provide a useful and consistent account of Arctic sea ice margins going back as far as 1850.
As Steven Mosher states, the group found that: “… there is no precedent as far back as 1850 for the 21st century’s minimum ice extent of sea ice on the pan-Arctic scale….” Also, “The rate of retreat since the 1990s is also unprecedented…”
Anyone is free to examine the data this group used (it’ all available) and challenge their findings in the normal way.
“… there is no precedent as far back as 1850 for the 21st century’s minimum ice extent of sea ice on the pan-Arctic scale….”
So What? 1850 was at the end of the LIA. Why would it be surprising that Arctic sea ice would be more extensive than today, or any time since? Same can be said for most land-based glaciers.
DWR54,
The article in your link is only available to buy.
BobM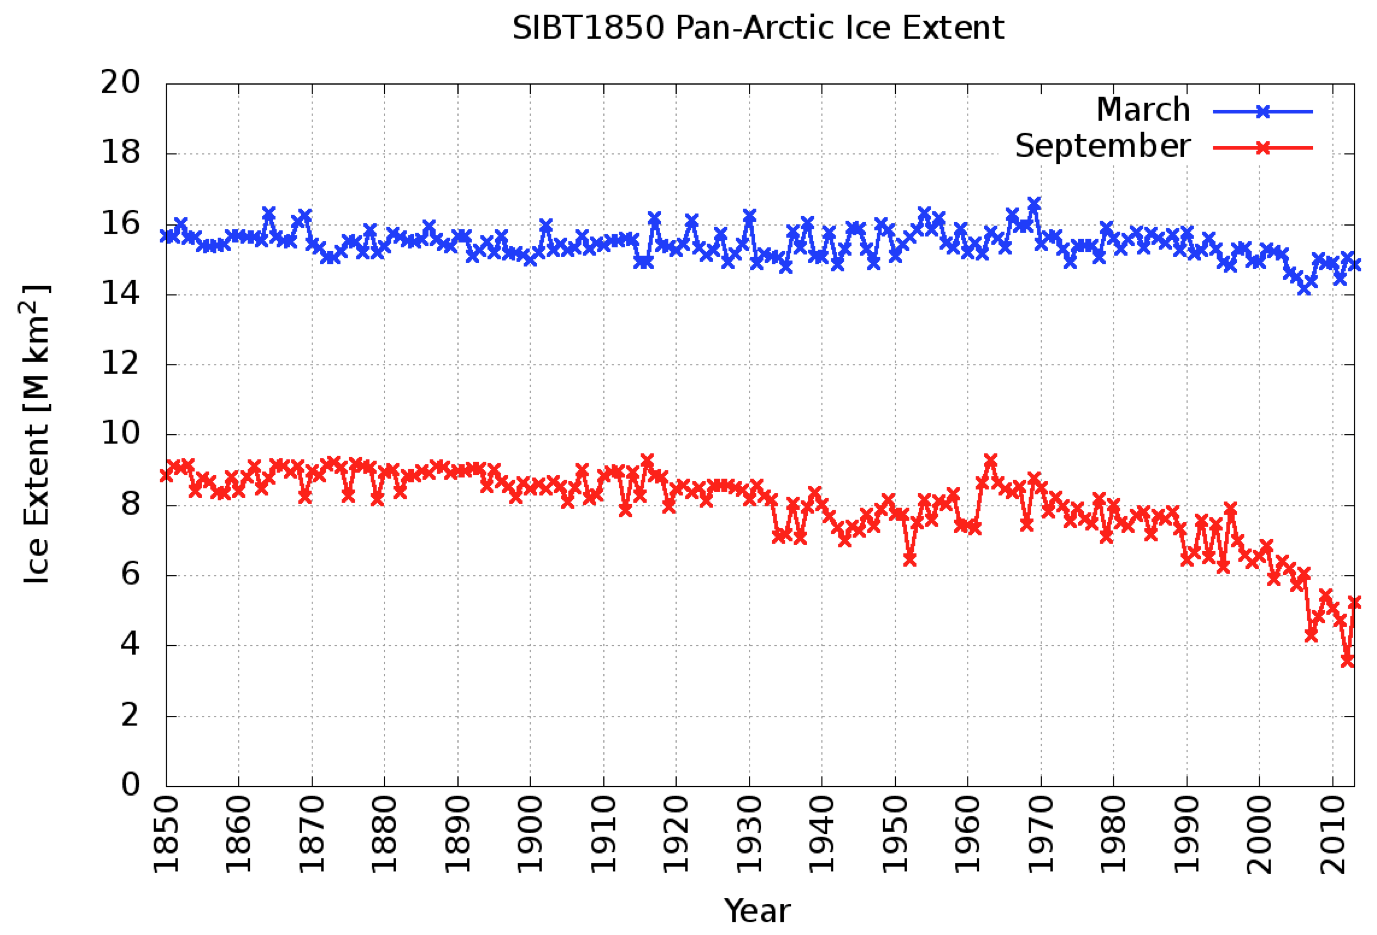
“So What? 1850 was at the end of the LIA.”
_____________________
According to the Walsh et al. paper the reduction in minimum Arctic sea ice extent isn’t linear over the course of the record since 1850. As they state in the abstract, the rate of retreat since the 1990s is “unprecedented”. This is clearly seen from their chart at Fig. 8:
Oldseadog
“The article in your link is only available to buy.”
__________________
Yes, sorry about that; it’s new research. All the quotes I used are from the article’s abstract, which is available at the above link. Such articles can usually be accessed for free by anyone with a university registration; so if it contains flaws then no doubt these will be discovered by other academics and a rebuttal or comment published.
denniswingo
“Variability was just as great in the 1960’s if not greater.”
__________________
Variability in the 1960s is clear from Walsh et al. 2016 fig 8 (above link). The difference is that in the 1960s variability was 2-way. Minimum Arctic sea ice extent both increased and decreased over the 1960s; though the minimum never fell below 7 m/km^2 and extent looks to have increased slightly overall in that decade.
By contrast, the trend since the 1990s is strongly downwards. Minimum extent first (or since 1850 at any rate) fell below 6 m/km^2 in 2002 and has remained below that level since 2007. (It’s already well below 6 m/km^2 in 2016.)
Incorrect.
Variability was just as great in the 1960’s if not greater. Compare Nimbus I, II, and III AVCS and HRIR data.
Steve, rather than debate the quality of the data based on access to it, which I’ve found very difficult, I’ll rebut your comments on unprecedented rates of change using a direct quote from the database users manual:
That quote can be found in the users manual in section 8.5 “Discussion”. For me, being a person who specializes in real-time data acquisition and analysis, says the data before 1979 is pretty much junk.
The data is at:
ftp://sidads.colorado.edu/pub/DATASETS/NOAA/G10010/
But it doesn’t unpack.
Well, it unpacks but it’s in a proprietary format, illustrating Dr. Ball’s point rather well. Data published in anything other than CSV/TSV format really isn’t too useful.
The proprietary format requires Java 7, which does not run on Mac OS 10.6. Sigh.
There is a very good reason to publish raw data in CSV or TSV format. NOAA apparently have hired morons and there’s no help coming.
Effectively, there is no way to read the actual data. The only choice is to use NOAA’s data viewer. It’s their way or the highway and you will see exactly what they intend for you to see in the way they intend you to see it. Professionally, I would not be able to trust any of this at all.
Mosher; according to 21st century settled science, at current CO2 levels the arctic should be ice free and global temperatures should be increasing at three to five time the rate that is being measured. Could you please show us more bullocks-science that shows how observations are wrong according to cAGW science?
Prior to 1970, we had pretty much no idea how much sea ice there was in any given year.
Notice how the troll assumes that past guestimates are unfiltered truth.
I’ve watched documentaries on TV which included footage of Polar Bears swimming underwater. As soon as the bears stopped swimming they bobbed to the surface like a submarine blowing all its ballast tanks. Their hollow hair make them practically unsinkable.
A few years ago, around Christmas, that “esteemed” geneticist (specialty: Fruit Flies) and self-proclaimed climate expert, Dr. David Suzuki, told Canada’s children that Santa Claus would soon not have a home because the ice at the North Pole was melting – what a nice man! This is the same nitwit that told Canadians they shouldn’t expect a higher standard of living AND should have fewer children (average number of children per couple in Canada – 1.7). Meanwhile this hypocrite, Canada’s Al Gore, owns FOUR homes and has begat FIVE children – what a special man!
Suzuki has also appeared in a recent internet and TV video put out by the Liberal government in Ontario (at taxpayers’ expense) advertising their “Climate Action Plan”. They figure they can soften taxpayers up for their coming Carbon Tax. Anyway, Suzuki is seen in the video talking to an auditorium full of obviously terrified children warning them of the dangers of Global Warming. Behind Suzuki on a screen are pictures of a cartoon Beaver and Deer with the caption below the animals warning they would soon not have a home because of global warming – what a terrific man! The video finishes with a warning to adults not to leave the problem of Global Warming to their children.
The Liberal government forgot to mention that they have managed to increase Ontario’s debt from $138 billion to $300 billion in the last twelve years. Who do you think is going to get stuck with that enormous bill? That debt increase has happened despite the Liberals burdening taxpayers with the two single largest tax increases in Ontario’s history (Health Care “levy” and the HST). There will soon be a third when they implement their world-saving Carbon Tax. That’s on top of their foolish “Green” energy program that has been the main reason Ontario’s electricity rates have doubled over the last ten years and cost the province 300,000 manufacturing jobs.
Suzuki is a great front man. I stopped paying attention to him when he did an show on the formed concrete house for CBC in the early 80’s and didn’t understand how heat worked.
@ prj, “Suzuki is a great front man” . No sorry Suzuki is a great con man, driving around in diesel smoke spuming buses and ,yes, has besides 4 kids a large group of grand-children.
Do as I say,….
I can tell you why the bears are florishing, hunting was banned in the mid 70’s. Why the ice is thickening I do not know.
Polar bear hunting has never been banned, just some methods. Now if u think harder maybe u can expound on thicker ice.
The indiscriminate hunting has been stopped. You now require a tag to shoot one.
Love the article.
Can we get on to the next item on the agenda?
http://scrippso2.ucsd.edu/
This ship’s life support system is starting to fail.
Why would you put an O2 measure station on Mauna Loa? And active volcano. As in actually erupting via Kilauea Iki for decades.
Mauna Loa is not active. And it is not down wind of Kilauea, which is active. Facts, please, Pat.
Thanks, prjindigo . . the plot also thickens ; )
“This ship’s life support system is starting to fail.”
Running out of vodka?
Sorry, reposting http://scrippso2.ucsd.edu/ forgot I have to explain the link.
In the time period in which atmospheric CO2 has been going up about 5ppm per year, atmospheric oxygen has been going down 19 per meg per year. When I say 19 per meg I mean that 19 of every million O2 isn’t returning to the atmosphere per yearly cycle: Not 19ppm… 91ppm per year.
That chart shows atmospheric O2, the thing that slows and diffuses sunlight before it can get to the surface and is part of the reflective albedo of the planet, depleting at 91ppm per year.
I think the entirety of the focus on CO2 is – by precise meaning of the word – retarding science.
At approximately 100 ppm decrease per year, the loss of atmospheric oxygen is decreasing rapidly in geological time. In 10,000 years there would be none left. (I know that probably isn’t the way it really works.) Anyway, if it is true, it is something we should consider.
One of the articles I read said that oxygen is 21 percent of the atmosphere and
That’s not much of a margin. This article gives oxygen deficiency at 135 mmHg (about 18%). Still not much margin. It implies that we could have trouble breathing in as few as 1000 years.
The thing is that people live at high altitudes. link
People live above 5000 m. The partial pressure of oxygen at that altitude is way less than 135 mmHg. I realize that people acclimatize, but it still seems puzzling.
Some people acclimatize. Some just die. Truth is not a number.
…
the loss ofatmospheric oxygen is decreasing rapidly in geological time.It’s sort of a complicated formula Bob, divers use 15% (.15 ATA or “atmospheres absolute”) O2 as a minimum, 16% for safety. We also believe unconsciousness happens at about 12% (.12 ATA). Those figures are for normobaric (mean sea level) exposures.
At 1.6 ATA, oxygen becomes toxic and it really is more informative to discuss the partial pressure of O2 rather than the percentage. Doing the formulas in my head from memory, 21% is .21 ATA 🙂 We have a wide range of tolerance for oxygen, basically between .21 ATA (normal MSL) and 1.6 ATA (100% oxygen at about 20 feet below MSL in water). We use pure oxygen for accelerated decompression at 20 feet. Exposure time is also a factor. Military divers have been observed to withstand much higher exposures for short periods of time before experiencing convulsions (oxygen toxicity).
There are only two settlements that high in the world. Probably because of temperature more than O2 though.
Yer figurin’ needs work. O2 concentration is fine.
Not all species need to be protected, a case in point being Polar bears.
https://thepointman.wordpress.com/2011/09/15/polar-bears-going-extinct-yawn/
But some species cannot be prevented from going extinct. eg Pandas.
https://thepointman.wordpress.com/2012/10/12/green-myths-we-must-conserve-everything/
Pointman
I remember reading somewhere that there are three species living today that have change their diet from Herbivore to carnivore/omnivore or vice-versa. Humans have changed from herbivore to omnivore which hasn’t caused any major issues apart from making the appendix virtually redundant. Pandas has changed from carnivore to herbivore and live on a restricted diet, this has caused major issues as their gut is inefficient at processing bamboo. I don’t know what the third species is/was.
I’m not entirely sure how accurate this is, but if true Pandas have done well to survive at all.
Maybe the third species you are talking about is/are Koalas. Their diet consist mostly of eucaliptus leaves.
It’s pure speculation on my part, but when you consider they’re one of the few if the only (?) animals that specialise in eating bamboo and the female’s fertility interval is 2-3 days in the year, it does suggest that long ago their numbers exploded because they had adapted to a food source that was exclusively theirs. In response and because of overpopulation causing over grazing, evolution favoured cutting down the fertility window. Once the vast forests of bamboo disappeared, they been adapted into a dead end.
Pointman
HA, and it’s pure speculation on my part, but, IMO, there is “living” proof that the Antarctica coastline was pretty much ice-free many eons ago. And that “living” proof is the emperor penguin (Aptenodytes forsteri).
And the factual evidence for justifying said “living” proof is, …… to wit:
Cheers
Sea ice is a very easy subject to lie about. There is simply no way to even guess historical levels other than anecdotal prior to 1974. And those early years are inexact. We know the Vikings might have and likely the Inuit had traversed the Arctic sea during a favorable period. web have some sailing accounts from the 1700s onward. But that is all.
Easy to make up stuff.
One of the few places where Arctic Sea ice can expand outside the Arctic basin is towards Iceland.
It is interesting to look at the Icelandic sea ice index, which essentially measures sea ice around Iceland.
As you can see, the 1970’s was a time of EXTREME sea ice levels, up there with the tail end of the LIA.
No wonder this is where the Arctic sea ice Worriers choose to start their trend.
AndyG55 on August 14, 2016 at 1:11 am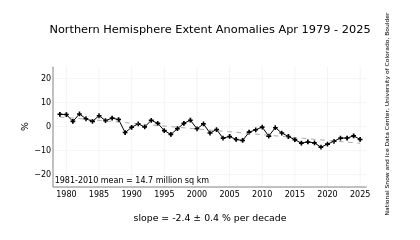
No wonder this is where the Arctic sea ice Worriers choose to start their trend.
That’s the usual blah blah. What about facts?
To discuss about sea ice around Iceland is the perfect cherry-picking: nearly everything there differs from the overall arctic context.
And that chart is just a cherry picked period to show linear decline, since we have ice data from earlier periods. See my graph below.
https://wattsupwiththat.com/2016/08/13/arctic-ice-an-update-evidence-from-the-past-is-instructive/comment-page-1/#comment-2277382
Sorry Javier… you didn’t understand the point here. I just wanted to show what happens when you go out of both Iceland and its cold 70ies.
You want more, a bit back into the past? No problem.
Here is for example: http://nsidc.org/arcticseaicenews/files/2016/08/Figure6-350×413.png
http://nsidc.org/arcticseaicenews/files/2016/08/Figure6-350×413.png
Figure 6. These graphs show a best estimate of ice extent and sea ice departure from average for the period 1850 to 2013. The top figure shows winter and summer.
Credit: NOAA at NSIDC
As we can see, the long range winter average shows fewer decline than the summer average.
But the text beneath the pictures
https://nsidc.org/data/seaice_index/
speaks for itself:
« Earlier this month, NOAA at NSIDC published a new compilation of Arctic sea ice extent using a variety of historical sources, including whaling ship reports and several historical ice chart series from Alaska, the Russian Arctic, Canada, and Denmark. The compilation provides a synthesized mid-monthly estimate extending back to 1850. The study concludes that the current downward trend in sea ice has no precedent in duration or scale of ice loss since 1850. With the exception of the Bering Sea, none of the areas have seen sea ice extents as low as in the past decade. Historical periods that show a decrease in summertime sea ice extent in the Arctic, such as the late 1930’s and 1940’s, are smaller in magnitude than the current downward-trending period. »
That’s no good for going a bit back into the past. That reconstruction is as good as its sources and the reconstructors’ bias.
What we do know is that the North East Passage was navigated in 1878 by Nordenskiöld and Palander, a feat that a climatic expedition The Polar Ocean Challenge is having problems to reproduce this year. Probably there was more ice in the late 1870’s than now, but it is hard to think that there could have been A LOT more ice. There have been epochs when you needed an icebreaker to go there, and epochs when navigation was done without them.
Therefore I am highly suspicious of that reconstruction’s straight line until 1980. Arctic sea ice is known to have oscillated before. The evidence is conclusive.
Bindidon,I see that you picked the high point of the entire 1970’s to start the chart. There are more Satellite data back to 1973,that shows a much lower level.
Well Sunset: what about having a second look at the chart? I see it rather starting with the 80ies.
But look at the chart below: it starts with 1850.
Javier on August 14, 2016 at 6:51 am
Well Javier… slowly but surely I begin to understand that
– all data you present is above any suspicion;
– the rest is always biased.
That’s a bit too easy, isn’t it?
Bindindon,
The reconstruction that you have posted from 1850 by NOAA and NSIDC has not been subject to peer review nor published in the scientific literature to be contrasted and evaluated by other experts.
So you pretend that unpublished data should be trusted over published data?
That’s an original yet unscientific point of view.
Muy bien Javier! I see you moving from “all biased” up to “not peer-reviewed”. That’s real progress.
But… Did I ever hear you complain about UAH’s transition from 5.6 to 6.0beta[inbetween 5] awaiting peer-review since now about 15 months?
I guess no :-))
As Sunsettommy says, the satellite data actually go back to 1973. This data was shown in the IPCC 1990 FAR and it showed the early 1970’s to have significantly less Arctic ice extent than the seemingly cherry picked 1979 starting point now in vogue. The chart posted by Bindidon does not show the early 1970’s arctic ice extent being significantly less than the 1979 “official” satellite record extent leading to skepticism about the entire chart prior to 1979. But then I do not trust NOAA / NSIDC to produce unbiased science.
Javier August 14, 2016 at 6:51 am
What we do know is that the North East Passage was navigated in 1878 by Nordenskiöld and Palander, a feat that a climatic expedition The Polar Ocean Challenge is having problems to reproduce this year.
Nordenskiöld wasn’t able to complete the journey in a single year and was iced in for nine months and didn’t reach the Bering strait until summer 1879. The Northabout is ahead of Nordenskiöld’s timeline so far and should easily make it into the NW Passage this season.
Robert Austin on August 14, 2016 at 10:12 am
What about reading my comment a bit more carefully?
It was an answer to AndyG55 on August 14, 2016 at 1:11 am
who was complaining about exactly what you missed in my comment:
As you can see, the 1970’s was a time of EXTREME sea ice levels, up there with the tail end of the LIA. No wonder this is where the Arctic sea ice Worriers choose to start their trend.
After having read his comment, I searched for a chart starting later… and that was wrong too 🙂
Skeptics simply doubt about everything other skeptics doubt about.
yes there is: we have detailed soviet, Danish, US Navy, Alaskan, whaling fleet info – and now this has all been collated:
https://www.carbonbrief.org/guest-post-piecing-together-arctic-sea-ice-history-1850
I don’t think the bears are up on the ice out of curiosity. They are using high vantage points to look down into the water for seals to hunt.
Of course. And other bears.
Once again Dr. Ball you’ve written an outstanding (and entertaining) expose of the real state of climate science. I had no idea you were former SAR and a submariner to boot. Well done!
I spent a few months on a NASA assignment that took me over the pole with downward looking sensors. It was known as NERDAS at the time (bad acronym in my opinion), now NCAR’s EOL (Earth Observing Laboratory). We spent quite a bit of time collecting data on arctic sea ice back in the 70’s before the satellites went up and I can sympathize with your frustration. There weren’t any standards for how data were collected, what data were collected or how they were reported (and to whom). The general public probably doesn’t have any idea just how difficult it is to join all this stuff in a meaningful way, or how much opportunity there is for creative interpretation.
I don’t think they can catch the seals in open water.
I think you’re right I’ve never heard that they can catch a seal in the water. link
On the other hand, they show great interest in people. Not many people have been killed by polar bears but we did have to take a polar bear seminar and we did have to carry guns.
Unfair comparison with a weather related Arctic sea ice minimum in 2012. One gets bad reputation for cherry picking for comparisons.
Arctic sea ice has been essentially stable since 2006, with good years and bad years (you decide what is good for you, more ice or less ice). Alarmists aroused due to the 2006-2012 reduction. It is sad to see skeptics arousing because of the 2012-2016 increase. We are supposed to be the science based ones that know about statistics.
Arctic sea ice has been reliably reconstructed since 1930s, and there are three main hypothesis going forward to 2050:
http://i1039.photobucket.com/albums/a475/Knownuthing/SeaIceProjections_zps38qjgzc6.png
The alarmist hypothesis of Arctic death spiral (Mark Serreze) is already looking very bad.
The IPCC hypothesis of continuous non accelerated Arctic sea ice reduction is still on target.
The Arctic sea ice-AMO linked hypothesis is still on target too and if true should show a significant deviation from the IPCC hypothesis in about two decades.
Whose reconstruction is that?
Pirón, M. Á. C., & Pasalodos, J. A. C. (2016). Nueva serie de extensión del hielo marino ártico en septiembre entre 1935 y 2014. REVISTA DE CLIMATOLOGÍA, 16.
“Since 1979 satellite-borne passive microwave sensors have provided a continuous and consistent record of Arctic sea ice extent, showing a significant downward trend, particularly at September, when Arctic sea ice reaches its annual minimum. Records before 1979 exist, but are not consistent with the satellite record and have limited reliability, specially before 1953. We present a new time series of September Arctic sea ice extent from 1935 to 2014 that includes data for the Siberian sector not used previously in the Arctic wide existing time series. The new record has been adjusted to be consistent with satellite data. The trend for 1935-2014 is -3.5% decade, while the trend for the satellite era is -13.3% decade. However, the trends since 1935 until early 1980s are positive and statistically significant. The trends turn negative in the 1990s, reaching statistical significance from 2006 onwards. The lowest annual minimum in the pre- satellite era is higher than any annual minimum after 2001.”
Their reconstruction agrees very well with that of:
Meier WN, Stroeve J, Barrett A, Fetterer F (2012): A simple approach to providing a more consistent Arctic sea ice extent time series from the 1950s to present. The Cryosphere, 6:1359-1368, doi:10.5194/tc-6-1359-2012.
As their figure 5 shows.
And it is entirely within the 10-90% band of IPCC estimate from the IPCC figure.
The big new thing in this so called “reconstruction” is the inclusion of the Russian AARI dataset. You can have a look at those data here:
ftp://sidads.colorado.edu/pub/DATASETS/NOAA/G02176/pngs/
Check a few years in the 30’s or 40’s and you will see how abysmally bad the data actually are. And remember, the data for the Canadian side are much worse. At least the Russians were traversing the Northeast Passage annually after 1933, so we have at least one observation at each point along the shipping route per year. In Canada this didn’t happen until the 70’s when there was already satellite data.
Strange b the way that nobody seems to be interested in the Norwegian ACSYS data:
http://www.climate-cryosphere.org/resources/historical-ice-chart-archive/quicklooks
Since this is by far the most comprehensive dataset for the North Atlantic area.
They not only include the AARI dataset. They also adjusted the 1953-1978 HadISST data for consistency of the overlapping period 1972-78 using satellite data and the Cavalieri series. They checked the consistency with Arctic temperatures for the entire series and it is a lot more consistent than previous attempts.
The AARI charts were compiled from a variety of data sources, with heavy reliance on regular reconnaissance flights for most of the series until 1992, so it is not a question of ship observations only. They have reconstructed only September data, that has the highest coverage.
They have followed published procedures and their result agrees well with observed multidecadal oscillation in Arctic temperatures and climatology according to Polyakov et al. 2003 and Miles et al., 2014.
Do you have anything better for the pre-satellite era?
Hi Gerald, I’m one of the authors of that reconstruction (our reconstruction is just the black line; the rest of the graph has been made by Javier).
I’d like to point out that our reconstruction is fairly similar to the recently published Walsh dataset:
I think our reconstruction is somewhat more consistent because we have adjusted the data to match the passive microwave numbers (Walsh et al. are aware of the ‘jump’ at the beginning of the satellite era, so they are planning to address that with a new version).
PS1: during the satellite era, we use NSIDC Sea Ice Index monthly means (http://nsidc.org/data/docs/noaa/g02135_seaice_index/index.html ) , whereas the new Walsh dataset uses G02202 mid month daily values ( http://nsidc.org/data/docs/noaa/g02202_ice_conc_cdr/index.html )
You can read more about our reconstruction here: http://neven1.typepad.com/blog/2016/01/september-arctic-sea-ice-extent-1935-2014
Cheers
It seems reasonable in a warming climate to anticipate continued warming and I certainly hope the models are predictive, but they’re only models (credit to Terry Gilliam). Since we really have no idea at all about what causes glacial and inter-glacial climates, it seems a WAG at the very best.
“Arctic sea ice has been reliably reconstructed since 1930s”
Would you mind explaining how that was accomplished since not one single ship went through the Northwest Passage (nobody even tried) between 1906 and 1940. There were two voyages in the forties, four in the fifties, eight in the sixties. Rather sparse data I would think.
Reconnaissance flights and Iceland records.
I’m sorry Javier, but I have serious difficulty with the idea of arctic reconnaissance flights between 1906 and 1940.
Bartleby, the reconstruction starts in 1935.
Javier, the question you responded to asked:
“Would you mind explaining how…between 1906 and 1940”, setting the range. You explained “Reconnaissance flights”. Wright Bros. 1903. Not likely. Since I did reconnaissance flights personally in the 70’s it gave me a little heartburn. I don’t believe that’s a reliable source. The Iceland records are sparse.
Bartleby, I only said mid 30s. Tty was the one that brought 1906 up.
The following is extracted from the AARI database at NSIDC:
“The charts were compiled from a variety of data sources, with heavy reliance on regular reconnaissance flights for most of the series until 1992.”
https://nsidc.org/data/docs/noaa/g02176_aari_charts/
Whether you trust or not that data and reconstruction is up to you. I have nothing to say about that.
Larsen captained the St Roch throughout the NW passage from 1928 onwards.
“Larsen captained the St Roch throughout the NW passage from 1928 onwards”
No, he didn’t. St Roch stayed in the Western Arctic (mostly Amundsen gulf) until 1940. Read Larsen’s book. He wanted to try for the passage for many years but the RCMP wouldn’t let him. The Hudson Bay company did send a few supply ships to Cambridge Bay from the east in the 30’s, so there may be a very few data points along the southern route, if the logs have been preserved. There is however no data from these ships in the contemporary DMI sea ice data from the 30’s since the HBC was very secretive about its operations.
Arctic reconaissance flights only started post WW2 as part of the “Cold War”. In any case no aircraft capable of the kind of range needed for such flights even existed before the war, and no bases for them to operate from either.
tty August 15, 2016 at 9:17 am
“Larsen captained the St Roch throughout the NW passage from 1928 onwards”
No, he didn’t. St Roch stayed in the Western Arctic (mostly Amundsen gulf) until 1940.
I was replying to tty’s comment below, which suggested that because the NW Passage wasn’t completely traversed between 1906 and 1940 there could be no data on the state of the ice.
The St Roch traversed the NW Passage from 1930-34 between Coronation Gulf and Herschel Island, and was stationed in Cambridge Bay from 1935-38, that certainly qualifies as operating in the NW Passage!
Of course there were also supply ships such as the RMS Nascopie sailing the NWP, in fact in 1937 the Nascopie sailed from the east into Bellot Strait where she met the HBC Aklavik (based in Cambridge Bay) which had sailed there from the west.
tty August 14, 2016 at 12:28 pm
“Arctic sea ice has been reliably reconstructed since 1930s”
Would you mind explaining how that was accomplished since not one single ship went through the Northwest Passage (nobody even tried) between 1906 and 1940.
“The St Roch traversed the NW Passage from 1930-34 between Coronation Gulf and Herschel Island, and was stationed in Cambridge Bay from 1935-38, that certainly qualifies as operating in the NW Passage!”
Yes, and so does operating a motorboat in Point Barrow. However St Roch did not operate throughout the NW passage as you claimed. And the lack of data in most of the Parry Archipelago for the 30’s is actually absolute. For example as far as I can determine St Roch in 1944 was the first ship ever to traverse the Melville Strait successfully and the first to even try since McClures expedition in 1851-53.
Take a look at the contemporary DMI sea ice data:
ftp://sidads.colorado.edu/DATASETS/NOAA/G02203/
There is extremely little data from the Parry Archipelago. As I said before, this could be improved a bit by using data from RCMP and HBC (if the latter still exists). It is also worth noting that even as late as this parts of Boothia Gulf, Foxe Basin and Cumberland Sound hadn’t even been mapped, so you can guess how much was known about the sea-ice state there.
Its a bogus chart. plotting Piomas on the wrong chart and using an expotential fit when that is unphysical
You are wrong as usual, Steven, because you don’t bother to read. It is a published 1935-2014 September Arctic Sea Ice extent reconstruction with which you can agree or disagree, but cannot call bogus. It is therefore the right chart.
The exponential decay of Arctic sea ice has been defended by several “expert” cryologists that have variously predicted a forthcoming Arctic free of ice, like Maslowski, Serreze, and Wadhams. Go take your quibbles with them.
Javier writes: “It is a published 1935-2014 September Arctic Sea Ice extent reconstruction”
Whoa here, are we on the same page? The NOAA dataset I was looking at went back to 1850.
Same page different thread.
you call it “AMO model” but the period of the “oscillation” that you put is much larger than that of the observed AMO and not in phase. Also, magnitudes should be similar in 1940-1950 and 2000-2010….
Your fit has nothing to do with AMO…
Your opinion is not supported by evidence.
http://i1039.photobucket.com/albums/a475/Knownuthing/amo2_zpsju5oxkfp.png
Ooooh. What a beautiful plot you show me. Thank you. The problem is that the index is sensitive to (global) warming… So you will always have an increase if you do nothing to correct that.
https://en.wikipedia.org/wiki/Atlantic_multidecadal_oscillation#Definition
Are you trying to fool me ? Why ?
You have changed your tune. You said;
“the period of the “oscillation” that you put is much larger than that of the observed AMO and not in phase.”
The period is exactly the same and both are in phase.
“Also, magnitudes should be similar in 1940-1950 and 2000-2010”
No they shouldn’t. You don’t distinguish between a climate signal and a detrended index.
And now are you saying that because the sea is warming and the ice is melting, the relationship between both is spurious? And that to see the relationship between both is better to remove the warming from one?
Curious ideas to say the least.
The “AMO fit” in the first plot has nothing to do with the AMO evolution of the second plot. For sure, the AMO index evolution in the second plot has a global warming component that should be removed. Maybe this component just affect the index. Maybe it affect the AMO. But in the latter case, it’s still anthropogenic.
For sure the AMO fit of the first plot is misleading. For sure, climate models underestimate slightly the arctic sea ice decrease. Also for sure, CO2 warms, and warming leads to sea ice decrease everything else being unchanged.
Toncul,
I see you still don’t get it, so I’ll try using simple phrases.
The Atlantic Multidecadal Oscillation, AMO, is an observed oscillation in North Atlantic surface temperatures.
For convenience those temperatures are detrended to produce the AMO index. The AMO index does not exist, it is an artificial construct. The AMO index is not the AMO.
The AMO, as everything else in the planet with the exception of the Stratosphere, shows a warming trend. The evolution of Arctic sea ice also has a temperature dependence as it is obvious, so the ice data contains a warming trend.
If you want to compare the AMO evolution with Arctic sea ice evolution, you don’t use the AMO index because it is detrended. If you use the AMO index you would have to also detrend the Arctic sea ice data. Otherwise you are comparing apples to oranges. Do you get it?
OK. There is no “AMO fit” in my first graph. It is clearly labelled “AMO model”. That curve does not use any AMO data.
The AMO model is not my invention, it is in many scientific publications stating that Arctic sea ice depends on AMO. For example:
Miles, Martin W., et al. “A signal of persistent Atlantic multidecadal variability in Arctic sea ice.” Geophysical Research Letters 41.2 (2014): 463-469.
http://folk.uib.no/ngftf/CV/PDF_Furevik/miles_et_al_grl_2014.pdf
It is actually part of a more general hypothesis called the “Stadium wave hypothesis” by Marcia Wyatt, that links several oceanic and ice oscillations all over the world:
Wyatt, M. G., & Curry, J. A. (2014). Role for Eurasian Arctic shelf sea ice in a secularly varying hemispheric climate signal during the 20th century. Climate dynamics, 42(9-10), 2763-2782.
http://wyattonearth.net/images/10Wyatt_Curry_2013_GaTech_Press_Release.pdf
If the AMO model is correct, it means that not only are wrong the alarmists Maslowski, Serreze, and Wadhams, and there will be quite a lot of summer Arctic ice in 2040, but also the IPCC is wrong and there would still be quite a lot of summer Arctic ice come 2080, maybe as much as in 2012. That is if global warming lasts until then.
The AMO model in my graph is simply a sine curve of the right amplitude and periodicity and with the right downward trend to fit past Arctic sea ice data. It is just an approximation to show why IPCC has also got it wrong and that the expected deviation from IPCC is expected to be very noticeable by 2050.
The “AMO model” in the first plot has nothing to do with the AMO index and even with the one of your second plot : the period of your “AMO model” is greater than 100 years in the first plot. It’s not AMO, it’s NOTHING. That plot is misleading.
Also, in your AMO index plot, there is an anthropogenic component, you can’t claims it is all natural. That plot is misleading too.
“The “AMO model” in the first plot has nothing to do with the AMO index”
toncul, You seem to have reading comprehension problems. I have already told you that the AMO model curve is a fitting to the sea ice data reflecting periodic oscillations. You are only misled if you assume that it is AMO data or AMO index data, but the graph does not say that nor does the curve look like it is that.
“Also, in your AMO index plot, there is an anthropogenic component, you can’t claims it is all natural.”
First, it is not an AMO index plot, again you have trouble reading what the graph says and despite my best efforts still do not distinguish between AMO and AMO index. Second, you raise fallacious strawman arguments. Where have I claimed it is all natural?
As a conclusion, the “AMO model” was based on nothing.
With models based on nothing, we can predict what we want…
About the second plot : this is necessary an index. That one is supposed to be an AMO index from what is written on the plot. A wrong one, but it’s an AMO index and everywhere that plot is called AMO index… You want to distinguish between AMO and AMO index : whereas the index is just supposed to quantify the oscillation. That’s say, there is no consensus for the definition of AMO.
“As a conclusion, the “AMO model” was based on nothing”
toncul, you are putting yourself in evidence. The only thing based on nothing is your arguments.
If you don’t read, you don’t learn. I’ll put the link again:
Miles, Martin W., et al. “A signal of persistent Atlantic multidecadal variability in Arctic sea ice.” Geophysical Research Letters 41.2 (2014): 463-469.
http://folk.uib.no/ngftf/CV/PDF_Furevik/miles_et_al_grl_2014.pdf
Without any knowledge, you are just trying to hand wave the evidence behind the AMO model out of existence. Well, sorry. It isn’t going away because you want it. Unlike the CO2 hypothesis it has very specific predictions about what the Arctic sea ice is going to do over the next decades. If correct, the model will demonstrate superior explanation power than models used by alarmists and IPCC. Is that simple.
Nowhere they show your “AMO model”, that has nothing to do with the AMO, and suggest a increase in sea ice cover in the future.
I let you read the paper, and the last sentence :
“Thus, the observed decreases in the Arctic sea-ice cover, especially in summer, may continue largely unabated as the GHG signal strengthens further.”
As I said, you seem to have a reading problem because you did not understand the bottom line of the study despite being clearly written:
“This study provides strong, long-term evidence to support modeling results that have suggested linkages between Arctic sea ice and Atlantic multidecadal variability [Holland et al., 2001; Jungclaus et al., 2005; Mahajan et al., 2011].
Given the demonstrated covariability between sea ice and the AMO, it follows that a change to a negative AMO phase in the coming decade(s) could—to some degree— temporarily ameliorate the strongly negative recent sea-ice trends.”
In plain English they believe there could be less melting than expected when the AMO turns negative.
I still don’t see the futur increase predicted by your “AMO model” that has nothing to do with AMO.
“less melting ” is still melting…
Alarmist scientists are not very good at predicting. The AMO is flat since the early 2000s and so is average Arctic sea ice extent. It only follows that when the AMO turns negative there is actually a very good probability that Arctic sea ice will expand. Imagine the horror of Arctic alarmists when their nightmare turns into a dream and Arctic melting reverses.
is it being “alarmist” to say that sea ice will keep decreasing in the future ?
Do you really see flat arctic sea ice extent since the early 2000s ?
It is good that this article raises the question of arctic ice volume, rather than area.
It would perhaps be valuable for an article at this site to be devoted to the methods used to measure/impute arctic ice volume, how rigorously such methodologies have been tested for accuracy and how closely independently methods of measuring arctic ice volume actually agree with one another.
In particular, how well do satellites measure Arctic volume and how rigorously have such methods been validated??
He cites Lanser who cites DMI… DMI have no validation of their ice volume MODEL that I can find.
Still, Ball cites Lanser, who cites DMI, who have no documented validation I can find.
Typical skeptical rigor.
The polar bear species is in fact much older than ours, and has weathered a number of interglacial eras and even the periodic disappearance of the icecaps. The idea that fascinates me is that they are a subspecies of grizzly, and during warm periods polars interbreed with grizzlies and their DNA remains submerged in the grizzly population until the ice comes back. I don’t know if this makes sense. I do know that polar/grizzly hybrids do happen.
As for the idea that warmists are One World Government fanatics, I imagine a lot of them are, but I see it as just one more layer of tossery. The most cursory of analyses would show them that the thing is impossible. It’s hard enough to keep a modern empire like the Soviet Union from Balkanising. It’s a tribute to liberal democracy that none of the States of the Union have yet seceded, (apart from that little misunderstanding last century but one), not even Texas!
In this guest post I read
The second article reports that,
“The area of 1.5+meter ice in the Arctic has tripled over the past four years, and volume has increased about 50%”
But… the link below “The second article” however points, via the tweet
https://twitter.com/CarbonBrief/status/763695994596892672/photo/1
to information on the following page:
https://www.carbonbrief.org/guest-post-piecing-together-arctic-sea-ice-history-1850?utm_content=buffer489fd&utm_medium=social&utm_source=twitter.com&utm_campaign=buffer
This page – a Carbon Brief guest post by Florence Fetterer, principal investigator at the National Snow and Ice Data Centre (NSIDC) – doesn’t contain any info about arctic ice volume increase.
Yes,
Ball references an article that doesnt have the quote he says it does.
Thermalization explains why CO2 has no significant influence on climate.
Increasing water vapor is countering and perhaps preventing the expected global temperature decline from blank sun & decline in net ocean cycle temperature (R^2 = 0.98 since before 1900). http://globalclimatedrivers2.blogspot.com
Switching from coal to natural gas adds water vapor.
Somebody wake up Hicks.
We are now starting the one-month period when ships can navigate the NorthWest Passage and the Northern Sea Route on the Russian side of the Arctic.
If you are escorted by an ice-breaker, there are usually problems but you are still going to make it through. If you are trying without an escort, there is only 50:50 odds you are going to make it without losing your ship, having to be rescued or having to turn back.
Big deal. One month.
And it has always been this way.
The Franklin Expedition in 1845, almost made it through. The Russians in the 1400s in wooden sailing ships. The Greely Expedition in 1882 reached the northern tip of Ellesmere Island in a wooden ship (you wouldn’t make it there today in anything but an ice-breaker). Amundsen in 1906 finally made it.
And the Thule Inuit. Made it all the way to Greenland 800 years ago in seal-skin whaling boats (starting out originally from the Chukchi Peninsula in Siberia 1,000 years ago). And they didn’t drag the boats across the ice all the way to Greenland.
It has always been like this. The ice melts out at 75N for one to two months every year and has done so the last 5,000 years. It might have been ice-free at the Holocene Optimum 8,000 years ago but was covered by 50 metre to 1,000 metre ice in the previous 100,000 years.
Climate Science is based on rewriting history. These are the type of people we are dealing with.
I posted similar information above for the NEP.
Somehow these obvious arguments seem to fall on deaf ears.
“Those who cannot remember the past are condemned to repeat it.” George Santayana.
Our conviction:
http://realclimatescience.com/wp-content/uploads/2016/08/Screen-Shot-2016-08-14-at-4.36.42-AM-down.png
(Credit Tony Heller)
Javier August 14, 2016 at 8:45 am
I posted similar information above for the NEP.
And like Bill you exaggerate and make errors, better to just present the facts and let the chips fall where they may.
The Franklin Expedition’s purpose was to chart the Northwest Passage, not necessarily to sail through it in a single season; though this was naively hoped for by some. The fact that it went equipped with 3 years’ worth of provisions indicates that confidence of success in a single season was not high. They appear to have been expecting to overwinter aboard their vessels on the sea ice and progress over consecutive melt seasons, charting the route as they progressed.
The Franklin expedition was extremely unlucky. They didn’t even try to sail through the first year. They spent that autumn circumnavigating Conwallis Island. Which was probably a big mistake, because today that is only possible during very good ice years, so they might well have gone straight through if they had tried.
Next year they went down Peel Strait and got stuck northwest of Prince William Island. This is the most difficult part of the southern route even today. Again they might well have succeeded if they had instead taken the inshore route on the south side of Prince William Island, like Amundsen did, but unfortunately the maps at that time showed Prince William Island as being part of the mainland.
What happened was that the ships never got loose in the next two bad ice years 1847 and 1848. One ship was crushed by the ice, but the other finally got unstuck in 1849, but by that time everybody or almost everybody had died of starvation, scurvy and lead poisoning, so she drifted south as a ghost ship and ultimately sank near the mainland coast, where she was found a few years ago. Again: if the crew had still been alive they almost certainly could have sailed the rest of the way fairly easily.
Well if they’d tried in 2012, 13, 14, 15 or this year they’d have been straight through in one season…
Griff
Only if they were in the exactly right spot beside exactly the right island during the only 2 week period when the small passageways were open in late August-early September.
That’s the stupidity of discussing a “Northwest Passage” – implied from the US and Europe to China’s export market. If you can only transition the islands for a 2-3 week period one month a year, it is NOT a commercial passage at all. CAGW (eco-Tourist)_ propaganda? Yeah, sure.
A commercial ship transit REQUIRES a ship planning cycle that begins a month prior to departure (from the southern ports on the US east coast, Canadian-US midwest and great lakes ports, or the Euro north coast, Baltic, and Med.
Then 10-20 days north, 10-20 days across the north coast, then an easy “coast-tracking” back down past Alaska (which ALSO freezes up!) towards China. So the cargo containers HAVE TO BE prepped and loaded and shipped by train and truck to the ports in the south in the weeks and months before you assume the northwest passage is open. The same for a Chinese export ship. If it can only leave once per year from China to make it through, nobody can use the Northwest Passage.
Make a bad guess maybe only 1 or 2 days wrong based on CAGW propaganda that “The Arctic is melting!) and you lose everything until the next August.
But the real money-making trips can ONLY be EASTWARDS across north Europe and the generally free waters north of Siberia to China’s east coast.
“And it has always been this way.”
Not really.
look at the data.
And nobody rewrites history as much as the Berkeley Earth temperature algorithm. On average, each station is changed 8 times with the majority of those adjusting past temperatures down. Berkeley is the worst offender of anyone.
So Mosher knows all about bogus data then?
Bill Illis August 14, 2016 at 6:40 am
And it has always been this way.
The Franklin Expedition in 1845, almost made it through.
Not even close to making it through.
The Greely Expedition in 1882 reached the northern tip of Ellesmere Island in a wooden ship (you wouldn’t make it there today in anything but an ice-breaker).
The Greely expedition didn’t make it to the northern tip of Ellesmere Island, They camped at Lady Franklin Bay (81°40′N 65°00′W), they got trapped there and their supply ships failed to make it (one was sunk by ice). Contrary to your assertion Arvid Fuchs successfully replicated their journey in a sailing ship, the Dagmar Aaen in the summer of 2009.
Amundsen in 1906 finally made it.
Yes it took him three years, these days the southern route he used becomes ice free almost every year.
Here’s a nice view from about a week ago:
“it took him three years”
He could have done it in two. He stayed an extra year at Gjöahamnen to study the Netsilingmiut.
Greely Expedition at Lady Franklin Bay which is located here (at the northern tip of Ellesmere Island).
http://lockwood.one-name.net/images/Ellesmer3_notated.jpg
This is an actual picture of the ship in Lady Franklin Bay (on the northern tip of Ellesmere Island) on about August 15, 1881 (exactly 135 years ago today).
http://www.pmel.noaa.gov/arctic-zone/ipy-1/images/B-91121.JPG
This is what the area looks like today. That wooden ship is not making it there today.
“That wooden ship is not making it there today.”
I agree with that, however don’t knock wooden ships for penetrating ice. Back then and well into the 20th century wooden ships were actually preferred for operating in ice. If properly built they were much more resilient and less liable to be crushed by ice-press than steel ships. Remember that “Fram”, the most successful arctic expedition ship ever was wooden. It was only after the invention of alloy steels that did not become brittle at low temperatures that steel vessels penetrated the Arctic.
Why is everybody still using Gorbull’s FALSE claim of winning a Nobel prize? He did know such thing. There are 9,000!!! climate “scientists” who make this false claim. The IPCC (of all phony orgs) have throughly debunked that claim. Took me 5 seconds to find this on Google, and there are over 10,000 other articles debunking it!
http://business.financialpost.com/fp-comment/9000-nobel-pretenders.
Do not forget that CAGW has been stolen by politicians,97% who are greedy psychopaths,just like the pharmaceutical companies have stolen most medical research.
I suggest you read the link you made, it clearly states that Al Gore was awarded a half share in the Nobel Peace Prize in 2007.
Here’s the official announcement on the Nobel.org website:
http://www.nobelprize.org/nobel_prizes/peace/laureates/2007/
Al Gore is an individual recipient of the Nobel peace prize. The Nobel prize in any year and category can be awarded to up to three individuals or organizations. Each one of them is a recipient of the prize. The claim is not false in the case of Gore.
The Nobel Peace Prize is a most amazing award. In addition to it being awarded to people who made notable contributions, it has been awarded to thugs and murderers, and in some cases awarded to people who had accomplished nothing at all. There is no doubt that its checkered history identifies it as a “political” prize.
As all prizes, the Nobel Prize is very unjust for those that should have got it but didn’t and for those that got it but shouldn’t. And that is even in the scientific categories.
The Nobel Peace Prize as you say is even worse. Very few that got it actually deserved it. Actually I think they suffer from lack of candidates as an organizations that clearly works for the common good, the Red Cross, already got it… three times. Seems they are now handing them out as encouragement for initiating leaders to work for the peace, but without much result.
And don’t forget that the “Nobel Peace Prize” is not a REAL Nobel. The real ones come from Sweden. The “Peace” Prizes are awarded by the Norwegians.
IanM
“And don’t forget that the “Nobel Peace Prize” is not a REAL Nobel. The real ones come from Sweden. The “Peace” Prizes are awarded by the Norwegians.”
Of course it’s a REAL Nobel prize. In Alfred Nobel’s will, he designated that he wanted the Peace prize to be selected by a committee in Norway. It is in no way, shape or form any less of a Nobel prize than any of the others. https://www.nobelprize.org/alfred_nobel/will/will-full.html
You should write a book named Convenient Truths. You stitch together miscellaneous items that may be true individually, but conveniently leave out the big picture. Florida residents who now regularly have sea water running down their residential streets are not on some idyllic island. Rising oceana are real and threaten a whole lot more than polar bears. Speaking of which, tell me why our military strategists are gearing up for growing threat’s from across the arctic. I don’t think it is because the ice is getting thicker. The aura of authority with which you lie is just plain repulsive.
In what way does sea level rise – which is a very, very small CONTINUING natural result of the loss of glacier ice that began 12,000 years ago when sea levels were 150-200 feet lower than they are today – a “threat”. Even a 1 meter rise does not inudate Florida – I driven the Everglades – they are even at the edges not a meter close to “sea level. And “rise” of a meter is hundreds of years in the future.
IF it continues. By 2100, we will be at the peak of today’s Modern Warming Period, and will begin coasting back towards the Little Ice Age cooler temepratures. And lower sea levels.
1m does not inundate the entire state – but that’s not what Lonny was saying. He was talking about Miami. And yes, Miami will be very adversely affected. http://therealdeal.com/miami/2016/04/07/miami-beach-property-values-may-fall-as-sea-levels-rise-experts/
Why is no-one talking about Antarctic sea ice?
Simple answer: MSU & AMSU Time Series Trend Browse Tool
1. Globe (60S – 82.5N)
http://data.remss.com/msu/graphics/TLT/plots/RSS_TS_channel_TLT_Global_Land_And_Sea_v03_3.png
2. Arctic (60N – 82.5N)
http://data.remss.com/msu/graphics/TLT/plots/RSS_TS_channel_TLT_Northern%20Polar_Land_And_Sea_v03_3.png
The warming trend in the Arctic is about 2.5 times higher than for the Globe.
2. Antarctic (60S-70S)
http://data.remss.com/msu/graphics/TLT/plots/RSS_TS_channel_TLT_Southern%20Polar_Land_And_Sea_v03_3.png
Probably the trend would be somewhat more negative if the satellite could operate below 70S.
Nothing changes there since decades:
– Sea ice is growing a bit there actually;
– Some warming points on the Peninsula and in West Antarctica.
Why is no-one talking about Antarctic sea ice?
Because, when in 2014, the Antarctic sea ice anomaly exceeded the size of Greenland , it did not fit the required narrative required by the CAGW propaganda.When Antarctic sea ice continued rising between 1992 and 2015, it didn’t fit the narrative they needed.
Today, Antarctic sea ice is coasting right at the average. It doesn’t fit the narrative, so they MUST ignore it.
Arctic sea ice has been oscillating about -1.0 Mkm^2 since 2006-2007. Not getting less, just oscillating about a “new” steady state?
Moreover, climatologist, you just need to google for that after all!
One link among many others, arbitrarily chosen:
http://arstechnica.com/science/2016/07/recent-antarctic-sea-ice-growth-boosted-by-la-ninas/
Crystal Serenity Goes to Arctic
http://www.marinelink.com/images/maritime/w350h600/Crystal-62955.jpg
http://www.marinelink.com/news/serenity-crystal-arctic413861.aspx
The cruise ship MV Crystal Serenity, owned by the US-based Crystal Cruises, is scheduled to set sail from Seward, Alaska to New York on a 32 day, 1,500 km journey through the Northwest Passage via Canada and Greenland on August 16 with with 1,000 passengers on board.
The Cruise ship will sail the legendary route 500 miles north of the Arctic Circle, first completed successfully by Roald Amundsen more than 100 years ago.
The wildlife charity WWF has accused Crystal Cruises of putting at risk “the very thing that tourists would come to see” – a pristine wilderness and home to endangered species such as polar bears and walrus.
It’s getting to be about time to read http://arcticnorthwestpassage.blogspot.com/?view=sidebar
It’s the best (by far) site I know of for tracking NW passage travelers. For example, http://arcticnorthwestpassage.blogspot.com/2016/08/why-trudeau-should-move-now-to_13.html says the Crystal Serenity leaves on the 16th.
Meanwhile DMI’s above 80N temperature dataset has gone below freezing. Freeze up is on the way. I guess we’ll have to wait another year for alarmists dream of a “black swan” event of the Arctic to be “ice free”!
If you download the GHCN record in its raw, unadjusted variant and split it into 36 latitude stripes of 5° each, you obtain, for the period 1979 – today, the following linear OLS trends (in °C / decade):
– 90N-85N: no station
– 85N-80N:+1.09
– 80N-75N: -5.09
– 75N-70N:+2.22
– 70N-65N:+4.33
– 65N-60N: -2.88
– 60N-90N:+0.99
Feel free to do the same job.
What’s your point? The fact is the sea ice didn’t melt out this year AGAIN despite alarmists telling us the Arctic ice cap would be gone by now. It’s so bad the ice is thickening! Do tell us exactly how many stations in Arctic are represented in the GHCN?
I’m not interested in alarmists’ meaning.
My point is that Arctic regions are incredibly warming, that’s all.
If you don’t understand what trends tell us, that’ s your problem.
Do tell us exactly how many stations in Arctic are represented in the GHCN?
Yes, it’s a bit late here (11:30 pm) to search for the info, but I’ll soon inform you about that.
Gonzo on August 14, 2016 at 1:11 pm
Stripe 80-85N: 1790 records by 3 stations
Stripe 75-80N: 7648 records by 14 stations
Stripe 70-75N: 19689 records by 30 stations
Stripe 65-70N: 63545 records by 89 stations
Stripe 60-65N: 119650 records by 158 stations
Don’t complain about “Oooh! So few stations!”
Because I then would have to point out that even a John Christy managed to detect “good correlations” between the UAH data and that of… 31 (yeah, thirty one) IGRA radio sondes (which were of course pretty good “selected”: all under US control 🙂
Why incredibly? In a warming world it is only expected that polar regions should also warm. Theory even predicts polar amplification since the tropics barely change temperatures. What is incredibly not warming is Antarctica. Totally unexpected for the scientists that had to look for an explanation.
Bindidon maybe you could bring me up to speed as the most stations are in the 60-65dg area which works out to an avg of only 757 readings per station this would equate to roughly only 2yrs of only once a day recordings. Avg # of readings is even lower the further north you go.
Gonzo on August 15, 2016 at 11:24 am
What in the world did you expect from arctic regions, Gonzo? 1,000 stations with 1,000,000 readings?
What about trying to face reality?
It is so boring to see all the time people doubting about the information provided by sparse surface material but trusting anywhat told by people
– trying to interpret temperature out of O2’s microwave brightness measured by satellites in the atmosphere, with about the same low level of accuracy;
– pretending, on the base of the comparison of their data with a handful of radiosondes, that data being above any suspicion.
Here is an Excel chart comparing, between 1979 and now
– UAH6.0 beta5 TLT (red);
– Christy’s US-controlled 31 IGRA radiosonde subset (blue);
– all 127 US IGRA radiosondes (yellow);
– all 1500 IGRA radiosondes worldwide (grey).
http://fs5.directupload.net/images/160816/jy8gcx37.jpg
Compare all four trends (here per decade).
Look at the perfect harmony between
– Christy’s US radiosonde subset ( 0.112 ± 0.031 °C )
– UAH’s TLT data ( 0.122 ± 0.008 °C ).
Look at the other radiosonde data
– all 127 US radiosondes ( 0.420 ± 0.035 °C );
– all 1500 radiosondes ( 0.752 ± 0.039 °C ).
If you don’t understand what I mean here, I guess any further discussion might be superfluous.
Oh Bindidon now you’re sounding like someone at GISS, “we don’t need no stinkin stations!”, “we’ve got statistical smearing techniques which can extrapolate one station out to 1200sqkm!”
I don’t think anyone here myself included doesn’t think the Arctic region hasn’t been warming over the last 39yrs. How could it not? The late seventies were incredibly cold. What will you be saying when the AMO goes cold in the not so distant future?
Oh Bindidon now you’re sounding like someone at GISS, “we don’t need no stinkin stations!”, “we’ve got statistical smearing techniques which can extrapolate one station out to 1200sqkm!”
Don’t know what you complain about: there are incredibly many places on Earth where weather stations are sparse. USA isn’t everywhere. What are 1200 km² ? A little square with 35 km side length…
I think you really should get a bit better informed about how satellite-based estimations of O2’s microwave brightness are built…
The late seventies were incredibly cold.
That’s not true for the Globe as a whole, thus I suppose you mean here the arctic regions above 60N:
1966 -6.70
1972 -6.69
1971 -6.50
1982 -6.50
1979 -6.30
1985 -6.18
1974 -6.14
1965 -6.12
1964 -6.08
1987 -6.04
1968 -5.99
1986 -5.98
1976 -5.98
1978 -5.97
1969 -5.85
1970 -5.84
1956 -5.80
1973 -5.75
1975 -5.72
1983 -5.70
Indeed: 9 of 10 of the 70ies are in this list of the 20 coldest years above 60N since 1880 (all are here yearly mean absolute temperatures, not anomalies wrt some baseline).
What will you be saying when the AMO goes cold in the not so distant future?
That the most warming places above 60N are Western Alaska and Northern / Eastern Siberia, a bit far away from AMO’s main influence areas I guess.
Didn’t Al G. predict that the Artic would be ice free by now?
Other people predict there will be a Little Ice Age in about 20 years. Will you believe them right now?
P.S. I didn’t believe Al Gore 🙂
Rhoda R
Well, only if you draw straight lines on an environmental issue that is cyclical.
http://www.eea.europa.eu/data-and-maps/figures/area-of-multi-year-arctic-sea-ice-in-march-1957-2007
Goes faster down if you extrapolate a fifth-order equation.
D.r Ball,
The end of your essay says it it all. The answer is the truth!
Well-researched blog post on Arctic sea ice melt in the 1920-40 interval by climate historian Tony Brown, aka Climatereason, from Judith Curry’s site:
https://judithcurry.com/2013/04/10/historic-variations-in-arctic-sea-ice-part-ii-1920-1950/
Whatever may have been the case during this time with the Northwest Passage through the Canadian Arctic, the Northeast Passage along Russia was open, as shown by Tony’s references.
Here is the relevant Wiki entry:
https://en.wikipedia.org/wiki/Northeast_Passage#After_the_Russian_Revolution
In 1932, a Soviet expedition led by Professor Otto Yulievich Schmidt was the first to sail all the way from Arkhangelsk to the Bering Strait in the same summer without wintering en route. After a couple more trial runs, in 1933 and 1934, the Northern Sea Route was officially defined and open and commercial exploitation began in 1935. The next year, part of the Baltic Fleet made the passage to the Pacific where armed conflict with Japan was looming.
A special governing body Glavsevmorput (Chief Directorate of the Northern Sea Route) was set up in 1932, and Otto Schmidt became its first director. It supervised navigation and built Arctic ports.
During the early part of World War II, the Soviets allowed the German auxiliary cruiser Komet to use the Northern Sea Route in the summer of 1940 to evade the British Royal Navy and break out into the Pacific Ocean. Komet was escorted by Soviet icebreakers during her journey. After the start of the Soviet-German War, the Soviets transferred several destroyers from the Pacific Fleet to the Northern Fleet via the Arctic. The Soviets also used the Northern Sea Route to transfer materials from the Soviet Far East to European Russia, and the Germans launched Operation Wunderland to interdict this traffic.
Yes, but the research reported there has now been supplemented by a thorough survey of all arctic sea ice records – all of them, from Soviet and Danish and whaling records, etc, etc, etc –
“Earlier this month, NOAA at NSIDC published a new compilation of Arctic sea ice extent using a variety of historical sources, including whaling ship reports and several historical ice chart series from Alaska, the Russian Arctic, Canada, and Denmark. The compilation provides a synthesized mid-monthly estimate extending back to 1850. The study concludes that the current downward trend in sea ice has no precedent in duration or scale of ice loss since 1850. With the exception of the Bering Sea, none of the areas have seen sea ice extents as low as in the past decade. Historical periods that show a decrease in summertime sea ice extent in the Arctic, such as the late 1930’s and 1940’s, are smaller in magnitude than the current downward-trending period.”
https://nsidc.org/data/g10010
There is some detail on how the records were assembled and some fascinating examples of Soviet etc ice maps here:
https://www.carbonbrief.org/guest-post-piecing-together-arctic-sea-ice-history-1850
There is no doubt now – the current downward trend in sea ice has no precedent in duration or scale of ice loss since 1850.
6-8000years ago there wasn’t any ice, BFD.
The trouble with those maps and charts are that they are mostly pure fantasy. The information to make them simply isn’t there. The “examples” of Russian and Danish sea-ice data are very carefully chosen, mostly the information is vastly more fragmentary. You can check for yourself. The primary data are here:
DMI:
ftp://sidads.colorado.edu/DATASETS/NOAA/G02203/
AARI:
ftp://sidads.colorado.edu/pub/DATASETS/NOAA/G02176/pngs/
Polar bears survive quite well on land. They’re still basically grizzlies, although their dentition is evolving toward seal-eating specialization.
However, they can’t hunt on land. They are too well insulated and overheat if they move rapidly on land during the (for them) sweltering arctic summer. They do eat berries, eggs, unfledged birds and other small animals though (and raid garbage cans, of course).
If you don’t believe me, have a look at the slow, shortlegged “dachshund” reindeer on Spitzbergen. They have evolved in one of the world’s most polar-bear-dense environments:
http://gemini.no/wp-content/uploads/2014/11/photo-by-brage-hansen_reindeer-on-ice-700×350.jpg
Maybe all the caribou fur found in polar bear scat came from scavenging, but I doubt it.
http://www.popsci.com/polar-bears-might-survive-ice-melting-by-hunting-new-prey
Predator-prey relationship between polar bears and Svalbard (Spitsbergen) reindeer:
http://www.bioone.org/doi/abs/10.1657/1938-4246-44.4.483
OK, that one won an Ig Noble Prize from the Warmunistas, however here are instances of observed predation:
https://www.researchgate.net/publication/225349127_Predation_of_Svalbard_reindeer_by_polar_bears
https://www.spitsbergen-svalbard.com/2009/01/06/polar-bears-like-reindeer.html
In 2011 I had a paper called “Arctic warming is not greenhouse warming” in the journal “Energy and Environment.” I had just finished the section on the Arctic and Antarctic in my book “What Warming?” and it had gone to press. And annoyingly, a vital observation by Spielhagen et al. that I could have used ion the book appeared in Science just after that. It was a direct observation of warm Atlantic water reaching the Arctic Ocean, exactly as I had predicted in the absence of data. According to them, its temperature exceeded anything seen within the last 2000 years in the Arctic. Since it was too late to stop the book I opted to write a full length paper on the Arctic to make use of their data. There was much unknown about Arctic but a combination of sources helped to make it clear. The most important historical source is Kaufman et al. They determined that almost nothing had happened in the Arctic for the last two thousand years until the beginning of the twentieth century. At that point a slow, linear cooling came to an abrupt halt and water temperature started to rapidly increase. This early warming was strong but it did not last. It stopped in 1940 and was followed by thirty years of cooling. But in 1970 warming again returned and and has been active since then. The reason for the sudden start of the original warming was a reorganization of the North Atlantic current system at the turn of the century. One result of this was to direct the Gulf Stream that flows north more directly into the Arctic basin itself. Hence the warm water that Spielhagen et al. intercepted. As to the mid-century cold spell, it is likely that it involved a temporary return of the original flow pattern of the North Atlantic currents. But what can happen in nature once can happen again, hence a return of another such cold spell is not out of the question. Note also that all the sea ice measurements reported start ten years later than the beginning of the warm spell and have no historical context, no idea at all of what happened earlier in the century.
Well, now we have the analysis of historical sea ice records going back to 1850, we do have an historical context…
https://www.carbonbrief.org/guest-post-piecing-together-arctic-sea-ice-history-1850
The rate and timing of the decline from the latter part of the 20th century on cannot be ascribed (ultimately) to anything other than global warming…
Reblogged this on The GOLDEN RULE and commented:
” Wonderful, fanciful environmental fairy tales are woven to spread the falsehood of AGW, but as Shakespeare wrote, “at the length the truth will out. “ “
“We knew because of the anomalous conditions, including extreme Meridional flow, triggered by the eruption of Tambora in 1816.”
Yet there is no such effect from some other large eruptions. 1807-1817 had a very strongly negative North Atlantic Oscillation regime because of low solar, negative NAO drives Arctic warming, like it has from 1995 onwards. And the report of the ice being ‘greatly abated’ for two years previous to Nov 1817 means the loss began before 1816.
According to the IPCC rising CO2 will increase positive NAO, giving a more northerly and presumably zonal circulation, that would tend to keep the Arctic cooler rather than warm it.
http://www.ipcc.ch/publications_and_data/ar4/wg1/en/ch10s10-3-5-6.html
Data that far back is fragmentary, but it would seem that the big decrease in ice happened from 1816 to 1817:
http://www.climate-cryosphere.org/resources/historical-ice-chart-archive/quicklooks
Dr. Ball
You are the most consistently good writer on climate change I have read since I started reading about the subject in 1997.
When your name is on the by-line, it is an automatic ‘must read’ article.
You understand both the politics and (bad) science — and you don’t shy away from the politics.
The bad science is a result of starting with the conclusion that humans are destroying the planet, and then creating a long series of boogeymen to scare people into following the leftist anti-economic growth mantra.
The boogeymen have morphed from DDT/pesticides, to acid rain, to the hole in the ozone layer, to global cooling and global warming.
If most people stop believing in the false claim of a coming climate catastrophe, which we have been hearing about for 40 years, there will be a new leftist-invented boogeyman to scare people.
A new coming environmental catastrophe — perhaps ocean “acidification”, or GMO-related deaths, or exploding silicone breast implants — the leftist imagination is endless.
But the same old “solution” every time — more government regulations, more government control of private sector energy use, and even slower economic growth (we already have very slow growth under Obama).
The current climate is very pleasant — most likely the best climate for human prosperity and green plant growth in at least 500 years … however … many people are easily intimidated by government pronouncements that a completely invisible climate change crisis has been in progress since the mid-1970s.
A “crisis” no one can see, feel, hear, taste, smell, touch or even measure (no unusual temperature changes in the past 150 years, even if you ignore large margins of error in the data).
A climate “crisis” that can only be “seen” by complex confuser games (models) that have been making wrong climate predictions for 40 years, but never mind those wrong predictions — they’ll get it right the next time !
This old quote explains the politics of climate change:
“The whole aim of practical politics is to keep the populace alarmed (and hence clamorous to be led to safety) by menacing it with an endless series of hobgoblins, all of them imaginary.”
H.L. Mencken
Climate change blog for non-scientists:
Free
No ads
No money for me
A public service
http://www.elOnionBloggle.Blogspot.com
Climate Change has become one of the biggest money making sceams (frauds) of our time. Hundreds of billions if not Trillions will be spent on Climate Change policies and the bad news is that the only benefactors will be big business and Government. You and I will be left footing the bill 🙁
My conclusion about this by far more political than scientific post: Dr Tim Ball’s relation to truth is about as evident as that of Al Gore.
Thus he manifestly lacks the moral authority to apply any critique on him.
So,
it’s decreasing.