Guest Post by Just The Facts
Introducing the new WUWT ENSO Forecast Page with an array of low skill forecasts…
 There are also several upgrades to the WUWT ENSO page, including new Sea Temperature Anomalies at depths. Lastly, WUWT reader “tim” points out in comments of the WUWT Ocean Page that “everybody is focusing on the Pacific at the moment, but “in the central Atlantic around the 10th may there seemed to be a large disturbance in the SST lasting around 2 weeks.” Animation to the left and analysis below.
The WUWT ENSO Forecast Page has actually been available for a few months, but I was hesitant to formally introduce it because “The period from February through May is commonly referred to as the spring barrier. During this time, models generally have the least skill to predict the coming season.” IRI “During April, May, and June, the state of the central Pacific is dynamic and can change quickly, making it hard to predict how it will behave in the coming months. In June, indications of potential strength should become more clear.”IRI
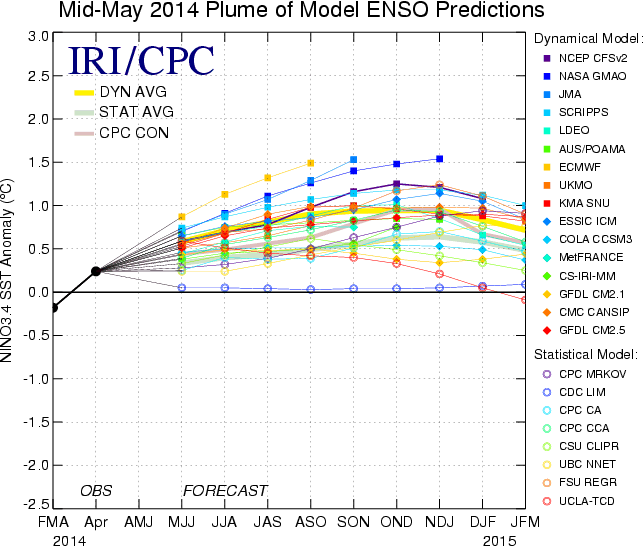
With this in mind, on May 16th Tony Barnston of the The International Research Institute (IRI) for Climate and Society noted that “Models are currently predicting El Niño of moderate strength, though a strong or weak El Niño is also still possible. Certainty in the strength has increased somewhat, though we are still within the time of the “’spring predictability barrier.’” “Tony Barnston expects a weak El Niño to continue to develop in the next few weeks. The IRI’s May ENSO forecast puts the chances of El Niño conditions at just under 70% for early next fall (see image at right), a slight decrease from IRI’s April forecast and from NOAA/IRI’s official prediction issued on May 8. A possible reason for the slightly lower probability is some weakness in the positive feedback loop typically seen in El Niño events between the atmosphere and warm ocean temperatures in the equatorial Pacific”
Here IRI’s Mid-May Plume of Model ENSO Predictions;
And here is NOAA’s Consolidated Niño 3.4 forecasts:

and Consolidated Standardized Niño 3.4 Anomaly Forecast:

In the two consolidation graphs above, it is interesting to note that the CFSv2 Arctic Sea Ice Extent prediction is for a positive anomaly in September and CFSv2 Niño 3.4 SST Anomalies forecast above is for a much stronger El Niño than it’s peers. below is CFSv2 Niño 3.4 SST Anomalies with the 16 most recent forecast members;

and here’s the 80 most recent forecast members:

Seems that they’ve certainly covered most of their bases. In addition to the fact that “for the predictions through the spring season in the growth phase of El Niño events, the prediction errors induced by both initial errors and model errors tend to have a prominent season-dependent evolution and yield a prominent spring predictability barrier (SPB)” Duan et al. , 2012, it is important to note that even after the SPB passes, our ENSO forecasting skills are abysmal, i.e.:
“ENSO conditions are represented by the Niño- 3.4 SST index in the east-central tropical Pacific. The skills of 20 prediction models (12 dynamical, 8 statistical) are examined. Results indicate skills somewhat lower than those found for the less advanced models of the 1980s and 1990s. Using hindcasts spanning 1981–2011, this finding is explained by the relatively greater predictive challenge posed by the 2002–11 period and suggests that decadal variations in the character of ENSO variability are a greater skill-determining factor than the steady but gradual trend toward improved ENSO prediction science and models.” Barnston et al. Given that, “Climate simulations suggest that multi-decadal periods of high and low variability in the phenomenon known as the El Niño-Southern Oscillation in the tropical Pacific Ocean may be entirely unpredictable” DiNezio, 1014, we cannot have confidence in any of our current ENSO forecasts
With these warnings applied, all of the ENSO forecasts above, as well as an array of others, can be found on the new WUWT ENSO Forecast Page.
In addition to the new ENSO Forecast Page, there are also some upgrades to the WUWT ENSO Page. When one views Sea Surface Temperatures;

and even Upper Ocean (300 Meters) Heat Anomalies;

one gets a 2 dimensional view of the Ocean Heat. However, the following Average Sea Temperature and Anomalies graphs at 55, 105 and 155 meters provides a view of what is occurring at three different depths below the surface. Here are Average Sea Temperature and Anomalies at 155 Meters:

105 Meters;

and 55 Meters:

Note how the area of large positive Sea Temperature Anomaly first appeared in early February at a depth of 155 meters, centered on longitude 160W. By late February had risen to 105 meters, centered on longitude 135W and by mid March had risen to 55 meters centered on 95W.
Here is an animation of weekly Equatorial Temperature Anomaly (Surface to 450 Meters) from Jan 18th – March 19th:

here is weekly from March 19th to May 18th;

and here is Equatorial Temperature and Anomaly monthly for the last 12 months:

The ENSO graphs above are now available on the WUWT ENSO page, as is the following Equatorial Upper-Ocean graph, which shows that Upper Ocean (300 Meters) Heat Anomalies reached a maximum in late March/early April, and then have slowly declined since then:

Aside from the WUWT ENSO pages and Equatorial Pacific, WUWT reader “tim” points out in comments of the WUWT Ocean Page, that “in the central atlantic around the 10th may there seemed to be a large disturbance in the SST lasting around 2 weeks.” Let’s take a look, here’s Global Sea Surface Temperature;

and here’s Equatorial Atlantic SST:

There definitely appears to have be a disturbance in Sea Surface Temperature between May 9th and 19th, Furthermore, the disturbance wasn’t just SST, it was also Sea Surface Height;

Speed / Currents;

and Sea Surface Salinity, where there is also an interesting coincident decrease in salinity off the coast of Africa:

Does anyone know what what might have caused of this disturbance? “tim” suggested that it might be a Submarine Volcano Near The Equator in The Atlantic Ocean, 1838, i.e.:
“The effect of a submarine eruption on a ship is described, by those seamen who have experienced it, to be similar to that of dragging the ship bodily along a roughly paved road; or like that violent shaking which the chain cable produces when running through the hawse; and this effect appears to have been felt in greater or less degree in the various instances now brought forward.”
“Mr. T. L. Huntley presents some volcanic ashes, collected at sea by Captain Ferguson, of the ship ‘Henry Tanner.’ These ashes were black, and had the same consistence as those of coal. The spot where they were picked up was 0 degrees 35′ S and 15 degrees 50′ W., the sea being in a violent agitation. In a former voyage, made by the same officer and almost in the same place, lat 1 degree 35′ S. and 20 degrees 27′ W., he had been alarmed by hearing a very great noise. The captain and officers thought the ship had struck on a coral rock; but in sounding they could not reach the bottom.”
Here’s picture of a Submarine volcano disturbing the sea surface in 2011;

with associated commentary, “Whitecaps churn in the Atlantic off West Africa as an underwater volcano erupts off Spain’s Canary Islands on Monday. Since last week, the volcano has been spewing gas and fragments of smoking lava, staining the ocean surface green and brown, as seen above. Spanish authorities have closed a port on Hierro island, ordered ships away from the island’s village of La Restinga, and banned aircraft from flying over the island’s southern tip, according to the AFP news service.” Crystalinks
Please post your thoughts on what might have caused the Equatorial Atlantic disturbance in comments below or on the WUWT Ocean Page. In addition to the WUWT Ocean Page, WUWT ENSO Page and new WUWT ENSO Forecast Page, if you have not had the opportunity to review some our other WUWT Reference Pages, they are highly recommended:
- Atmosphere Page
- Atmospheric Oscillation Page
- ENSO (El Niño/La Nina Southern Oscillation) Page
- ENSO Forecast Page
- “Extreme Weather” Page
- Geomagnetism Page
- Global Climate Page
- Global Temperature Page
- Great Lakes Ice Page
- Northern Polar Vortex Page
- Northern Regional Sea Ice Page
- Ocean Page
- Oceanic Oscillation Page
- Polar Vortex Page
- Paleoclimate Page
- Potential Climatic Variables Page
- Sea Ice Page
- Solar Page
- Spencer and Braswell Papers
- Tornado Page
- Tropical Cyclone Page
- US Climate Page
- US Weather Page
Please note that WUWT cannot vouch for the accuracy of the data within the Reference Pages, as WUWT is simply an aggregator. All of the data is linked from third party sources. If you have doubts about the accuracy of any of the graphs on the WUWT Reference Pages, or have any suggested additions or improvements to any of the pages, please let us know in comments below.
Thanks for the great animations and all the work that went into them! Fascinating!
However, as I look at them, I am reminded of the investors who stare endlessly at various financial time history plots, trying to divine future trends. With both the markets and climate/weather as fundamentally chaotic systems, that is probably a fool’s errand.
That report was from 2011!! and the island is at latitude 27.7°N!
http://earthquake-report.com/2011/09/25/el-hierro-canary-islands-spain-volcanic-risk-alert-increased-to-yellow/ shows that there’s essentially nothing going on. This is not the volcano you are looking for.
When you first look at the animation, it looks like the “disturbance” was bubbling up from below and not related to currents moving. If it was volcanic, wouldn’t there be seismic readings from both sides of the Atlantic that could pinpoint it’s location ?
Ric Werme says: May 26, 2014 at 10:23 am
That report was from 2011!! and the island is at latitude 27.7°N!
http://earthquake-report.com/2011/09/25/el-hierro-canary-islands-spain-volcanic-risk-alert-increased-to-yellow/ shows that there’s essentially nothing going on. This is not the volcano you are looking for.
Understood, this reference was included, along with the other citation from 1838, as a comparative reference of submarine volcanoes and their effect on the Ocean surface. I’ve added years to both references within the article to make clear that these are not examples of the event that occurred in May of this year.
ggm says: May 26, 2014 at 10:30 am
If it was volcanic, wouldn’t there be seismic readings from both sides of the Atlantic that could pinpoint it’s location ?
I’d assume so, however the only seismic readings in the Atlantic during the time frame appear to be a 5.2 “Moderate earthquake – Southern Mid Atlantic Ridge on May 10, 2014”;
http://earthquake-report.com/2014/05/10/moderate-earthquake-southern-mid-atlantic-ridge-on-may-10-2014/
which was much further South than the location of the disturbance, and a 6.0 (USGS) was recorded off the coast of Antigua and Barbuda, a twin-island nation between the Caribbean Sea and the Atlantic Ocean, on May 16, 2014;
http://thewatchers.adorraeli.com/2014/05/16/strong-m-6-0-earthquake-recorded-off-the-coast-of-antigua-and-barbuda/
that was much further to the West of the disturbance.
Could there be a corruption in the data to eplain the “upwelling” we see on these animations?
The fracture zones of the mid-atlantic ridge north of Ascension Island has been quite busy (scroll down to the second image):
http://earthquake-report.com/2014/05/25/moderate-earthquake-north-of-ascension-island-on-may-25-2014/
Was there a huge thunderstorm event there at that time? The ocean ends up cooler afterwards.
Ryan Scott Welch says: May 26, 2014 at 11:10 am
Could there be a corruption in the data to eplain the “upwelling” we see on these animations?
Certainly a possibility, but if this is the case it is strange that the corrupt data shows up in different ways and time frames on the Sea Surface Temperature, Sea Surface Height, Speed / Currents and Sea Surface Salinity animations.
Here is a another link to 16 May 2014, Ascension Region (scroll down to the second image and zoom out a bit): http://earthquake-report.com/2014/05/16/moderate-earthquake-ascension-island-region-on-may-16-2014/
Jaxa’s Gosat, Ibuki, is tracking CO2. Did they notice if the Atlantic Ocean belched?
Gaseous subaqueous emissions would reduce buoyancy in the water column above the origin of the eruption. The consequence for shipping could be catastrophic.
The disturbance covers a very wide area – extending 12degrees west to 27 degrees west in a very short period of time (less than 1 day) – would that not imply either a data problem or a meteoric disturbance? For it to be volcanic it would need to be enormous or very fast currents!
Just The Facts writes: “Does anyone know what what might have caused of this disturbance?”
I suspect it’s an uncorrected anomaly in common satellite-based data. I’ll take a look at the Reynolds OI.v2 SST data when they update it next, hopefully tomorrow, to see what it looks like…if it shows up.
Just The Facts, thanks for the new WUWT ENSO Forecast Page.
Regards
justthefactswuwt, congratulations and thanks.
The ENSO Forecast Page is very informative.
” The International Research Institute (IRI) for Climate and Society noted that “Models are currently predicting El Niño of moderate strength, though a strong or weak El Niño is also still possible.”
My model predicts it will it get warmer or go dark before the night’s out.
“… for Climate and Society” . Sounds like a totally objective scientific venture, not.
When I first saw that disturbance I shrugged it off as some data glitch, because it is so huge the cause would hard to go unnoticed.
Now I’m wondering. Perhaps it is a glitch caused by some event in the upper atmosphere that would effect the readings a satellite was getting.
Maybe some sort of crushed comet could hit the upper atmosphere with a sort of spread-out shotgun blast of tiny particles, all vaporizing long before they reach the earth, yet creating a “disturbance in the force.”
This mystery will be interesting to follow.
The disturbance of of Africa is right on top of the Camaroon volcanic trend.
Salinity disturbance? Maybe fresh water from the Congo R. (6 deg S) .. Not sure about the northern Bight of Bonny source
Well, almost all of my thoughs on the disturbance in the Atlantic have been covered.
Has anyone scaled it for size?
Now, what about plankton or algae blooms??
It’s helpful to save the animations and use a tool like GIMP to resave them with different frame rates. I set it to 2000ms per frame (every frame) and you get chance to focus on what happens at least.
I noted in the salinity anim. that the Gulf of Guinea shows activity just before the mid atlantic event.
12th pulse near to africain coast 7-8 east; 13th quick flash 5W half way to central zone; 14th quiet; 15th,16th mid-atlantic disturbance 15W. Coastal zones remains low salinity until near to end of month then anomaly contracts.
Like Caleb, I initially dismissed this a curious glitch but this tends to go against that. It’s a different time-scale , affects different areas and a different measurement. I think that argues for a real physical event.
A volcano is the obvious thought but if there was not recorded activity that seems at least in doubt. Also the size of the zone affected is huge. It’s not just a squirt of bubbles making it to the surface.
There was a solar eclipse on 29 April so this 11-16th period was around the following full moon when solar + lunar tidal forces add. Near equinox so both are focuses in tropics. Closest perigee was 23 April but still very close at this time. Stronger than usual lunar tidal force.
I guess all these things we are looking at are ‘anomalies’. Could this be a sub-surface standing wave (tide) reaching higher than usual magnitude due to alignment of tidal forces?
It certainly came and went very quickly.
JTF, are those actual observations or modeled data?
On the Atlantic event, I have a collection of AVHRR OISST stills here. It’s high resolution; you can get down to 1/4°. You can choose days, rotate etc. I couldn’t see anything unusual on 9 or 10 May, or nearby days.
Another good page for graphics
http://polar.ncep.noaa.gov/global/nc/?-eqatl-temperature-100-small-rundate=20140512
Last year was there very large eddies of sinking warm surface water down to över 500 m in this area of the Atlantic. Those eddies lived for about a week. This disturbance may been an usuccesfull establishment of a eddy.