
Guest post by Alec Rawls
They say it all the time: even if there were some substantial mechanism of enhanced solar forcing it couldn’t be responsible for late 20th century warming because solar activity was roughly constant from 1950 to 2000. I have rounded up statements to this effect from eighteen top “consensus” climatologists, like Raimund Muscheler (2012):
Solar activity & cosmic rays were relatively constant (high solar activity, strong shielding and low cosmic rays) in the second part of the 20th century and, therefore, it is unlikely that solar activity (whatever process) was involved in causing the warming since 1970.
Is he assuming that the oceans equilibrate rapidly to any change in forcing so that continued high forcing is necessary just to maintain the new equilibrium, resulting in only a brief shot of warming? He doesn’t say. None of them say. They just make this highly counterintuitive claim that persistent forcing cannot cause continued warming, as if they actually believe that it is the change in the forcing rather than the level of the forcing that does the warming.
The tune changes however, as soon as the subject is forcing from greenhouse gases. A staple of the crusade against CO2 is the “commitment study,” where climatologists use their general circulation computer models (GCMs) to estimate the amount of future warming that would result if atmospheric CO2 were to stop increasing and just stay at current levels. That means no change in forcing going forward, just continued forcing at the present “high” level. The estimates of the continued warming this would cause over the 21st century are quite large, roughly equivalent to 20th century warming, or in the latest estimations, substantially higher.
AR4 estimated the “constant composition” commitment at 0.1°C/decade for the early 21st century, 0.6 °C for the whole century
From AR4 (§10.7.1, PP4):
The multi-model average warming for all radiative forcing agents held constant at year 2000 (reported earlier for several of the models by Meehl et al., 2005c), is about 0.6°C for the period 2090 to 2099 relative to the 1980 to 1999 reference period. This is roughly the magnitude of warming simulated in the 20th century. Applying the same uncertainty assessment as for the SRES scenarios in Fig. 10.29 (–40 to +60%), the likely uncertainty range is 0.3°C to 0.9°C. Hansen et al. (2005a) calculate the current energy imbalance of the Earth to be 0.85 W m–2, implying that the unrealised global warming is about 0.6°C without any further increase in radiative forcing. The committed warming trend values show a rate of warming averaged over the first two decades of the 21st century of about 0.1°C per decade, due mainly to the slow response of the oceans. About twice as much warming (0.2°C per decade) would be expected if emissions are within the range of the SRES scenarios.
Should Gerald Meehl’s estimate of 21st century commitment be reduced in compensation for the fact that he uses a 1980 – 1999 temperature average as a baseline? It seems that a decade’s worth of his 21st century warming estimate is actually taking place between 1990 (the center of his baseline period) and 2000. If so, the compensation would be at most about 0.1°C. That is the peak rate of warming the models produce for year-2000 Green House Gas levels. 1980-1999 GHG levels were lower, hence modeled warming would have been less than 0.1°C between the 1990 midpoint of the period and 2000 so less than 0.1°C of Meehl’s estimate of 21st century warming would actually be taking place during the 20th century.
But maybe no adjustment is needed. Meehl et al. certainly do not hesitate in presenting their figures as estimates of “further warming” vis a vis 2000. From the Meehl 2005 abstract:
Two global coupled climate models show that even if the concentrations of greenhouse gases in the atmosphere had been stabilized in the year 2000, we are already committed to further global warming of about another half degree and an additional 320% sea level rise caused by thermal expansion by the end of the 21st century. … At any given point in time, even if concentrations are stabilized, there is a commitment to future climate changes that will be greater than those we have already observed.
As for other commitment findings, Tom Wigley (2005) estimated that the “constant composition” warming commitment “could exceed 1°C,” and the graph at the top of the post is from Matthews and Weaver 2010, a pay-walled post-AR4 commitment study that was reviewed by Gavin Schmidt, who lists their commitment estimate from constant year-2000 GHG forcing as “an additional 0.3 to 0.8ºC warming over the 21st Century.”
AR5 commitment estimates are higher still, presumably because they project 2010 GHG levels. From the Second Order Draft (p. 12-60):
“Constant emission commitment” is the warming that would result from keeping anthropogenic emissions constant and is estimated for example at about 1–2.5°C by 2100 assuming constant (year 2010) emissions in the future, based on the MAGICC model calibrated to CMIP3 and C4MIP (Meinshausen et al., 2011a; Meinshausen et al., 2011b) (see FAQ 12.3).
At the low end, that is more warming than was seen during the 20th century, at the high end it is 3 to 4 times 20th century warming. Guess that nixes the idea of rapid ocean equilibration.
Talking out of both sides of their mouths
These commitment findings should be taken with a grain of salt. Would current levels of GHG forcing, which have coexisted with no statistically significant warming for 15 years now, really cause the present century to warm twice as fast as last? Such wild prognostications show how extravagantly the “consensus” scientists are willing to exaggerate in favor of their anti-CO2 narrative, but they can’t have it both ways. If they expect the persistence of a mildly elevated GHG forcing to cause many decades of substantial warming then it is pure dishonesty to turn around and declare that persistently elevated solar forcing, regardless of its level, could not cause more than a decade or two of warming.
Some of these scientists have done very important work. Ilya Usoskin, for instance, has been a pioneer in developing cosmogenic nucleotide proxies for solar activity. That makes it unsettling to have to call him out, but HEY USOSKIN, it’s about time you renounced the BUT in Usoskin et al. 2005:
The long term trends in solar data and in northern hemisphere temperatures have a correlation coefficient of about 0.7 – .8 at a 94% – 98% confidence level.
BUT:
During these last 30 years the total solar irradiance, solar UV irradiance and cosmic ray flux has not shown any significant secular trend, so that at least this most warming episode must have another source.
Usoskin himself classifies 1920 to 2000 as a “grand maximum” of solar activity, thus his claim here is that even if a historically powerful driver of climate remains at a high level for an extended period of time it will still not cause continued warming. To cause continued warming it would have to keep going up (to higher than high levels).
Does he actually believe that, or did it just seem like a small price to pay to stay in the good graces of the funding institutions that Al Gore, Maurice Strong, James Hansen, Stephen Schneider et al. established in the 1990s? In fact it is a huge price to pay. It is a complete debasement of scientific principle, handing the anti-CO2 crusaders an utterly fraudulent grounds for dismissing the alternative solar-warming hypothesis, and pretty much all of the leading solar scientists have embraced the same trope.
Whether this is bias or cowardice it needs to stop, and for anyone who wants to be silenced no longer, the commitment studies offer an ironclad opportunity. After all, the GCM guys have their own field of expertise. If the computer modelers insist that a steady high level of forcing will cause at least several decades of substantial continued warming then who are the solar scientists to contradict them? All they have to do is stop making highly speculative claims about ocean equilibration that lie completely outside of their field and are unsupported by any reason or evidence.
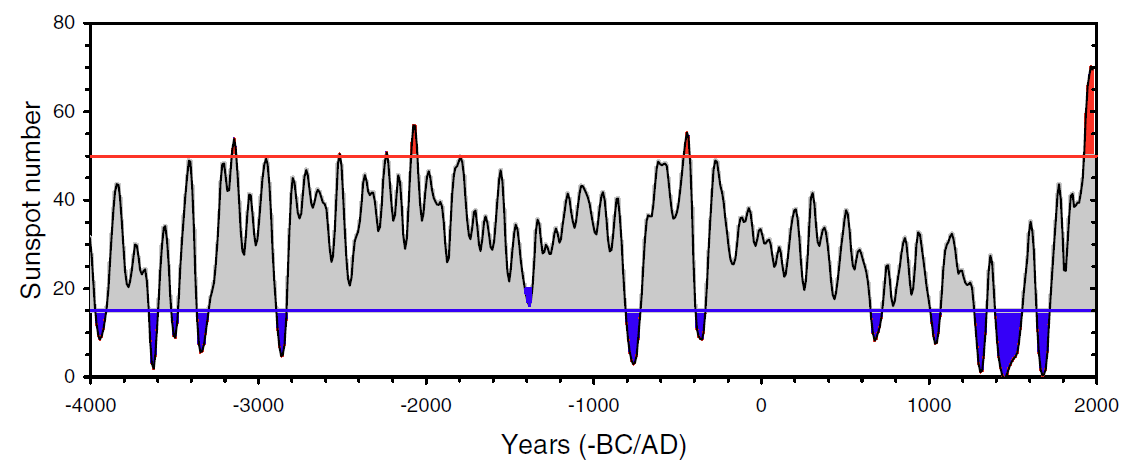
Usoskin’s solar estimates are “grand maximum” even if post-1945 Waldmeier-era sunspot counts are reduced by 20% as Leif Svalgaard urges
Usoskin uses a “high activity threshold” of 50 so even if his sunspot counts (“75 ± 3 since 1950“) are reduced by 20% they are still at “grand maximum” levels from the 1940s to the 1990s by Usoskin’s criteria.
Hat tip to Lucia Liljegren
I asked Lucia if she knew of any GCM tests of the solar warming hypothesis. Had the “consensus” ever GCM-tested their oft-repeated claim that even if there were a substantial mechanism of enhanced solar forcing it could not have caused late 20th century warming?
Not that she knew of, but she suggested that the results of a persistent elevated level of solar forcing should be roughly the same as for a persistent elevated level of GHG forcing, as examined in the commitment studies. In both cases the amount of warming would be the same. Both would be calibrated to account for observed 20th century warming, so the resulting ocean equilibration process should be similar.
Thanks Lucia. The “consensus” has indeed already in-effect GCM-tested the alternate hypothesis, with just a slight change in time frame. Fifty years of high solar activity beginning in 1950 are analogous to fifty years of 2010-level CO2 forcing beginning in 2010, and the predicted warming from the CO2 commitment testing directly contradicts the stated rationale for dismissing a solar explanation for late 20th century warming.
Discover more from Watts Up With That?
Subscribe to get the latest posts sent to your email.
You seem confused, Mosher’s educational background consists of BA’s in English Literature and Philosophy. His “scientific” background involves bringing MP3 players to market for Creative Labs as a marketing director. Leif is an actual scientist.
“It could be said that the increase in TSI from a little over1363 to a little under1367 Watts per square metre over the 400 year period shown is pretty insignificant.”
Don’t forget to divide by 4.
I’m not sure Bob and Alec are that far apart although I tend to agree more with Alec. Part of my interpretation of Bob’s theory is that the El NIno anomalies (e.g. 80’s and 90’s) permitted the gathered heat to be released to the rest of the world rather than stored in the deep ocean. A constant sun is the only viable explanation for varying amounts of warming given ENSO-induced variations (which is mostly clouds) Thus a constantly warmer sun is an even better explanation of where the 1997/8 heat originated.
The proof will come when we get another 1997/8 level El Nino but see no step function in temperature on UAH.
Tisdale says:
I have seen Bob in the past articulate what I thought was a pretty good theory of how ENSO, by affecting cloud cover, could self-propagate. Has this theory been abandoned? In any case, Roy Spencer supports a theory of this kind of internal variability and I find it more than plausible that some such mechanism of internal variability is at work, since short term temperature change seems to be dominated by internal variability. As I said before, there seems to be no other way to account for the 40s to 70s dip.
Bob continues:
Setting aside Bob’s ridiculous demand to do what he does, I am content to look at NOAA’s ocean heat content estimates and to consider the early numbers as they stand (despite the vast uncertainty in these very sparsely sourced estimates).
This data shows the upper ocean layer, and at least to some extent deeper layers as well, taking a dip in the 50s and 60s. Bob seems to think this presents some great dilemma for solar warming theory, as if I am claiming that heat has to be getting stored in the oceans whenever solar activity is high. That is certainly a possibility (what I referred to earlier as the “cyclical” possibility). It could be that the sun was dumping energy into the oceans over this period but somehow the cold monster of the vasty deeps flicked its tail and stole this warmth away, holding on to it until at some point in the future it returns to the surface, either burped back out, or more likely, reducing future heat loss from the upper to the deeper ocean.
But internal variability doesn’t have to be of this cyclical nature. The mechanisms of internal variability could also be self propagating rather than cyclical. (Hasn’t someone written some posts on that theory?) It is possible that over the 40s to 70s dip there was internal variability of this type that was large enough to more than offset solar effects, causing ocean heat content to fall. That wouldn’t mean there was no enhanced solar forcing going on. It would just mean that something larger was also going on at that time.
Why look any further than internal variability, Bob asks, when “the warming has all been explained”? Because there are two ways in which only a very little bit of “the warming” has been explained. First, the observational window in which to study internal variability is very brief. We really didn’t get any halfway decent ocean heat content data until ARGO was up and running in the early 2000s. Sea surface temperature data is very spotty before the satellite era and only goes back in total, what, about a hundred years? This is a tiny slice of climate history, too small to distinguish what is typical from what is anomalous. Maybe if you’ve got a good THEORY, but the idea that much can be sorted out just from looking at the data seems to me far fetched.
Secondly, as I said before, internal variability cannot account for the now-mountain of evidence for that solar activity is a primary driver of global temperature. (Two dozen references listed in the second section here.)
Three idealized functions are used in control theory. They are the ramp function, the step function, and the sinusoidal function. This article seems to compare a step change (increase in solar forcing) to a ramp function (increase in CO2 concentration). For a step change in equilibrium temperature the system temperature will eventually approach the new equilibrium temperature asymptotically but will not overshoot, assuming no feedbacks. For the ramp function after an initial period the system temperature will lag the increasing equilibrium temperature by a constant amount, and will continue increasing as long as the forcing continues to increase. The consensus seems to imagine a CO2 ramp function that continues increasing. The CO2 forcing imho is somewhat speculative, especially in light of recent history which demonstrates that CO2 forcing is presently either absent or held in check by other agencies.
Additionally, any comparison must include proper lag times which depend on the heat capacities involved and are difficult to determine except empirically. All we can do is watch what happens.
Don’t get me wrong I admire Leif’s no nonsense approach. And also the fact that he doesn’t discuss (speculate about) topics he doesn’t understand. A habit most scientists in the field of climate could learn from.
However, this is really very silly comment:
“Here we go again: Image TSI was constant for a million years. Then changed suddenly by 1% ans stayed at that higher level for the next million years. You are claiming that during that second million years [and actually also during the first million years] that the temperature [warming] would continue to rise throughout all that time. If a million is too short, make it 100 million.”
Think of that pot of water heating on the stove metaphor again. 😉
Not so. The “constant composition” commitment studies referenced in this post are step functions. They look at what will happen if the atmospheric composition (not CO2 emission rates) stays constant at year 2000 levels, or year 2010 levels.
Manfred says:
January 10, 2013 at 11:45 am
Figure 4 says, your cloud data is wrong after 2004
http://s7.postimage.org/69qd0llcr/intermediate.gif
when things don’t fit, say that the data is poor…
Horse says:
January 10, 2013 at 12:11 pm
Apologies if I’ve missed something Dr. Svalgaard but you seem to be reticent about commenting on the suggestion that whilst TSI is generally stable, levels of UV and infra-red radiation vary considerably with time.
Stephen Wilde says:
January 10, 2013 at 12:28 pm
Stick to solar, Leif. When it comes to system responses to solar input that is outside your field
But well within yours ??? How many peer-reviewed papers in Science, Nature, etc have you published? How many times have your ‘work’ been widely credited of reviving the field of Sun-Weather-Climate research?
phlogiston says:
January 10, 2013 at 4:48 pm
Climate has nothing to do with numbers – at least not in the linear sense. Climate is a nonlinear / nonequilibrium pattern system, ignoring this and playing linear numbers games will only lead you down the garden path.
So you will be perfectly happy if the IPCC said: “by eyeballing the data, we predict really bad global warming some time in the future”. No you wouldn’t: you would require the data be properly number-crunched, the warming be quantified [with error bars], and the time frame specified.
Alec Rawls says:
January 10, 2013 at 6:17 pm
mountain of evidence for that solar activity is a primary driver of global temperature. (Two dozen references listed in the second section here.)
that is like arguing that smoking is healthy because so many people do it.
I can point to hundreds of papers that claim sun-weather-climate relationships.
Horse says:
January 10, 2013 at 12:11 pm
Apologies if I’ve missed something Dr. Svalgaard but you seem to be reticent about commenting on the suggestion that whilst TSI is generally stable, levels of UV and infra-red radiation vary considerably with time.
I forgot to respond to you. Here it is:
What do you mean by ‘vary considerably over time’? This is often where people confuse things. UV etc vary a lot on a day-to-day basis, or even on a year-to-year basis, but since solar activity is cyclic there is a much smaller variation from cycle to cycle. It is like the weather: it varies a lot from day-to-day and from season-to-season, but a lot less from year-to-year. We have a good measure of the amount of UV we get over a year simply by measuring the variation of the direction of a compass needle [ http://www.leif.org/research/CAWSES%20-%20Sunspots.pdf ] and that measure shows us that the UV varies just like the Sunspot Number, the radio flux from the sun, TSI and just about every solar indicator you can find. So, UV over time is as stable as TSI.
Well, it looks like I mischaracterized the CO2 increase. Apparently they are considering a ramp function up until the present, then constant compositions thereafter, correct? It does appear from your figure that there is an exponential decay to an asymptote that is the new equilibrium temperature, and we would presumably remain at that temperature as long as CO2 concentrations remain constant. I wonder why they didn’t use a ramp function continuing the present trend. Probably didn’t want to scare the children.
Do you agree that a step change in forcing simply produces a new equilibrium temperature and that the system will tend to asymptotically approach but not exceed that temperature? And when the forcing is removed the system will simply go back to its original temperature?
Leif Svalgaard says:
January 10, 2013 at 7:47 pm
Manfred says:
January 10, 2013 at 11:45 am
Figure 4 says, your cloud data is wrong after 2004
http://s7.postimage.org/69qd0llcr/intermediate.gif
when things don’t fit, say that the data is poor…
————————————————————
From above link:
False: change in satellite viewing angle
In the post 2004 period, the ISCCP reported cloud trend implausibly diverged from other cloud cover datasets and from albedo trends seen by earthshine
Studies confirm this viewing angle problem:
http://agwobserver.wordpress.com/2010/01/20/isccp-problems/
Would you believe that cloud cover decreased by 3% since the 1990s while temperature stopped warming ?
Leif Svalgaard says:
January 10, 2013 at 10:56 am
“To ‘rescue’ the hypothesis various tricks are employed: ‘amplification’, ‘feedback’, ‘other [much less energetic] variables’, etc. Most of these excuses seem to stem from an ardent and fervent wish to combat the AGW crowd with something, anything.”
============
Excuses ?
For what, the latest fevered dream in vogue.
“Catastrophic” has been dropped from the lexicon.
Next step: Anthropogenic
Which would only leave GW.
Still an “ardent and fervent” field of study, hypotheses will abound as we combat the enemy.
There was an enemy, right ?
phlogiston says:
January 10, 2013 at 4:58 pm
“The implication is profound. Human-like bipedality and associated intelligence can be lost as easily as gained. Once Homo starts to retreat from sentience there is no limit to the extent of this retreat.”
Thanks Phlogiston! I was not aware of that. A quite interesting coeval……….
@Poptech says:
“You seem confused, Mosher’s educational background consists of BA’s in English Literature and Philosophy. His “scientific” background involves bringing MP3 players to market for Creative Labs as a marketing director. Leif is an actual scientist.”
Thank you Poptech! Yes indeed, I was confused. Mosher is very well-spoken, so now it makes sense. His questions and statement used to seem sardonic to me. They seemed ignorant for a man of science – and so I got irritated by what he said. I really thought he was pretending not to understand his claims. Mosher’s comments makes much more sense to me know that I know where he’s coming from.
Leif on the other hand is passionate about his beliefs, and knows a ton about the solar physics.
Mario Lento says:
January 10, 2013 at 11:42 pm
==============
“You” got Mosher wrong, look it up !!
u.k.(us) says: “You” got Mosher wrong, look it up !!
Tell me what you mean?
Mario Lento says:
January 11, 2013 at 12:15 am
u.k.(us) says: “You” got Mosher wrong, look it up !!
Tell me what you mean?
==================
Off the top of my head, he helped put missiles thru any window you wanted.
Just to clarify things/or not.
Of course. The issue is the time frame. When talking about solar forcing the “consensus” claims that equilibration is rapid, less than ten years, with no significant continued warming after that. When talking about CO2, continued forcing at a given stepped up level is predicted to cause substantial continued warming for many decades. The latter has a lot of physics behind it (the full GCM modeling). The former is a bald assertion, with no explanation given what-so-ever.
Stephen Wilde says: “You said this:
“There is a multidecadal component to ENSO, and this can be seen by smoothing the NINO3.4 sea surface temperature anomalies with a 121-month (11-year) filter:
“http://i48.tinypic.com/eg672g.jpg
“I think there is more somewhere but we clearly discussed the issue in general terms there.”
Stephen, where in that did I state or imply “…upward stepping from one positve PDO to the next…”? I’m wondering about your use of the PDO in your statement.
Manfred says: “I watched your 1 hour movie and was impressed. “
Thanks.
Manfred says: “However, I could not follow the coclusion that the step changes after an El Nino and the subsequent plateaus are sufficient to explain all warming with ENSO.” And you continued, “Temperature may still be a superposition of 2 or more influences, for example a linear increase due to whatever and an ENSO influence, which would tthen still be a step up with El Nino but then a slowly declining temperature.”
Let’s break that “Rest-of-the-World” data (the portion with the upward steps) into two more subsets, by isolating the North Atlantic. For the South Atlantic-Indian-West Pacific we have the step up with the slowly declining temperatures between the major El Niños:
http://i48.tinypic.com/otg19s.jpg
It’s tough to claim a manmade global warming signal there when sea surface temperatures cool between the major El Niños.
Now the North Atlantic: Because the North Atlantic has the AMO, and because the AMO has been causing the North Atlantic to warm at a higher rate that the rest of the global oceans since the mid-1970s, it warms between the upward shifts:
http://i47.tinypic.com/35nc9w0.jpg
So the North Atlantic fits into your scenario of an ENSO-related signal on top of the warming trend (caused by the AMO), but the South Atlantic-Indian-West Pacific data does not.
Thanks for bringing that up. I did look into it. I didn’t have enough time, though, to go into that additional breakdown in the video, but I’ve discussed it in past posts and in the book.
Regards
Alec Rawls says: “I have seen Bob in the past articulate what I thought was a pretty good theory of how ENSO, by affecting cloud cover, could self-propagate. Has this theory been abandoned?”
Alec, you appear to be fixated with the word theory. Once again, I haven’t abandoned a theory because I have not presented a theory. I present data, and using multiple datasets—including sea surface temperature, sea level, ocean currents, ocean heat content, depth-averaged temperature, warm water volume, sea level pressure, cloud amount, precipitation, the strength and direction of the trade winds, downward shortwave radiation, etc.—I present cause and effect.
Alec Rawls says: “Setting aside Bob’s ridiculous demand to do what he does…”
That’s a very odd statement, Alec, considering I simply asked you if you were referring to Ocean Heat Content data in excess of 700 meters. How is that a “ridiculous demand to do what he does”?
Alec Rawls says: “…I am content to look at NOAA’s ocean heat content estimates…
http://www.ncdc.noaa.gov/bams-state-of-the-climate/2009-time-series/ohc
…and to consider the early numbers as they stand (despite the vast uncertainty in these very sparsely sourced estimates).”
Thank you, Alec, for confirming that you’re only considering the top 700 meters when discussing the “deeper ocean heat storage”, as you had when you wrote, “How people can be so fixated on the rapid temperature response of the upper ocean, to the point of thinking that deeper ocean heat storage does not matter, is just beyond me.”
And thank you for confirming the Ocean Heat Content data that I presented earlier was included as one of your “deeper ocean heat storage” datasets. The NODC data is the Levitus et al data.
And as I noted in my first comment to you on this thread (January 10, 2013 at 3:36 am), there is no slower warming of ocean heat content data. I’ll repost a portion here for you so you don’t have to scroll up to it.
HHHHHHHHH
The ocean heat content for the tropical Pacific warms immediately during the 3-year La Niña events:
http://i48.tinypic.com/wcilgk.jpg
And again immediately during the 1995/96 La Niña event:
http://i45.tinypic.com/1zgc2s8.jpg
Likewise, the ocean heat content for the tropics as a whole warm, with a 9-month lag, during the 3-year La Niña events:
http://i50.tinypic.com/egaj4w.jpg
The warming of the ocean heat content for the extratropical North Pacific is dependent on a 2-year climate shift in 1989-90. Without that shift, the ocean heat content for the extratropical North Pacific would cool:
http://i45.tinypic.com/1z1aiix.jpg
HHHHHHHHH
Alec Rawls says: “Bob seems to think this presents some great dilemma for solar warming theory, as if I am claiming that heat has to be getting stored in the oceans whenever solar activity is high.”
Your interpretation of my comments are odd, Alec. Please advise me where I have stated or implied what you’ve written. As far as I know, I have not.
Alec Rawls says: “Why look any further than internal variability, Bob asks, when ‘the warming has all been explained’?”
You’ve taken what I’ve written out of context, Alec. What you quoted was in response to your statement of “But on the longer time scale, where a slow warming could be expected to show up…”
I replied in full: It’s expected? Why? There’s no evidence of the mythical slow warming in the short-term data. The warming has all been explained.
Again, where’s this mythical slow warming, Alec? It does not appear in surface temperature data and it does not appear in the graphs of the ocean heat content for your “deeper ocean” as illustrated in the graphs above.
With respect to the rest of your comment, you have not answered my question that I’ve posed twice to you, with respect to the graphs I presented. Let me ask it one more time: So where’s the [lag] slow warming and where’s the solar influence? In other words, show me the data.
Manfred asks “Would you believe that cloud cover decreased by 3% since the 1990s while temperature stopped warming ?“.
No. See figure 2 in http://bbso.njit.edu/Research/EarthShine/literature/Palle_etal_2008_JGR.pdf
Earthshine found decreasing albedo through the 1990s, while temperatures were increasing, but increasing albedo since then.
The spike in 1991-2 is Pinatubo.
eric1skeptic says: “I’m not sure Bob and Alec are that far apart although I tend to agree more with Alec. Part of my interpretation of Bob’s theory is that the El NIno anomalies (e.g. 80′s and 90′s) permitted the gathered heat to be released to the rest of the world rather than stored in the deep ocean.”
Hi eric1skeptic. I don’t believe we’ve ever exchanged comments here.
I think you’ve misunderstood my portion of the argument with Alec. Alec and I are worlds apart. Alec claims there is a slow warming of the deep oceans (which he has clarified as 0-700 meters in his January 10, 2013 at 6:17 pm comment) in response to his “solar warming theory”. I presented a number of ocean heat content graphs (data, not a theory) that show ocean heat content for 0-700 meters, when examined in subsets, responds quickly to changes and that there’s no evidence of the mythical slow warming.
eric1skeptic says: “A constant sun is the only viable explanation for varying amounts of warming given ENSO-induced variations (which is mostly clouds). Thus a constantly warmer sun is an even better explanation of where the 1997/8 heat originated.”
The other explanation is as Leif has been saying all along—that the variations in solar energy are too small to describe the warming.
Further, the warm water (the heat) for the 1997/98 El Nino was created during the 1995/96 La Nina, by exceptionally strong trade winds and resulting low cloud cover in the western tropical Pacific. See McPhaden 1999:
http://lightning.sbs.ohio-state.edu/geo622/paper_enso_McPhaden1999.pdf
The 1995/96 La Nina is the leading edge of the spike in the ocean heat content in the mid-1990s here:
http://i48.tinypic.com/wcilgk.jpg
It effectively shifted up tropical Pacific Ocean Heat Content. Note how the dip after it (associated with the 1997/98 El Niño) only drops the Ocean Heat Content to the value before the 1995/96 La Niña. So all of the heat released and the warm water redistributed by the 1997/98 El Niño were created during the 1995/96 La Niña.
Also, to counter any thoughts of a direct influence of the solar cycle, the 1995/96 La Nina occurred near the minimum between SC22 and SC23.
Regards
phlogiston says: “Would you say we are heading into a La Nina now (or at least a ‘La Nina modoki’)? The east Pacific looks kinda cold, plus the trades seem to be holding up.”
It appears the sea surface temperatures in the eastern equatorial Pacific will cool below the present NINO3.4 values of -0.23 deg C:
http://bobtisdale.files.wordpress.com/2013/01/15-weekly-nino.png
There’s lots of cool subsurface water from the last upwelling Kelvin wave. See here:
http://www.cpc.ncep.noaa.gov/products/analysis_monitoring/enso_update/wkxzteq.shtml
and the Hovmoller on page 16 here:
http://www.cpc.ncep.noaa.gov/products/analysis_monitoring/lanina/enso_evolution-status-fcsts-web.pdf
How long will La Niña conditions last if they reach that level? Dunno.
There’s an off-equatorial pool of warm water that shows up in the NODC ocean heat content data…
http://i50.tinypic.com/1z5ork9.jpg
..and in the AVISO sea level anomalies for Dec 2012…
http://bulletin.aviso.oceanobs.com/html/produits/indic/enso/welcome_uk.php3
…and the JPL sea level anomalies, but not as pronounced. See the JPL map here:
http://sealevel.jpl.nasa.gov/images/latestdata/jason/2012/20121218G.jpg
I appears to be the leftovers from the El Niño conditions earlier in 2012. Run back in time a few maps here:
http://sealevel.jpl.nasa.gov/science/elninopdo/latestdata/archive/index.cfm?y=2012
If that pool heads north or works its way into the Indian Ocean, then it won’t be involved in the next downwelling Kelvin wave, but if it migrates south, it could help to strengthen the next one and bring us back to El Niño conditions again in 2013.
We’ll have to wait and watch.