
Guest post by Alec Rawls
They say it all the time: even if there were some substantial mechanism of enhanced solar forcing it couldn’t be responsible for late 20th century warming because solar activity was roughly constant from 1950 to 2000. I have rounded up statements to this effect from eighteen top “consensus” climatologists, like Raimund Muscheler (2012):
Solar activity & cosmic rays were relatively constant (high solar activity, strong shielding and low cosmic rays) in the second part of the 20th century and, therefore, it is unlikely that solar activity (whatever process) was involved in causing the warming since 1970.
Is he assuming that the oceans equilibrate rapidly to any change in forcing so that continued high forcing is necessary just to maintain the new equilibrium, resulting in only a brief shot of warming? He doesn’t say. None of them say. They just make this highly counterintuitive claim that persistent forcing cannot cause continued warming, as if they actually believe that it is the change in the forcing rather than the level of the forcing that does the warming.
The tune changes however, as soon as the subject is forcing from greenhouse gases. A staple of the crusade against CO2 is the “commitment study,” where climatologists use their general circulation computer models (GCMs) to estimate the amount of future warming that would result if atmospheric CO2 were to stop increasing and just stay at current levels. That means no change in forcing going forward, just continued forcing at the present “high” level. The estimates of the continued warming this would cause over the 21st century are quite large, roughly equivalent to 20th century warming, or in the latest estimations, substantially higher.
AR4 estimated the “constant composition” commitment at 0.1°C/decade for the early 21st century, 0.6 °C for the whole century
From AR4 (§10.7.1, PP4):
The multi-model average warming for all radiative forcing agents held constant at year 2000 (reported earlier for several of the models by Meehl et al., 2005c), is about 0.6°C for the period 2090 to 2099 relative to the 1980 to 1999 reference period. This is roughly the magnitude of warming simulated in the 20th century. Applying the same uncertainty assessment as for the SRES scenarios in Fig. 10.29 (–40 to +60%), the likely uncertainty range is 0.3°C to 0.9°C. Hansen et al. (2005a) calculate the current energy imbalance of the Earth to be 0.85 W m–2, implying that the unrealised global warming is about 0.6°C without any further increase in radiative forcing. The committed warming trend values show a rate of warming averaged over the first two decades of the 21st century of about 0.1°C per decade, due mainly to the slow response of the oceans. About twice as much warming (0.2°C per decade) would be expected if emissions are within the range of the SRES scenarios.
Should Gerald Meehl’s estimate of 21st century commitment be reduced in compensation for the fact that he uses a 1980 – 1999 temperature average as a baseline? It seems that a decade’s worth of his 21st century warming estimate is actually taking place between 1990 (the center of his baseline period) and 2000. If so, the compensation would be at most about 0.1°C. That is the peak rate of warming the models produce for year-2000 Green House Gas levels. 1980-1999 GHG levels were lower, hence modeled warming would have been less than 0.1°C between the 1990 midpoint of the period and 2000 so less than 0.1°C of Meehl’s estimate of 21st century warming would actually be taking place during the 20th century.
But maybe no adjustment is needed. Meehl et al. certainly do not hesitate in presenting their figures as estimates of “further warming” vis a vis 2000. From the Meehl 2005 abstract:
Two global coupled climate models show that even if the concentrations of greenhouse gases in the atmosphere had been stabilized in the year 2000, we are already committed to further global warming of about another half degree and an additional 320% sea level rise caused by thermal expansion by the end of the 21st century. … At any given point in time, even if concentrations are stabilized, there is a commitment to future climate changes that will be greater than those we have already observed.
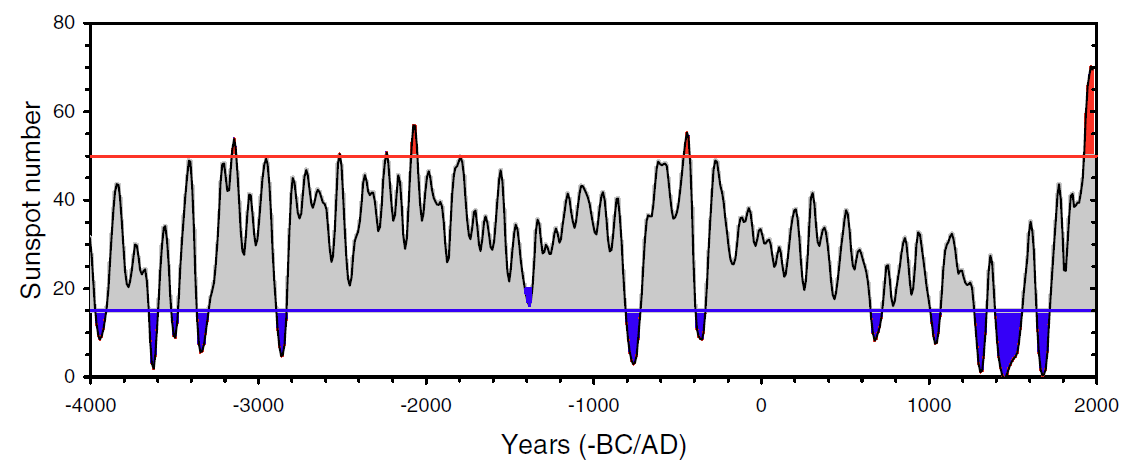
As for other commitment findings, Tom Wigley (2005) estimated that the “constant composition” warming commitment “could exceed 1°C,” and the graph at the top of the post is from Matthews and Weaver 2010, a pay-walled post-AR4 commitment study that was reviewed by Gavin Schmidt, who lists their commitment estimate from constant year-2000 GHG forcing as “an additional 0.3 to 0.8ºC warming over the 21st Century.”
AR5 commitment estimates are higher still, presumably because they project 2010 GHG levels. From the Second Order Draft (p. 12-60):
“Constant emission commitment” is the warming that would result from keeping anthropogenic emissions constant and is estimated for example at about 1–2.5°C by 2100 assuming constant (year 2010) emissions in the future, based on the MAGICC model calibrated to CMIP3 and C4MIP (Meinshausen et al., 2011a; Meinshausen et al., 2011b) (see FAQ 12.3).
At the low end, that is more warming than was seen during the 20th century, at the high end it is 3 to 4 times 20th century warming. Guess that nixes the idea of rapid ocean equilibration.
Talking out of both sides of their mouths
These commitment findings should be taken with a grain of salt. Would current levels of GHG forcing, which have coexisted with no statistically significant warming for 15 years now, really cause the present century to warm twice as fast as last? Such wild prognostications show how extravagantly the “consensus” scientists are willing to exaggerate in favor of their anti-CO2 narrative, but they can’t have it both ways. If they expect the persistence of a mildly elevated GHG forcing to cause many decades of substantial warming then it is pure dishonesty to turn around and declare that persistently elevated solar forcing, regardless of its level, could not cause more than a decade or two of warming.
Some of these scientists have done very important work. Ilya Usoskin, for instance, has been a pioneer in developing cosmogenic nucleotide proxies for solar activity. That makes it unsettling to have to call him out, but HEY USOSKIN, it’s about time you renounced the BUT in Usoskin et al. 2005:
The long term trends in solar data and in northern hemisphere temperatures have a correlation coefficient of about 0.7 – .8 at a 94% – 98% confidence level.
BUT:
During these last 30 years the total solar irradiance, solar UV irradiance and cosmic ray flux has not shown any significant secular trend, so that at least this most warming episode must have another source.
Usoskin himself classifies 1920 to 2000 as a “grand maximum” of solar activity, thus his claim here is that even if a historically powerful driver of climate remains at a high level for an extended period of time it will still not cause continued warming. To cause continued warming it would have to keep going up (to higher than high levels).
Does he actually believe that, or did it just seem like a small price to pay to stay in the good graces of the funding institutions that Al Gore, Maurice Strong, James Hansen, Stephen Schneider et al. established in the 1990s? In fact it is a huge price to pay. It is a complete debasement of scientific principle, handing the anti-CO2 crusaders an utterly fraudulent grounds for dismissing the alternative solar-warming hypothesis, and pretty much all of the leading solar scientists have embraced the same trope.
Whether this is bias or cowardice it needs to stop, and for anyone who wants to be silenced no longer, the commitment studies offer an ironclad opportunity. After all, the GCM guys have their own field of expertise. If the computer modelers insist that a steady high level of forcing will cause at least several decades of substantial continued warming then who are the solar scientists to contradict them? All they have to do is stop making highly speculative claims about ocean equilibration that lie completely outside of their field and are unsupported by any reason or evidence.
Usoskin’s solar estimates are “grand maximum” even if post-1945 Waldmeier-era sunspot counts are reduced by 20% as Leif Svalgaard urges
Usoskin uses a “high activity threshold” of 50 so even if his sunspot counts (“75 ± 3 since 1950“) are reduced by 20% they are still at “grand maximum” levels from the 1940s to the 1990s by Usoskin’s criteria.
Hat tip to Lucia Liljegren
I asked Lucia if she knew of any GCM tests of the solar warming hypothesis. Had the “consensus” ever GCM-tested their oft-repeated claim that even if there were a substantial mechanism of enhanced solar forcing it could not have caused late 20th century warming?
Not that she knew of, but she suggested that the results of a persistent elevated level of solar forcing should be roughly the same as for a persistent elevated level of GHG forcing, as examined in the commitment studies. In both cases the amount of warming would be the same. Both would be calibrated to account for observed 20th century warming, so the resulting ocean equilibration process should be similar.
Thanks Lucia. The “consensus” has indeed already in-effect GCM-tested the alternate hypothesis, with just a slight change in time frame. Fifty years of high solar activity beginning in 1950 are analogous to fifty years of 2010-level CO2 forcing beginning in 2010, and the predicted warming from the CO2 commitment testing directly contradicts the stated rationale for dismissing a solar explanation for late 20th century warming.
A relevant comment I made on the Nasa on the Sun thread earlier.
————————-
“I think to make sense of solar energy’s potential impact on the climate, we have to take it down to very, very tiny rates of energy that can accumulate in / be lost to the Earth system over time, each day, and/or over many years.
For example, the amount of energy which is accumulating in the Oceans and Land-Ice-Atmosphere is on the order 0.5 X 10^22 joules/m2/year. And there is 5 X10^14 m2 on the planet.
But the Sun’s energy is 386.4 X 10^22 joules/m2/year (+/- 0.14 10^22 in the solar cycle).
So if we can measure a 0.5 10^22 joules/m2/year there should be no reason to not assume some of the Sun’s energy can accumulate each year in the same way. There is no way every single 0.1 10^22 joules/m2 is balanced out by the emitted radiation ALL the time. We are talking about photons of energy here and they are not going be exactly balanced all the time.
A tiny, tiny difference in the Sun’s energy received versus the energy emitted each day is going to accumulate over time. I’m just saying, noone has ever looked at the issue this way that I am aware of.”
—-
I’d just add now, that there are accumulations of energy from the change in solar energy in the seasonal cycle. Land temperatures lag behind the Sun by 35 days. The Oceans/Lakes lag behind the Sun by 45 to 82 days. The energy accumulates and then drawsdown in the seasonal cycle.
The day-time temperatures lag behind the Sun by 3.5 hours. Another level of accumulation / drawdown.
I’ve calculated some of these numbers down to the second and it is an extremely small number – 0.007 joules/m2 per second but it actually works out to be 21,128,886,205,855,700 solar photons / m2 / second.
Now see what I’m saying. We need to move this down to the level where the real quantum world of energy and molecules operates at. Milliseconds and a single photons and an untold number of molecules on Earth.
Lief says that the sun’s variability is insufficient to have brought about the Global Warming that has been reported in the temperature data sets.
Bob says that the ocean is not warming which obviously supports Lief. It also seems to give the lie to the statement that temperatures are rising globally, let alone from made made CO2.
The actual recorded sea level change does not show any acceleration and in fact seems to be slowing down supporting Bob’s assertion regarding ocean temperatures based on his astonishing quantity and quality of data so clearly presented by him.
You are really left with only one conclusion. The Earth is not warming in any significant way and the temperature data sets have been fiddled with as is shown by the continual “adjustments” they are subjected to. Anthony has shown us that at least one of the keepers is running two sets of books and we have all seen with disbelief the continual claims of “unprecedented” extreme weather events which are nothing of the sort.
I am not a person who embraces any conspiracy theories but it is very strange that several keepers of the temperature data around the world are doing this and I have no doubt that they are.
Bob, you said this:
“There is a multidecadal component to ENSO, and this can be seen by smoothing the NINO3.4 sea surface temperature anomalies with a 121-month (11-year) filter:”
http://i48.tinypic.com/eg672g.jpg
I agree that you didn’t discuss it or speculate but I did.
It seems that from your data the peak of the 1990 positive Pacific Multidecadal Oscillation (not PDO) was higher than the 1930s peak.
All data should be looked at carefully for nuances that might help to explain reality and my take was then and is now that rising peaks from one positive phase to another would fit very well with the general rise in global sea and air temperatures from the Maunder Minimum to date.
It is likely that there was a series of rising steps from LIA to date and a series of falling steps from MWP to LIA.
Your suggestion that the observation represents a multidecadal component to ENSO is, I think, a less likely speculation than mine because it does not account for the progression of climate change from MWP to LIA to date whereas my interpretation does.
So, in my opinion, that uplift from the 1930s peak to the 1990s peak is in fact the solar signal working through the system in the background beneath the 60 year Pacific Multidecadal Oscillation.
Thanks for the explanations Bob. You said: “The other explanation is as Leif has been saying all along—that the variations in solar energy are too small to describe the warming.” and “Also, to counter any thoughts of a direct influence of the solar cycle, the 1995/96 La Nina occurred near the minimum between SC22 and SC23.”
I have to go with Alec and add this point: the 11 year solar cycles are not as important as the long term rise and fall of solar activity. It’s not that they don’t matter at all, but that 4 or 5 years (half of a cycle) is too short to have much of a noticeable effect against other natural variations.
OTOH, there was a high level of solar activity from the late 40’s to the early 2000’s. That “modern maximum” is not just someone’s fanciful notation on a chart, but a period of many decades of higher than normal activity with the usual cycles within it. Granted it’s not a lot of extra energy, only about a watt. But over long periods of time that extra solar energy (plus possible connection from extra solar to lower GCR to fewer clouds) can warm some ocean surfaces. The extra warming can only add to the release in the 97/98 El Nino.
My theory of warming is pretty simple, but with a couple of dimensions. There are contributing factors from ENSO heat storage and release, but only if substantial La Ninas are followed by substantial El Ninos (otherwise the heat is lost to the deep ocean). Solar always contributes, but is modulated by weather and by the sun itself. GHG gases always contribute and the manmade component adds to that slowly over time. Thus the 97/98 heat release was increased by solar and CO2 factors to some extent as they added to the heat stored in 95/96 and previously.
No Bob, I did not confirm for you that I am “only considering the top 700 meters when discussing the ‘deeper ocean heat storage’.” When I said I was content to look at the 0-700 meter data it was in response to your statement that: “The only dataset I’m aware of is the NODC’s ocean heat content data for 0-700 meters.”
This data set shows a 40s-70s dip in temperature for more than just the well mixed upper ocean layer, an event which poses some challenge to both the CO2-warming theory and the solar-warming theory. Clearly there is some mechanism of internal variation at work that can overpower these other forcings for at least a few decades. I just noted that the presence of such a mechanism does not mean that the other forcings are not at work. The different climate drives can be superimposed, and what other challenge does the ocean temperature data present to the solar-warming theory?
Apparently you did have something else in mind, something to do with the rapid rise in ocean heat content during a La Nina? Rising heat content during La Ninas makes sense to me. Cooler top water emits less IR and gives up less heat by conduction to the atmosphere while still absorbing as much shortwave, or more if the La Nina lessens cloud cover. But what in the world does this have to do with whatever other warming or cooling effects that it may be superimposed on?
Are you trying to claim that you can distinguish what heat content effects are due to the La Nina from what smaller contemporaneous heat content effects might be due to solar or CO2? Sounds most implausible to me, no matter how finely gridded your data is, and yes, the latter is what I was referring to when I said it is ridiculous for you to ask other people to do what you do. You may think that by working over these very short-lived data sets you can pull the various superimposed phenomena apart. I wish you luck, but the idea that you can come to strong conclusions on this basis (“all the warming”), sorry, I don’t begin to buy it.
Maybe you can figure out how ENSO works. That would be great. Maybe you have figured it out. I hope so. But for my purposes, I don’t see how any of this makes any difference to the things I’m saying.
I think Bob has figured out how ENSO works but there are two remaining gaps:
i) How the oscillation started in the first place. Bob (I think) feels it sufficient that it be an emergent property of a system with moving parts and resistance from adjoining land masses whereas I think it is a result of thermal instability arising from the fact that the ITCZ mean position being north of the equator more solar energy gets into the oceans south of the equator than north of it.
ii) An explanation as to why there is apparently a difference between the peaks of successive positive phases at about 60 year intervals when in general ENSO is supposed to be a zero sum process which ought to net out to zero over a 60 year timescale. Bob seems satisfied that that is what he calls a multidecadal component to ENSO but I prefer to interpret it as a background solar signal.
Bob has objected to my point i) above on the basis that the southern ocean surfaces are actually cooler than the northern oceans but I put that down to more evaporative cooling in the southern hemisphere combined with the fact that, in the northern hemisphere, energy in the oceans backs up north of the equator due to limited access to the polar regions for cooling purposes due to land mass obstacles in the northern hemisphere.
That still doesn’t seem to prevent surges of ‘excess’ energy from southern to northern hemisphere in the ENSO cycle though.
@ur momisugly Keith AB
I consider the reasons you outline ample cause to be skeptical of any accurate quantitative warming claims, but there are ample indications of warming in a more qualitative sense like glacier retreat (etc.) that it’s warmer now than say around 1900 and especially compared to circa 1700. Regardless of what Leif says, this correlates generally with sunspots at least on an anecdotal level of historical data considering the long lag times involved. (BTW: Bob is not saying the ocean hasn’t warmed since the LIA, just not lately, kind of like the rest of the climate.) I haven’t read all the comments between Alec and Bob, but I can’t say I’ve noticed any major conflict in their respective posts previously; I’ll need to take a closer look before commenting further.
Alec Rawls IMHO has put the CAGW advocates between a rock and a hard place here. They either have to claim there’s no CO2 warming “in the pipeline” which in effect greatly reduces “sensitivity” or admit there could be warming “in the pipeline” post solar activity peak. Either way it suggests a larger natural warming component than they’ve previously claimed was possible with their settled science.
Bob Tisdale IMHO generally puts CAGW advocates between a rock and a hard place about once a week to once a month; there’s just no way to resolve (try as they might) the observed heating pattern of the oceans not matching the expectations from CO2 induced warming and the ocean circulation patterns being a superior explanation of the claimed 20th century warming at least from a mechanistic perspective.
D Böehm Smokely sez:
No, only if you assume CO2 is the only driver of temperature (it isn’t) and that temperature is the only way we can measure increasing heat in the system (it isn’t). Stronger storms and melted sea ice use heat but don’t raise temperature.
And of course you are misattributing your second chart. The data is Phil Jones, the chart is the interpretation of Jo Nova.
Keith AB says:
January 11, 2013 at 4:51 am
Some very good stuff, but also this:
Yep, all big crimes are committed by “lone nuts,” and never, ever by a gang of nuts working together.
Alex and Bob If there’s a driver for El and La nino it would have to be this process http://www.ips.gov.au/Educational/5/2/3 Our first magnetic field line is the tropopause where the temperature is supose to be stable No rise or fall in temp’s’ so adding electrical energy to a stable regien of the atmosphere WILL create man made changes to the north south magnetic flow By charging up the tropopause (the glass ceiling for the greenhouse effect) blocks energy from escaping and entering the troposphere I guess the millitary use the tropopause to lissen in on world wide communication for secrity reasons. Pine Gap here in Australia is the heart for America’s security network from the other side of the world for lissening in. There’s a atmospheric energy inbalance and co2 gets the blame because of it’s negetive charge when in fact we release more electrons from our remote sensing and com’s systems. Because of the co2 negativity it gets carried North to the pole and this could explain why the polar jet strem is expanding south and if they want they can shift the jetstream further south by doing this http://hal.archives-ouvertes.fr/docs/00/31/64/49/PDF/angeo-16-1212-1998.pdf Question is the met office notified when and were weather modification is being carried out? and if not wouln’t all data be to noisy to get solid data.
@Alec Rawls: You respectfully wrote to Bob Tisdale: “You may think that by working over these very short-lived data sets you can pull the various superimposed phenomena apart. I wish you luck, but the idea that you can come to strong conclusions on this basis (“all the warming”), sorry, I don’t begin to buy it.”
I may be off base here. But I would like more people to take a look at the work that Bob has done. It makes sense to me based on data records, that Bob has been able to find where the heat goes based on ENSO events. This to me is a macro view of the heat picture – but when viewed this way, it seems eerily obvious. Of course the precision of the temperature data is greater than its accuracy, so it’s not possible to know where all the heat goes, I think. Bob makes a fantastic case if you go through the journey. Actually, I bought it… 8 bucks to be precise.
dvunkannon says:
January 11, 2013 at 1:55 pm
D Böehm Smokely sez:
January 10, 2013 at 9:38 am
Gary Pearse,
So are you saying that for 150 years up to the present with the warming periods the same duration and magnitude, that rapidly rising CO2 since the 1950s would not show itself in these periods. Take a ruler for the last ‘long’ warming period that appears to have come to an end in just before the end of the 20th Century, mark in the trend you believe is due to CO2 going forward to 2012 and lets see what residual natural trend there is. Now take this natural trend and plot it at the beginning of the previous warming trends and explain the residual without CO2.
It is a red herring to invoke latent heat in phase changes in ice for the recent change because the exact same thing happened to the ice in earlier periods. Lost Arctic ice was a big story in the 30s (they were also worrying about the seals – BTW. they were smart enough then to know that polar bears would be fine because the seals have to come to shore where the bears are lined up).
Sheesh, with all the models being wrong, with the UK met office now postponing temp rise until 2017 (no warming for over 20 years), with Israel and San Diego getting snow and frost, with Al Gore cashing in and going on to other opportunities, with the NYT chopping their environmental desk….. don’t be the last one to turn out the lights. What will it take!!!
dvunkannon,
Converting data into chart form does not make that data wrong. You just don’t like the fact that Phil Jones’ data deconstructs your belief that CO2 causes any measurable warming.
• • •
Jim W. says:
“Thanks for this post. It’s obvious the science is wrong and that CO2 and H2O don’t have any measurable effect on temperature.”
Exactly. That is what the planet is telling us.
Leif Svalgaard says:
January 10, 2013 at 7:47 pm
…
phlogiston says:
January 10, 2013 at 4:48 pm
Climate has nothing to do with numbers – at least not in the linear sense. Climate is a nonlinear / nonequilibrium pattern system, ignoring this and playing linear numbers games will only lead you down the garden path.
So you will be perfectly happy if the IPCC said: “by eyeballing the data, we predict really bad global warming some time in the future”. No you wouldn’t: you would require the data be properly number-crunched, the warming be quantified [with error bars], and the time frame specified.
OK my statement was OTT. If its numbers you want, here are some to get your teeth into:
http://wwwold.nioz.nl/public/fys/staff/leo_maas/publications/dkm.pdf
This paper by Doelman et al describes the unravelling of nonlinear tidal forcing of an enclosed coastal inlet. It looks like a nice analogy in a general way to seeing if a system is behaving like a nonlinear oscillator influenced by several periodic forcings. It turns out one’s first task is to derive the Melnikov function – or functions.
I believe that this is the sort of study needed to investigate any planetary or solar influences on climate, such forcing may not be strong resulting in direct following of the forcing frequency, but more complex due to weak forcing. Such weak nonlinear forcing would defeat simpel wiggle-matching approaches – however persistent – but might be revealed with the approapriate type of analysis, such as that reported here.
Stephen Wilde says:
January 11, 2013 at 1:02 pm
I think Bob has figured out how ENSO works but there are two remaining gaps:
i) How the oscillation started in the first place. Bob (I think) feels it sufficient that it be an emergent property of a system with moving parts and resistance from adjoining land masses whereas I think it is a result of thermal instability arising from the fact that the ITCZ mean position being north of the equator more solar energy gets into the oceans south of the equator than north of it.
ii) An explanation as to why there is apparently a difference between the peaks of successive positive phases at about 60 year intervals when in general ENSO is supposed to be a zero sum process which ought to net out to zero over a 60 year timescale. Bob seems satisfied that that is what he calls a multidecadal component to ENSO but I prefer to interpret it as a background solar signal.
This proposal – that phases of ENSO dominated by el Nino and La Nina are directly forced by oscillation solar parameters – is highly testable. We will have to see if such phase / regime changes in the past and future corellate to solar weather. Personally I feel there could be an intrinsic oscillation involved – but this does not rule out external forcing.
phlogiston says:
January 11, 2013 at 3:20 pm
I believe that this is the sort of study needed to investigate any planetary or solar influences on climate, such forcing may not be strong resulting in direct following of the forcing frequency, but more complex due to weak forcing.
Serious study of such things will be valuable, but they contrast strongly with the wild-eyed wiggle matching usually trotted out as proof of ‘open minds’.
@u.k.(us) says:
January 11, 2013 at 1:04 am
Mario Lento says:
January 11, 2013 at 12:15 am
u.k.(us) says: “You” got Mosher wrong, look it up !!
Tell me what you mean?
==================
Off the top of my head, he helped put missiles thru any window you wanted.
Just to clarify things/or not.
+++++++
I still do not understand where I have him wrong. What did I say that was incorrect?
Stephen Wilde says: “Your suggestion that the observation represents a multidecadal component to ENSO is, I think, a less likely speculation than mine because it does not account for the progression of climate change from MWP to LIA to date whereas my interpretation does.”
As I’ve written to you numerous times before, you need to present data to confirm your interpretations, otherwise you’re simply speculating.
Stephen Wilde says: “So, in my opinion, that uplift from the 1930s peak to the 1990s peak is in fact the solar signal working through the system in the background beneath the 60 year Pacific Multidecadal Oscillation.”
Same reply as above.
Eric (skeptic) says: “My theory of warming is pretty simple, but with a couple of dimensions. There are contributing factors from ENSO heat storage and release, but only if substantial La Ninas are followed by substantial El Ninos (otherwise the heat is lost to the deep ocean).”
What deep ocean data are you referring to that supports “the heat is lost to the deep ocean” during the otherwise timeframes?
Stephen Wilde, PS: Thank you for confirming that I’ve never discussed or speculated about “upward stepping from one positve PDO to the next”.
Alec Rawls says: “No Bob, I did not confirm for you that I am ‘only considering the top 700 meters when discussing the ‘deeper ocean heat storage’.” When I said I was content to look at the 0-700 meter data it was in response to your statement that: ‘The only dataset I’m aware of is the NODC’s ocean heat content data for 0-700 meters.’”
Good, I’m glad we’ve confirmed that you’re content with the NODC’s 0-700 meter data.
Alec Rawls says: “This data set shows a 40s-70s dip in temperature for more than just the well mixed upper ocean layer, an event which poses some challenge to both the CO2-warming theory and the solar-warming theory.”
On a global basis, the data does in fact show a cooling of ocean heat content from 1955 to the 1970s, as does the Pacific Ocean north of 24S (the tropical Pacific and the extratropical North Pacific):
http://i46.tinypic.com/25fu3q9.jpg
However, when you divide that Pacific data into two subsets, the tropical Pacific cools from 1957 to 1973 and it cools from 1976 to 1995:
http://i50.tinypic.com/juh9bb.jpg
Each one of those multidecadal cooling periods, and the fact that there’s an ENSO-related explanation for the short-term warming events, challenge “the CO2-warming theory and the solar-warming theory.”
And the North Pacific, north of the tropics, cooled from 1955 to 1988.
http://i48.tinypic.com/9gk192.jpg
That’s a continuous 3 decades of the data challenging “the CO2-warming theory and the solar-warming theory.”
So until the “the CO2-warming theory and the solar-warming theory” can explain the cooling of ocean heat content (0-700 meters) from 1957 to 1973, the cooling from 1976 to 1995 and the cooling from 1955 to 1988, those theories are based on faulty foundations.
That’s one of the problems with looking at data solely on a global basis, and that has been one of my messages for 4 years. The global ocean heat content data appears to present a long-term warming, but when we divide it into subsets, it shows long-term cooling with short-term warming. In fact, if we were to exclude the warming of ocean heat content in the tropical Pacific caused by the 1973-76 La Nina and the 1995/96 La Nina, the data would cool since 1957.
http://i47.tinypic.com/jhphmc.jpg
So the warming of the tropical Pacific over a 57-year term could be said to depend on 4 years of (La Nina-caused warming) data.
And if we exclude the warming of ocean heat content in the extratropical North Pacific caused by the obvious 1989/90 climate shift, the data cools since 1955.
http://i49.tinypic.com/29atwcp.jpg
And that means the warming of the extratropical Pacific to depths of 700 meters over a 57-year term depends on 2 years of data.
Both “the CO2-warming theory and the solar-warming theory” are flawed.
Alec Rawls says: “Apparently you did have something else in mind, something to do with the rapid rise in ocean heat content during a La Nina? Rising heat content during La Ninas makes sense to me.”
That’s what’s shown in this graph, which I included in my initial comment on this thread:
http://i48.tinypic.com/wcilgk.jpg
Alec Rawls says: “Cooler top water emits less IR and gives up less heat by conduction to the atmosphere while still absorbing as much shortwave, or more if the La Nina lessens cloud cover.”
The stronger Pacific trade winds associated with La Nina events do reduce cloud cover over the tropical Pacific.
http://i48.tinypic.com/15wawbd.jpg
Refer also to Pavlakis et al (2008):
http://www.atmos-chem-phys-discuss.net/8/6697/2008/acpd-8-6697-2008-print.pdf
Alec Rawls says: “But what in the world does this have to do with whatever other warming or cooling effects that it may be superimposed on?”
What other warming and cooling effects are you discussing?
Eric (skeptic) says: “GHG gases always contribute and the manmade component adds to that slowly over time. Thus the 97/98 heat release was increased by solar and CO2 factors to some extent as they added to the heat stored in 95/96 and previously.”
There’s no evidence that greenhouse gases contribute to the warming of sea surface temperatures or ocean heat content. Let me borrow a few graphs from my reply to Alec above to illustrate this.
The ocean heat content for the tropical Pacific cools from 1957 to 1973 and it cools from 1976 to 1995:
http://i50.tinypic.com/juh9bb.jpg
Where’s the greenhouse gas-driven warming from 1957 to 1973 and from 1976 to 1995?
The ocean heat content for the North Pacific, north of the tropics, cooled from 1955 to 1988.
http://i48.tinypic.com/9gk192.jpg
Where’s the greenhouse gas driven-warming from 1955 to 1988?
Or, to look at the data another way, we can exclude the warming of ocean heat content in the tropical Pacific caused by the 1973-76 La Nina and the 1995/96 La Nina. The data cools since 1957.
http://i47.tinypic.com/jhphmc.jpg
Where’s the greenhouse gas driven-warming from 1955 to 2012, without those La Ninas?
Again, to look at the data differently, we can exclude the warming of ocean heat content in the extratropical North Pacific caused by the obvious 1989/90 climate shift. The data then cools since 1955.
http://i49.tinypic.com/29atwcp.jpg
Where’s the greenhouse gas driven-warming from 1955 to 2012 without that 2-year climate shift?
Have you seen me break down satellite-era sea surface temperatures? The sea surface temperatures for the East Pacific haven’t warmed in 31 years:
http://oi48.tinypic.com/flkhmb.jpg
Where’s the greenhouse gas driven-warming of the East Pacific from 1982 to 2012?
The sea surface temperatures for the South Atlantic-Indian-West Pacific cools between the strong El Nino events of 1986/87/88 and 1997/98 and cools between the strong El Nino events of 1997/98 and 2009/10:
http://oi48.tinypic.com/otg19s.jpg
Where’s the greenhouse gas driven-warming from 1988 to 1997 and from 1998 to 2009?
That leaves the sea surface temperature data for the North Atlantic, with the Atlantic Multidecadal Oscillation, which, since the mid-1970s, has provided additional natural warming of the North Atlantic sea surface temperatures above the natural warming of the other ocean basins.
Greenhouse gases appear as though they simply cause a little more evaporation from the ocean surfaces as oceanographers and physicists have been saying all along.
jmorpuss says: “Alex and Bob If there’s a driver for El and La nino it would have to be this process http://www.ips.gov.au/Educational/5/2/3”
I took a quick look but did not see a data source, so that I could compare it to an ENSO index. Do you have a link to a dataset?
Bob the link above doesn’t take you to were it should I’ll post it again here http://www.ips.gov.au/Educational/5/2/3#prop And if it’s the power data you request then good luck on that one I’ve tried to get ERP (effective radiated power) figures with no luck.