
Guest post by Alec Rawls
They say it all the time: even if there were some substantial mechanism of enhanced solar forcing it couldn’t be responsible for late 20th century warming because solar activity was roughly constant from 1950 to 2000. I have rounded up statements to this effect from eighteen top “consensus” climatologists, like Raimund Muscheler (2012):
Solar activity & cosmic rays were relatively constant (high solar activity, strong shielding and low cosmic rays) in the second part of the 20th century and, therefore, it is unlikely that solar activity (whatever process) was involved in causing the warming since 1970.
Is he assuming that the oceans equilibrate rapidly to any change in forcing so that continued high forcing is necessary just to maintain the new equilibrium, resulting in only a brief shot of warming? He doesn’t say. None of them say. They just make this highly counterintuitive claim that persistent forcing cannot cause continued warming, as if they actually believe that it is the change in the forcing rather than the level of the forcing that does the warming.
The tune changes however, as soon as the subject is forcing from greenhouse gases. A staple of the crusade against CO2 is the “commitment study,” where climatologists use their general circulation computer models (GCMs) to estimate the amount of future warming that would result if atmospheric CO2 were to stop increasing and just stay at current levels. That means no change in forcing going forward, just continued forcing at the present “high” level. The estimates of the continued warming this would cause over the 21st century are quite large, roughly equivalent to 20th century warming, or in the latest estimations, substantially higher.
AR4 estimated the “constant composition” commitment at 0.1°C/decade for the early 21st century, 0.6 °C for the whole century
From AR4 (§10.7.1, PP4):
The multi-model average warming for all radiative forcing agents held constant at year 2000 (reported earlier for several of the models by Meehl et al., 2005c), is about 0.6°C for the period 2090 to 2099 relative to the 1980 to 1999 reference period. This is roughly the magnitude of warming simulated in the 20th century. Applying the same uncertainty assessment as for the SRES scenarios in Fig. 10.29 (–40 to +60%), the likely uncertainty range is 0.3°C to 0.9°C. Hansen et al. (2005a) calculate the current energy imbalance of the Earth to be 0.85 W m–2, implying that the unrealised global warming is about 0.6°C without any further increase in radiative forcing. The committed warming trend values show a rate of warming averaged over the first two decades of the 21st century of about 0.1°C per decade, due mainly to the slow response of the oceans. About twice as much warming (0.2°C per decade) would be expected if emissions are within the range of the SRES scenarios.
Should Gerald Meehl’s estimate of 21st century commitment be reduced in compensation for the fact that he uses a 1980 – 1999 temperature average as a baseline? It seems that a decade’s worth of his 21st century warming estimate is actually taking place between 1990 (the center of his baseline period) and 2000. If so, the compensation would be at most about 0.1°C. That is the peak rate of warming the models produce for year-2000 Green House Gas levels. 1980-1999 GHG levels were lower, hence modeled warming would have been less than 0.1°C between the 1990 midpoint of the period and 2000 so less than 0.1°C of Meehl’s estimate of 21st century warming would actually be taking place during the 20th century.
But maybe no adjustment is needed. Meehl et al. certainly do not hesitate in presenting their figures as estimates of “further warming” vis a vis 2000. From the Meehl 2005 abstract:
Two global coupled climate models show that even if the concentrations of greenhouse gases in the atmosphere had been stabilized in the year 2000, we are already committed to further global warming of about another half degree and an additional 320% sea level rise caused by thermal expansion by the end of the 21st century. … At any given point in time, even if concentrations are stabilized, there is a commitment to future climate changes that will be greater than those we have already observed.
As for other commitment findings, Tom Wigley (2005) estimated that the “constant composition” warming commitment “could exceed 1°C,” and the graph at the top of the post is from Matthews and Weaver 2010, a pay-walled post-AR4 commitment study that was reviewed by Gavin Schmidt, who lists their commitment estimate from constant year-2000 GHG forcing as “an additional 0.3 to 0.8ºC warming over the 21st Century.”
AR5 commitment estimates are higher still, presumably because they project 2010 GHG levels. From the Second Order Draft (p. 12-60):
“Constant emission commitment” is the warming that would result from keeping anthropogenic emissions constant and is estimated for example at about 1–2.5°C by 2100 assuming constant (year 2010) emissions in the future, based on the MAGICC model calibrated to CMIP3 and C4MIP (Meinshausen et al., 2011a; Meinshausen et al., 2011b) (see FAQ 12.3).
At the low end, that is more warming than was seen during the 20th century, at the high end it is 3 to 4 times 20th century warming. Guess that nixes the idea of rapid ocean equilibration.
Talking out of both sides of their mouths
These commitment findings should be taken with a grain of salt. Would current levels of GHG forcing, which have coexisted with no statistically significant warming for 15 years now, really cause the present century to warm twice as fast as last? Such wild prognostications show how extravagantly the “consensus” scientists are willing to exaggerate in favor of their anti-CO2 narrative, but they can’t have it both ways. If they expect the persistence of a mildly elevated GHG forcing to cause many decades of substantial warming then it is pure dishonesty to turn around and declare that persistently elevated solar forcing, regardless of its level, could not cause more than a decade or two of warming.
Some of these scientists have done very important work. Ilya Usoskin, for instance, has been a pioneer in developing cosmogenic nucleotide proxies for solar activity. That makes it unsettling to have to call him out, but HEY USOSKIN, it’s about time you renounced the BUT in Usoskin et al. 2005:
The long term trends in solar data and in northern hemisphere temperatures have a correlation coefficient of about 0.7 – .8 at a 94% – 98% confidence level.
BUT:
During these last 30 years the total solar irradiance, solar UV irradiance and cosmic ray flux has not shown any significant secular trend, so that at least this most warming episode must have another source.
Usoskin himself classifies 1920 to 2000 as a “grand maximum” of solar activity, thus his claim here is that even if a historically powerful driver of climate remains at a high level for an extended period of time it will still not cause continued warming. To cause continued warming it would have to keep going up (to higher than high levels).
Does he actually believe that, or did it just seem like a small price to pay to stay in the good graces of the funding institutions that Al Gore, Maurice Strong, James Hansen, Stephen Schneider et al. established in the 1990s? In fact it is a huge price to pay. It is a complete debasement of scientific principle, handing the anti-CO2 crusaders an utterly fraudulent grounds for dismissing the alternative solar-warming hypothesis, and pretty much all of the leading solar scientists have embraced the same trope.
Whether this is bias or cowardice it needs to stop, and for anyone who wants to be silenced no longer, the commitment studies offer an ironclad opportunity. After all, the GCM guys have their own field of expertise. If the computer modelers insist that a steady high level of forcing will cause at least several decades of substantial continued warming then who are the solar scientists to contradict them? All they have to do is stop making highly speculative claims about ocean equilibration that lie completely outside of their field and are unsupported by any reason or evidence.
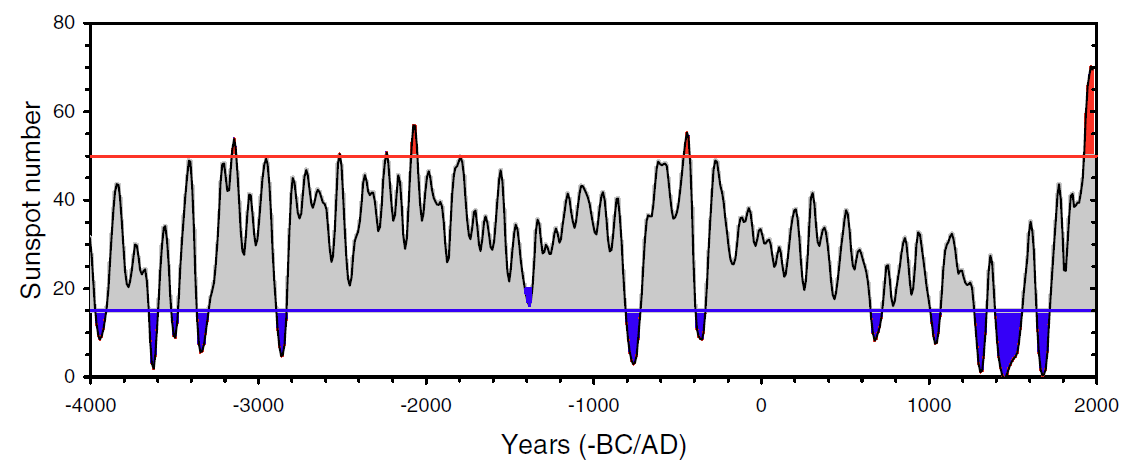
Usoskin’s solar estimates are “grand maximum” even if post-1945 Waldmeier-era sunspot counts are reduced by 20% as Leif Svalgaard urges
Usoskin uses a “high activity threshold” of 50 so even if his sunspot counts (“75 ± 3 since 1950“) are reduced by 20% they are still at “grand maximum” levels from the 1940s to the 1990s by Usoskin’s criteria.
Hat tip to Lucia Liljegren
I asked Lucia if she knew of any GCM tests of the solar warming hypothesis. Had the “consensus” ever GCM-tested their oft-repeated claim that even if there were a substantial mechanism of enhanced solar forcing it could not have caused late 20th century warming?
Not that she knew of, but she suggested that the results of a persistent elevated level of solar forcing should be roughly the same as for a persistent elevated level of GHG forcing, as examined in the commitment studies. In both cases the amount of warming would be the same. Both would be calibrated to account for observed 20th century warming, so the resulting ocean equilibration process should be similar.
Thanks Lucia. The “consensus” has indeed already in-effect GCM-tested the alternate hypothesis, with just a slight change in time frame. Fifty years of high solar activity beginning in 1950 are analogous to fifty years of 2010-level CO2 forcing beginning in 2010, and the predicted warming from the CO2 commitment testing directly contradicts the stated rationale for dismissing a solar explanation for late 20th century warming.
Leif Svalgaard says:
January 10, 2013 at 8:55 am
Stephen Wilde says:
January 10, 2013 at 7:45 am
” We are now seeing more equatorward meridional jets and increasing cloudiness with the less active sun”.
Actually not: http://www.leif.org/research/Cloud-Cover-GCR-Disconnect.png
—————————————–
Figure 4 says, your cloud data is wrong after 2004
http://s7.postimage.org/69qd0llcr/intermediate.gif
Side bar: Bern 2.5CC is sort of interesting. Always in search of analogies with other types of systems, Bern 2.5CC looks a lot like an overshoot situation. With something like a clock in a circuit you see overshoot when the state goes low to high or high to low. Hmmm … where are we NOW? In the high or low state?
But he will run out of evidence.
Keep at ’em Leif.
I think the GCM’s are rigged to give too much feedback from water vapor, and thus overestimate the expected warming, but I’m not going to jump on the solar bandwagon just as a desperate countermeasure to the CO2 catastrophists.
And if it the data starts to support the carbonphobes, well, then I’ll admit I was wrong and buy that damn Prius.
Apologies if I’ve missed something Dr. Svalgaard but you seem to be reticent about commenting on the suggestion that whilst TSI is generally stable, levels of UV and infra-red radiation vary considerably with time.
I’m not trying to make any point or enter the rather fractious debate in this thread – just interested.
Leif:
I’m better with numbers than you seem to be with non solar aspects of climate.
Besides, I asked the mods to correct my post to refer to the 18th century but they didn’t get around to it.
Leif said:
“You clearly show that the sun is not the driver of these major climate shifts”
Hardly.
Bob Tisdale’s work shows upward stepping from one positve PDO to the next so where do you think the extra energy is coming from ?
Stick to solar, Leif. When it comes to system responses to solar input that is outside your field 🙂
Manfred says:
January 10, 2013 at 11:45 am
Leif Svalgaard says:
January 10, 2013 at 8:55 am
Stephen Wilde says:
January 10, 2013 at 7:45 am
” We are now seeing more equatorward meridional jets and increasing cloudiness with the less active sun”.
Actually not: http://www.leif.org/research/Cloud-Cover-GCR-Disconnect.png
—————————————–
Figure 4 says, your cloud data is wrong after 2004
http://s7.postimage.org/69qd0llcr/intermediate.gif
——————————————
The data IS wrong post 2004. A 3% decrease in cloud cover since the 1990s should have caused a massiv temperature increase and not a warming pause.
Leif says: “Never good with numbers you were. Perhaps you mean the 18th century?”
Leif claims to have discovered that 18th century solar activity is way underestimated. The obvious reaction that would occur to pretty much anybody is: “wow, that really strengthens the case for a solar explanation of the rapid temperature recovery from the Little Ice Age.”
But not Leif. Even when Stephen sticks it in his face he says: “Oh look, a squirrel!”
Which is the reason I take Leif’s claims about the solar record with a grain of salt. He’s got just about the most blatantly biased cognitive style I’ve ever seen.
But if he is right, and I give plenty of credence to that possibility too, it does not in any way weaken the case for post LIA warming (including late 20th century warming) having been caused by the sun, and even strengthens the case at some points.
Interesting post at http://ars.els-cdn.com/content… by Ole Humlum and others regarding CO2 levels tracking temperatures.
The main reason they claim rubbish such as continued heat input can’t cause warming is because they think they know the maximum blackbody temperature the Solar radiation can cause.
This claim is so absurdly wrong it is no longer funny.
Any model that says the maximum temperature caused by radiation can be calculated by quartering the radiation field and ignoring day and night is just absurd.
Perhaps they should look again at their workings and note they are calculating the average output, not the real input.
When will the Met Office come clean and let us know how much electrical energy their radars pump into the atmosphere 24/7 The primary forcer is the electron and all wireless com’s and detecting release electrons as waste (pollution) There are 2 components to a radio wave an electrical part and a magnetic part and it’s the magnetic part (data) that is collected and used while the electrical part is the carrier (force) There is over a terrawatt plus of power transmitted per hour by our TV network American ERP (effective radiated power) for TV stations is 100,000 watts. By increasing the electrical energy of the atmosphere it becomes more energetic hence atmospheric heating is taking place.
Alec Rawls says: “But Bob wants to change the subject. Okay. I agree with him that there should be no lag in solar warming, but he seems to THINK that I am talking about some kind of lagged warming. No, I am talking about a SLOW warming…”
I haven’t changed the subject. There’s no evidence of the slow [lagged] warming—or didn’t you bother to look at the graphs I linked earlier?
Alec Rawls says: “A slow warming is going to be easily obscured by natural variation.”
What slow warming? If the short-term warming explains all of the warming, what additional slow warming is there? I presented Ocean Heat Content in my earlier comment to you. The slow warming doesn’t exist in it. It also doesn’t exist in sea surface temperatures. The responses of sea surface temperatures are also in months, not some non-existent lagged [slow] warming.
Alec Rawls says: “I do not at all dismiss Bob’s theory that ENSO can be a driver of internal variation.”
I haven’t presented a theory. I have presented data with the global oceans divided into logical subsets.
Alec Rawls says: “That theory just doesn’t account for the now-mountain of evidence that solar activity is a primary driver of global temperature.”
What mountain of evidence? In my earlier comment to you, January 10, 2013 at 3:36 am, I presented ocean heat content for the tropical Pacific and the extratropical North Pacific. Does your mountain of evidence explain the warming to 700 meters, since 1955, for those two large portions of the global oceans? No. Then your mountain of evidence has a faulty foundation. Your mountain of evidence also doesn’t explain the warming of global sea surface temperatures over the past 30+ years. Would you like me to present that as well here?
I ended that earlier comment with a question to you, So where’s the lag and where’s the solar influence? In other words, show me the data.
Since my use of the word lagged seems to have upset you, let me rewrite it: So where’s the slow warming and where’s the solar influence? In other words, show me the data.
Alec Rawls says: “But on the longer time scale, where a slow warming could be expected to show up…”
It’s expected? Why? There’s no evidence of the mythical slow warming in the short-term data. The warming has all been explained.
Alec Rawls says: “How people can be so fixated on the rapid temperature response of the upper ocean, to the point of thinking that deeper ocean heat storage does not matter, is just beyond me.”
Are you discussing depths in excess of 700 meters? If so, please provide a link to the data for the “deeper ocean storage” you’re referring to, with the data available on a gridded basis so that all of us can examine it in logical subsets. The only dataset I’m aware of is the NODC’s ocean heat content data for 0-700 meters, parts of which I presented earlier.
In a reply to Leif Svalgaard, Stephen Wilde says: “Bob Tisdale’s work shows upward stepping from one positve PDO to the next…”
Please link the graphs and posts in which I have presented “upward stepping from one positve PDO to the next”. I do not recall ever preparing graphs or writing posts where I have discussed “upward stepping from one positve PDO to the next”. In fact—to the contrary—I have presented numerous posts which discuss that there’s no mechanism through which the PDO can cause changes in surface temperature. The process that causes those shifts is ENSO. And you’re aware of that, so I’m not sure why you’re trying to confuse matters here.
Bob.
I’m sure you have produced a graph somewhere that showed upward stepping but I’m unable to refer to it since your output is so large and I wouldn’t know where to start.
I accept that you may not have entered into a discussion of it.
Here you go, Bob.
In this thread:
http://wattsupwiththat.com/2012/06/18/sea-surface-temperature-approaching-the-threshold-of-el-nino/
You said this:
There is a multidecadal component to ENSO, and this can be seen by smoothing the NINO3.4 sea surface temperature anomalies with a 121-month (11-year) filter:
http://i48.tinypic.com/eg672g.jpg
I think there is more somewhere but we clearly discussed the issue in general terms there.
Alec Rawls wrote:
“This continued warming is not a lagged response to the step up in forcing. It is an ongoing response to the ongoing high level of forcing”.
Yes agree, my comment was just sloppy; if solar activity stayed relatively high in the mid to late 20th century then heat would continue to rise due to the “ongoing high level of forcing”.
And I agree with those who think clouds could be just about enough/or at least a major factor to amplify the ‘apparently’ ‘small’ changes in solar activity to account for 20th century temperatures (with a small effect from rising c02). If we don’t have full cloud coverage data from at least the early 20th century, as well as the correct understanding of their effects, then we can’t properly assess what amplifying/nullifying effect clouds may have had with changes in solar activity during this time.
I’m highly suspicous of clouds, using e.g. basic simple observations, e.g. on a hot day the sun burns some of them off, and it gets warmer; a very simple, child-like observation that might have something to do with longer term termperature trends. Simple, field based observations are often more effective in understanding nature than fancy mathematics and computer modelling, I’m thinking of making an exhaustive list of such basic, simple natural observations which are also the basis of the empirical experimental method and science in general, and see where the climate modellers might err, or where they simply just ignore them.
Bob Tisdale,
I watched your 1 hour movie and was impressed.
However, I could not follow the coclusion that the step changes after an El Nino and the subsequent plateaus are sufficient to explain all warming with ENSO.
Temperature may still be a superposition of 2 or more influences, for example a linear increase due to whatever and an ENSO influence, which would tthen still be a step up with El Nino but then a slowly declining temperature.
ntesdorf says:
January 10, 2013 at 2:06 pm
That link doesn’t work. Did you mean this one?
http://www.sciencedirect.com/science/article/pii/S0921818112001658
Leif Svalgaard says:
January 10, 2013 at 10:46 am
Stephen Wilde says:
January 10, 2013 at 10:31 am
He knows full well that the PDO was negative at the time which allowed a slight cooling to start on the downslope from high solar cycle 19 which was then consolidated during lower (but still high) cycle 20.
Apart from the fact that serious cooling started in the late 1940s
http://jonova.s3.amazonaws.com/graphs/hadley/Hadley-global-temps-1850-2010-web.jpg
And cycle 20 was lowest full cycle since the 1930s [so not ‘still high’], but then numbers have never been your strong side 🙂
Climate has nothing to do with numbers – at least not in the linear sense. Climate is a nonlinear / nonequilibrium pattern system, ignoring this and playing linear numbers games will only lead you down the garden path. Pattern recognition is more important here than number-crunching. Some people get this, others not – probably genetic.
Bob
Would you say we are heading into a La Nina now (or at least a “La Nina modoki”)? The east Pacific looks kinda cold, plus the trades seem to be holding up.
Ian W says:
January 10, 2013 at 3:34 am
…..I would say that there will be some high profile scientists and politicians that may need to ‘do a Maurice Strong’ and decamp to one of the countries that won from the ‘nature trick’ they pulled on the taxpayers. There could be ‘Tahrir Square protests’ coming to cities near you – I don’t think this will be a gentle landing.
>>>>>>>>>>>>>>>>>>>>>>>>>>>>>>>>
And that is EXACTLY what they are hoping for!
Remember the ultimate goal is Global Governance.
There is a darn good reason the USA and Canada military signed the February 14th Agreement. [T]he United States and Canada entered into a military agreement on February 14, 2008,allowing the armed forces from one nation to support the armed forces of the other nation during a domestic civil emergency, even one that does not involve a cross-border crisis, according to a police commander involved in homeland security planning and implementation.
Whether this agreement is benign or not is anyones guess. I lost all faith in the good intentions of the US government when they moved the foot and mouth testing laboratory off Plum Island into the middle of cattle country (Kansas) just after the UK foot and mouth outbreak was traced to Pirbright Labs. This was despite the fact …an FMD simulation
exercise by U.S. Department of Agriculture called “Crimson Sky” reports that the
disease can reach 35 states within 10 days, and about 40% of cattle livestock would
need to be slaughtered if five farms are infected simultaneously (McGinn and Hoffman,
2002). Another study also warns that FMD could affect 30-70% of the U.S. livestock
if the government fails to stamp out the disease within a reasonable time frame (Federal
Inter-Agency Working Group, 2003).
Monsanto already has a patent on pigs and there is the INTERNATIONAL COMMITTEE FOR ANIMAL RECORDING: PATENTING IN THE ANIMAL SECTOR just incase you wondered what the ‘advantage’ of destroying US livestock was. /cynicism>
William McClenney says:
January 9, 2013 at 10:59 pm
About a decade ago now I coined two terms, the first being that we live in the “post-sentient age”.
The second was supposed to be a spoof, the “Theory of Inverse Reality”, in which you take any argument, construct its antithesis and shove-off.
Post-sentient essentially means unconscious. Unaware. Likely unable to follow Alec’s presentation or “Mike’s Nature Trick”.
Most adherents of AGW I speak with have no clue of when they live (possibly the end Holocene). Eyes tend to glaze over pretty quickly when you go through the “lite” version of the last several interglacials. It’s like, so what? It either actually does not matter to them if sea levels were somewhere between 6 and 42 meters higher than present at the end of the last one, or its just that the decision has already been made, for whatever reason, their data banks are full on what they needed to come to their commitment. The no longer aware, post-sentient, hominid.
There is a theory – advanced by John Gribben and some others – that our nearest relatives the chimps and gorillas descended from hominids similar to our not so distant ancenstors. People have looked for a nonbipedal common ancestor but not found one, the further they go back toward the 7 million years ago indicated by genetics as the age of the chimp / human common ancestor, the older ancestors keep on showing up as bipedal. The origin of upright bipedality seems be before, not after, the chimp / human common ancestor. The implication is profound. Human-like bipedality and associated intelligence can be lost as easily as gained. Once Homo starts to retreat from sentience there is no limit to the extent of this retreat.
Rosco says:
January 10, 2013 at 2:10 pm
…Any model that says the maximum temperature caused by radiation can be calculated by quartering the radiation field and ignoring day and night is just absurd….
>>>>>>>>>>>>>>>>>>>>>>>>>>>
‘Quartering the radiation field and ignoring day and night’ also quarters the delta in the TSI so it can be safely ignored.
“The interior of Alaska is seeing tremendously cold weather this winter.”
Tremendously warm.