By WUWT regular “Just The Facts”
I am often amused by claims that we understand Earth’s climate system, are able to accurately measure its behavior, eliminate all potential variables except CO2 as the primary driver of Earth’s temperature and make predictions of Earth’s temperature decades into the future, all with a high degree of confidence. I have been studying Earth’s climate system for several years and have found it to be a ridiculously complex, continually evolving and sometimes chaotic beast. Furthermore, our understanding of Earth’s climate system is currently rudimentary at best, our measurement capabilities are limited and our historical record is laughably brief. To help demonstrate the complexity of Earth’s climate system I have been compiling a list of all of the variables potentially involved in Earth’s climate system. This is a work in progress so additions, recommendations, corrections, questions etc. are most welcome. Once I develop this further and polish it up a bit I plan to convert it into a new WUWT Reference Page.
UPDATED: This list has undergone significant revisions and improvements based upon crowdsourcing the input of an array of very intelligent and knowledgeable contributors below. Additionally, this list was posted in comments in WUWT a few times previously, receiving input from a number of other very intelligent and knowledgeable contributors. This thread, along with links to the precursor threads below, will thus serve as the bibliography for the forthcoming WUWT Potential Climatic Variables reference page (unless someone can up with a better name for it…:)
1. Earth’s Rotational Energy;
http://en.wikipedia.org/wiki/Rotational_energy
http://en.wikipedia.org/wiki/Earth%27s_rotation
http://www.physicalgeography.net/fundamentals/6h.html
results in day and night;
http://wiki.answers.com/Q/Why_does_rotation_cause_day_and_night
causes the Coriolis Effect;
http://en.wikipedia.org/wiki/Coriolis_effect
imparts Planetary Vorticity on the oceans;
http://oceanworld.tamu.edu/resources/ocng_textbook/chapter12/chapter12_01.htm
and manifests as Ocean Gyres;
http://en.wikipedia.org/wiki/Ocean_gyre
the Antarctic Circumpolar Current;
http://en.wikipedia.org/wiki/Antarctic_Circumpolar_Current
http://en.wikipedia.org/wiki/File:Conveyor_belt.svg
Arctic Ocean Circulation;
http://www.whoi.edu/page.do?pid=12455&tid=441&cid=47170&ct=61&article=20727
http://www.john-daly.com/polar/flows.jpg
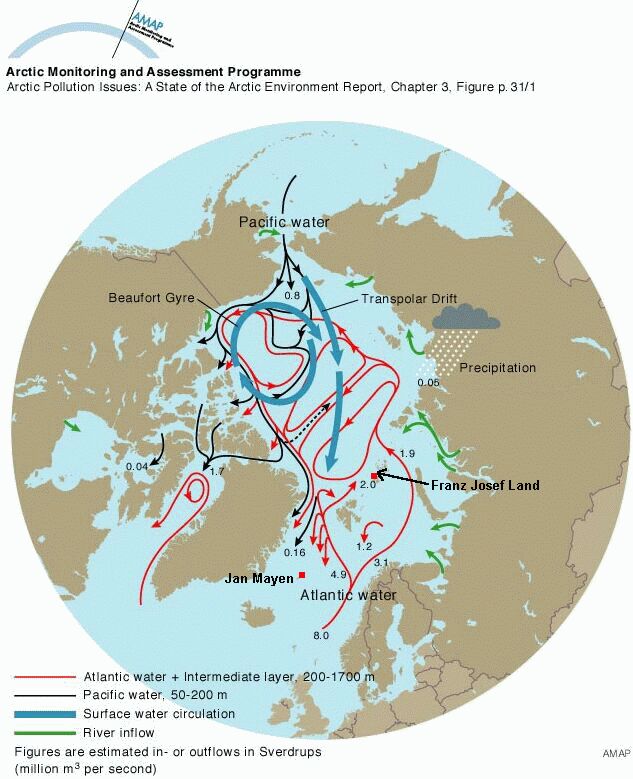
can result in the formation of Polynya;
http://en.wikipedia.org/wiki/Polynya
and causes the Equatorial Bulge:
http://en.wikipedia.org/wiki/Equatorial_bulge
Earth’s Rotational Energy influences Atmospheric Circulation;
http://en.wikipedia.org/wiki/Atmospheric_circulation
including the Jet Stream;
http://en.wikipedia.org/wiki/Jet_stream
Westerlies;
http://en.wikipedia.org/wiki/Westerlies
Tradewinds;
http://en.wikipedia.org/wiki/Trade_wind
Geostrophic Wind;
http://en.wikipedia.org/wiki/Geostrophic_wind
Surface Currents;
http://www.windows2universe.org/earth/Water/ocean_currents.html h
http://en.wikipedia.org/wiki/Ocean_current
through Ekman Transport;
http://en.wikipedia.org/wiki/Ekman_transport
http://oceanmotion.org/html/background/ocean-in-motion.htm
Tropical Cyclones;
http://en.wikipedia.org/wiki/Tropical_cyclone
Tornadoes:
http://en.wikipedia.org/wiki/Tornado
and Polar Vortices;
http://en.wikipedia.org/wiki/Polar_vortex
which “are caused when an area of low pressure sits at the rotation pole of a planet. This causes air to spiral down from higher in the atmosphere, like water going down a drain.”
http://www.universetoday.com/973/what-venus-and-saturn-have-in-common/
Here’s an animation of the Arctic Polar Vortex in Winter 2008 – 09:
When a Polar Vortex breaks down it causes a Sudden Stratospheric Warming:
http://en.wikipedia.org/wiki/Sudden_stratospheric_warming
Earth’s Rotational Energy influences Plate Tectonics;
http://en.wikipedia.org/wiki/Plate_tectonics
“By analyzing the minute changes in travel times and wave shapes for each doublet, the researchers concluded that the Earth’s inner core is rotating faster than its surface by about 0.3-0.5 degrees per year.
That may not seem like much, but it’s very fast compared to the movement of the Earth’s crust, which generally slips around only a few centimeters per year compared to the mantle below, said Xiaodong Song, a geologist at the University of Illinois at Urbana-Champaign and an author on the study.
http://www.livescience.com/9313-earth-core-rotates-faster-surface-study-confirms.html
The surface movement is called plate tectonics. It involves the shifting of about a dozen major plates and is what causes most earthquakes”:
http://en.wikipedia.org/wiki/Earthquake
Volcanoes;
http://en.wikipedia.org/wiki/Volcano
and Mountain Formation;
http://en.wikipedia.org/wiki/Mountain_formation
which can influence the creation of Atmospheric Waves:
http://en.wikipedia.org/wiki/Atmospheric_wave
Lastly, Rotational Energy is the primary driver of Earth’s Dynamo;
http://en.wikipedia.org/wiki/Dynamo_theory
which generates Earth’s Magnetic Field;
http://en.wikipedia.org/wiki/Earth%27s_magnetic_field
and is primarily responsible for the Earthy behaviors of the Magnetosphere;
http://en.wikipedia.org/wiki/Magnetosphere
with certain secular variations in Earth’s magnetic field originating from ocean flow/circulation;
http://news.nationalgeographic.com/news/2009/06/090622-earths-core-dynamo.html
http://iopscience.iop.org/1367-2630/11/6/063015/fulltext
though Leif Svalgaard notes that these are minor variations, as the magnetic field originating from ocean flow/circulation “is 1000 times smaller than the main field generated in the core.”
Also of note, “Over millions of years, [Earth’s] rotation is significantly slowed by gravitational interactions with the Moon: see tidal acceleration.
http://en.wikipedia.org/wiki/Tidal_acceleration
“The presence of the moon (which has about 1/81 the mass of the Earth), is slowing Earth’s rotation and lengthening the day by about 2 ms every one hundred years.”
“However some large scale events, such as the 2004 Indian Ocean earthquake, have caused the rotation to speed up by around 3 microseconds.[21] Post-glacial rebound, ongoing since the last Ice age, is changing the distribution of the Earth’s mass thus affecting the Moment of Inertia of the Earth and, by the Conservation of Angular Momentum, the Earth’s rotation period.”
http://en.wikipedia.org/wiki/Earth%27s_rotation
2. Orbital Energy, Orbital Period, Elliptical Orbits (Eccentricity), Tilt (Obliquity) and Wobble (Axial precession):
http://en.wikipedia.org/wiki/Specific_orbital_energy
http://en.wikipedia.org/wiki/Synodic
http://www.physicalgeography.net/fundamentals/6h.html
creates Earth’s seasons;
http://en.wikipedia.org/wiki/Season
which drives annual changes in Arctic Sea Ice;
and Antarctic Sea Ice;
the freezing and melting of which helps to drive the Thermohaline Circulation;
http://en.wikipedia.org/wiki/Thermohaline_circulation
and can result in the formation of Polynyas:
http://en.wikipedia.org/wiki/Polynya
Earth’s orbit around the Sun, Earth’s tilt, Earth’s wobble and the Moon’s orbit around Earth, Earth’s Rotation, and the gravity of the Moon, Sun and Earth, act in concert to determine the constantly evolving Tidal Force on Earth:
http://en.wikipedia.org/wiki/Tidal_force
This Tidal Force is influenced by variations in Lunar Orbit;
http://en.wikipedia.org/wiki/Orbit_of_the_Moon
as seen in the Lunar Phases;
http://en.wikipedia.org/wiki/Lunar_phase
Lunar Precession;
http://en.wikipedia.org/wiki/Lunar_precession
Lunar Node;
http://en.wikipedia.org/wiki/Lunar_node
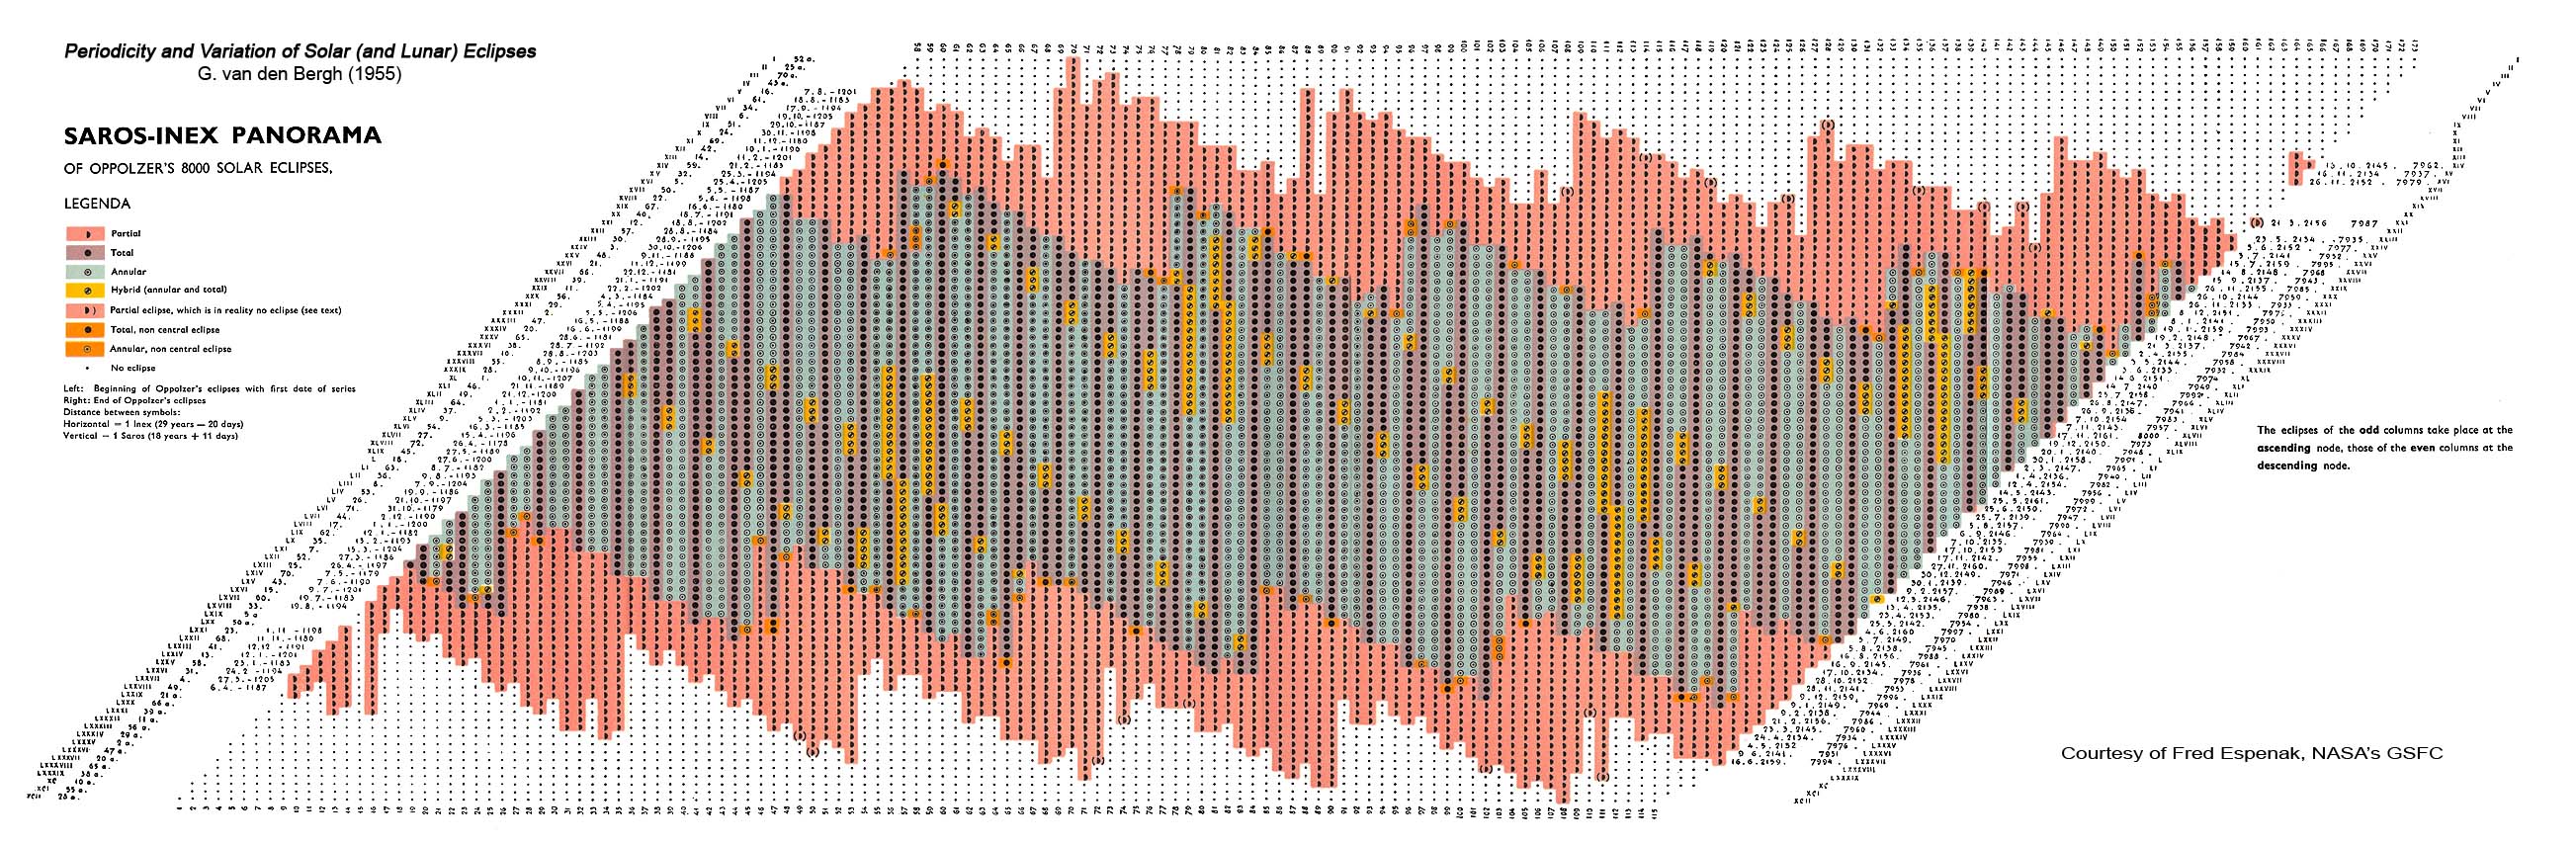
Saros cycles;
http://en.wikipedia.org/wiki/Saros_cycle
and Inex cycles:
http://en.wikipedia.org/wiki/Inex
The combined cycles of the Saros and Inex Cycles can be visualized here:
http://eclipse.gsfc.nasa.gov/SEsaros/image/SEpanoramaGvdB-big.JPG
Over longer time frames changes to Earth’s orbit, tilt and wobble called Milankovitch cycles;
http://en.wikipedia.org/wiki/Milankovitch_cycles
may be responsible for the periods of Glaciation (Ice Ages);
http://www.homepage.montana.edu/~geol445/hyperglac/time1/milankov.htm
that Earth has experienced for the last several million years of its climatic record:
http://en.wikipedia.org/wiki/Ice_age
Also of note, over very long time frames, “the Moon is spiraling away from Earth at an average rate of 3.8 cm per year”;
http://en.wikipedia.org/wiki/Lunar_distance_%28astronomy%29
http://curious.astro.cornell.edu/question.php?number=124
3. Gravitation:
http://en.wikipedia.org/wiki/Gravitation
The gravity of the Moon, Sun and Earth, Earth’s rotation, Earth’s orbit around the Sun, Earth’s tilt, Earth’s wobble and the Moon’s orbit around Earth act in concert to determine the constantly evolving Tidal Force on Earth:
http://en.wikipedia.org/wiki/Tidal_force
This tidal force results in that result in Earth’s Ocean Tide;
http://en.wikipedia.org/wiki/Tide
http://www.themcdonalds.net/richard/astro/papers/602-tides-web.pdf
Atmospheric Tide;
http://en.wikipedia.org/wiki/Atmospheric_tide
and Magma Tide:
http://www.springerlink.com/content/h7005r0273703250/
Earth’s Gravity;
http://en.wikipedia.org/wiki/Convection#Gravitational_or_buoyant_convection
http://visibleearth.nasa.gov/view_rec.php?id=205
in concert with Tidal Forces, influence Earth’s Ocean Circulation;
http://www.eoearth.org/article/Ocean_circulation
which influences Oceanic Oscillations including El Niño/La Niña;
http://en.wikipedia.org/wiki/El_Ni%C3%B1o-Southern_Oscillation
the Pacific Decadal Oscillation (PDO);
http://en.wikipedia.org/wiki/Pacific_Decadal_Oscillation
the Atlantic Multi-Decadal Oscillation (AMO);
http://en.wikipedia.org/wiki/Atlantic_Multidecadal_Oscillation
the Indian_Ocean_Dipole (IOD)/Indian Ocean Oscillation (IOO) and;
http://en.wikipedia.org/wiki/Indian_Ocean_Dipole
can result in the formation of Polynyas:
http://en.wikipedia.org/wiki/Polynya
Gravity Waves;
http://en.wikipedia.org/wiki/Gravity_wave
which may be partially responsible for the Quasi-Biennial Oscillation (QBO);
http://en.wikipedia.org/wiki/Quasi-biennial_oscillation
“on an air–sea interface are called surface gravity waves or Surface Waves”;
http://en.wikipedia.org/wiki/Surface_wave
“while internal gravity waves are called Inertial Waves”:
http://en.wikipedia.org/wiki/Inertial_waves
“Rosby Waves;
http://en.wikipedia.org/wiki/Rossby_waves
Geostrophic Currents
http://en.wikipedia.org/wiki/Geostrophic
and Geostrophic Wind
http://en.wikipedia.org/wiki/Geostrophic_wind
are examples of inertial waves. Inertial waves are also likely to exist in the core of the Earth”
Earth’s gravity is the primary driver of Plate Tectonics;
http://en.wikipedia.org/wiki/Plate_tectonics
“The Slab Pull;
http://en.wikipedia.org/wiki/Slab_pull
force is a tectonic plate force due to subduction. Plate motion is partly driven by the weight of cold, dense plates sinking into the mantle at trenches. This force and the slab suction force account for most of the overall force acting on plate tectonics, and the Ridge Push;
force accounts for 5 to 10% of the overall force.”
Plate Tectonics drive “cycles of ocean basin growth and destruction, known as Wilson cycles;
http://csmres.jmu.edu/geollab/fichter/Wilson/Wilson.html
involving continental rifting;
http://en.wikipedia.org/wiki/Rift
seafloor-spreading;
http://en.wikipedia.org/wiki/Seafloor_spreading
subduction;
http://en.wikipedia.org/wiki/Subduction
and collision.”:
http://en.wikipedia.org/wiki/Continental_collision
“Climate change on ultra-long time scales (tens of millions of years) are more than likely connected to plate tectonics.”
“Through the course of a Wilson cycle continents collide and split apart, mountains are uplifted and eroded, and ocean basins open and close. The re-distribution and changing size and elevation of continental land masses may have caused climate change on long time scales”;
http://www.pbs.org/wgbh/nova/ice/chill.html
a process called the Supercontinent Cycle:
http://en.wikipedia.org/wiki/Supercontinent_cycle
Earth’s gravity is responsible for Katabatic Wind:
http://en.wikipedia.org/wiki/Katabatic_wind
4. Solar Energy;
http://en.wikipedia.org/wiki/Solar_energy
results is Solar Radiation/Sunlight;
http://en.wikipedia.org/wiki/Solar_radiation
which varies based upon 11 and 22 year cycles:
http://en.wikipedia.org/wiki/Solar_cycle
Total Solar Irradiance (TSI);
http://www.ngdc.noaa.gov/stp/solar/solarirrad.html
appears to fluctuate “by approximately 0.1% or about 1.3 Watts per square meter (W/m2) peak-to-trough during the 11-year sunspot cycle”:
http://en.wikipedia.org/wiki/Solar_variation
Solar Energy also drives the Hydrological/Water Cycle;
http://en.wikipedia.org/wiki/Hydrological_cycle
within the Hydrosphere;
http://en.wikipedia.org/wiki/Hydrosphere
as Total Solar Irradiance (TSI) causes evaporation;
http://en.wikipedia.org/wiki/Evaporation
that drives cloud formation;
http://en.wikipedia.org/wiki/Cloud
results in precipitation;
http://en.wikipedia.org/wiki/Precipitation_%28meteorology%29
that results in the Water Distribution on Earth;
http://en.wikipedia.org/wiki/Water_distribution_on_Earth
creates surface runoff;
http://en.wikipedia.org/wiki/Runoff_%28water%29
which result in rivers;
http://en.wikipedia.org/wiki/River
and drives erosion:
http://en.wikipedia.org/wiki/Erosion
Solar energy is also “The driving force behind atmospheric circulation is solar energy, which heats the atmosphere with different intensities at the equator, the middle latitudes, and the poles.”
http://www.scienceclarified.com/As-Bi/Atmospheric-Circulation.html
Atmospheric Circulation;
http://en.wikipedia.org/wiki/Atmospheric_circulation
includes Hadley Cells;
http://en.wikipedia.org/wiki/Hadley_cell
Ferrel Cells;
http://en.wikipedia.org/wiki/Atmospheric_circulation#Ferrel_cell
Polar Cells;
http://en.wikipedia.org/wiki/Polar_cells
and Polar Vortexes:
http://en.wikipedia.org/wiki/Polar_cells
all of which help to create Wind;
http://en.wikipedia.org/wiki/Wind
that influence Surface Currents;
http://www.windows2universe.org/earth/Water/ocean_currents.html
http://en.wikipedia.org/wiki/Ocean_current
through Ekman Transport;
http://en.wikipedia.org/wiki/Ekman_transport
http://oceanmotion.org/html/background/ocean-in-motion.htm
and also cause Langmuir circulations
http://en.wikipedia.org/wiki/Langmuir_circulation
Solar energy is also a driver of the Brewer-Dobson Circulation
http://en.wikipedia.org/wiki/Brewer-Dobson_circulation
Atmospheric Waves;
http://en.wikipedia.org/wiki/Atmospheric_wave
including Atmospheric Tides
http://en.wikipedia.org/wiki/Atmospheric_tide
as well as evaporation and condensation may help to drive changes in Atmospheric Pressure:
http://en.wikipedia.org/wiki/Atmospheric_pressure
http://www.atmos-chem-phys-discuss.net/10/24015/2010/acpd-10-24015-2010.pdf
Solar Ultraviolet (UV) radiation;
http://en.wikipedia.org/wiki/Ultraviolet
appears to vary by approximately 10% during the solar cycle;
http://www.nasa.gov/topics/solarsystem/features/solarcycle-sorce.html
has been hypothesized to influence Earth’s climate;
http://wattsupwiththat.com/2011/04/05/courtillot-on-the-solar-uv-climate-connection/
however Leif Svalgaard argues that,
This is well-trodden ground. Nothing new to add, just the same old, tired arguments. Perhaps a note on EUV: as you can see here (slide 13)
http://lasp.colorado.edu/sorce/news/2008ScienceMeeting/doc/Session1/S1_03_Kopp.pdf the energy in the EUV band [and other UV bands] is very tiny; many orders of magnitude less than what shines down on our heads each day. So a larger solar cycle variation of EUV does not make any significant difference in the energy budget.
http://wattsupwiththat.com/2011/04/05/courtillot-on-the-solar-uv-climate-connection/#comment-636477
Additionally variations in Ultraviolet (UV) radiation may influence the break down of Methane;
(Source TBD)
Infrared Radiation;
http://en.wikipedia.org/wiki/Infrared
Solar – Wind;
http://science.nasa.gov/science-news/science-at-nasa/1999/ast13dec99_1/
Solar – Coronal Holes;
http://helios.gsfc.nasa.gov/chole.html
Solar – Solar Energetic Particles (SEP);
http://helios.gsfc.nasa.gov/sep.html
Solar – Coronal Mass Ejection;
http://www.esa.int/esaSC/SEMF75BNJTF_index_0.html
http://www.ratedesi.com/video/v/8AuCE_NNEaM/Sun-Erupts-to-Life-Unleashes-a-Huge-CME-on-13-April-2010
Solar Magnetosphere Breach;
Solar Polar Field Reversal;
http://science.nasa.gov/science-news/science-at-nasa/2001/ast15feb_1/
Solar Sector Boundary;
http://science.nasa.gov/heliophysics/focus-areas/magnetosphere-ionosphere/
Grand Minimum;
Leif Svalgaard says: February 6, 2011 at 8:26 pm
If L&P are correct and sunspots become effectively] invisible [not gone] it might mean another Grand Minimum lasting perhaps 50 years. During this time the solar cycle is still operating, cosmic rays are still modulated, and the solar wind is still buffeting the Earth.”
“It will lead to a cooling of a couple of tenths of a degree.”
Solar Influences on Climate:
http://www.leif.org/EOS/2009RG000282.pdf
Statistical issues about solar–climate relations
http://www.leif.org/EOS/Yiou-565-2010.pdf
5. Geothermal Energy;
http://en.wikipedia.org/wiki/Geothermal_energy
influences Earth’s climate especially when released by Volcanoes;
http://en.wikipedia.org/wiki/Volcano
“which are generally found where tectonic plates are diverging;
http://en.wikipedia.org/wiki/Divergent_boundary
or converging”;
http://en.wikipedia.org/wiki/Convergent_boundary
however, “intraplate volcanism has also been postulated to be caused by mantle plumes”:
http://en.wikipedia.org/wiki/Mantle_plume
“These so-called “hotspots”;
http://en.wikipedia.org/wiki/Hotspot_%28geology%29
for example Hawaii, are postulated to arise from upwelling diapirs;
http://en.wikipedia.org/wiki/Diapir
from the core-mantle boundary, 3,000 km deep in the Earth.”
Volcanoes have been shown to influence Earth’s climate;
http://www.geology.sdsu.edu/how_volcanoes_work/climate_effects.html
http://www.longrangeweather.com/global_temperatures.htm
including in the infamous Year Without a Summer;
http://en.wikipedia.org/wiki/Year_Without_a_Summer
which was partially caused by the 1815 eruption of Mount Tambora;
http://en.wikipedia.org/wiki/1815_eruption_of_Mount_Tambora
and is called a Volcanic Winter:
http://en.wikipedia.org/wiki/Volcanic_winter
“Volcanic Ash;
http://en.wikipedia.org/wiki/Volcanic_ash
particles have a maximum residence time in the troposphere of a few weeks.
The finest Tephera;
http://en.wikipedia.org/wiki/Tephra
remain in the stratosphere for only a few months, they have only minor climatic effects, and they can be spread around the world by high-altitude winds. This suspended material contributes to spectacular sunsets.
“The greatest volcanic impact upon the earth’s short term weather patterns is caused by sulfur dioxide gas;”
http://en.wikipedia.org/wiki/Sulfur_dioxide
“In the cold lower atmosphere, it is converted to Sulfuric Acid;
http://en.wikipedia.org/wiki/Sulfuric_acid
sulfuric acid by the sun’s rays reacting with stratospheric water vapor to form sulfuric acid aerosol layers. The aerosol remains in suspension long after solid ash particles have fallen to earth and forms a layer of sulfuric acid droplets between 15 to 25 kilometers up. Fine ash particles from an eruption column fall out too quickly to significantly cool the atmosphere over an extended period of time, no matter how large the eruption.
Sulfur aerosols last many years, and several historic eruptions show a good correlation of sulfur dioxide layers in the atmosphere with a decrease in average temperature decrease of subsequent years. The close correlation was first established after the 1963 eruption of Agung volcano in Indonesia when it was found that sulfur dioxide reached the stratosphere and stayed as a sulfuric acid aerosol.
Without replenishment, the sulfuric acid aerosol layer around the earth is gradually depleted, but it is renewed by each eruption rich in sulfur dioxide. This was confirmed by data collected after the eruptions of El Chichon, Mexico (1982) and Pinatubo, Philippines (1991), both of which were high-sulfur compound carriers like Agung, Indonesia.”
http://volcanology.geol.ucsb.edu/gas.htm
There is also some evidence that if “volcanic activity was high enough, then a water vapor anomaly would be introduced into the lower stratosphere before the anomaly due to the previous eruption had disappeared. The result would be threefold in the long term: stratospheric cooling, stratospheric humidification, and surface warming due to the positive radiative forcing associated with the water vapor.”
See: http://journals.ametsoc.org/doi/pdf/10.1175/1520-0442(2003)016%3C3525%3AAGSOVE%3E2.0.CO%3B2#h1
Geothermic Energy can also warm the atmosphere through Hot Springs;
http://en.wikipedia.org/wiki/Hot_springs
Or warm the ocean through Hydrothermal Vents:
http://en.wikipedia.org/wiki/Hydrothermal_vent
Which can be a factor in Hydrothermal Circulations:
http://en.wikipedia.org/wiki/Hydrothermal_circulation
6. Outer Space/Cosmic/Galactic Influences;
http://en.wikipedia.org/wiki/Outer_space
http://en.wikipedia.org/wiki/Cosmos
http://en.wikipedia.org/wiki/Galaxy
including Asteroids;
http://en.wikipedia.org/wiki/Asteroid
Meteorites;
http://en.wikipedia.org/wiki/Meteorite
and Comets;
http://en.wikipedia.org/wiki/Comet
can all significantly impact Earth’s climate upon impact.
It has been hypothesized that Galactic Cosmic Rays;
http://en.wikipedia.org/wiki/Galactic_cosmic_ray
http://en.wikipedia.org/wiki/Cosmic_ray
modulated by Solar Wind, may influence cloud formation on Earth:
Galactic Magnetic Fields also result in the;
http://www.scholarpedia.org/article/Galactic_magnetic_fields
Galactic Tide;
http://en.wikipedia.org/wiki/Galactic_tide
which may influence the hypothesized Oort cloud;
http://en.wikipedia.org/wiki/Oort_Cloud
“Besides the galactic tide, the main trigger for sending comets into the inner Solar System is believed to be interaction between the Sun’s Oort cloud and the gravitational fields of near-by stars or giant molecular clouds.”
7. Magnetic Forces;
http://en.wikipedia.org/wiki/Earth%27s_magnetic_field
Earth Core Changes:
http://physicsworld.com/cws/article/news/42580
“appears to be generated in the Earth’s core by a dynamo process, associated with the circulation of liquid metal in the core, driven by internal heat sources”
impact the Magnetosphere;
http://en.wikipedia.org/wiki/Magnetosphere
including movement of the Geomagnetic Poles:
http://www.ngdc.noaa.gov/geomag/GeomagneticPoles.shtml
http://news.nationalgeographic.com/news/2009/12/091224-north-pole-magnetic-russia-earth-core.html
8. Atmospheric Composition
http://en.wikipedia.org/wiki/Atmosphere_of_Earth
Nitrogen (N2) represents approximately 780,840 ppmv or 78.084% of Earth’s Atmosphere;
http://en.wikipedia.org/wiki/Nitrogen
Oxygen (O2) represents approximately 209,460 ppmv or 20.946%;
http://en.wikipedia.org/wiki/Oxygen
Argon (Ar) represents approximately 9,340 ppmv or 0.9340%;
http://en.wikipedia.org/wiki/Argon
Carbon Dioxide (CO2) represents approximately 390 ppmv or 0.039%;
http://en.wikipedia.org/wiki/Carbon_dioxide
contributes to the Greenhouse Effect;
?
and
influences the rate of Plant Growth;
http://www.sjsu.edu/faculty/watkins/CO2plants.htm
Neon (Ne) represents approximately18.18 ppmv or 0.001818%;
http://en.wikipedia.org/wiki/Neon
Helium (He) represents approximately 5.24 ppmv (0.000524%);
http://en.wikipedia.org/wiki/Helium
Krypton (Kr) represents approximately 1.14 ppmv (0.000114%);
http://en.wikipedia.org/wiki/Krypton
Methane (CH4) represents approximately 1.79 ppmv (0.000179%);
http://en.wikipedia.org/wiki/Methane
contributes to the Greenhouse Effect;
?
Hydrogen (H2) represents approximately 0.55 ppmv (0.000055%);
http://en.wikipedia.org/wiki/Hydrogen
Nitrous Oxide (N2O) represents approximately 0.3 ppmv (0.00003%);
http://en.wikipedia.org/wiki/Nitrous_oxide
contributes to the Greenhouse Effect;
?
Ozone (O3) represents approximately 0.0 to 0.07 ppmv (0 to 7×10⁻⁶%);
http://en.wikipedia.org/wiki/Ozone
Nitrogen Dioxide (NO2) represents approximately 0.02 ppmv (2×10⁻⁶%) (0.000002%);
http://en.wikipedia.org/wiki/Nitrogen_dioxide
Iodine (I2) represents approximately 0.01 ppmv (1×10⁻⁶%) (0.000001%) and;
http://en.wikipedia.org/wiki/Iodine
Ammonia (NH3) represents a trace amount of Earth’s Atmosphere:
http://en.wikipedia.org/wiki/Ammonia
Additional atmosphere components includes Water vapor (H2O) that represents approximately 0.40% over full atmosphere, typically 1%-4% at surface.
http://en.wikipedia.org/wiki/Water_vapor;
Aerosols;
http://en.wikipedia.org/wiki/Aerosol
that “act as cloud condensation nuclei, they alter albedo (both directly and indirectly via clouds) and hence Earth’s radiation budget, and they serve as catalysts of or sites for atmospheric chemistry reactions.”
“Aerosols play a critical role in the formation of clouds;
http://en.wikipedia.org/wiki/Clouds
Clouds form as parcels of air cool and the water vapor in them condenses, forming small liquid droplets of water. However, under normal circumstances, these droplets form only where there is some “disturbance” in the otherwise “pure” air. In general, aerosol particles provide this “disturbance”. The particles around which cloud droplets coalesce are called cloud condensation nuclei (CCN) or sometimes “cloud seeds”. Amazingly, in the absence of CCN, air containing water vapor needs to be “supersaturated” to a humidity of about 400% before droplets spontaneously form! So, in almost all circumstances, aerosols play a vital role in the formation of clouds.”
http://www.windows2universe.org/earth/Atmosphere/aerosol_cloud_nucleation_dimming.html
Particulates;
http://en.wikipedia.org/wiki/Particulates
including Soot/Black Carbon;
http://en.wikipedia.org/wiki/Soot
http://en.wikipedia.org/wiki/Black_carbon
Sand;
http://en.wikipedia.org/wiki/Sand
Dust
http://en.wikipedia.org/wiki/Dust
“Volcanic Ash;
http://en.wikipedia.org/wiki/Volcanic_ash
particles have a maximum residence time in the troposphere of a few weeks.
The finest Tephera;
http://en.wikipedia.org/wiki/Tephra
remain in the stratosphere for only a few months, they have only minor climatic effects, and they can be spread around the world by high-altitude winds. This suspended material contributes to spectacular sunsets.
The major climate influence from volcanic eruptions is caused by gaseous sulfur compounds, chiefly Sulfur Dioxide;
http://en.wikipedia.org/wiki/Sulfur_dioxide
which reacts with OH and water in the stratosphere to create sulfate aerosols with a residence time of about 2–3 years.”
“Emission rates of [Sulfur Dioxide] SO2 from an active volcano range from 10 million tonnes/day according to the style of volcanic activity and type and volume of magma involved. For example, the large explosive eruption of Mount Pinatubo on 15 June 1991 expelled 3-5 km3 of dacite magma and injected about 20 million metric tons of SO2 into the stratosphere. The sulfur aerosols resulted in a 0.5-0.6°C cooling of the Earth’s surface in the Northern Hemisphere.”
http://volcanoes.usgs.gov/hazards/gas/index.php
“The 1815 eruption [of Mount Tambora] is rated 7 on the Volcanic Explosivity Index, the only such eruption since the Lake Taupo eruption in about 180 AD. With an estimated ejecta volume of 160 cubic kilometers, Tambora’s 1815 outburst was the largest volcanic eruption in recorded history.”
“The eruption created global climate anomalies that included the phenomenon known as “volcanic winter”;
http://en.wikipedia.org/wiki/Volcanic_winter
1816 became known as the “Year Without a Summer”;
http://en.wikipedia.org/wiki/Year_Without_a_Summer
because of the effect on North American and European weather. Agricultural crops failed and livestock died in much of the Northern Hemisphere, resulting in the worst famine of the 19th century.”
http://en.wikipedia.org/wiki/Mount_Tambora
“In the spring and summer of 1816, a persistent “dry fog” was observed in the northeastern US. The fog reddened and dimmed the sunlight, such that sunspots were visible to the naked eye. Neither wind nor rainfall dispersed the “fog”. It has been characterized as a stratospheric sulfate aerosol veil.”
“The greatest volcanic impact upon the earth’s short term weather patterns is caused by sulfur dioxide gas;”
http://en.wikipedia.org/wiki/Sulfur_dioxide
“In the cold lower atmosphere, it is converted to Sulfuric Acid;
http://en.wikipedia.org/wiki/Sulfuric_acid
sulfuric acid by the sun’s rays reacting with stratospheric water vapor to form sulfuric acid aerosol layers. The aerosol remains in suspension long after solid ash particles have fallen to earth and forms a layer of sulfuric acid droplets between 15 to 25 kilometers up. Fine ash particles from an eruption column fall out too quickly to significantly cool the atmosphere over an extended period of time, no matter how large the eruption.
Sulfur aerosols last many years, and several historic eruptions show a good correlation of sulfur dioxide layers in the atmosphere with a decrease in average temperature decrease of subsequent years. The close correlation was first established after the 1963 eruption of Agung volcano in Indonesia when it was found that sulfur dioxide reached the stratosphere and stayed as a sulfuric acid aerosol.
Without replenishment, the sulfuric acid aerosol layer around the earth is gradually depleted, but it is renewed by each eruption rich in sulfur dioxide. This was confirmed by data collected after the eruptions of El Chichon, Mexico (1982) and Pinatubo, Philippines (1991), both of which were high-sulfur compound carriers like Agung, Indonesia.”
http://volcanology.geol.ucsb.edu/gas.htm
There is also some evidence that if “volcanic activity was high enough, then a water vapor anomaly would be introduced into the lower stratosphere before the anomaly due to the previous eruption had disappeared. The result would be threefold in the long term: stratospheric cooling, stratospheric humidification, and surface warming due to the positive radiative forcing associated with the water vapor.”
See: http://journals.ametsoc.org/doi/pdf/10.1175/1520-0442(2003)016%3C3525%3AAGSOVE%3E2.0.CO%3B2#h1
9. Albedo
http://en.wikipedia.org/wiki/Albedo
“or reflection coefficient, is the diffuse reflectivity or reflecting power of a surface. It is defined as the ratio of reflected radiation from the surface to incident radiation upon it. Being a dimensionless fraction, it may also be expressed as a percentage, and is measured on a scale from zero for no reflecting power of a perfectly black surface, to 1 for perfect reflection of a white surface.”
Clouds
http://en.wikipedia.org/wiki/Clouds
Aerosols
http://en.wikipedia.org/wiki/Aerosol
“act as cloud condensation nuclei, they alter albedo (both directly and indirectly via clouds) and hence Earth’s radiation budget, and they serve as catalysts of or sites for atmospheric chemistry reactions.”
“Aerosols play a critical role in the formation of clouds. Clouds form as parcels of air cool and the water vapor in them condenses, forming small liquid droplets of water. However, under normal circumstances, these droplets form only where there is some “disturbance” in the otherwise “pure” air. In general, aerosol particles provide this “disturbance”. The particles around which cloud droplets coalesce are called cloud condensation nuclei (CCN) or sometimes “cloud seeds”. Amazingly, in the absence of CCN, air containing water vapor needs to be “supersaturated” to a humidity of about 400% before droplets spontaneously form! So, in almost all circumstances, aerosols play a vital role in the formation of clouds.”
http://www.windows2universe.org/earth/Atmosphere/aerosol_cloud_nucleation_dimming.html
Snow
Ice
Water
Particulates
http://en.wikipedia.org/wiki/Particulates
Soot/Black Carbon
http://en.wikipedia.org/wiki/Soot
http://en.wikipedia.org/wiki/Black_carbon
Algae (Ocean Surface)
10. Biology
http://en.wikipedia.org/wiki/Biology
“Phototrophs
http://en.wikipedia.org/wiki/Photoautotroph
are the organisms (usually plants) that carry out photosynthesis;
http://en.wikipedia.org/wiki/Photosynthesis
to acquire energy. They use the energy from sunlight to convert carbon dioxide and water into organic materials to be utilized in cellular functions such as biosynthesis and respiration.” “In plants, algae, and cyanobacteria, photosynthesis uses carbon dioxide and water, releasing oxygen as a waste product.”
Chemoautotrophs;
http://en.wikipedia.org/wiki/Chemotroph
are “organisms that obtain carbon through Chemosynthesis;
http://en.wikipedia.org/wiki/Chemosynthesis
are phylogenetically diverse, but groups that include conspicuous or biogeochemically-important taxa include the sulfur-oxidizing gamma and epsilon proteobacteria, the Aquificaeles, the Methanogenic archaea and the neutrophilic iron-oxidizing bacteria.”
Bacteria – TBD
Fungi – TBD
Protozoa – TBD
Chromista – TBD
Animal – Anthropogenic including:
Carbon Dioxide;
http://en.wikipedia.org/wiki/Carbon_dioxide
contributes to the Greenhouse Effect;
?
and
influences the rate of plant growth ;
http://www.sjsu.edu/faculty/watkins/CO2plants.htm
Methane
http://en.wikipedia.org/wiki/Methane
Nitrous Oxide
Ozone
Particulates, especially Black Carbon/Soot
Aerosols
Icebreakers/Arctic Shipping/Fishing/Cruise-Line Transits
Contrails
Nuclear Power Generation – Including Ships
Land Use Changes – Including De and Re-Forestation
Urban Heat Islands
Run Off From Asphalt/Urban Heat Islands
Fossil Fuel Energy Generation Waste Heat –
Renewables – Wind Farms, Solar Arrays, Dams and Ethanol
Sewage/Wastewater Treatment Discharge
etc.
Animal – Non-Anthropogenic including
Plankton
Beaver (Genus Castor)
http://en.wikipedia.org/wiki/Beaver
etc.
11. Chemical
Fossil Fuels:
Coal
Oil shale
Petrochemicals
– Petroleum
– Mineral Oil
Asphalt
Tar Pits/Sands
Methane
http://en.wikipedia.org/wiki/Methane
etc.
“Photosynthesis;
http://en.wikipedia.org/wiki/Photosynthesis
is a chemical process that converts carbon dioxide into organic compounds, especially sugars, using the energy from sunlight.”
“Chemosynthesis;
http://en.wikipedia.org/wiki/Chemosynthesis
is the biological conversion of one or more carbon molecules (usually carbon dioxide or methane) and nutrients into organic matter using the oxidation of inorganic molecules (e.g. hydrogen gas, hydrogen sulfide) or methane as a source of energy, rather than sunlight, as in photosynthesis.”
Reactions:
Combustion
– Forest Fires
– Fossil Fuels
– – Methane
http://en.wikipedia.org/wiki/Methane
etc.
Conversion of Methane, CO2, etc.
12. Physics – Other
Temperature
http://en.wikipedia.org/wiki/Temperature
Pressure
http://en.wikipedia.org/wiki/Pressure
States of Matter
http://en.wikipedia.org/wiki/State_of_matter
Heat Conduction
http://en.wikipedia.org/wiki/Heat_conduction
Convection
http://en.wikipedia.org/wiki/Convection
Thermal Radiation
http://en.wikipedia.org/wiki/Thermal_radiation
Thermodynamics
http://en.wikipedia.org/wiki/Laws_of_thermodynamics
-Entropy
http://en.wikipedia.org/wiki/Entropy
General summaries of the potential variables involved in Earth’s climate system;
http://www.physicalgeography.net/fundamentals/7y.html
http://oceanservice.noaa.gov/education/pd/climate/factsheets/whatfactors.pdf
gnomish says: June 30, 2011 at 4:23 pm
the white cliffs of dover
“The White Cliffs of Dover are cliffs which form part of the British coastline facing the Strait of Dover and France. The cliffs are part of the North Downs formation. The cliff face, which reaches up to 107 metres (351 ft),[1] owes its striking façade to its composition of chalk (pure white calcium carbonate) accentuated by streaks of black flint.”
http://en.wikipedia.org/wiki/White_Cliffs_of_Dover
Given the small geographic coverage and orientation to the sun, White Cliffs of Dover would seem to have an extremely small, if any, influence on Earth’s Climate System.
Carrera Marble;
“Marble is a rock resulting from metamorphism of sedimentary carbonate rocks, most commonly limestone or dolomite rock. Metamorphism causes variable recrystallization of the original carbonate mineral grains.
The resulting marble rock is typically composed of an interlocking mosaic of carbonate crystals. Primary sedimentary textures and structures of the original carbonate rock (protolith) have typically been modified or destroyed.
Pure white marble is the result of metamorphism of a very pure (silicate-poor) limestone or dolomite protolith. The characteristic swirls and veins of many colored marble varieties are usually due to various mineral impurities such as clay, silt, sand, iron oxides, or chert which were originally present as grains or layers in the limestone.”
Carrara Marble is “white or blue-gray”
http://en.wikipedia.org/wiki/Marble
Can you please elaborate on what you mean here?
Coal … methane
“Coal is a combustible black or brownish-black sedimentary rock normally occurring in rock strata in layers or veins called coal beds or coal seams. The harder forms, such as anthracite coal, can be regarded as metamorphic rock because of later exposure to elevated temperature and pressure. Coal is composed primarily of carbon along with variable quantities of other elements, chiefly hydrogen, with smaller quantities of sulfur, oxygen and nitrogen.”
http://en.wikipedia.org/wiki/Coal
“Methane is a chemical compound with the chemical formula CH4. It is the simplest alkane, and the principal component of natural gas. Methane’s bond angles are 109.5 degrees (cos−1(−1/3)). Burning methane in the presence of oxygen produces carbon dioxide and water. The relative abundance of methane makes it an attractive fuel. However, because it is a gas at normal temperature and pressure, methane is difficult to transport from its source. It is generally transported in bulk by pipeline in its natural gas form, or LNG carriers in its liquefied form; few countries transport it by truck.”
http://en.wikipedia.org/wiki/Methane
Fossil Fuels, good one! And this suggestion, along with your next one have precipitated the creation of a new category i.e. “11. Chemical” including Fossil Fuels:
Coal
Oil shale
Petrochemicals
– Petroleum
– Mineral Oil
Asphalt
Tar Pits/Sands
Methane
forest fires (it’s live stuff that burns)
This is another good one, i.e. Combustion. Added under new category 11. Chemical – Reactions.
ocean surface albedo from algae
Added under 9. Albedo
Thank you for your very valuable input.
I am surprised justthefactswuwt doesn’t know how to convert TSI to global-average solar input. First you take a quarter of 1350 which is about 340 W/m2 which is the average value at the top of the atmosphere (see Kiehl and Trenberth energy diagram). Then you multiply by 0.7 which takes into account albedo to get the amount absorbed by the earth system, which leaves 240 W/m2. So the 0.1% variation of that is about 0.24 W/m2 as Tobis and izen say. This is the number to compare with 4 W/m2 forcing from doubling CO2.
Sorry about the misteak re CO2. Got my charts mixed up.☹ Izen and I have had our disagreements, but he can’t be wrong all the time. ☺
@-justthefactswuwt says:
July 2, 2011 at 7:11 am
“What is unidirectional climate change? Do you think that some portion of the increase in temperature between 1975 and 2005 might have been related to the PDO Warm Regime?”
Unidirectional climate change is driven by an energy imbalance. If the surface is consistently receiving less radiation than it is loosing to space then it cools until there is a close but dynamic balance between energy in and out.
The PDO phase may have been correlated with an increase in temperature between 1975 and 2005. But the 1LoT means it is restricted to energy storage, it can only affect the timing of any re-balancing of the energy budget.
Are you certain about the direction of causal relationship between a reified concept like the PDO and observational data?
“How did you arrive at an “average surface change” of “around 0.3W/m2 or 0.1% of the surface average total”? ”
Geometry.
The ‘top of atmosphere’ values are 1366 W/m2. with a 0.1% varience -~ 1.3W/m2
But the Earth surface is not a square metre, its a revolving sphere.
surface area of a disc = PIr2
Surface area of a sphere = 4PIr2
You are right that there is much in the literature that refers to the top of atmosphere figure, but it is most often qualified with the need to put it in context of the ACTUAL surface over which it falls.
It is fashionable to say the Earth’s climate system is “chaotic”, meaning that chaos theory applies. This is fashionable but untrue: chaos theory says that small perturbations in a complex system MAY have unforseen consequences. It does not say that there WILL be unforseen consequences.
As I detailed in a previous comment, geological history shows continuity with episodic shifts. Geologically this is called “punctuated equilibrium”. In a system that is truly ruled by chaos, the outcome, i.e. weather and climate, bounce around. Stability is only attained after a period of back-and-forths, until the controlling factor becomes well established. The Earth shows long periods in which the climate is cold or hot, CO2 rising after the warmth starts and going down after the cold starts. Regulatory systems are progressive, incremental and stable.
Schroninger’s cat may be confused about what might happen, and electrons may spin around the nucleus in a probabalistic way, but a herd of cats will surely swallow the inattentive bird and the baseball will land in the stands if hit in the right way. At a large scale the climate – like the cloud with its fractal topology – tends to observe the Laws of Momentum.
There are thresholds or tipping points in systems, obviously. Keystone species, once gone, like the buffalo or the Native Americans, show up as having has a huge impact on the biological systems around them. But biological systems feed by their nature on each other, and are therefore a bad analogy (though loved by the bio-philic, non-hard science warmist). The components of the atmosphere interact but don’t feed on each other. If, for example, CO2 were a keystone atmospheric element, a sudden kick into the atmosphere of huge amounts of it during the explosions Krakatoa or Tambora would have a long, solid and sustained effect on the planet. They do not have that impact. There is a sudden effect (cooling, actually) and then the previous style and detail of stability returns.
The world is indeed complex, as described. But most of them are like the passengers running around inside a train heading across the country. Regardless of the eating, drinking and fooling around in nefarious ways, the train is going to end up where it was originally headed for.
@- Doug Proctor says:
July 2, 2011 at 1:43 pm
“If, for example, CO2 were a keystone atmospheric element, a sudden kick into the atmosphere of huge amounts of it during the explosions Krakatoa or Tambora would have a long, solid and sustained effect on the planet. They do not have that impact. There is a sudden effect (cooling, actually) and then the previous style and detail of stability returns.”
The explosions Krakatoa or Tambora would have a long, solid and sustained effect on the planet IF they released significant amounts of CO2. The transient cooling effect is from the sulfur content of the erupted material. It alters albedo but has a short residence time.
Around 30 Gigatons of CO2 were released by buring fossil fuel in 2010.
The eruption of Tambora ejected an estimated 2 Gigatons of material in total. Krakatoa and Tambora were much smaller additions to the atmospheric CO2 than human activity.
You need something more like a Yellowstone super-volcano to erupt to exceed the annual contribution from anthropogenic sources.
“Michael Tobis finds a presumption of innocence to be a “peculiar” notion. No wonder he trusts the conclusions of an irresponsible and corrupt UN organization.”
The more I think about that one the more peculiar it gets. To make it explicit for those who don’t see the irony, why not presume IPCC innocent, along with the Royal Academy, the NAS, the AAAS, the AGU, the EGU, etc. etc.?
Someone mentioned that the ‘greenhouse effect’ should be covered.
“Solar” in the energy budget as the means of converting to heat the land and oceans of Earth refer to Visible and the two shortwaves either side, UV and Nr Ir. None of these is thermal, they are Light, not Heat. Heat is the thermal infrared we feel from the Sun, which is what warms us and the land and the oceans. We cannot feel Light as heat, because it’s not hot…
“Light”, “Solar”, “irradiance” cannot physically heat organic matter to create the AGWScience energy budget scenario. For example, light, the visible spectrum, is transmitted through water, it is not absorbed, it has no effect in water, it cannot heat it, water is transparent to visible light. The energy budget you all seem to be working to is a creation of AGWScience, not real world traditional science. Therefore, all your ‘calculations’ if you are using these figures are absolute nonsense. The AGWScience energy budget EXCLUDES thermal infrared.
Light energies should be properly described. That these are reflected, scattered, by the oxygen and nitrogen molecules of our atmosphere, which gives us our blue sky, transmitted through water, i.e. pass through, used in photosynthesis etc., are not thermal.
The Water Cycle – the link to the wiki page mentions, but a garbled sentence, that without the water cycle the Earth would be 67°C. This is the main greenhouse gas of the real greenhouse – our gaseous atmosphere of oxygen and nitrogen. This is cooling the Earth, AGWScience has reversed that in its promotion of its meme that greenhouse gases ‘warm the earth’. Water vapour is lighter than air, it always therefore rises, water has a very high capacity to store heat, in the water cycle heat is taken up and away from the surface.
Carbon dioxide – the Carbon Cycle needs to be included properly. It is heavier than air, therefore will always sink displacing air unless some work done to move it upwards, such as wind (which is a volume of air on the move). When water and carbon dioxide meet, they merge, always. Carbon dioxide and water in the atmosphere meeting become carbonic acid. Rain is carbonic acid. Every time it rains the carbon dioxide in the atmosphere is removed.
Carbon dioxide cannot accumulate in the atmosphere firstly because it is heavier than air so will always displace air and come to the ground unless something is moving it up, and all rain is carbonic acid, the natural wash cycle of the atmosphere which takes out dust and brings both water and carbon dixodide back to the ground where it is food for plant life and therefore for us; we are carbon life forms, 20% carbon, the rest mainly water. Plants take in carbon dioxide from the underside of their leaves , through stromata, except for such as water lilies which have their stromata on the top of the leaf. Carbon dioxide ‘accumulating’ in the atmosphere out of reach of ground level is physical nonsense, promoted by AGWScience against real traditional science.
http://www.aces.edu/pubs/docs/A/ANR-1229/
“Acid rain, or acid precipitation, refers to any precipitation that is more acidic (i.e., has a lower pH value) than that of normal rainwater. Carbon dioxide (CO2) in the atmosphere makes all rain slightly acidic because carbon dioxide and water combine to form carbonic acid., commonly known as carbonated water.”
All rain.
Re measuring carbon dioxide in the atmosphere – total rainfall could be used to this end.
Michael Tobis says:
“…why not presume IPCC innocent, along with the Royal Academy, the NAS, the AAAS, the AGU, the EGU, etc. etc.?”
For one of two reasons: they’re either opaque like the UN/IPCC, or they do not allow their rank-and-file membership to challenge their official positions. There is a bunker mentality shared by all of them. There can be no presumption of innocence when these organizations have so much to hide. The correct presumption is that they have been hijacked by groups with a CAGW agenda.
Since there is zero evidence of CAGW, they appear to be corrupted by activists, who fear and detest scientific transparency. Particularly the IPCC, which is completely beyond redemption because they dance to the tune played by Greenpeace, the WWF, etc. Only the most hopelessly naive would give them any credence this late in the game.
Ah, water on the brain, thinking of rain. The always in water and carbon dioxide merging is temp related, so at temp where rain forms, etc.
Well, for those not intent on being altogether silly, let me point out that Nobel chemist Mario Molina quoted on Shell scientist David Hone’s blog, thinks the whole business is pretty much cut and dry.
see http://blogs.shell.com/climatechange/2011/07/molina/
There’s also the briefest possible summary of the physics at that link. Those who don’t follow that are encouraged to keep digging at it until they do. Then maybe they can sensibly look for the more realistic approximation using calculus and multiple wavelengths, and then look into what it implies for our present circumstances.
But if you want to look into something else, maybe inertia-gravity waves or plate tectonics, first, have fun, but it won’t actually bear on the controversy very directly. Why not start where it starts and work from there?
http://www.ngdc.noaa.gov/stp/solar/solarirrad.html <- One rather large problem there. The site is missing a number, the cross sectional area of Earth in square meters.
Can't have that, it would make things too easy for ordinary people with calculators to multiply the solar "constant" (which ain't) by the number of square meters in Earth's cross section, thereby coming up with the extremely large number of Watts with which to swat anyone who pooh-pooh's the solar variation's influence on the climate by saying "It only varies by 1.3 watts per square meter so that's nothing!". 1.3 watts of "nothing" times how many billion?
@- Galane says:
July 2, 2011 at 7:21 pm
http://www.ngdc.noaa.gov/stp/solar/solarirrad.html <- One rather large problem there. The site is missing a number, the cross sectional area of Earth in square meters.
Can't have that, it would make things too easy for ordinary people with calculators to multiply the solar "constant" (which ain't) by the number of square meters in Earth's cross section, thereby coming up with the extremely large number of Watts with which to swat anyone who pooh-pooh's the solar variation's influence on the climate by saying "It only varies by 1.3 watts per square meter so that's nothing!". 1.3 watts of "nothing" times how many billion?
——————-
Ordinary people might know, or with present day education internet search, that the radius of the Earth is ~6,370km and the area of a circle is PIr2.
So the cross sectional area of Earth in square meters. is about –
127.5 thousand Billion square meters which at 1.3W/m2 gives ~
a little under 167 Thousand Billion Watts.
Of course the increased downwelling energy from the rising CO2 is also around 1.3W/m2
But that operates over the total surface area of the sphere of the Earth, or Four times the cross sectional area.
663 Thousand Billion Watts.
( I have a nagging suspicion that I may have dropped/gained a factor of ten somewhere I'd be happy to see someone check these figures!)
Jim D says: July 2, 2011 at 8:47 am
I am surprised justthefactswuwt doesn’t know how to convert TSI to global-average solar input. First you take a quarter of 1350 which is about 340 W/m2 which is the average value at the top of the atmosphere (see Kiehl and Trenberth energy diagram). Then you multiply by 0.7 which takes into account albedo to get the amount absorbed by the earth system, which leaves 240 W/m2. So the 0.1% variation of that is about 0.24 W/m2 as Tobis and izen say. This is the number to compare with 4 W/m2 forcing from doubling CO2.
According to PhysicalGeography.net, “as energy from the Sun passes through the atmosphere a number of things take place (see Figure 7h-1). A portion of the energy (26% globally) is reflected or scattered back to space by clouds and other atmospheric particles. About 19% of the energy available is absorbed by clouds, gases (like ozone), and particles in the atmosphere. Of the remaining 55% of the solar energy passing through the Earth’s atmosphere, 4% is reflected from the surface back to space. On average, about 51% of the Sun’s radiation reaches the surface. This energy is then used in a number of processes, including the heating of the ground surface; the melting of ice and snow and the evaporation of water; and plant photosynthesis.”
http://www.physicalgeography.net/fundamentals/7h.html
Based on these estimates, on average about 51% of the 1.3 Watts per square meter (W/m2) would reach the surface, thus on average .663 Watts per square meter (W/m2) of the energy would reach the surface.
I thought we had a consensus here, why is Trenberth’s estimate so much lower than the PhysicalGeography.net estimate?
izen says: July 2, 2011 at 9:51 am
Unidirectional climate change is driven by an energy imbalance. If the surface is consistently receiving less radiation than it is loosing to space then it cools until there is a close but dynamic balance between energy in and out.
This seems like a fuzzy construct, i.e. the direction varies based upon the structure of the imbalance.
The PDO phase may have been correlated with an increase in temperature between 1975 and 2005. But the 1LoT means it is restricted to energy storage, it can only affect the timing of any re-balancing of the energy budget.
Agreed, but there is a tremendous amount of energy stored in the oceans, e.g. “El Niño’s energy reserve is vast, almost inconceivable. It contains more energy than has been procured from all the fossil fuels burned in the United States since the beginning of the century – that’s all the gasoline in all the cars, the coal in all the power plants, the natural gas in all the furnaces. It would take more than a million large power plants, at 1,000 megawatts each, running full tilt for a year, to heat the ocean that much. Or if you want to think in more violent terms, that’s all the energy produced by about half a million 20 megaton hydrogen bombs, gone into heating water.”
http://www.pbs.org/wgbh/nova/elnino/anatomy/origins.html
and said re-balancings have a major impact on Earth’s Climate and Temperature when they occur.
Are you certain about the direction of causal relationship between a reified concept like the PDO and observational data?
There seems to be reasonable support for it within the literature, e.g.;
“The signature of the PDO is clearly evident in the wintertime surface climate record for much of North America, but not for that of the other continents. The strongest coefficients of wintertime air temperature regressed upon the PDO index are located in northwestern North America ( Fig. 3a, cf. Latif and Barnett 1994 Fig. 5b), with local maxima of opposing centers over south central Alaska/western Canada and the southeastern United States. The PDO is positively correlated with wintertime precipitation along the coast of the central Gulf of Alaska and over northern Mexico and south Florida, and negatively correlated with that over much of the interior of North America and over the Hawaiian Islands.”
http://www.atmos.washington.edu/~mantua/REPORTS/PDO/pdo_paper.html
“As is the case with ENSO, characteristic pressure, wind, temperature, and precipitation patterns have been connected with the PDO (Latif and Barnett 1995, Zhang et al 1997, Mantua et al. 1997). ”
“The North American climate anomalies associated with PDO warm and cool extremes are broadly similar to those connected with El Niño and La Niña (Latif and Barnett 1995, Latif and Barnett 1996, Zhang et al. 1997, Mantua et al. 1997). Warm phases of the PDO are correlated with North American temperature and precipitation anomalies similar to those correlated with El Niño (Figure 4): above average winter and spring time temperatures in northwestern North America, below average temperatures in the southeastern US, above average winter and spring rainfall in the southern US and northern Mexico, and below average precipitation in the interior Pacific Northwest and Great Lakes regions. Cool phases of the PDO are simply correlated with the reverse climate anomaly patterns over North America (not shown), broadly similar to typical La Niña climate patterns. The PDO-related temperature and precipitation patterns are also strongly expressed in regional snow pack and stream flow anomalies, especially in western North America (see Cayan 1995, Mantua et al. 1997, Bitz and Battisti 1999, Nigam et al. 1999). A summary of major PDO climate anomalies are listed in Table 1. ”
http://www.atmos.washington.edu/~mantua/REPORTS/PDO/PDO_cs.htm
“Interdecadal changes in Pacific climate have widespread impacts on natural systems, including water resources in the Americas and many marine fisheries in the North Pacific.”
http://www.springerlink.com/content/5xm9ngv5fn5dc2r7/
I wouldn’t say that I’m “certain”, but I am fairly confident the PDO influences Earth’s temperature in a similar manner as El Niño/La Niña does.
Geometry.
The ‘top of atmosphere’ values are 1366 W/m2. with a 0.1% varience -~ 1.3W/m2
But the Earth surface is not a square metre, its a revolving sphere.
surface area of a disc = PIr2
Surface area of a sphere = 4PIr2
What? Why? What role does Earth’s rotation, spherical shape and “Earth surface is not a square metre” play in the amount of solar radiation reaches the surface?
You are right that there is much in the literature that refers to the top of atmosphere figure
So you are agreeing that Michael Tobis’ statement that “nothing in the published literature indicates anything larger than 0.3 W/m^2 peak-to-peak solar variability on decadal-to-century time scales.” is in fact erroneous?
Michael Tobis – CFCs became a problem when the patent ran out. It can be difficult to grasp just how much misinformation is produced about our physical world by AGWScience, and for every statement made about any part of it a lot of aspects have to be looked at to realise, and to explain, just how corrupt, and deliberately so, the whole exercise is.
Carbon Dioxide ‘well-mixed’ and ‘accumulating in the atmosphere’ a case in point. I’ve given two real physical pieces of information which debunks this, (CO2 is heavier than the fluid gaseous atmosphere and so does not readily rise into the air, but will always spontaneously gravitate down to earth because it displaces the lighter nitrogen and oxygen molecules, whether one CO2 molecule or a whole bunch of them say from an erupting or venting volcano, and, that all rain is carbonic acid, that is, at cooler temperatures, carbon dioxide spontaneously combines with water so is being continually removed from the atmosphere in the Water Cycle). Another reason it is not well-mixed is that it is subject to the limitations of the movement of volumes of air, wind. Wind does not move from one hemisphere to the other, although there is some mixing at the equator the circulation patterns of wind, volumes of air moving, are limited to the hemisphere the volume is in. Basically, wind happens when volumes of air get hot, hot air rises because it is less dense than cold air and as it rises colder volumes of air above it move down below replacing the hotter air rising. Wind is not an invisible paddle stirring the atmosphere. The atmosphere is not in constant motion of ‘turbulence’ as AGWScience claims. Glacing outside, there is a little light breeze barely moving the tops of the tall trees around me, much of the time it is calm outdoors.
The other side to this is the reasons given by AGWScience by calling molecules of nitrogen, oxygen and carbon dioxide ideal gas. No real gas obeys ideal gas law, because, real gases have actual real volume, actual real weight relative to each other, actually interact with each other, etc. as above in forming carbonic acid, rain. Real molecules do not bounce off each other so thoroughly mixing as AGWScience claims. Carbon dioxide is a real molecule of gas which has real volume, it is not an imaginary ideal gas in an imaginary test tube. Neither do carbon dioxide molecules get dispersed by Brownian motion to mix throroughly in air as AGWScience also claims. Examples given such as ink mixing with water, or scent mixing through the air in a room, are examples of mixing by convection, not Brownian motion.
So you see, for every claim about the properties and processes in our physical world by AGWScience the debunking is not a simple task. It doesn’t matter to AGWScience that its claims are impossible in the real world, its only interest is to confuse and dumbdown the population into believing ‘whatever it says’ is ‘true’. Even when its own reasons contradict each other it is not bothered, as long as the memes get into mass consciousness it doesn’t care that the claims don’t make sense. But they don’t want this to be discussed by the masses being actively duped, so much of their ‘defence’ is geared to preventing discussion.
Re Mario Molina – bearing the above in mind, there are two very good posts on this page which will give you a clearer understanding of ozone and cfcs in the real world, and which hopefully will guide you back from the other side of the looking glass where one can believe any number of impossible things before breakfast and where AGWScience has set up shop. You can make your own judgement as to whether Molina is ignorant of real physics and real properties of molecules or is a deliberate peddler of misinformation for the entity AGWScience fiction.
See kmgur 03-15-02, 04:41 PM and Edufer 03-19002, 07:33 PM on http://www.sciforums.com/CFC-s-And-HCFC-s-t-6108.html
@- justthefactswuwt says:
July 3, 2011 at 2:04 am
“I wouldn’t say that I’m “certain”, but I am fairly confident the PDO influences Earth’s temperature in a similar manner as El Niño/La Niña does.”
The PDO and El Niño/La Niña variations are defined as certain patterns of physical observation, mostly of sea surface temperature, air pressure and ocean current directions.
It is circular to have the pattern of temperature/pressure/current direction values defined as the cause of … the pattern of temp/pressure/vector values.
The PDO is a value derived from measurement, it isn’t an active causal agent in its own right.
“What? Why? What role does Earth’s rotation, spherical shape and “Earth surface is not a square metre” play in the amount of solar radiation reaches the surface?”
I suspect other posts have clarified it better by now but I’ll try once more…
The 0.1% change in solar energy is measured in two contexts which give different values, but are the SAME solar variation.
For a square meter in space perpendicular to the Sun the solar variation is ~1.3W/m2 the 0.1% of 1366W/m2
But as you have pointed out a percentage of that is reflected and plays no further part in the energy balance.
But the inclination of the surface to the Sun also matters. For instance during a polar summer the sun never sets and the pole gets the full 1366W/m2 24hr a day.
But that 1366W is shining on FAR more than a square meter because the inclination of the Sun is so low.
Because the Earth is a rotating sphere each 1366W/m2 from the Sun is effectively spread over 4m2 of the Earths surface. Therefore the lower figure is 0.1% of the total solar energy per square meter of the Earths SURFACE.
Not a square meter perpendicular to the Sun above the atmosphere.
Bystander should appreciate that you might feel sick and see your doctor, but the state of medical science is still in many ways primeval. If you are ‘lucky’ you might have something the doc. understands but still might not be able to do anything about, like the common cold.. If you are unlucky it could well be an area that is poorly or not understood at all viz. some forms of cancer, MS, mental problems etc etc etc.
I’d say a bit like climate science.
This site might be useful if someone competent were to flag consensus-challenging items on a scale of a) genuine challenge to mainstream science – b) nitpicking or cherry-picking – c) misinformed – d) confused – e) crackpot.
I haven’t seen any examples in the first category but I’m not a regular reader. I suppose they are not impossible in principle. I see plenty of examples in the other categories. Usually nobody bothers to challenge them, since the name of the game is to challenge mainstream science. But the consequence is that most of the challenges are worthless. You need some mechanism to challenge the lousy ones and promote the good ones if you expect the scientific community to bother to engage in some manner other than didactic.
That said I support izen’s didactic effort to explain the factor of 4 in the astronomical vs earth science measures of the solar constant.. I have seen places you’d really expect to know better get confused about this. The solar constant referred to a square meter of space at the earth’s orbit is exactly one quarter of the solar constant referred to a square meter at the top of the atmosphere. This is because the cross section of a sphere has exactly a quarter of the area of the surface of the same sphere.
Greenhouse forcing only makes sense in the latter context, so to compare them you have to use the smaller value of solar constant. When somebody has put some effort into explaining it, you should do comparable work trying to understand it. Ignoring it or dismissing it contemptuously doesn’t bode well for actually making progress on understanding what is going on.
@- Myrrh says:
July 3, 2011 at 2:49 am
“Carbon Dioxide ‘well-mixed’ and ‘accumulating in the atmosphere’ a case in point. I’ve given two real physical pieces of information which debunks this, (CO2 is heavier than the fluid gaseous atmosphere and so does not readily rise into the air, but will always spontaneously gravitate down to earth because it displaces the lighter nitrogen and oxygen molecules, ”
The story that Galileo dropped a small and large cannonball from the Pisa belfry is probably fiction. But he did use a neat logical argument that all objects of different weights fall at the same speed.
CO2 doesn’t fall any faster than N2.
The molecules of gas are moving at around 500m/s or about a THOUSAND miles an hour. There is no way with those velocities you will get gases stratifying out by weight within the first few miles of the atmosphere. If they did… O2 heaver than N2, we would be walking in a few inches of CO2 and with our heads in pure oxygen!
A parallel would be to half fill a large box with a mix of tennis balls and baseballs, Shake vigorously to maintain an average velocity of the balls of ~1000 miles an hour.
Do you think that there will be more baseballs than tennis balls in the bottom half of the box?
Do you think that eventually they will separate if they are kept moving at those velocities?
The extent and timescale at which CO2 mixes into the global atmosphere was closely studied, not by ‘AGWscience’ but by the military tracking the excess C14 isotopes produced from above-ground nuclear tests. They had an interest in how radioactive fallout might spread. The nuclear test C14 went global within 4 years and is still being rained out
Pat Frank says:
June 30, 2011 at 4:26 pm
Unless, perhaps, the ultraviolet radiation is ionizing and produces a significant flux of electrons and cation radicals in the upper atmosphere. Cation radicals, as we all know from cloud chamber effects, can produce condensation nuclei and induce clouds. Slides 2 and 3 in the link show that both cation radicals and the freed electron can produce independent cascades of droplet nucleation. Nature is full of cascades produced by small initial perturbations.
—
The usual loose verbiage: “upper atmosphere” meaning what? UV is absorbed in the stratosphere where there is very little water vapor
======
Siliggy says:
June 30, 2011 at 8:24 pm
Also The heat from radioactive decay does not seem to be counted in any of the radiative balance charts. is it about 0.8 W/M^2?
The radioactive decay does not change on time scales of interest, so is not relevant to the climate change debate. Apart from the fact that you overstate the amount; it is only 0.08 W/m2 [ten times less].
======
Alexander Feht says:
June 30, 2011 at 8:21 pm
Very useful list, clearly demonstrating the unbelievable arrogance and ignorance of IPCC.
And of many posters at WUWT.
2) Special references to Dr. Svalgaard’s opinions are unnecessary; they don’t deserve any special consideration or exposure.
And what do you bring to the table? But, you are right, my opinion is just my opinion, like anyone else’s. Ignore it if you like, but don’t tell others what to do.
======
justthefactswuwt says:
July 3, 2011 at 1:03 am
Based on these estimates, on average about 51% of the 1.3 Watts per square meter (W/m2) would reach the surface, thus on average .663 Watts per square meter (W/m2) of the energy would reach the surface.
I thought we had a consensus here, why is Trenberth’s estimate so much lower than the PhysicalGeography.net estimate?
Of the 342 W/m2 available, 168 W/m2 = 49% is absorbed by the surface. You are off by some factor of 1000 or 1000/4, so it is not clear what you mean.
======
izen says:
July 3, 2011 at 4:16 am
But that 1366W is shining on FAR more than a square meter because the inclination of the Sun is so low.
Because the Earth is a rotating sphere each 1366W/m2 from the Sun is effectively spread over 4m2 of the Earths surface. Therefore the lower figure is 0.1% of the total solar energy per square meter of the Earths SURFACE.
Why is this even being discussed?
“Surface area of a sphere = 4PIr2”
That is all good except the distance from pole to pole is shorter than the diameter at the equator.
So to divide TSI by four is wrong.
“But the inclination of the surface to the Sun also matters. For instance during a polar summer the sun never sets and the pole gets the full 1366W/m2 24hr a day.
But that 1366W is shining on FAR more than a square meter because the inclination of the Sun is so low.”
To complicate this even further Albedo would be increased by the angle of incidence change. Stand up close to the end of a window and look at the reflection from an angle.
Now this gets interesting with the TSI spectoral change because the critical point and refractive index shift with wavelength. So the solarcycle spectoral shift would change the effective albedo more at the poles than at the equator. Note this is not an effect due to the Change in TSI but due soley to the spectoral shift. If the TSI were to not change at all but there was only a spectoral shift there would still be a change in effective albedo due to the change in the amount of reflection at angle.
http://en.wikipedia.org/wiki/Fresnel_equations
http://en.wikipedia.org/wiki/Refractive_index
moptop says: June 30, 2011 at 5:27 pm
I would have pointed out that the Milankovitch cycles never exactly repeat, as the moon is slowly moving away from the earth.
Yep, I added the following note under the reference to Milankovitch cycles;
“Also of note over very long time frames, “the Moon is spiraling away from Earth at an average rate of 3.8 cm per year”;
http://en.wikipedia.org/wiki/Lunar_distance_%28astronomy%29
http://curious.astro.cornell.edu/question.php?number=124”
and I also added a note at the bottom of the Earth’s Rotation section:
“Also of note, “Over millions of years, [Earth’s] rotation is significantly slowed by gravitational interactions with the Moon: see tidal acceleration.
http://en.wikipedia.org/wiki/Tidal_acceleration
“The presence of the moon (which has about 1/81 the mass of the Earth), is slowing Earth’s rotation and lengthening the day by about 2 ms every one hundred years.”
“However some large scale events, such as the 2004 Indian Ocean earthquake, have caused the rotation to speed up by around 3 microseconds.[21] Post-glacial rebound, ongoing since the last Ice age, is changing the distribution of the Earth’s mass thus affecting the Moment of Inertia of the Earth and, by the Conservation of Angular Momentum, the Earth’s rotation period.”
http://en.wikipedia.org/wiki/Earth%27s_rotation”
Thank you.
Steve C says: June 30, 2011 at 4:39 pm
I’d like to add mention that many, if not most or all, of the oscillations mentioned in “Gravitation” are probably also synchronised by resonance effects of the whole terrestrial system (honourable mention here of the ‘Stadium wave’ which suggests how the energy may transfer between the different oscillations). I also suspect related resonsnce influences in both solar system and solar data – after all, the whole system has had plenty of time to fall into ‘sync’, and we know that weather is broadly cyclical.
Willie Soon;
http://en.wikipedia.org/wiki/Willie_Soon
presented an interesting hypothesis at ICCC on Friday that many of the cycles we see in Earth’s climate correlate well with cycles in orbital configurations, which makes sense intuitively, because, over the long term, tidal forces;
http://en.wikipedia.org/wiki/Tidal_force
do seem to play an important role in Earth’s climate system, e.g.
“With the culmination of the 18.6-year cycle of the Moon in 2006 and again in 2024-25, also called the Major Lunar Standstill, we are afforded the unique opportunity to observe the monthly, annual, and 18.6-year wanderings of the Moon. The 18.6-year cycle is caused by the precession of the plane of the lunar orbit, while this orbit maintains a 5° tilt relative to the ecliptic. At the peak of this cycle, the Moon’s declination swings from -28.8° to +28.8° each month. What this means is that each month for the years 2005-2007 and also 2023-2026, the Moon can be seen rising and setting more northerly and also more southerly than the solar extremes, and will transit monthly with altitudes which are higher in the sky than the summer Sun and lower in the sky than the winter Sun.”
http://www.umass.edu/sunwheel/pages/moonteaching.html
“Lunar cycles are varied and extremely complex and yet the moon has more effect on the earth than any other body except the Sun. Not only are ocean tides important in shaping the earth, and are affected more by the moon than the Sun, but tides in the air are important for determining the weather which in turn affects so many other variables from plants and crops, to animals and the economy.”
“As was mentioned the 18.6 year cycle is important in determining the weather as is half of this, or 9.3 years. These cycles can be found in crop yields and in geological formations. However the moon is gradually receding from the earth which changes all of these periods very slowly. Professor Afanasiev of Moscow University has designed a method that he calls “Nanocycles method” of very accurately dating geological formations by finding the period which is presently 9.3 years and its interaction with the seasons. The 9.3 year cycle comes at the same time of year on average every 31 years because 9.3/.3 = 31. The nearest repeat of the seasons will actually happen after 28 years 2/3 of the time and 37 years 1/3 of the time. However this 31 years cyle of seasonal interaction of the is very sensitive to small changes because when the cycle was 9.2 years the interaction was in 9.2/.2 = 46 years. Professor Afanasiev has used this to accurately date deposits and so determine other geological cycles very accurately.”
http://www.cyclesresearchinstitute.org/cycles-astronomy/lunar.shtml
Science, “18.6-Year Earth Tide Regulates Geyser Activity” by John S. Rinehart, 1972
http://adsabs.harvard.edu/abs/1972Sci…177..346R
Journal of Geophysical Research, “The 18.6-Year Cycle of Sea Surface Temperature in Shallow Seas Due to Variations in Tidal Mixing” by John W. Loder and Christopher Garrett, 1978:
http://www.agu.org/pubs/crossref/1978/JC083iC04p01967.shtml
Journal of Geophysical Research, “PERIODIC (18.6-YEAR) AND CYCIJC (11-YEAR) INDUCED DROUGHT AND FLOOD IN WESTERN NORTH AMERICA” by Robert Guinn Currie, 1984:
http://www.agu.org/journals/ABS/1984/JD089iD05p07215.shtml
Climatic Change “Reconstruction of seasonal temperatures in Central Canada since A.D. 1700 and detection of the 18.6- and 22-year signals” by Joel Guiot 1987:
http://www.springerlink.com/content/q76vw37g22557105/
International Journal of Climatology “18.6-year luni-solar nodal and 10–11-year solar signals in rainfall in India”, by Kumares Mitra and S. N. Dutta, 1992:
http://onlinelibrary.wiley.com/doi/10.1002/joc.3370120807/abstract
Journal of Geophysical Research, “High-Latitude Oceanic Variability Associated With the 18.6-Year Nodal Tide” by Thomas C. Royer, 1993:
http://www.agu.org/journals/ABS/1993/92JC02750.shtml
International Journal of Climatology, “Luni-solar 18.6- and solar cycle 10–11-year signals in USA air temperature records” by Robert G. Currie, 1993:
http://onlinelibrary.wiley.com/doi/10.1002/joc.3370130103/abstract
IBM Research Center “Moon-Earth-Sun: The oldest three-body problem” by Martin C. Gutzwiller, 1998:
http://rmp.aps.org/abstract/RMP/v70/i2/p589_1
Earth, Moon, and Planets “Lunar Influences On Climate” by Dario Camuffo, 2001:
http://www.springerlink.com/content/nq3376562761675r/
American Meteorological Society “Millennial Climate Variability: Is There a Tidal Connection? by Walter Munk, Matthew Dzieciuch and Steven Jayne, 2002:
http://journals.ametsoc.org/doi/abs/10.1175/1520-0442%282002%29015%3C0370%3AMCVITA%3E2.0.CO%3B2
Geophysical Research Letters “The impacts of the Luni-Solar oscillation on the Arctic oscillation” by Renato Ramos da Silva and Roni Avissar, 2005:
http://www.duke.edu/~renato/RamosdaSilvaandAvissarGRL2005.pdf
Geophysical Research Letters “Possible explanation linking 18.6-year period nodal tidal cycle with bi-decadal variations of ocean and climate in the North Pacific” by
Ichiro Yasuda, Satoshi Osafune and Hiroaki Tatebe, 2006:
http://www.agu.org/pubs/crossref/2006/2005GL025237.shtml
Journal of Geophysical Research “The 18.6-year lunar nodal cycle and surface temperature variability in the northeast Pacific” by Stewart M. McKinnell and William R. Crawford, 2007:
http://www.agu.org/pubs/crossref/2007/2006JC003671.shtml
Deep Sea Research Part I: Oceanographic Research Papers “Lunar nodal tide effects on variability of sea level, temperature, and salinity in the Faroe-Shetland Channel and the Barents Sea” by Harald Yndestad, William R. Turrell and Vladimir Ozhigin, 2008:
http://adsabs.harvard.edu/abs/2008DSRI…55.1201Y
Nature Geoscience “Significant contribution of the 18.6 year tidal cycle to regional coastal changes” by N. Gratiot, E. J. Anthony, A. Gardel, C. Gaucherel, C. Proisy & J. T. Wells, 2008:
http://www.nature.com/ngeo/journal/v1/n3/abs/ngeo127.html
Deep Sea Research Part II: Topical Studies in Oceanography “The influence of long tides on ecosystem dynamics in the Barents Sea” by Harald Yndestad, 2009:
http://adsabs.harvard.edu/abs/2009DSR….56.2108Y
With this said, I don’t have a good source for this one yet. Once Willie’s presentation and eventually paper become available I’ll add them under 3. Gravitation: System Resonance, unless someone’s got a better name for it
Thank you for your thoughts.