By WUWT regular “Just The Facts”
I am often amused by claims that we understand Earth’s climate system, are able to accurately measure its behavior, eliminate all potential variables except CO2 as the primary driver of Earth’s temperature and make predictions of Earth’s temperature decades into the future, all with a high degree of confidence. I have been studying Earth’s climate system for several years and have found it to be a ridiculously complex, continually evolving and sometimes chaotic beast. Furthermore, our understanding of Earth’s climate system is currently rudimentary at best, our measurement capabilities are limited and our historical record is laughably brief. To help demonstrate the complexity of Earth’s climate system I have been compiling a list of all of the variables potentially involved in Earth’s climate system. This is a work in progress so additions, recommendations, corrections, questions etc. are most welcome. Once I develop this further and polish it up a bit I plan to convert it into a new WUWT Reference Page.
UPDATED: This list has undergone significant revisions and improvements based upon crowdsourcing the input of an array of very intelligent and knowledgeable contributors below. Additionally, this list was posted in comments in WUWT a few times previously, receiving input from a number of other very intelligent and knowledgeable contributors. This thread, along with links to the precursor threads below, will thus serve as the bibliography for the forthcoming WUWT Potential Climatic Variables reference page (unless someone can up with a better name for it…:)
1. Earth’s Rotational Energy;
http://en.wikipedia.org/wiki/Rotational_energy
http://en.wikipedia.org/wiki/Earth%27s_rotation
http://www.physicalgeography.net/fundamentals/6h.html
results in day and night;
http://wiki.answers.com/Q/Why_does_rotation_cause_day_and_night
causes the Coriolis Effect;
http://en.wikipedia.org/wiki/Coriolis_effect
imparts Planetary Vorticity on the oceans;
http://oceanworld.tamu.edu/resources/ocng_textbook/chapter12/chapter12_01.htm
and manifests as Ocean Gyres;
http://en.wikipedia.org/wiki/Ocean_gyre
the Antarctic Circumpolar Current;
http://en.wikipedia.org/wiki/Antarctic_Circumpolar_Current
http://en.wikipedia.org/wiki/File:Conveyor_belt.svg
Arctic Ocean Circulation;
http://www.whoi.edu/page.do?pid=12455&tid=441&cid=47170&ct=61&article=20727
http://www.john-daly.com/polar/flows.jpg
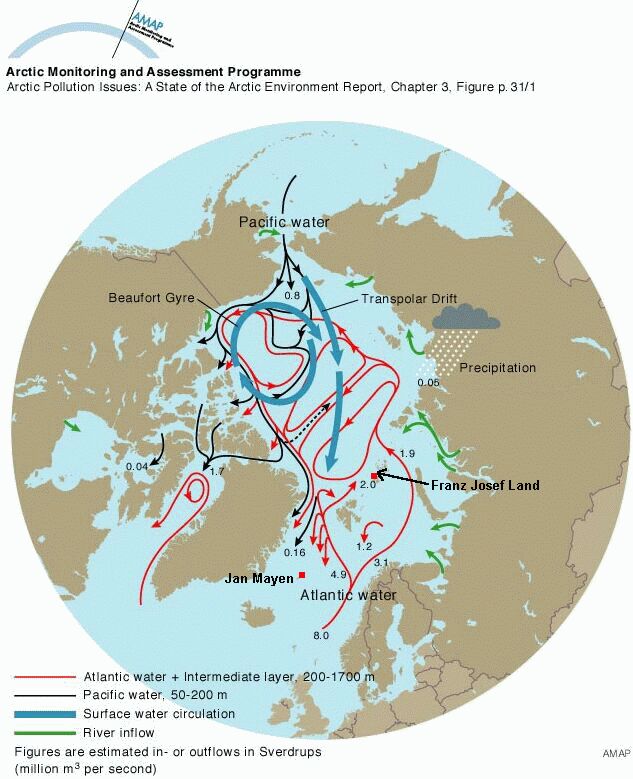
can result in the formation of Polynya;
http://en.wikipedia.org/wiki/Polynya
and causes the Equatorial Bulge:
http://en.wikipedia.org/wiki/Equatorial_bulge
Earth’s Rotational Energy influences Atmospheric Circulation;
http://en.wikipedia.org/wiki/Atmospheric_circulation
including the Jet Stream;
http://en.wikipedia.org/wiki/Jet_stream
Westerlies;
http://en.wikipedia.org/wiki/Westerlies
Tradewinds;
http://en.wikipedia.org/wiki/Trade_wind
Geostrophic Wind;
http://en.wikipedia.org/wiki/Geostrophic_wind
Surface Currents;
http://www.windows2universe.org/earth/Water/ocean_currents.html h
http://en.wikipedia.org/wiki/Ocean_current
through Ekman Transport;
http://en.wikipedia.org/wiki/Ekman_transport
http://oceanmotion.org/html/background/ocean-in-motion.htm
Tropical Cyclones;
http://en.wikipedia.org/wiki/Tropical_cyclone
Tornadoes:
http://en.wikipedia.org/wiki/Tornado
and Polar Vortices;
http://en.wikipedia.org/wiki/Polar_vortex
which “are caused when an area of low pressure sits at the rotation pole of a planet. This causes air to spiral down from higher in the atmosphere, like water going down a drain.”
http://www.universetoday.com/973/what-venus-and-saturn-have-in-common/
Here’s an animation of the Arctic Polar Vortex in Winter 2008 – 09:
When a Polar Vortex breaks down it causes a Sudden Stratospheric Warming:
http://en.wikipedia.org/wiki/Sudden_stratospheric_warming
Earth’s Rotational Energy influences Plate Tectonics;
http://en.wikipedia.org/wiki/Plate_tectonics
“By analyzing the minute changes in travel times and wave shapes for each doublet, the researchers concluded that the Earth’s inner core is rotating faster than its surface by about 0.3-0.5 degrees per year.
That may not seem like much, but it’s very fast compared to the movement of the Earth’s crust, which generally slips around only a few centimeters per year compared to the mantle below, said Xiaodong Song, a geologist at the University of Illinois at Urbana-Champaign and an author on the study.
http://www.livescience.com/9313-earth-core-rotates-faster-surface-study-confirms.html
The surface movement is called plate tectonics. It involves the shifting of about a dozen major plates and is what causes most earthquakes”:
http://en.wikipedia.org/wiki/Earthquake
Volcanoes;
http://en.wikipedia.org/wiki/Volcano
and Mountain Formation;
http://en.wikipedia.org/wiki/Mountain_formation
which can influence the creation of Atmospheric Waves:
http://en.wikipedia.org/wiki/Atmospheric_wave
Lastly, Rotational Energy is the primary driver of Earth’s Dynamo;
http://en.wikipedia.org/wiki/Dynamo_theory
which generates Earth’s Magnetic Field;
http://en.wikipedia.org/wiki/Earth%27s_magnetic_field
and is primarily responsible for the Earthy behaviors of the Magnetosphere;
http://en.wikipedia.org/wiki/Magnetosphere
with certain secular variations in Earth’s magnetic field originating from ocean flow/circulation;
http://news.nationalgeographic.com/news/2009/06/090622-earths-core-dynamo.html
http://iopscience.iop.org/1367-2630/11/6/063015/fulltext
though Leif Svalgaard notes that these are minor variations, as the magnetic field originating from ocean flow/circulation “is 1000 times smaller than the main field generated in the core.”
Also of note, “Over millions of years, [Earth’s] rotation is significantly slowed by gravitational interactions with the Moon: see tidal acceleration.
http://en.wikipedia.org/wiki/Tidal_acceleration
“The presence of the moon (which has about 1/81 the mass of the Earth), is slowing Earth’s rotation and lengthening the day by about 2 ms every one hundred years.”
“However some large scale events, such as the 2004 Indian Ocean earthquake, have caused the rotation to speed up by around 3 microseconds.[21] Post-glacial rebound, ongoing since the last Ice age, is changing the distribution of the Earth’s mass thus affecting the Moment of Inertia of the Earth and, by the Conservation of Angular Momentum, the Earth’s rotation period.”
http://en.wikipedia.org/wiki/Earth%27s_rotation
2. Orbital Energy, Orbital Period, Elliptical Orbits (Eccentricity), Tilt (Obliquity) and Wobble (Axial precession):
http://en.wikipedia.org/wiki/Specific_orbital_energy
http://en.wikipedia.org/wiki/Synodic
http://www.physicalgeography.net/fundamentals/6h.html
creates Earth’s seasons;
http://en.wikipedia.org/wiki/Season
which drives annual changes in Arctic Sea Ice;
and Antarctic Sea Ice;
the freezing and melting of which helps to drive the Thermohaline Circulation;
http://en.wikipedia.org/wiki/Thermohaline_circulation
and can result in the formation of Polynyas:
http://en.wikipedia.org/wiki/Polynya
Earth’s orbit around the Sun, Earth’s tilt, Earth’s wobble and the Moon’s orbit around Earth, Earth’s Rotation, and the gravity of the Moon, Sun and Earth, act in concert to determine the constantly evolving Tidal Force on Earth:
http://en.wikipedia.org/wiki/Tidal_force
This Tidal Force is influenced by variations in Lunar Orbit;
http://en.wikipedia.org/wiki/Orbit_of_the_Moon
as seen in the Lunar Phases;
http://en.wikipedia.org/wiki/Lunar_phase
Lunar Precession;
http://en.wikipedia.org/wiki/Lunar_precession
Lunar Node;
http://en.wikipedia.org/wiki/Lunar_node
Saros cycles;
http://en.wikipedia.org/wiki/Saros_cycle
and Inex cycles:
http://en.wikipedia.org/wiki/Inex
The combined cycles of the Saros and Inex Cycles can be visualized here:
http://eclipse.gsfc.nasa.gov/SEsaros/image/SEpanoramaGvdB-big.JPG
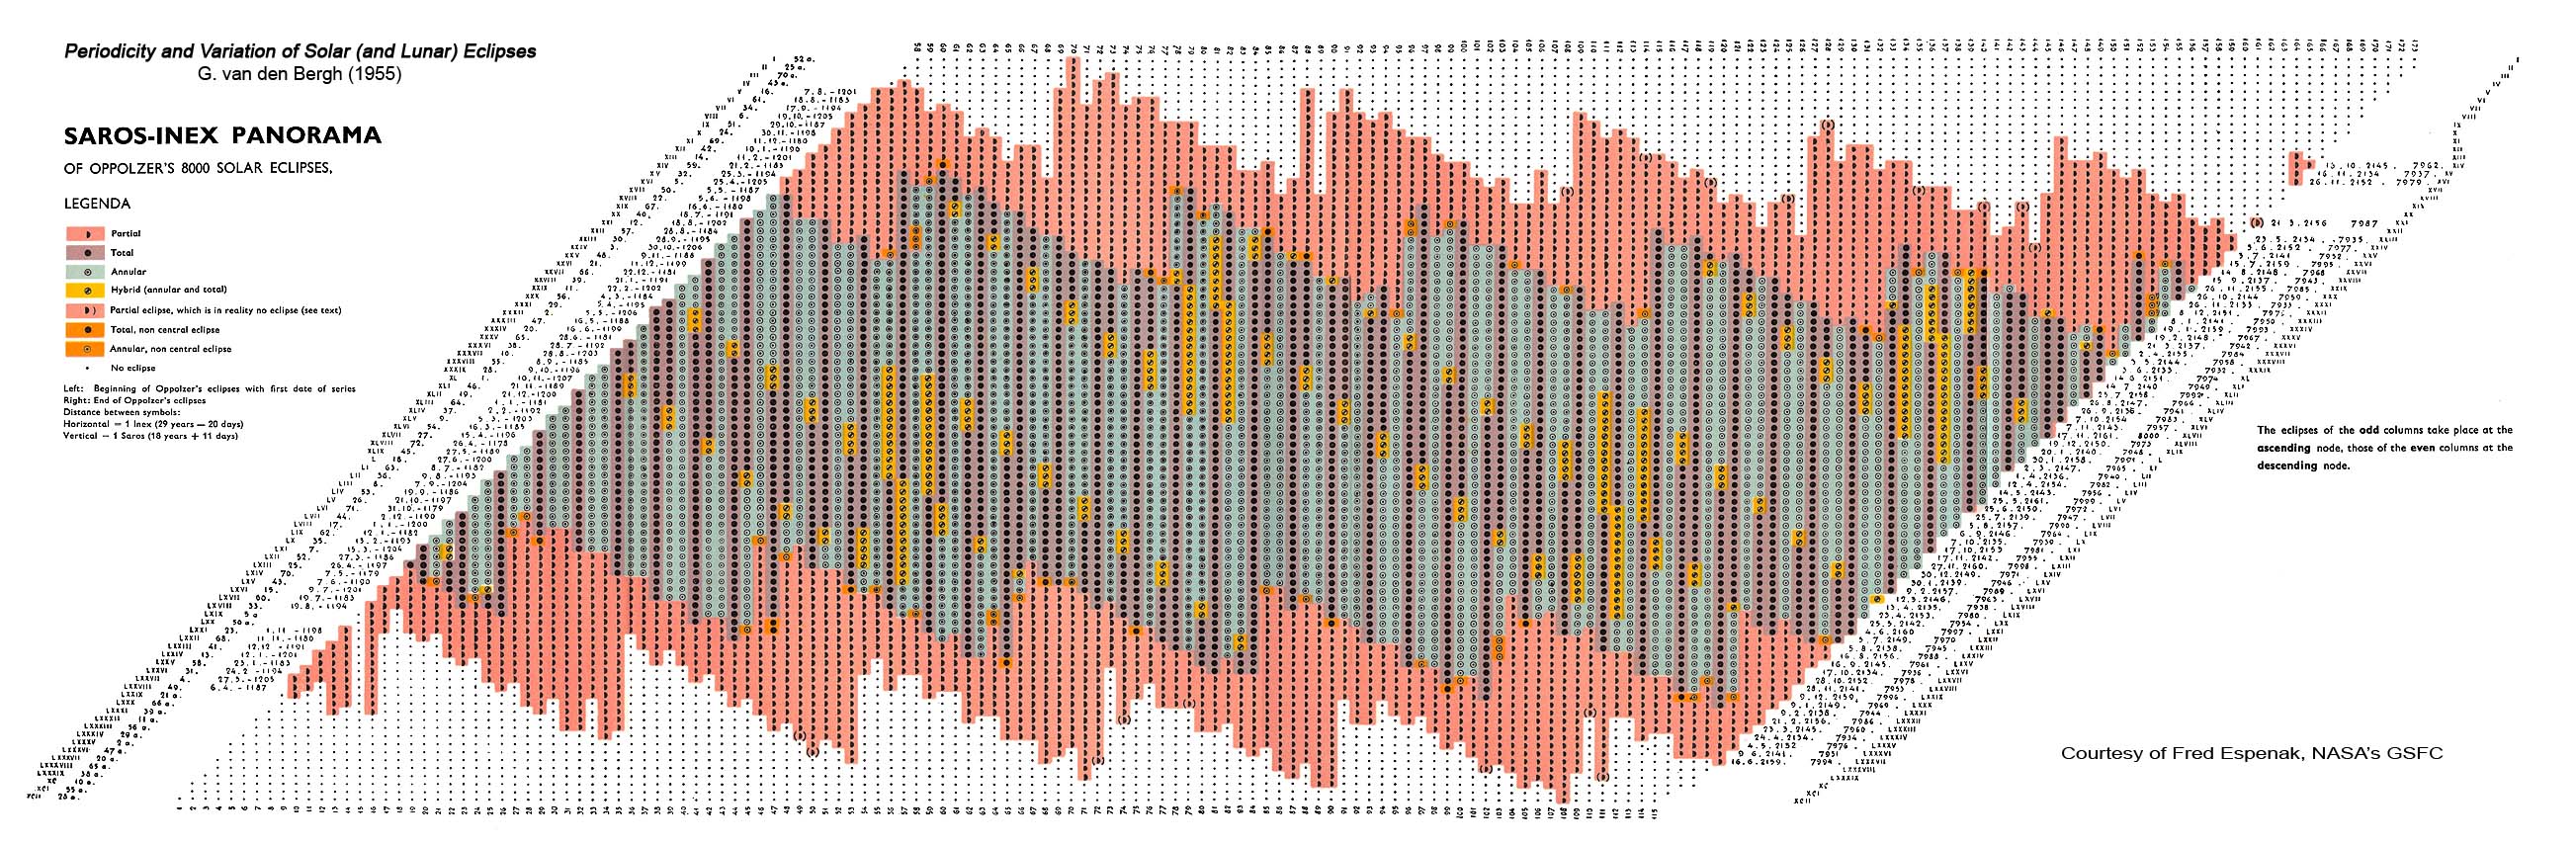
Over longer time frames changes to Earth’s orbit, tilt and wobble called Milankovitch cycles;
http://en.wikipedia.org/wiki/Milankovitch_cycles
may be responsible for the periods of Glaciation (Ice Ages);
http://www.homepage.montana.edu/~geol445/hyperglac/time1/milankov.htm
that Earth has experienced for the last several million years of its climatic record:
http://en.wikipedia.org/wiki/Ice_age
Also of note, over very long time frames, “the Moon is spiraling away from Earth at an average rate of 3.8 cm per year”;
http://en.wikipedia.org/wiki/Lunar_distance_%28astronomy%29
http://curious.astro.cornell.edu/question.php?number=124
3. Gravitation:
http://en.wikipedia.org/wiki/Gravitation
The gravity of the Moon, Sun and Earth, Earth’s rotation, Earth’s orbit around the Sun, Earth’s tilt, Earth’s wobble and the Moon’s orbit around Earth act in concert to determine the constantly evolving Tidal Force on Earth:
http://en.wikipedia.org/wiki/Tidal_force
This tidal force results in that result in Earth’s Ocean Tide;
http://en.wikipedia.org/wiki/Tide
http://www.themcdonalds.net/richard/astro/papers/602-tides-web.pdf
Atmospheric Tide;
http://en.wikipedia.org/wiki/Atmospheric_tide
and Magma Tide:
http://www.springerlink.com/content/h7005r0273703250/
Earth’s Gravity;
http://en.wikipedia.org/wiki/Convection#Gravitational_or_buoyant_convection
http://visibleearth.nasa.gov/view_rec.php?id=205
in concert with Tidal Forces, influence Earth’s Ocean Circulation;
http://www.eoearth.org/article/Ocean_circulation
which influences Oceanic Oscillations including El Niño/La Niña;
http://en.wikipedia.org/wiki/El_Ni%C3%B1o-Southern_Oscillation
the Pacific Decadal Oscillation (PDO);
http://en.wikipedia.org/wiki/Pacific_Decadal_Oscillation
the Atlantic Multi-Decadal Oscillation (AMO);
http://en.wikipedia.org/wiki/Atlantic_Multidecadal_Oscillation
the Indian_Ocean_Dipole (IOD)/Indian Ocean Oscillation (IOO) and;
http://en.wikipedia.org/wiki/Indian_Ocean_Dipole
can result in the formation of Polynyas:
http://en.wikipedia.org/wiki/Polynya
Gravity Waves;
http://en.wikipedia.org/wiki/Gravity_wave
which may be partially responsible for the Quasi-Biennial Oscillation (QBO);
http://en.wikipedia.org/wiki/Quasi-biennial_oscillation
“on an air–sea interface are called surface gravity waves or Surface Waves”;
http://en.wikipedia.org/wiki/Surface_wave
“while internal gravity waves are called Inertial Waves”:
http://en.wikipedia.org/wiki/Inertial_waves
“Rosby Waves;
http://en.wikipedia.org/wiki/Rossby_waves
Geostrophic Currents
http://en.wikipedia.org/wiki/Geostrophic
and Geostrophic Wind
http://en.wikipedia.org/wiki/Geostrophic_wind
are examples of inertial waves. Inertial waves are also likely to exist in the core of the Earth”
Earth’s gravity is the primary driver of Plate Tectonics;
http://en.wikipedia.org/wiki/Plate_tectonics
“The Slab Pull;
http://en.wikipedia.org/wiki/Slab_pull
force is a tectonic plate force due to subduction. Plate motion is partly driven by the weight of cold, dense plates sinking into the mantle at trenches. This force and the slab suction force account for most of the overall force acting on plate tectonics, and the Ridge Push;
force accounts for 5 to 10% of the overall force.”
Plate Tectonics drive “cycles of ocean basin growth and destruction, known as Wilson cycles;
http://csmres.jmu.edu/geollab/fichter/Wilson/Wilson.html
involving continental rifting;
http://en.wikipedia.org/wiki/Rift
seafloor-spreading;
http://en.wikipedia.org/wiki/Seafloor_spreading
subduction;
http://en.wikipedia.org/wiki/Subduction
and collision.”:
http://en.wikipedia.org/wiki/Continental_collision
“Climate change on ultra-long time scales (tens of millions of years) are more than likely connected to plate tectonics.”
“Through the course of a Wilson cycle continents collide and split apart, mountains are uplifted and eroded, and ocean basins open and close. The re-distribution and changing size and elevation of continental land masses may have caused climate change on long time scales”;
http://www.pbs.org/wgbh/nova/ice/chill.html
a process called the Supercontinent Cycle:
http://en.wikipedia.org/wiki/Supercontinent_cycle
Earth’s gravity is responsible for Katabatic Wind:
http://en.wikipedia.org/wiki/Katabatic_wind
4. Solar Energy;
http://en.wikipedia.org/wiki/Solar_energy
results is Solar Radiation/Sunlight;
http://en.wikipedia.org/wiki/Solar_radiation
which varies based upon 11 and 22 year cycles:
http://en.wikipedia.org/wiki/Solar_cycle
Total Solar Irradiance (TSI);
http://www.ngdc.noaa.gov/stp/solar/solarirrad.html
appears to fluctuate “by approximately 0.1% or about 1.3 Watts per square meter (W/m2) peak-to-trough during the 11-year sunspot cycle”:
http://en.wikipedia.org/wiki/Solar_variation
Solar Energy also drives the Hydrological/Water Cycle;
http://en.wikipedia.org/wiki/Hydrological_cycle
within the Hydrosphere;
http://en.wikipedia.org/wiki/Hydrosphere
as Total Solar Irradiance (TSI) causes evaporation;
http://en.wikipedia.org/wiki/Evaporation
that drives cloud formation;
http://en.wikipedia.org/wiki/Cloud
results in precipitation;
http://en.wikipedia.org/wiki/Precipitation_%28meteorology%29
that results in the Water Distribution on Earth;
http://en.wikipedia.org/wiki/Water_distribution_on_Earth
creates surface runoff;
http://en.wikipedia.org/wiki/Runoff_%28water%29
which result in rivers;
http://en.wikipedia.org/wiki/River
and drives erosion:
http://en.wikipedia.org/wiki/Erosion
Solar energy is also “The driving force behind atmospheric circulation is solar energy, which heats the atmosphere with different intensities at the equator, the middle latitudes, and the poles.”
http://www.scienceclarified.com/As-Bi/Atmospheric-Circulation.html
Atmospheric Circulation;
http://en.wikipedia.org/wiki/Atmospheric_circulation
includes Hadley Cells;
http://en.wikipedia.org/wiki/Hadley_cell
Ferrel Cells;
http://en.wikipedia.org/wiki/Atmospheric_circulation#Ferrel_cell
Polar Cells;
http://en.wikipedia.org/wiki/Polar_cells
and Polar Vortexes:
http://en.wikipedia.org/wiki/Polar_cells
all of which help to create Wind;
http://en.wikipedia.org/wiki/Wind
that influence Surface Currents;
http://www.windows2universe.org/earth/Water/ocean_currents.html
http://en.wikipedia.org/wiki/Ocean_current
through Ekman Transport;
http://en.wikipedia.org/wiki/Ekman_transport
http://oceanmotion.org/html/background/ocean-in-motion.htm
and also cause Langmuir circulations
http://en.wikipedia.org/wiki/Langmuir_circulation
Solar energy is also a driver of the Brewer-Dobson Circulation
http://en.wikipedia.org/wiki/Brewer-Dobson_circulation
Atmospheric Waves;
http://en.wikipedia.org/wiki/Atmospheric_wave
including Atmospheric Tides
http://en.wikipedia.org/wiki/Atmospheric_tide
as well as evaporation and condensation may help to drive changes in Atmospheric Pressure:
http://en.wikipedia.org/wiki/Atmospheric_pressure
http://www.atmos-chem-phys-discuss.net/10/24015/2010/acpd-10-24015-2010.pdf
Solar Ultraviolet (UV) radiation;
http://en.wikipedia.org/wiki/Ultraviolet
appears to vary by approximately 10% during the solar cycle;
http://www.nasa.gov/topics/solarsystem/features/solarcycle-sorce.html
has been hypothesized to influence Earth’s climate;
http://wattsupwiththat.com/2011/04/05/courtillot-on-the-solar-uv-climate-connection/
however Leif Svalgaard argues that,
This is well-trodden ground. Nothing new to add, just the same old, tired arguments. Perhaps a note on EUV: as you can see here (slide 13)
http://lasp.colorado.edu/sorce/news/2008ScienceMeeting/doc/Session1/S1_03_Kopp.pdf the energy in the EUV band [and other UV bands] is very tiny; many orders of magnitude less than what shines down on our heads each day. So a larger solar cycle variation of EUV does not make any significant difference in the energy budget.
http://wattsupwiththat.com/2011/04/05/courtillot-on-the-solar-uv-climate-connection/#comment-636477
Additionally variations in Ultraviolet (UV) radiation may influence the break down of Methane;
(Source TBD)
Infrared Radiation;
http://en.wikipedia.org/wiki/Infrared
Solar – Wind;
http://science.nasa.gov/science-news/science-at-nasa/1999/ast13dec99_1/
Solar – Coronal Holes;
http://helios.gsfc.nasa.gov/chole.html
Solar – Solar Energetic Particles (SEP);
http://helios.gsfc.nasa.gov/sep.html
Solar – Coronal Mass Ejection;
http://www.esa.int/esaSC/SEMF75BNJTF_index_0.html
http://www.ratedesi.com/video/v/8AuCE_NNEaM/Sun-Erupts-to-Life-Unleashes-a-Huge-CME-on-13-April-2010
Solar Magnetosphere Breach;
Solar Polar Field Reversal;
http://science.nasa.gov/science-news/science-at-nasa/2001/ast15feb_1/
Solar Sector Boundary;
http://science.nasa.gov/heliophysics/focus-areas/magnetosphere-ionosphere/
Grand Minimum;
Leif Svalgaard says: February 6, 2011 at 8:26 pm
If L&P are correct and sunspots become effectively] invisible [not gone] it might mean another Grand Minimum lasting perhaps 50 years. During this time the solar cycle is still operating, cosmic rays are still modulated, and the solar wind is still buffeting the Earth.”
“It will lead to a cooling of a couple of tenths of a degree.”
Solar Influences on Climate:
http://www.leif.org/EOS/2009RG000282.pdf
Statistical issues about solar–climate relations
http://www.leif.org/EOS/Yiou-565-2010.pdf
5. Geothermal Energy;
http://en.wikipedia.org/wiki/Geothermal_energy
influences Earth’s climate especially when released by Volcanoes;
http://en.wikipedia.org/wiki/Volcano
“which are generally found where tectonic plates are diverging;
http://en.wikipedia.org/wiki/Divergent_boundary
or converging”;
http://en.wikipedia.org/wiki/Convergent_boundary
however, “intraplate volcanism has also been postulated to be caused by mantle plumes”:
http://en.wikipedia.org/wiki/Mantle_plume
“These so-called “hotspots”;
http://en.wikipedia.org/wiki/Hotspot_%28geology%29
for example Hawaii, are postulated to arise from upwelling diapirs;
http://en.wikipedia.org/wiki/Diapir
from the core-mantle boundary, 3,000 km deep in the Earth.”
Volcanoes have been shown to influence Earth’s climate;
http://www.geology.sdsu.edu/how_volcanoes_work/climate_effects.html
http://www.longrangeweather.com/global_temperatures.htm
including in the infamous Year Without a Summer;
http://en.wikipedia.org/wiki/Year_Without_a_Summer
which was partially caused by the 1815 eruption of Mount Tambora;
http://en.wikipedia.org/wiki/1815_eruption_of_Mount_Tambora
and is called a Volcanic Winter:
http://en.wikipedia.org/wiki/Volcanic_winter
“Volcanic Ash;
http://en.wikipedia.org/wiki/Volcanic_ash
particles have a maximum residence time in the troposphere of a few weeks.
The finest Tephera;
http://en.wikipedia.org/wiki/Tephra
remain in the stratosphere for only a few months, they have only minor climatic effects, and they can be spread around the world by high-altitude winds. This suspended material contributes to spectacular sunsets.
“The greatest volcanic impact upon the earth’s short term weather patterns is caused by sulfur dioxide gas;”
http://en.wikipedia.org/wiki/Sulfur_dioxide
“In the cold lower atmosphere, it is converted to Sulfuric Acid;
http://en.wikipedia.org/wiki/Sulfuric_acid
sulfuric acid by the sun’s rays reacting with stratospheric water vapor to form sulfuric acid aerosol layers. The aerosol remains in suspension long after solid ash particles have fallen to earth and forms a layer of sulfuric acid droplets between 15 to 25 kilometers up. Fine ash particles from an eruption column fall out too quickly to significantly cool the atmosphere over an extended period of time, no matter how large the eruption.
Sulfur aerosols last many years, and several historic eruptions show a good correlation of sulfur dioxide layers in the atmosphere with a decrease in average temperature decrease of subsequent years. The close correlation was first established after the 1963 eruption of Agung volcano in Indonesia when it was found that sulfur dioxide reached the stratosphere and stayed as a sulfuric acid aerosol.
Without replenishment, the sulfuric acid aerosol layer around the earth is gradually depleted, but it is renewed by each eruption rich in sulfur dioxide. This was confirmed by data collected after the eruptions of El Chichon, Mexico (1982) and Pinatubo, Philippines (1991), both of which were high-sulfur compound carriers like Agung, Indonesia.”
http://volcanology.geol.ucsb.edu/gas.htm
There is also some evidence that if “volcanic activity was high enough, then a water vapor anomaly would be introduced into the lower stratosphere before the anomaly due to the previous eruption had disappeared. The result would be threefold in the long term: stratospheric cooling, stratospheric humidification, and surface warming due to the positive radiative forcing associated with the water vapor.”
See: http://journals.ametsoc.org/doi/pdf/10.1175/1520-0442(2003)016%3C3525%3AAGSOVE%3E2.0.CO%3B2#h1
Geothermic Energy can also warm the atmosphere through Hot Springs;
http://en.wikipedia.org/wiki/Hot_springs
Or warm the ocean through Hydrothermal Vents:
http://en.wikipedia.org/wiki/Hydrothermal_vent
Which can be a factor in Hydrothermal Circulations:
http://en.wikipedia.org/wiki/Hydrothermal_circulation
6. Outer Space/Cosmic/Galactic Influences;
http://en.wikipedia.org/wiki/Outer_space
http://en.wikipedia.org/wiki/Cosmos
http://en.wikipedia.org/wiki/Galaxy
including Asteroids;
http://en.wikipedia.org/wiki/Asteroid
Meteorites;
http://en.wikipedia.org/wiki/Meteorite
and Comets;
http://en.wikipedia.org/wiki/Comet
can all significantly impact Earth’s climate upon impact.
It has been hypothesized that Galactic Cosmic Rays;
http://en.wikipedia.org/wiki/Galactic_cosmic_ray
http://en.wikipedia.org/wiki/Cosmic_ray
modulated by Solar Wind, may influence cloud formation on Earth:
Galactic Magnetic Fields also result in the;
http://www.scholarpedia.org/article/Galactic_magnetic_fields
Galactic Tide;
http://en.wikipedia.org/wiki/Galactic_tide
which may influence the hypothesized Oort cloud;
http://en.wikipedia.org/wiki/Oort_Cloud
“Besides the galactic tide, the main trigger for sending comets into the inner Solar System is believed to be interaction between the Sun’s Oort cloud and the gravitational fields of near-by stars or giant molecular clouds.”
7. Magnetic Forces;
http://en.wikipedia.org/wiki/Earth%27s_magnetic_field
Earth Core Changes:
http://physicsworld.com/cws/article/news/42580
“appears to be generated in the Earth’s core by a dynamo process, associated with the circulation of liquid metal in the core, driven by internal heat sources”
impact the Magnetosphere;
http://en.wikipedia.org/wiki/Magnetosphere
including movement of the Geomagnetic Poles:
http://www.ngdc.noaa.gov/geomag/GeomagneticPoles.shtml
http://news.nationalgeographic.com/news/2009/12/091224-north-pole-magnetic-russia-earth-core.html
8. Atmospheric Composition
http://en.wikipedia.org/wiki/Atmosphere_of_Earth
Nitrogen (N2) represents approximately 780,840 ppmv or 78.084% of Earth’s Atmosphere;
http://en.wikipedia.org/wiki/Nitrogen
Oxygen (O2) represents approximately 209,460 ppmv or 20.946%;
http://en.wikipedia.org/wiki/Oxygen
Argon (Ar) represents approximately 9,340 ppmv or 0.9340%;
http://en.wikipedia.org/wiki/Argon
Carbon Dioxide (CO2) represents approximately 390 ppmv or 0.039%;
http://en.wikipedia.org/wiki/Carbon_dioxide
contributes to the Greenhouse Effect;
?
and
influences the rate of Plant Growth;
http://www.sjsu.edu/faculty/watkins/CO2plants.htm
Neon (Ne) represents approximately18.18 ppmv or 0.001818%;
http://en.wikipedia.org/wiki/Neon
Helium (He) represents approximately 5.24 ppmv (0.000524%);
http://en.wikipedia.org/wiki/Helium
Krypton (Kr) represents approximately 1.14 ppmv (0.000114%);
http://en.wikipedia.org/wiki/Krypton
Methane (CH4) represents approximately 1.79 ppmv (0.000179%);
http://en.wikipedia.org/wiki/Methane
contributes to the Greenhouse Effect;
?
Hydrogen (H2) represents approximately 0.55 ppmv (0.000055%);
http://en.wikipedia.org/wiki/Hydrogen
Nitrous Oxide (N2O) represents approximately 0.3 ppmv (0.00003%);
http://en.wikipedia.org/wiki/Nitrous_oxide
contributes to the Greenhouse Effect;
?
Ozone (O3) represents approximately 0.0 to 0.07 ppmv (0 to 7×10⁻⁶%);
http://en.wikipedia.org/wiki/Ozone
Nitrogen Dioxide (NO2) represents approximately 0.02 ppmv (2×10⁻⁶%) (0.000002%);
http://en.wikipedia.org/wiki/Nitrogen_dioxide
Iodine (I2) represents approximately 0.01 ppmv (1×10⁻⁶%) (0.000001%) and;
http://en.wikipedia.org/wiki/Iodine
Ammonia (NH3) represents a trace amount of Earth’s Atmosphere:
http://en.wikipedia.org/wiki/Ammonia
Additional atmosphere components includes Water vapor (H2O) that represents approximately 0.40% over full atmosphere, typically 1%-4% at surface.
http://en.wikipedia.org/wiki/Water_vapor;
Aerosols;
http://en.wikipedia.org/wiki/Aerosol
that “act as cloud condensation nuclei, they alter albedo (both directly and indirectly via clouds) and hence Earth’s radiation budget, and they serve as catalysts of or sites for atmospheric chemistry reactions.”
“Aerosols play a critical role in the formation of clouds;
http://en.wikipedia.org/wiki/Clouds
Clouds form as parcels of air cool and the water vapor in them condenses, forming small liquid droplets of water. However, under normal circumstances, these droplets form only where there is some “disturbance” in the otherwise “pure” air. In general, aerosol particles provide this “disturbance”. The particles around which cloud droplets coalesce are called cloud condensation nuclei (CCN) or sometimes “cloud seeds”. Amazingly, in the absence of CCN, air containing water vapor needs to be “supersaturated” to a humidity of about 400% before droplets spontaneously form! So, in almost all circumstances, aerosols play a vital role in the formation of clouds.”
http://www.windows2universe.org/earth/Atmosphere/aerosol_cloud_nucleation_dimming.html
Particulates;
http://en.wikipedia.org/wiki/Particulates
including Soot/Black Carbon;
http://en.wikipedia.org/wiki/Soot
http://en.wikipedia.org/wiki/Black_carbon
Sand;
http://en.wikipedia.org/wiki/Sand
Dust
http://en.wikipedia.org/wiki/Dust
“Volcanic Ash;
http://en.wikipedia.org/wiki/Volcanic_ash
particles have a maximum residence time in the troposphere of a few weeks.
The finest Tephera;
http://en.wikipedia.org/wiki/Tephra
remain in the stratosphere for only a few months, they have only minor climatic effects, and they can be spread around the world by high-altitude winds. This suspended material contributes to spectacular sunsets.
The major climate influence from volcanic eruptions is caused by gaseous sulfur compounds, chiefly Sulfur Dioxide;
http://en.wikipedia.org/wiki/Sulfur_dioxide
which reacts with OH and water in the stratosphere to create sulfate aerosols with a residence time of about 2–3 years.”
“Emission rates of [Sulfur Dioxide] SO2 from an active volcano range from 10 million tonnes/day according to the style of volcanic activity and type and volume of magma involved. For example, the large explosive eruption of Mount Pinatubo on 15 June 1991 expelled 3-5 km3 of dacite magma and injected about 20 million metric tons of SO2 into the stratosphere. The sulfur aerosols resulted in a 0.5-0.6°C cooling of the Earth’s surface in the Northern Hemisphere.”
http://volcanoes.usgs.gov/hazards/gas/index.php
“The 1815 eruption [of Mount Tambora] is rated 7 on the Volcanic Explosivity Index, the only such eruption since the Lake Taupo eruption in about 180 AD. With an estimated ejecta volume of 160 cubic kilometers, Tambora’s 1815 outburst was the largest volcanic eruption in recorded history.”
“The eruption created global climate anomalies that included the phenomenon known as “volcanic winter”;
http://en.wikipedia.org/wiki/Volcanic_winter
1816 became known as the “Year Without a Summer”;
http://en.wikipedia.org/wiki/Year_Without_a_Summer
because of the effect on North American and European weather. Agricultural crops failed and livestock died in much of the Northern Hemisphere, resulting in the worst famine of the 19th century.”
http://en.wikipedia.org/wiki/Mount_Tambora
“In the spring and summer of 1816, a persistent “dry fog” was observed in the northeastern US. The fog reddened and dimmed the sunlight, such that sunspots were visible to the naked eye. Neither wind nor rainfall dispersed the “fog”. It has been characterized as a stratospheric sulfate aerosol veil.”
“The greatest volcanic impact upon the earth’s short term weather patterns is caused by sulfur dioxide gas;”
http://en.wikipedia.org/wiki/Sulfur_dioxide
“In the cold lower atmosphere, it is converted to Sulfuric Acid;
http://en.wikipedia.org/wiki/Sulfuric_acid
sulfuric acid by the sun’s rays reacting with stratospheric water vapor to form sulfuric acid aerosol layers. The aerosol remains in suspension long after solid ash particles have fallen to earth and forms a layer of sulfuric acid droplets between 15 to 25 kilometers up. Fine ash particles from an eruption column fall out too quickly to significantly cool the atmosphere over an extended period of time, no matter how large the eruption.
Sulfur aerosols last many years, and several historic eruptions show a good correlation of sulfur dioxide layers in the atmosphere with a decrease in average temperature decrease of subsequent years. The close correlation was first established after the 1963 eruption of Agung volcano in Indonesia when it was found that sulfur dioxide reached the stratosphere and stayed as a sulfuric acid aerosol.
Without replenishment, the sulfuric acid aerosol layer around the earth is gradually depleted, but it is renewed by each eruption rich in sulfur dioxide. This was confirmed by data collected after the eruptions of El Chichon, Mexico (1982) and Pinatubo, Philippines (1991), both of which were high-sulfur compound carriers like Agung, Indonesia.”
http://volcanology.geol.ucsb.edu/gas.htm
There is also some evidence that if “volcanic activity was high enough, then a water vapor anomaly would be introduced into the lower stratosphere before the anomaly due to the previous eruption had disappeared. The result would be threefold in the long term: stratospheric cooling, stratospheric humidification, and surface warming due to the positive radiative forcing associated with the water vapor.”
See: http://journals.ametsoc.org/doi/pdf/10.1175/1520-0442(2003)016%3C3525%3AAGSOVE%3E2.0.CO%3B2#h1
9. Albedo
http://en.wikipedia.org/wiki/Albedo
“or reflection coefficient, is the diffuse reflectivity or reflecting power of a surface. It is defined as the ratio of reflected radiation from the surface to incident radiation upon it. Being a dimensionless fraction, it may also be expressed as a percentage, and is measured on a scale from zero for no reflecting power of a perfectly black surface, to 1 for perfect reflection of a white surface.”
Clouds
http://en.wikipedia.org/wiki/Clouds
Aerosols
http://en.wikipedia.org/wiki/Aerosol
“act as cloud condensation nuclei, they alter albedo (both directly and indirectly via clouds) and hence Earth’s radiation budget, and they serve as catalysts of or sites for atmospheric chemistry reactions.”
“Aerosols play a critical role in the formation of clouds. Clouds form as parcels of air cool and the water vapor in them condenses, forming small liquid droplets of water. However, under normal circumstances, these droplets form only where there is some “disturbance” in the otherwise “pure” air. In general, aerosol particles provide this “disturbance”. The particles around which cloud droplets coalesce are called cloud condensation nuclei (CCN) or sometimes “cloud seeds”. Amazingly, in the absence of CCN, air containing water vapor needs to be “supersaturated” to a humidity of about 400% before droplets spontaneously form! So, in almost all circumstances, aerosols play a vital role in the formation of clouds.”
http://www.windows2universe.org/earth/Atmosphere/aerosol_cloud_nucleation_dimming.html
Snow
Ice
Water
Particulates
http://en.wikipedia.org/wiki/Particulates
Soot/Black Carbon
http://en.wikipedia.org/wiki/Soot
http://en.wikipedia.org/wiki/Black_carbon
Algae (Ocean Surface)
10. Biology
http://en.wikipedia.org/wiki/Biology
“Phototrophs
http://en.wikipedia.org/wiki/Photoautotroph
are the organisms (usually plants) that carry out photosynthesis;
http://en.wikipedia.org/wiki/Photosynthesis
to acquire energy. They use the energy from sunlight to convert carbon dioxide and water into organic materials to be utilized in cellular functions such as biosynthesis and respiration.” “In plants, algae, and cyanobacteria, photosynthesis uses carbon dioxide and water, releasing oxygen as a waste product.”
Chemoautotrophs;
http://en.wikipedia.org/wiki/Chemotroph
are “organisms that obtain carbon through Chemosynthesis;
http://en.wikipedia.org/wiki/Chemosynthesis
are phylogenetically diverse, but groups that include conspicuous or biogeochemically-important taxa include the sulfur-oxidizing gamma and epsilon proteobacteria, the Aquificaeles, the Methanogenic archaea and the neutrophilic iron-oxidizing bacteria.”
Bacteria – TBD
Fungi – TBD
Protozoa – TBD
Chromista – TBD
Animal – Anthropogenic including:
Carbon Dioxide;
http://en.wikipedia.org/wiki/Carbon_dioxide
contributes to the Greenhouse Effect;
?
and
influences the rate of plant growth ;
http://www.sjsu.edu/faculty/watkins/CO2plants.htm
Methane
http://en.wikipedia.org/wiki/Methane
Nitrous Oxide
Ozone
Particulates, especially Black Carbon/Soot
Aerosols
Icebreakers/Arctic Shipping/Fishing/Cruise-Line Transits
Contrails
Nuclear Power Generation – Including Ships
Land Use Changes – Including De and Re-Forestation
Urban Heat Islands
Run Off From Asphalt/Urban Heat Islands
Fossil Fuel Energy Generation Waste Heat –
Renewables – Wind Farms, Solar Arrays, Dams and Ethanol
Sewage/Wastewater Treatment Discharge
etc.
Animal – Non-Anthropogenic including
Plankton
Beaver (Genus Castor)
http://en.wikipedia.org/wiki/Beaver
etc.
11. Chemical
Fossil Fuels:
Coal
Oil shale
Petrochemicals
– Petroleum
– Mineral Oil
Asphalt
Tar Pits/Sands
Methane
http://en.wikipedia.org/wiki/Methane
etc.
“Photosynthesis;
http://en.wikipedia.org/wiki/Photosynthesis
is a chemical process that converts carbon dioxide into organic compounds, especially sugars, using the energy from sunlight.”
“Chemosynthesis;
http://en.wikipedia.org/wiki/Chemosynthesis
is the biological conversion of one or more carbon molecules (usually carbon dioxide or methane) and nutrients into organic matter using the oxidation of inorganic molecules (e.g. hydrogen gas, hydrogen sulfide) or methane as a source of energy, rather than sunlight, as in photosynthesis.”
Reactions:
Combustion
– Forest Fires
– Fossil Fuels
– – Methane
http://en.wikipedia.org/wiki/Methane
etc.
Conversion of Methane, CO2, etc.
12. Physics – Other
Temperature
http://en.wikipedia.org/wiki/Temperature
Pressure
http://en.wikipedia.org/wiki/Pressure
States of Matter
http://en.wikipedia.org/wiki/State_of_matter
Heat Conduction
http://en.wikipedia.org/wiki/Heat_conduction
Convection
http://en.wikipedia.org/wiki/Convection
Thermal Radiation
http://en.wikipedia.org/wiki/Thermal_radiation
Thermodynamics
http://en.wikipedia.org/wiki/Laws_of_thermodynamics
-Entropy
http://en.wikipedia.org/wiki/Entropy
General summaries of the potential variables involved in Earth’s climate system;
http://www.physicalgeography.net/fundamentals/7y.html
http://oceanservice.noaa.gov/education/pd/climate/factsheets/whatfactors.pdf
Great work. I agree, climate science is in it’s infancy.
Oh come on! It’s CO2 and you know it!
Holy….!! This post will go down in history as the post that killed the AGW debate once in for all.
Did I miss where non-anthropogenic biological feedback is factored in? Those pesky bacteria.
Quantify those factors exactly and all interrelationships, type up a quick model and run it. With all the chaos in the system it probably wouldn’t be worth squat.
Can you have it done by next week?
TL, DR.
Sorry.
To be honest I think your over simplifying things a bit.
Thomas S says @ June 30, 2011 at 3:17 pm “Holy….!! This post will go down in history as the post that killed the AGW debate once in for all.’
That seems to be a silly thing to say.- there is a vast amount of science being done in each area and the basic physics and chemistry are know.
It is like saying because the human body is complex no one should pursue an understanding of disease.
You forgot a significant variable: Biological. Everything that isn’t human on land, air and sea.
I think it is incorrect to call earth’s climate system ridiculous. It is our current understanding of it’s dynamics that is ridiculous… except I don’t hear much laughter regarding such. We are struggling, in a low resolution, stage of understanding, is all. Things will become clearer, as soon as proper scientific focus and methods are restored. Maybe soon. GK
Just Great – a perfect reference guild to the climate!
Wow, just Wow. In ’95 I had collected lots of data about fishing in central Oh., 23 factors in all. Everything from the phase of the moon to surface temps to ph. to baro pressure, on and on. Unable to calculate a formula for catching fish I contacted a prof. of engineering friend who then referred me to a mathmatics prof., She was exstatic about so much data. Two weeks later I was told simply “It’s not humanly possible to calculate this many variables, not even deep blue can do this.” Shame, lots of money in bass fishing here. I believed her though. Looking at your list bogles my simple mind, climate models, I think not. But there is lots of money in this, as such I believe those here and elsewhere who claim this is about redistribution of wealth. Wuwt has turned this skeptic into a full blown denier and I thank you all for standing up for truth.
Derek Sorensen says: June 30, 2011 at 3:27 pm
TL, DR.
Sorry.
I am very sorry, I’ve put in a request to the powers that be to have Earth’s climate system simplified and the number of variables reduced, in order to shorten the length of this post…
For those of you who don’t know “TL, DR.” is an abbreviation for “Too long; didn’t read”
http://en.wikipedia.org/wiki/Wikipedia:Too_long;_didn%27t_read
Scott Covert says: June 30, 2011 at 3:25 pm
Quantify those factors exactly and all interrelationships, type up a quick model and run it. With all the chaos in the system it probably wouldn’t be worth squat.
Can you have it done by next week?
Maybe, it is a long weekend… 🙂
The point is, you need to keep it short. Attention spans these days are vanishingly small – if that wasn’t the case we wouldn’t be in the fix we are today. Although I must say that even in the era I grew up in (60’s/70’s), your post would still have been TLDR.
The message that it is complicated doesn’t have to be communicated by demonstration; there are better ways to get that message across.
IMHO, YMMV, etc.
Excellent article. I also spotted a phenomena I was completely unfamiliar with: Namely in the North Poles region Ice Map it appears when melting in that region first begin most every-time it’s in the region between Ellesmere Island (Canada) and just slightly North of Thule, Greenland. Perhaps someone could help me understand why that particular region first, what are the ocean currents in that Strait, Strait water temperature at various depths, or peculiar weather patterns that cause such an effect. That particular melts appear before surrounding ice even begins to melt – never would have noticed but for this exercise. That’s weird. I’ve always seen ice melt at the edges first then moved backward. That particular area is not a normal ice melt – it should not melt in the middle first.
And I suppose next you’re going to tell us that’s just the easy part? The real gap in our knowledge is the unknowns that we don’t know we don’t know about!
Many things are complex, like the human body, however, we understand the human body enough to PREDICT what will happen if, say, an organ is removed.
The climate is NOT like that at all. We can’t predict SQUAT one year, let alone 10, 20, 50 years…
Really informative.
However, isn’t sulfur, sulfur dioxide and sulfuric acid, more “important” parts of the atmosphere, alongside soot, than perhaps argon? Not to say argon might not have a major impact on earth’s atmosphere, no studies seem to exist, but pretty much everything sulfur has been studied as far as everyone seem to know.
If pointing out details . . . :p
Also, isn’t there really no study that has been done on how Earth behaves when the good old Sol quiets down and withdraws its influence into itself? I find that very weird considering what we already know about gravitational forces and all.
which my influence the hypothesized Oort cloud;
http://en.wikipedia.org/wiki/Oort_Cloud
‘which may influence the hypothesized Oort cloud;
Dermot O’Logical says:
“Did I miss where non-anthropogenic biological feedback is factored in? Those pesky bacteria.”
Yes and all that endothermic photosynthesis (CO2 causing global cooling).
Oh and what about the solar cycle spectoral variations in the rate the UV breaks down Methane (Siliggy camels arse effect)?
Bystander says: June 30, 2011 at 3:40 pm
Thomas S says @ June 30, 2011 at 3:17 pm “Holy….!! This post will go down in history as the post that killed the AGW debate once in for all.’
That seems to be a silly thing to say.- there is a vast amount of science being done in each area and the basic physics and chemistry are know.
It is like saying because the human body is complex no one should pursue an understanding of disease.
—–
By no means am I suggesting we stop research, just saying that by seeing all these complexities in one place with links to research on each one of them. I am hoping that these AGW fanatics who will not accept any other explanation other than CO2 is the only driver should have there eyes opened by this post.
Yeah it was a bit tongue in cheek for me to say “end debate once in for all”. Its just most people pointing to CO2 as the reason for all these weather events, probably have not considered even a SINGLE driver listed in this post as a possible alternative.
heh. maybe people with vanishingly small attention spans are not the target market?
very cogent and acute, justthefactswuwt.
somebody already mentioned biology – the white cliffs of dover, carrera marble, oxygen, coal, forest fires (it’s live stuff that burns), methane, ocean surface albedo from algae –
makes one wonder… bravo for a winner.
“Solar Ultraviolet (UV) radiation; appears to vary by approximately 10% during the solar cycle; and has been hypothesized to influence Earth’s climate; however Lief argues that, This is well-trodden ground. Nothing new to add, just the same old, tired arguments. Perhaps a note on EUV: as you can see here (pdf, slide 13) the energy in the EUV band [and other UV bands] is very tiny; many orders of magnitude less than what shines down on our heads each day. So a larger solar cycle variation of EUV does not make any significant difference in the energy budget. Leif Svalgaard says: April 5, 2011 at 7:54 pm”
Unless, perhaps, the ultraviolet radiation is ionizing and produces a significant flux of electrons and cation radicals in the upper atmosphere. Cation radicals, as we all know from cloud chamber effects, can produce condensation nuclei and induce clouds. Slides 2 and 3 in the link show that both cation radicals and the freed electron can produce independent cascades of droplet nucleation. Nature is full of cascades produced by small initial perturbations.
Dermot O’Logical says: June 30, 2011 at 3:25 pm
Did I miss where non-anthropogenic biological feedback is factored in? Those pesky bacteria.
Curiousgeorge says: June 30, 2011 at 3:45 pm
You forgot a significant variable: Biological. Everything that isn’t human on land, air and sea.
You are both correct. I am going to change this thing on the fly, thus I’ve changed the “Anthropogenic” header to “Biology”, added Plant, Bacteria, Fungi, Protozoa, Chromista and Animal under it and made Anthropogenic a sub-bullet of Biology – Animal.
Thank you for your help. Additional input on this section, especially links to sources indicating biological impacts on climate, are most welcome.
When they left, the fishes said ‘Thanks for all the plankton’.
========
I followed it with interest and I have no climate research training. I find the sheer number of variables exciting and truly astounding. Our system is amazing. However, is it me, or did it look like magnetic effects and atmospheric tide were duplicated in the list?
And, I’ve found it difficult to create a long list of variables without it being a long list of variables.
justthefactswuwt says:
June 30, 2011 at 4:27 pm
Quote: Thank you for your help. Additional input on this section, especially links to sources indicating biological impacts on climate, are most welcome.
————————-
Would exploding whale parts feeding the aerobic bacteria in the ocean and sand do anything?
Dunno about just a page, you’re in serious danger of gathering enough data here for a whole new website – well done, one heck of a project. Good luck with it.
I’d like to add mention that many, if not most or all, of the oscillations mentioned in “Gravitation” are probably also synchronised by resonance effects of the whole terrestrial system (honourable mention here of the ‘Stadium wave’ which suggests how the energy may transfer between the different oscillations). I also suspect related resonsnce influences in both solar system and solar data – after all, the whole system has had plenty of time to fall into ‘sync’, and we know that weather is broadly cyclical.
Oh. And you may need, under “Anthropogenic”: “Political interference with any or all of the above”. It’ll be one heck of a parameter to calculate, but boy, if someone could work out a formula allowing that to be allowed for …
While providing a useful and interesting compendium of links, I don’t see the point of this piece in terms of making an argument either way on AGW. There are a lot of phenomena. There is a substantial scientific community addressing those phenomena. What of it?
Either human effects are large enough to worry about, or they aren’t. Regardless of how well understood the system is, there will be a best-informed view of that question, and that question will be important.
You take the needle, bury it in the haystack, and then question whether there is a needle at all. If this defense works nobody will ever be able to make a case for anything.
But could it all just boil down to the net size, intensity and positioning of the surface air pressure distribution?
Variations in that distribution acting via the location of the various climate zones and the weather within them seem to be well capable of stabilising everything thrown at the climate system over a period of more than 4 billion years so as to avoid the loss of our liquid oceans.
That’s going to be a very valuable page. It’s nice to see all of the known factors impacting climate in one place. Unfortuantely, I suspect that we are still in the “unknown unknowns” stage of climate investigations, but we are, at least the list of “known unknowns” is increasing.
This post reminds me of this excerpt from a 1997 Science article:
Green forecasting still cloudy
Science; May 16, 1997
““In the climate system, there are 14 orders of magnitude of scale, from the planetary scale–which is 40 million meters–down to the scale of one of the little aerosol particles on which wetter vapor can change phase to a liquid [cloud-particle]–which is a fraction of a millionths of a millimeter.”
Of these 14 orders of magnitude, notes Schlesinger, researchers are able to include in their models only the two largest, the planetary scale and the scale of weather disturbances
Bob in Castlemaine says: June 30, 2011 at 4:12 pm
And I suppose next you’re going to tell us that’s just the easy part? The real gap in our knowledge is the unknowns that we don’t know we don’t know about!
There are layers to it. There are variables “we” know about, but that I don’t know about, then there are variables “we” don’t know about, then there is the interaction and inter-dependencies of all of these variables that we know about, then there is the interaction and inter-dependencies of all of these variables that we don’t know about, then there is the fact that many of these variables, interactions and inter-dependencies are continually evolving, e.g. the Ocean Circulation today was different that is was on any day in Earth’s history and then there are other climatic factors involved that haven’t been considered yet. We are at the beginning of a very long road that will take many generations to travel…
Great start! Presentation is key though as most true believers have hardly any attention span, especially with content that may give rise to cognitive dissonance.
justthefactswuwt says:June 30, 2011 at 5:03 pm
We are at the beginning of a very long road that will take many generations to travel…
————————————————-
But that doesn’t mean we don’t know anything.
I could prepare a similar – longer – list of topics on the functioning of the human body but you’d still go to the Dr if you were sick. This reads like a bit of a stunt, sorry to say.
Admittedly climate is ridiculously complicated, but individual pieces are readily understood. The AGW crowd of course cannot make the predictions that they claim using the primitive, specifically and artificially limited models that they use.
But, the assumptions and specific claims that they make are usually based on little pieces of the climate system and these can be refuted quite nicely. And the claims they make about what is happening in the real world are usually wrong and can also be easily refuted.
Thus, even though we cannot prove their predictions are wrong, except by pointing to the real world and their past predictions, we can show that their assumptions are faulty and their reports of the real world are fraud. The public does not like to hear that we do not know for sure what is going to happen and tend to favor those who claim to know the future, even though they are wrong.
But, we can and should break the AGW assumptions. They claim all natural cycles and factors have been overwhelmed by CO2, making study of the past irrelevant, when, in fact, study of climate history and all of the ways we can determine and explain climatic changes in the past, recognizing in the process the natural factors at work, is the best way to make sentient predictions.
The current predictions of the next solar cycles and the Sun’s activities are good examples of using the past and our science to understand the potentials of the future. That’s our real strength.
Derek Sorensen says: June 30, 2011 at 4:05 pm
The point is, you need to keep it short. Attention spans these days are vanishingly small – if that wasn’t the case we wouldn’t be in the fix we are today. Although I must say that even in the era I grew up in (60′s/70′s), your post would still have been TLDR.
The message that it is complicated doesn’t have to be communicated by demonstration; there are better ways to get that message across.
IMHO, YMMV, etc.
I think you are underestimating the intelligence and diligence of WUWT’s readership.
How about worrying about all of the factors that will become ineffective and irrelevant before we ever detect them?
How about the physical and chemical attributes of the atmospheric components and how they effect air movement etc?
This is great “justthefacts”, what a round up – Thanks you, I am but a layperson in this so it’s lots of very interesting reading. Anthony may have to make your post another tab on the reference page.
My only concern is with the wiki links – as they still reference AGW in these articles…like this one:
http://en.wikipedia.org/wiki/Milankovitch_cycles
Two caveats are necessary: that anthropogenic effects may modify or even overwhelm orbital effects and that the mechanism by which orbital forcing influences climate is not well understood.
And yes, I know to take ‘their AGW claim’ part with a grain of salt the size of Montreal – but it makes me doubt them and wonder if they were as cavalier about other details that didn’t suite their political views.
To me, it looks though you could go down this road a while, there is a great deal to examine. It also seems as though the end result would probably be an understanding of what we don’t yet know. That is, of course, the proper place to start, as opposed to dragging out one suspect and hanging him in front of the entire town without a proper trial, then declaring that the case is solved!
1DandyTroll says: June 30, 2011 at 4:15 pm
However, isn’t sulfur, sulfur dioxide and sulfuric acid, more “important” parts of the atmosphere, alongside soot, than perhaps argon?
Yep, I added them to the list. Argon is on there because I included a standard list of atmospheric composition percentages;
http://www.physicalgeography.net/fundamentals/7a.html
as a place holder until I can do more research. Thx
vigilantfish says: June 30, 2011 at 4:18 pm
which my influence the hypothesized Oort cloud;
http://en.wikipedia.org/wiki/Oort_Cloud
‘which may influence the hypothesized Oort cloud;
Corrected, Thx.
So which one (or set) of those variables caused the Little Ice Age (end of MWP to 1900)?
The volcanoes are too short-lived. The TSI is too invariable. The UV lacks the energy %. The Milankovitch cycles are too short. In fact, we don’t have anything concrete as of yet.
Re TL, DR… Nope, I read it all, found it just the right length. Excellent work, and thank you for posting this.
My two cents: the measured temperatures on land drop dramatically when a mass of still air, with low humidity, forms and remains in place for many hours. This is especially true when this occurs overnight. We see temperatures drop into the low 30s and high 20s (in degrees F) even during non-winter periods. This might be already included in the above list, I didn’t see it.
Also, impacts of jet aircraft exhaust at high altitudes, perhaps this is covered under Anthropogenic effects.
Also, the impact of removing heat from thermal and nuclear power plants, as a good portion of the rejected heat is used to evaporate water, either in a cooling tower, or an evaporative pond. Another great portion of that rejected heat is released to once-through cooling of a lake, or the ocean, or another body of water.
Land use changes is on the list, and I’d like to point out that Man has planted literally millions of forms of trees, shrubs, and grass-type plants just in Southern California alone. What was once a dry desert is now green from planting and watering. The CO2 uptake may be negligible and not subject to measurement, but surely it has some impact.
I would have pointed out that the Milankovitch cycles never exactly repeat, as the moon is slowly moving away from the earth.
Siliggy says: June 30, 2011 at 4:19 pm
Yes and all that endothermic photosynthesis (CO2 causing global cooling).
Oh and what about the solar cycle spectoral variations in the rate the UV breaks down Methane (Siliggy camels arse effect)?
Both added, Thx.
I didn’t notice a category for the effects on earths climate from passing comets, meteor Impacts and rare asteroid impact events, Meteors and interplanetary dust particles and the gases from these particles add about [Add an estimate here] tons of mass to Earth and earths atmosphere each year, it could be as significant or not as man made co2 but it is another factor.
Please pardon a probably really dumb question, but this is something that has been bugging me for a while. The ENSO Sea Surface Temperature graphic here .
http://www.osdpd.noaa.gov/data/sst/anomaly/anomnight.current.gif
So then is it Vorticity that makes the SST leave the wake pattern that it does in the oceans? The speed of rotation at the poles versus the speed of rotation at the equator and the speed of rotation at deeper depths versus the speed of rotation at the surface, along with the ocean currents, that causes changes in various water temperatures.
The same phenomenom may also affect air masses as Stephen Wilde discusses.
Well how about the role of submarines, surface boats and ships, and surfers on the mixing/interruption of oceanic currents? Didn’t think of that one didja? 🙂
On the serious side how about the possible affect(s) of large scale wind farms on the atmosphere. For your consideration:
http://www.savewesternny.org/environment.html
and
http://people.ucalgary.ca/~keith/WindAndClimateNote.html
Outstanding post! I look forward to seeing the other half regarding biological influences on atmosphere and climate, including biological changes in the use of land, ocean and atmosphere. Taking into account accuracy of observation and recording would be useful as well.
I would also recommend a more balanced approach to the section regarding Solar EUV/UV observations, which truly are in their infancy. Although there have been several speculative theories, no one has had time to measure and analyze what happens when we change from (TSI = solar constant) to [(TSI – 0.1%) – (10% EUV/UV)]. Although I’ve heard it said that our atmosphere is “opaque” or “nearly” opaque to EUV/UV, I wonder whether there isn’t enough that gets through the atmosphere to excite oxygen and water enough that its absence would be perceptibly missed.
And, given that the prolonged lack of significant solar wind has seemingly caused the collapse of the outer atmosphere, I would think more observation should be devoted to whether that causes changes in other parts of the atmosphere coupled with the climate.
But those are just my personal interests.
Keep up the wonderful work!
This is the article I have been waiting for!
A while ago I wanted to gather together all the parameters that would need to go into THE MODEL we would need to predict climate. I soon realised that I did not have anywhere near the knowledge and from this list I can see that I was not even close. (I came up with only about a dozen factors)
The list above is an excellent start and can only grow.
What might also be interesting would be to produce a matrix indicating how each factor affects any of the other factors.
When that is done then maybe Al Gore or the Hockey Team will be kind enough to show us how they have solved it all.
I mean they have solved it haven’t they?…
I knew all of this insane and insurmountable complexity in 1984 (I was a geology major) when I tried (unsuccessfully) to convince my college roommate that humans could NOT control the world’s weather in in WAY, SHAPE OR FORM… His ignorance of the true complexity was resolute and I soon gave up. Twenty seven years later, his ignorance is now represented in every government n the world… Ugh.
“I didn’t notice a category for the effects on earths climate from passing comets, meteor Impacts and rare asteroid impact events, Meteors and interplanetary dust particles and the gases from these particles add about [Add an estimate here] tons of mass to Earth and earths atmosphere each year, it could be as significant or not as man made co2 but it is another factor.”
Sorry!! that category is there, I found it the third time I looked. It’s 1:58 am here and I’m half asleep. 🙂
good job!!
Derek Sorensen says:
June 30, 2011 at 3:27 pm
“TL, DR.
Sorry.”
Oh good heavens. I’m currently reading both “1776” by McCullough, and “Battle Cry of Freedom” by McPherson. And I can find time to read through such a great post. Cowboy up.
Derek Sorensen says:
June 30, 2011 at 4:05 pm
This will be a reference page, don’t think of it as a regular post. I think a model of not too many reference pages, but each being substantial is good. That limits the amount of clicking on page to find the right one, and searches within a page have a decent chance of reaching the goal.
Justthefacts – I noticed a Lief (should be Leif) somewhere above that you’ll want to fix.
You could also use this as a primer or extended table of contents to the reference pages. You could include hyperlinks to the WUWT reference pages since it’s a long weekend…
Rather than insert another comment into the system, If Mike Tobis reads down this far: At WUWT, not every single post is about Global Warming, climate science or flinging poo over the fence(s). If you want to debate the physics and math head over to Judy’s or Lucia’s. If you want to debate the the warming/not-warming I’m sure another post on that topic will appear here in a day or less.
/rant Sorry, I’m just tired of commentators demanding what websites and posters should do to satisfy their view of what the site is.
Wil says:
There are places where the water never melts, they are called polynya.
http://en.wikipedia.org/wiki/Polynya
kim says: June 30, 2011 at 4:33 pm
When they left, the fishes said ‘Thanks for all the plankton’.
Added, thx 🙂
Ric Werme says: June 30, 2011 at 6:18 pm
This will be a reference page, don’t think of it as a regular post. I think a model of not too many reference pages, but each being substantial is good. That limits the amount of clicking on page to find the right one, and searches within a page have a decent chance of reaching the goal.
Very correct and very nice to meet you over lunch today.
Justthefacts – I noticed a Lief (should be Leif) somewhere above that you’ll want to fix.
Fixed, thank you.
Just The Facts says:
The climate is the very definition of a chaotic system. I heard an interview with Lorenz (discoverer of chaos theory). He had run a climate model and there was a problem before the run could be completed. He needed the results and didn’t have enough time to run the model again. He decided to run the model with fewer significant digits. That would speed up the process with, he thought, a loss of accuracy. The results were, however, completely different. This led to: “Does the flap of a butterfly’s wings in Brazil set off a tornado in Texas? ” http://en.wikipedia.org/wiki/Butterfly_effect
Perhaps your list could have something on chaos theory added. http://www.schuelers.com/ChaosPsyche/part_1_3.htm
http://en.wikipedia.org/wiki/Chaos_theory
captainfish says: June 30, 2011 at 4:33 pm
However, is it me, or did it look like magnetic effects and atmospheric tide were duplicated in the list?
Some of them show up in multiple locations, because they have a number of causes or we’re not sure of the cause, e.g. “Atmospheric tides can be excited by:
The regular day/night cycle in the insolation of the atmosphere [Rotational Energy and Solar Energy]
The gravitational field pull of the Moon [Gravity]
Non-linear interactions between tides and planetary waves. [Gravity, Rotational Energy & Solar Energy]
Large-scale latent heat release due to deep convection in the tropics. [Solar Energy, Rotational Energy?]
http://en.wikipedia.org/wiki/Atmospheric_tide
Already a great resource and looking forward to further ammedments.
Doesn’t matter. If we ruin the Western economies we will limit the temperature rise to 2C.
/sarc
captainfish says: June 30, 2011 at 4:38 pm
Would exploding whale parts feeding the aerobic bacteria in the ocean and sand do anything?
As the video you posted seems to offer a very amusing proxy for human stupidity, my answer is maybe. 🙂
Bystander says: June 30, 2011 at 5:06 pm
But that doesn’t mean we don’t know anything.
Obviously, did you try reading some of the links? There is a quite impressive collection of human knowledge in there.
I could prepare a similar – longer – list of topics on the functioning of the human body but you’d still go to the Dr if you were sick. This reads like a bit of a stunt, sorry to say.
Based on your tone, I’ve prepared a list that will likely appeal to you.
Revised List of Earth’s Climate System Variables:
CO2
Let us know if there’s anything else you’d like to add…
mkelly says: June 30, 2011 at 5:10 pm
How about the physical and chemical attributes of the atmospheric components and how they effect air movement etc?
I need more specificity to add them to the list, can you provide links to examples of the attributes and/or resultant effects?
ldd says: June 30, 2011 at 5:18 pm
My only concern is with the wiki links – as they still reference AGW in these articles…like this one:
http://en.wikipedia.org/wiki/Milankovitch_cycles
Two caveats are necessary: that anthropogenic effects may modify or even overwhelm orbital effects and that the mechanism by which orbital forcing influences climate is not well understood.
I’ve also struggled with the use of Wiki and eschewed them for a couple years, but there have been some improvements, they are the most comprehensive source and I’ve decided that the best way to fix the issues with Wiki is to shine the light of scrutiny on them, just as you have done.
Can you search for the word ´varies?´ Should be VARY. oops-.-. here it is
¨…appears to varies/VARY by approximately 10% during the solar cycle;
http://www.nasa.gov/topics/solarsystem/features/solarcycle-sorce.html¨
The following entry also has a grammar/typo error. May be the word ´grand.´
This contribution is priceless. Last year, I spent several weeks on Donna´s IPCC audit. What about crowd-sourcing?
AND, what about our friendly Castor X neighbors: for decades, they enjoyed the distinction of Greatest Changers of the Earth´s surface!
Bystander says:
June 30, 2011 at 3:40 pm
“That seems to be a silly thing to say.- there is a vast amount of science being done in each area and the basic physics and chemistry are know.It is like saying because the human body is complex no one should pursue an understanding of disease.”
Cool!!! So, now you are going to show us the physical hypotheses that enable explanation and prediction of forcings and that go beyond Arrhenius’ work to reveal that dangerous warming from CO2 is coming down the pike? Huh? Huh? Are you going to do it?
This is wonderful work. Thanks so much.
I need about a week or two to study all of this, Justthefacts, but your logic is impeccable.
Thanks for this and I plan to print everything out and put it in a notebook to study.
Chris
Norfolk, VA, USA
rbateman says: June 30, 2011 at 5:22 pm
So which one (or set) of those variables caused the Little Ice Age (end of MWP to 1900)?
The volcanoes are too short-lived. The TSI is too invariable. The UV lacks the energy %. The Milankovitch cycles are too short. In fact, we don’t have anything concrete as of yet.
My best guess is the combination of volcanoes cooling Earth down, coupled with the slight decrease in TSI and some secondary solar influence on clouds, e.g. cosmic rays or otherwise, limiting the rebound in Earth’s temperature between volcanoes, but this is nothing more than a guess.
Roger Sowell says: June 30, 2011 at 5:24 pm
My two cents: the measured temperatures on land drop dramatically when a mass of still air, with low humidity, forms and remains in place for many hours. This is especially true when this occurs overnight. We see temperatures drop into the low 30s and high 20s (in degrees F) even during non-winter periods. This might be already included in the above list, I didn’t see it.
I am not familiar with this effect, is this an Inversion?:
http://en.wikipedia.org/wiki/Inversion_%28meteorology%29
Also, impacts of jet aircraft exhaust at high altitudes, perhaps this is covered under Anthropogenic effects.
I added contrails added under Anthropogenic.
Also, the impact of removing heat from thermal and nuclear power plants, as a good portion of the rejected heat is used to evaporate water, either in a cooling tower, or an evaporative pond. Another great portion of that rejected heat is released to once-through cooling of a lake, or the ocean, or another body of water.
Added under Anthropogenic as Nuclear Power Generation, also to include nuclear ships, especially Ice Breakers. This also makes me wonder about and add other sources of waste heat such fossil fuel energy generation, sewage/wastewater treatment discharge, run off from Asphalt/urban heat islands, etc. all added to the Anthropogenic list.
Land use changes is on the list, and I’d like to point out that Man has planted literally millions of forms of trees, shrubs, and grass-type plants just in Southern California alone. What was once a dry desert is now green from planting and watering. The CO2 uptake may be negligible and not subject to measurement, but surely it has some impact.
Yes, I’ve added “Including De and Re-Forestation” to Land Use Changes to remind me of the scope when I build Land Use out further. The non-CO2 Anthropogenic variablesare quite impressive in isolation.
Thank you for all of your input.
Nice summary, just one suggestion for additional info regarding the non-linear properties of the materials involved in the climate system;
http://profmaster.blogspot.com/2009/01/thermal-conductivity-of-air-vs.html (sorry I’m not able to post this as a link so you will need to copy and paste)
Where we find this (empirically derived) model for the thermal conductivity of air;
k = 1.5207 x 10^(-11) x T^3 – 4.8574 x 10^(-8) x T^2 + 1.0184 x 10^(-4) x T – 0.00039333
Where k is in W/m/K
and T is in K
The range of use is T = 100 to 1600 K
Does anybody think that non-linear thermal properties of the materials in the climatic system MIGHT make it just a TINY LITTLE BIT COMPLEX ? Oh, and they vary with pressure as well.
So there are probably a few hundred to a thousand inputs to any “computer model” of the climate, think if one or two are off by a tad the outcome might disagree with the empirical evidence ?
In aerospace engineering FEM (Finite Element Modeling) has been used to predict the strength of airframes (airplane bodies and wings) with great success. The number of inputs;
1 – the stress/strain response of the materials (mostly aluminum and carbon composites)
2 – the force applied
3 – the number of “mesh” points, this is the number of discrete points on the computer model where the calculations are performed (usually hundreds of thousands or millions)
A Factor of Safety (FOS = predicted strength/required strength) of 1.5 to 2.0 is used for things live people will ride in.
That means that the computer models we rely on for everyday engineering feats are ASSUMED TO BE WRONG BY 50 to 100%.
In the engineering field we have a saying; “If your hardware does not perform as your model predicted, you must improve your MODEL!!!”
And the climate models can tell us the temperature in 2100 within a few tenth’s of a degree, sure they can……
Cheers, Kevin
The whole point is to counter AGW as sound bite: “It’s the CO2.” “No, it’s far more complicated, and we don’t know as yet the proper weighting of the many factors which produce climate — check this out.”
Very useful list, clearly demonstrating the unbelievable arrogance and ignorance of IPCC.
Just two comments:
1) I didn’t notice mentioned a crucial “CO2 increase = vegetation growth” feedback mechanism (increase of CO2 absorption by the plants due to the increase of plants’ growth due to the increase of CO2 content in the atmosphere), which negates any alleged increase of temperature due to the increase of CO2. May be it was included in some already listed category, I don’t know.
2) Special references to Dr. Svalgaard’s opinions are unnecessary; they don’t deserve any special consideration or exposure.
This is a good post in that it records a lot of influences which have, without doubt, complicated cross-influences that altogether bring about the final result. It is, however, more of an argument for a warmist, specialist or elitist superiority in understanding or opinion, similar to one some of our post-war parents might have said to us as teenagers: what do you know? they (the government, the scientists, adults) know more than you do.
It is a fallacy that very complicated systems require very long study and detailed investigation to understand their probable output. As a discussion in Science News magazine (June 4/2011, Simple Heresy pp 26 – 29), simple rules of thumb can often be better predictors of outcome than complex mathematical models – a lesson the AAAS might well apply to the IPCC and their climate models (but which they, in their thrall of the IPCC/Mann, don’t apply).
In a previous WWUT post someone (I apologize in not knowing who) pointed out that the IPCC climate models, is considered as a “black box” in which much data goes in one side and a result comes out the other, can be back-engineered or back-modelled into several very, very simple mathematical relationships that connect global temperatures to CO2 levels. Not that we agree with this, but the point is well made: in even very complex models or proceses, only a few factors may be critical. Some, if not most, of climatic systems on the Earth appear to be either buffered by other systems or cancel each other out to the largest extent. This is not an unusual situation at all: think of your car’s engine running. Out of all the possible things that can go wrong and stop you in the middle of zombie-country at midnight, if you attend to the air, spark and fuel, you’ve probably attended to what is the problem. A split manifold or short-circuited motherboard may be the problem, as meteorite impacts or Washington-State level volcanic eruptions may be the reason the world went cold/warm, but those three things probably are what you should pay attention to.
The Earth’s climate is fundamentally the result of energy coming to the planet, energy reflected away from the planet, energy reaching theatmosphere/surface, and the in-place systems of moving the energy around the planet. These are the biggies. To believe that the small amount of CO2 in the atmosphere is a fundamental component is to believe that the system is inherently unstable. Our geological history shows that the system, though with episodes of high warmth and high cooling, is not inherently unstable. Things change, and stay changed for a long time. The rapid movement from glacial to interglacial states and back again do not display unstable tipping points but stable shifts. It is not the minutest of parameters that change and induce a major shift; it if were there would be many, many shifts and the movement from one to another would show the back-and-forth nature of a controlling parameter not-yet stable in its new configuration.
So, to come back to the point of this post, that the climate of Earth has many factors of which we are truly ignorant in their details and there interconnections, there is complete truth in this point. Those – like Mann, Trenberth, Gore, Suzuki, who claim to Know how things work on the planet, and how things will turn out, are, in fact, in egomanical self-idolatrous delusion, or simply using their doctorates and jargon to bafflegab and awe the rest of us. But as to the necessity of knowing a great deal about each factor and its influence on the others before a reasonable conclusion can be made, I suggest that the post is somewhat off.
The science blogs such as WUWT depend on the acceptance of what has been in legal circles called the Reasonable Man Hypothesis. The RMH suggests that, with a reasonable amount of knowledge, analytical ability and life-world experience, a non-expert can get the sense of what is going on and make a sound judgement of what action should be pursued on that basis. The gentleman-scholar of the 19th century understood this particularly well, for our benefit, for that is what the Darwins of the age were about: looking, thinking and judging carefully with the brain and thinking ability that God, they would have said, gave them. It is what we all do when we look at the GISTemp graph and wonder why it has such time and location sensitive warming biasis in it, and why the sea-level data took a sudden spike at the onset of satellite (TOPEX) observation, and then leveled off relative to the pre-satellite (pre-2002) times. We don’t know how satellites work, exactly, but we can see things that look suspiciously like data manipulations we have seen previously, understand the concept of perfectly, and wish answers for outside of what wavelength was being used at what specific height about the sea.
Complexity does not devolve into simplicity, but simplicity evolves, it appears, from complexity in the real-world. Chaos theory is great in theory but butterflies flapping in China do not actually cause hurricanes off of east Africa. The world survives because stability, rather than instability, dominates in the universe (catastrophic events notwithstanding). We have evolved, and the planet – including the crust – has become what it is because systems tend towards continuity, not disconuity. Perhaps Einstein would say his comment that “God does not play dice” applies to the way the climate system functions as well as how quantum physics governs the cosmos, despite how it works on an individual basis.
Ignorance of detail can be a killer, if, for example, you don’t know how long the fuse is you just lit. Knowledge of detail can also be a killer if, for example, you are busy calculating the length of fuse and speed of fuse-burning without considering that the fuse is coiled and will go straight to the explosive once lit. The climate argument of the IPCC is that detail is king, and only they, the experts, have a handle on all those fine points. The climate argument of the skeptics, on the other hand, is that few components count, and that you can determine within reasonable limits the power of those components from basic principles IN CONJUNTION WITH the understanding that the climate, as the world and universe, tends towards stability, not instability.
Whatever the outcome of this CAGW debate (I’d say foolishness, but that shows my position), a huge number of people are becoming accustomed to thinking for themselves. And educating themselves to the extent that they need. We all know the adage about not needing to be a weatherman to know the way the wind is blowing. The climate debate is teaching an entire thinking world that they can, with some effort, determine the reasonableness of what is going on without having to own a closetful of white coats.
All of this thinking and discussing and disagreeing is a very good thing. The power structures do not now like it. It messes us the AlGore sainthood processes, if not their bank accounts. Complex affairs are amenable to review by the non-illuminati. The illuminati are right in that the subject is worthy of many volumes of research, but the rest of us are right in that the pudding is tested in its abstract rather than its body.
“however Leif argues that,
This is well-trodden ground. Nothing new to add, just the same old, tired arguments. Perhaps a note on EUV: as you can see here (slide 13)
http://lasp.colorado.edu/sorce/news/2008ScienceMeeting/doc/Session1/S1_03_Kopp.pdf the energy in the EUV band [and other UV bands] is very tiny; many orders of magnitude less than what shines down on our heads each day. So a larger solar cycle variation of EUV does not make any significant difference in the energy budget.
Leif Svalgaard says: April 5, 2011 at 7:54 pm”
Thanyou I am now trying to understand slide 13 compared to this:
http://www.nasa.gov/images/content/506268main_sorce4b.jpg
and this:
http://news.discovery.com/space/mars-methane-mystery.html
Also The heat from radioactive decay does not seem to be counted in any of the radiative balance charts. is it about 0.8 W/M^2?
I have always wondered why scientists had to go to grad school! Now we know! Now it is clear why people with little training are so easily confused.
Hello Just the Facts,
Your statement in the first paragraph, “I have been studying Earth’s climate system for several years and have found it to be a ridiculously complex, continually evolving and sometimes chaotic beast,” is incorrect. The closing phrase should read, “and always chaotic beast.”
The form of the partial differential equations that need to be solved in order to understand the aerodynamics of the atmosphere ALWAYS result in chaotic behavior. Small deviations in initial conditions, choice of grid construction and time steps will result in markedly different model predictions.
This is just the beginning of the climatological mathematical problems. We have to consider atmospheric H2O distributions, phase changes and associated thermodynamic implications. There is particulate distribution tracking and its implications in providing nucleation sources for H2O condensation. There are also chemical processes at work in the atmosphere, such as methane (CH4) conversion to CO2 in the presence of O2 and sunlight. [I could continue to go on for pages, but will stop here.]
As an aerospace engineer with years of computational fluid dynamics modeling experience, I have to laugh every time I hear about another weather or climate model. Aerodynamics modeling to this day still has problems predicting measures as basic as aircraft drag. How can they believe that the movement of the atmosphere can be predicted/solved with any confidence?
Thanks for the article,
wermet
[Note for full disclosure: while I am still a practicing aerospace engineer, I have not been personally involved in computational aerodynamic modeling for about a decade. However, I am still track of the capabilities of the state of the arts in this field.]
oh come on! the science is settled…
absolutely fascinating just how complete this is…
no one makes these claims. Anyone who works in the field understands that observation systems both historical and current need improvement. If you would attend, say AGU conferences, you would see that the people working in the area are constantly asking for more measurement programs. And No one suggests that C02 is the primary driver, Mike Hulme, of CRU fame recently gave a talk about C02 contributing less than 50% of the human induced forcing, AR4 even has charts showing all the know factors. And nobody suggests the predictions ( actually projections) have a high degree of accuracy.
Strawman.
To Wermet,
Exactly correct, these folks don’t even have a clue about how much they do not know….
I would much rather calculate how many angel’s would fit on the tip of a pin than attempt to predict the temperature in one hundred years………
I have been humbled many times when what I built did not perform as my model said it should, and I was just working with electronic circuits and optics, stuff that we supposedly totally understand.
In my field the proof (aka “in the pudding”) is what the real hardware does, not what the computer says “SHOULD” happen. Funny that planes even manage to fly when I’m sure there is a computer model someplace that shows it is NOT POSSIBLE.
Cheers, Kevin
Just a fyi, I frequently go to the Smithsonian Large Holocene Eruptions page and then follow up by looking at the Find Eruptions By Date page and it is always telling. Then I try to look up what the corresponding solar cycle was doing at the time. Your imagination has to kinda take it from there because the eruption altitudes are missing. Like nowadays we are almost to 1930’s levels of eruptions and the weather is as wild as described in the early 1930’s. But the weather was wild entering the LIA as well. We could see something resembling first one then the other depending on the altitudes. Nabro continues to blow.
Watching the continuing Nabro eruption from space | Eruptions | Big Think
http://bigthink.com/ideas/39052
You could, as well, consider the computational complexity of the computer algorithm that accurately models climate change using all known and unknown inputs.
We already know that local weather prediction algorithms frequently fail 24 hours out into the future. They can fail 30 minutes out. Billions have been spent on the algorithms since the first one failed miserably. The climate modelers claim to have algorithms that accurately predict the entire global climate 1, 5, 50, and 100 years into the future.
The complexity of the algorithm that supports all of the known inputs above very likely exceeds all the computing power of all computers for all time combined, and would probably take millions of years just to move from one climate model moment to the next.
In computer science, complexity is measured using http://en.wikipedia.org/wiki/Big_O_notation.
The algorithm (at the bottom of the page) used by weather.gov is an amazing O(1):
http://www.weather.gov/om/educ/activit/coffee.htm
Lorenz was right. Meanwhile I’m like a dog in a forest -too many knowledge trees to chose from.
Even spending 4 hrs a day on this post, it’ll take me a year to chase it all down. Thanks, justthefacts, for this labour of love, which will go down as the Thinking Person’s Guide to Climatology.
In the 19th century, Victorian age scientists were as convinced as modern mainstream climate scientists that they knew all there was to know. That all they had to do was tweak a few details and all would be revealed.
In the century since that time there have been more scientific discoveries made that in all off human history to that point combined. What we have come to understand is the the unknown unknowns, the things that we do not even realize we do not know, that there is an infinity of these discoveries before us. That the more we learn, the more questions there are.
Instead, climate science has bogged down on the idea that all we need to do is stop CO2 and all problems will be solved, that earth will be transformed into a paradise. This is a result of false logic. Most of the current problems stem from poverty and CO2 does nothing to fix this. It is a make believe solution to problems 100 years in the future, as an excuse for not dealing with today’s problems today.
Fix the todays problems today and the future will take care of itself.
steven mosher says:
June 30, 2011 at 9:21 pm
C’mon, Mosh. We know it isn’t the working scientist like yourself who makes these claims. It is the know-nothing bureaucrats at IPCC, at the NGOs, and the environmentalist wackos who don’t understand what’s going on who make these claims. Why else would they be saying “the science is settled?”
No strawman.
Earth’s Climate System Is Ridiculously Complex – With Draft Link Tutorial
Derek Sorensen says:
June 30, 2011 at 4:05 pm
The point is, you need to keep it short. Attention spans these days are vanishingly small – if that wasn’t the case we wouldn’t be in the fix we are today. Although I must say that even in the era I grew up in (60?s/70?s), your post would still have been TLDR.
QED
Which of the many factors you mention causes the big changes in climate between summer and winter in the higher latitudes?
Oops, correction, Nabro is now taking a break.
African Volcanic Eruption Ceases – Irish Weather Online
http://www.irishweatheronline.com/news/earthquakesvolcanos/african-volcanic-eruption-ceases/22224.html
But the one in Chile is still producing ash clouds.
http://www.volcano.si.edu/reports/usgs/index.cfm?wvarweek=20110622#puyehue
Crops look a little better with the usda report. I’ve seen late plantings like this do alright.
Corn Plunges Most Since November, Wheat Falls as U.S. Reports Acreage Gain -Bloomberg
http://www.bloomberg.com/news/2011-06-30/wheat-plunges-to-11-month-low-corn-drops-after-u-s-reports-acreage-gains.html
steven mosher says:
“If you would attend, say AGU conferences, you would see that the people working in the area are constantly asking for more measurement programs. And No one suggests that C02 is the primary driver…”
Oy way.
If you want to be taken seriously, Steven, you need to think before posting things that make people laugh at you.
“appears to be generated in the Earth’s core by a dynamo process, associated with the circulation of liquid metal in the core, driven by internal heat sources”
or could be generated by the movement of sea water:
http://news.nationalgeographic.com/news/2009/06/090622-earths-core-dynamo.html
Justthefacts, this is wonderful work, thank you.
If you don’t mind I will send a hard copy to the UK government Chief Scientific Advisor. It’ll reduce him to tears.
My recent pet theory is that the whole idea of cooling from volcanoes may be wrong – their net effect may even be warming! What got me interested, is that the stratosphere showed a very clear stepwise cooling as an aftereffect of the stratospheric warming the El Chichon and Pinatubo eruptions: http://www.ssmi.com/data/msu/graphics/tls/plots/sc_Rss_compare_TS_channel_tls_v03_3.png
I was wondering if this was due to destruction of ozone as the atmosphere “cleaned itself” after the eruptions, but yesterday I found a paper that may offer an explanation: One longer-time effect of the volcano eruptions was increased stratospheric water vapor.
” If the frequency of volcanic activity was high enough, then a water vapor anomaly would be introduced into the lower stratosphere before the anomaly due to the previous eruption had disappeared. The result would be threefold in the long term: stratospheric cooling, stratospheric humidification, and surface warming due to the positive radiative forcing associated with the water vapor.”
See: http://journals.ametsoc.org/doi/pdf/10.1175/1520-0442(2003)016%3C3525%3AAGSOVE%3E2.0.CO%3B2#h1
So could part of the warming in the 80s and 90s actually be caused by – and only briefly counteracted by! – the El Chichon and Pinatubo eruptions? I think so (but in the meantime AGW proponents are using volcano cooling for what it’s worth and even ignore the step change and talk about a downward “trend” in stratosphere temperatures as a “proof of AGW theory).
Just wanted to throw in yet another effect that may add to the complexity 😉
Thanks Justthefacts.
This will be a good addition to the WUWT reference pages.
Regards, Ágúst
With regard to the earth´s rotation causing plate tectonics, there are additional issues such as lithospheric convection and heat loss. Heat loss is achieved by so-called hot-spot volcanoes. Hawaii is an example on earth, whereas Mons Olympus is an example on Venus. On earth, in addition, the planet loses heat via plate tectonics, via lines of volcanoes at mid ocean ridges and at subduction zones (upwelling and downwelling limbs of convection respectively).
“endothermic photosynthesis (CO2 causing global cooling).”
Plus Chemosynthesis is also an endothermic.
Sorry Mons Olympus is on Mars
“steven mosher says:
June 30, 2011 at 9:21 pm
And No one suggests that C02 is the primary driver….”
And this “no one” would be the likes of the IPCC and Govn’ts in the western world such as Germany, The UK, Australia and New Zealand? We constantly bombarded with acrticles in the media and Govn’t announcements which claim…”the science is settled. The climate is changing through human activities primarility through busining fossil fuels which emit catastrophic amounts of CO2, the main GHG.” Not sure where you are reading official announcements that state CO2 isn’t driving climate change however, the official line appears to be at odds with this part of your post.
Great read. What I find rediculous is the belief CO2 can drive climate change, as the system has evolved over ~4.5billion years and has managed, all on its lonesome, to recover from internal and external changes.
Plate Tectonics was said to be powered by Descending Slab Pull. I have never understood how doubling the drag on something would cause it to pull anything. Eureka!! If the core rotates faster than the lithosphere/mantle then this would explain plate tectonics. It would also explain why there is more movement to the west than east. Thank You.
Your list, long and comprehensive though it is may pick up a few more inputs as we learn more. It also shows how stupid the idea that it is all CO2, or even CO2 at all.
“If you don’t mind I will send a hard copy to the UK government Chief Scientific Advisor. It’ll reduce him to tears.”
Yes, tears of launghter. I read yesterday that HMG was raking in £40 billion per year in “green taxes”, and he is in charge of the “settled science” that underpins it. The Ministry of Truth will never admit that they are wrong.
Sorry for the rant – this is an excellent post and a good point of reference – please keep it up and develop it.
justthefactswuwt says:
June 30, 2011 at 5:09 pm
I think you are underestimating the intelligence and diligence of WUWT’s readership.
Ack. Look, sorry; yesterday wasn’t a good day. I hope you’ll accept my apology for what I see now was a fairly snippy first comment.
And I neglected to say how impressed I am at the amount of time and effort it muyst have taken to collate, check and categorise the many references above, and I thank you for doing so. It will no doubt prove a useful resource in the future.
Excellent post and reference page, justthefacts. Kudos.
Additional input on this section, especially links to sources indicating biological impacts on climate, are most welcome.
If the carbon cycle is important, then:
=======
Inconceivable Bugs Eat Methane on the Ocean Floor, Science, July 2001
Most of the methane that rises toward the surface of the ocean floor vanishes before it even reaches the water. On page 484 of this issue, a team of researchers provides the clinching evidence for where all that methane goes: It is devoured by vast hordes of mud-dwelling microbes that belong to a previously unknown species of archaea.
These methane-eating microbes–once thought to be impossible–now look to be profoundly important to the planet’s carbon cycle.
http://www.sciencemag.org/content/293/5529/418.summary
========
And phytoplankton account for 50 percent of photosynthesis and oxygen::
http://www.frequenseamarinephytoplankton.com/What-is-Phytoplankton.html
North Atlantic phytoplankton bloom, ocean, clouds, and transcontinental contrails – a pretty picture:
http://eoimages.gsfc.nasa.gov/ve/1193/S1999158143752.png
steven mosher says: June 30, 2011 at 9:21 pm
no one makes these claims. Anyone who works in the field understands that observation systems both historical and current need improvement. If you would attend, say AGU conferences, you would see that the people working in the area are constantly asking for more measurement programs. And No one suggests that C02 is the primary driver, Mike Hulme, of CRU fame recently gave a talk about C02 contributing less than 50% of the human induced forcing, AR4 even has charts showing all the know factors. And nobody suggests the predictions ( actually projections) have a high degree of accuracy.
Strawman.
Let me first point out that in no way did I infer that everyone who believes AWG purports that “that we understand Earth’s climate system, are able to accurately measure its behavior, eliminate all potential variables except CO2 as the primary driver of Earth’s temperature and make predictions of Earth’s temperature decades into the future, all with a high degree of confidence.” I watched Scott Denning debate Roy Spenser yesterday, Scott was reasoned in his position and didn’t purport any of the things.
With that said, I’ve seen dozens of examples of this sentiment, several posted below.
“PARIS, Feb. 2 — In a grim and powerful assessment of the future of the planet, the leading international network of climate scientists has concluded for the first time that global warming is “unequivocal” and that human activity is the main driver, “very likely” causing most of the rise in temperatures since 1950.
They said the world was in for centuries of climbing temperatures, rising seas and shifting weather patterns — unavoidable results of the buildup of heat-trapping gases in the atmosphere.”
““In our daily lives we all respond urgently to dangers that are much less likely than climate change to affect the future of our children,” said Achim Steiner, executive director of the United Nations Environment Program, which administers the panel along with the World Meteorological Organization.
“Feb. 2 will be remembered as the date when uncertainty was removed as to whether humans had anything to do with climate change on this planet,” he went on. “The evidence is on the table.”
The report is the panel’s fourth assessment since 1990 on the causes and consequences of climate change, but it is the first in which the group asserts with near certainty — more than 90 percent confidence — that carbon dioxide and other greenhouse gases from human activities have been the main causes of warming in the past half century.
In its last report, in 2001, the panel, consisting of hundreds of scientists and reviewers, said the confidence level for its projections was “likely,” or 66 to 90 percent. That level has now been raised to “very likely,” better than 90 percent. Both reports are online at http://www.ipcc.ch.”
http://www.nytimes.com/2007/02/03/science/earth/03climate.html
“The language of science, like that of the United Nations, is by nature cautious and measured. That makes the dire tone of the just-released final report from the fourth assessment of the U.N.’s Intergovernmental Panel on Climate Change (IPCC), a network of thousands of international scientists, all the more striking. Global warming is “unequivocal.” Climate change will bring “abrupt and irreversible changes.” The report, a synthesis for politicians culled from three other IPCC panels convened throughout the year, read like what it is: a final warning to humanity. “Today the world’s scientists have spoken clearly, and with one voice,” said U.N. Secretary-General Ban Ki Moon, who attended the publication of the report in Valencia, Spain. Climate change “is the defining challenge of our age.”
The work of the IPCC, which was co-awarded the Nobel Peace Prize last month with Al Gore, underscores just how momentous that challenge will be. The report predicted that at a warming trend of 3.6 degrees Farenheit — now considered almost unavoidable, due to the greenhouse gases already emitted into the atmosphere — could put up to 30% of species on the planet at risk for extinction. A warming trend of 3 degrees would puts millions of human beings at risk from flooding, wetlands would be lost and there would be a massive die-off of sea corals. Sea levels would rise by 28 to 43 cm, and most frightening of all, the report acknowledged the possibility that the melting of the Greenland ice sheet, which would release enough fresh water to swamp coastal cities, could occur over centuries, rather than millennia. “If you add to this the melting of some of the ice bodies on Earth, this gives a picture of the kinds of issues we are likely to face,” said Rajendra Pachauri, the IPCC’s chairman.
As if the potential consequences of climate change weren’t scary enough, the IPCC emphasized just how little time we have left to try to change the future. The panel reported that the world would have to reverse the rapid growth of greenhouse gases by 2015 to avert the worst consequences. The clock was running. “What we will do in the next two, three years will determine our future,” said Pachauri. “This is the defining challenge.”
http://www.time.com/time/health/article/0,8599,1685199,00.html
“The Project on Climate Science, a coalition of environmental groups, publicized the report in advance of Earth Day on April 22, a spokeswoman said. The report was released with little fanfare on April 7 and posted on the Federal Register on April 8.
The report, a draft of the Fifth U.S. Climate Action Report that will be sent to the United Nations, says bluntly: “Global warming is unequivocal and primarily human-induced … Global temperature has increased over the past 50 years. This observed increase is due primarily to human-induced emissions of heat-trapping gases.”
http://www.reuters.com/article/2010/04/20/us-climate-usa-idUSTRE63F2Q520100420
“Today, international action on climate change is urgent and essential. Indeed, there can no longer be any debate about the need to act, because the Intergovernmental Panel on Climate Change (IPCC), of which I am chairman, has established climate change as an unequivocal reality beyond scientific doubt.”
http://www.guardian.co.uk/commentisfree/cif-green/2009/jun/23/climate-change-ipcc
Let me know if you’d like any more straw to support my assertion…
“Just the Facts” I like your mission! I missed explicit mention of the link between lithosphere and atmosphere through limestone deposition. We know subduction drives volcanism, but what drives subduction rates?
Steven Mosher: I generally agree with your comments – but I’m with Wermet here. Earth’s climate is clearly driven by fluid dynamics, in the atmosphere – the oceans and within the mantle. Not only that, there is layer on layer of complexity within that dynamic system: the chemistry, the physical processes. If fluid dynamics was so great in a model, no one would need full-size wind-tunnels to make racing cars or aircraft. How is there any point worrying about the detail (radiative impacts of CO2) if you can’t get the basic transport right (and there are a lot of transport processes you need to get right if you are forecasting 50 years into the future!).
As others’ have taken issue with you already: the line that has made it through to the general populace who know little of the science is EXACTLY that CO2 is the only villain (and there’s no point debating otherwise). Now if those noble folk at AGU DON’T think that too, they are beholden to the public to make a bit more of a fuss.
I don’t doubt for one moment that most of those at AGU are sincere in their desire to understand Earth’s physical processes better. Earth is a fantastic system, and well worth studying. My objection is that study should take it’s place at the funding pot with all the other fields of science; not scamper onto the next hot topic leaving a trail of half-finished experiments and semi-finished theories and very little conclusion in it’s wake. The more complex the problem, surely the more systematic we should be in trying to solve it? I could be wrong, but I don’t see the systematic, transparent review and assimilation in climate science that you get in mature sciences like chemistry, geology, mathematics and physics or even medicine. That’s why I think Just the Facts aims are noble.
So why would it be that so many of those involved in real climate science are unwilling to publicise the uncertainty and the complexity and (largely) silently endorse the CAGW line? The obvious answer is: because it suits them, because they are dependent on the funding, and that funding is dependent on the problem being real and significant and urgent. It’s not necessarily corruption – though it is certainly fertile grounds for that, it is simple common sense. Unfortunately that ‘common-sense’ is leading to the very real debate around the policy response to a spectre of CAGW when it’s obvious to anyone without a vested interest that government market subsidisation to cut small amounts of anthropogenic CO2 is pointless. I very strongly resent paying a tax for that.
None of those claims are overprecise. The TIME quote uses “trend in a funny way, but you are passing the facts through the belly of journalists. What do you expect? While the calls to action may be debatable, the supporting facts should not be controversial. The likelihood that anthropogenic forcing is somehow disconnected from recent climate change is small enough at this this point as to be negligible.
This is not an overprecise claim. It may once have been overconfident, but the evidence keeps piling up. Exactly how absurd a scenario do you need before neglecting it as irrational? “The community could not refute that somehow the radiative properties of emissions that pass through industrial processes selectively have no radiative effect thanks to the diligent work of leprechauns, but nevertheless the lower atmosphere warmed, the stratosphere cooled, the subtropics expanded, the hydrological cycle accelerated and most of the ice retreated coincidentally.”
None of the quotations you provided are anything to the effect “that we understand Earth’s climate system, are able to accurately measure its behavior, eliminate all potential variables except CO2 as the primary driver of Earth’s temperature and make predictions of Earth’s temperature decades into the future, all with a high degree of confidence.”
This is as far as I’d be willing to go in that direction: although, on a century time scale, I think it is arguable that we do indeed understand the climate system well enough to make global scale anomaly predictions within a factor of two, and some qualitative regional scale predictions with confidence. Perhaps *you* don’t understand it that well. Maybe if you didn’t try to swallow it all in one gulp it would go down easier.
Excellent post, what a great list. As a practicing Engineer who does work with a closed system, water piping networks, I’ve always been fascinated by those in the climate field who can claim such accuracies with something that is obviously so chaotic. The accuracy for which the climate alarmist crowd purport is beyond hubris, IMHO.
Roger Sowell says: June 30, 2011 at 5:24 pm
“My two cents: the measured temperatures on land drop dramatically when a mass of still air, with low humidity, forms and remains in place for many hours. This is especially true when this occurs overnight. We see temperatures drop into the low 30s and high 20s (in degrees F) even during non-winter periods. This might be already included in the above list, I didn’t see it.”
Roger is referring to strong radiative cooling events, of the kind that typically occurs in dry desert conditions at night. But it can also occur in temperate climates. Records are kept regarding the high to low temperature range within a 24 hour period. Some of those records indicate a cooling of 70 degrees within a 24 hour period. These radiative events occur under certain conditions (pressure systems combined with low water vapor/relative humidity, no clouds, etc) and minimally last for around 12 hours, but can also extend themselves into many days. It can be a geographical local, or regional event. It is assumed the heat rises to the upper reaches of the atmosphere, and eventually into space.
NE Oregon (a mix of desert, high plains, and temperature forest zones) experiences these events several times a year, and can happen in any season.
A. Feht: “Very useful list, clearly demonstrating the unbelievable arrogance and ignorance of IPCC.”
I must have missed a step. Could you explain how this list reflects on IPCC?
A temperature inversion is different. This is when two pressure systems collide and a warm air blanket that does not rise keeps cold air at ground level. The warmer air is still there, but you have to travel up in elevation to experience it. It takes quite a lot of energy to sweep an inversion away as it can be quite stable. Strong radiative events are like taking the blanket away, which allows warm air to quickly escape into the upper atmosphere and eventually to space, leaving a cold air column behind it. These events are unstable compared to inversions.
To the list in section 9. Albedo, I would add plants.
Over the course of a year, plants change, which in turn affects the albedo in the region containing the plants. Additionally, any changes to climate are going to affect what plants grow in a region, which will in turn affect the average albedo of that region.
UV creates ozone, which is a GHG.
Michael Tobis says:
June 30, 2011 at 4:51 pm
The alarmists are making the claim that CO2 is big enough to worry about based on the claim that there are no other known mechanism that could have caused the warming of the last 100 years, therefore CO2 caused it.
This post is just further evidence that this belief is not justified. It also puts a bullet between the eyes (oh no, did I just make a death threat?) of the claim that we can believe the output of the models because they account for everything.
Michael Tobis says:
“[…]the stratosphere cooled, the subtropics expanded, the hydrological cycle accelerated and most of the ice retreated coincidentally.”
The lower stratosphere cooled in two steps after El Chichon and Pinatubo (see my post above), which makes it hard to use that cooling as an argument for the CAGW message.
Regarding the hydrological cycle: Do you know if there are any publicly available plotted time series of tropospheric water vapor? I can’t find any.
I’ve tried to explain the complexity of climate by referencing what I call the 5 spheres
biosphere
hydrosphere
atmosphere
lithosphere
cryosphere
This alone defines 10 interfaces between the 5 spheres. And that doesn’t include interactions within each sphere. Everyone of these areas of interaction is known poorly at best, yet a solid understanding of all of them is vital in order to make predictions regarding the climate.
Follow the link to the abstract and click on the pdf link. The authors demonstrate that strong radiative cooling events are measureable factors in the energy balance and should be considered in models.
http://journals.ametsoc.org/doi/abs/10.1175/1520-0469%281981%29038%3C2730%3ARCEWAA%3E2.0.CO%3B2
Khwarizmi says:
July 1, 2011 at 4:03 am
Inconceivable Bugs Eat Methane on the Ocean Floor, Science, July 2001
How far life extends downwards towards the core of the earth remains unknown to science. Likely much further than most scientists assume, because each time life is found deeper within the earth it is reported as a surprise. As though life would not evolve to take advantage of any energy source, and thereby modify the climate of the planet.
It is quite possible that life exists as deep within the planet as does water, which is also unknown. Recent evidence suggests that subduction carries water much deeper into the mantle than previously thought. That there may be more water buried within the earth than all the oceans combined.
http://www.physorg.com/news169906990.html
This would mean that the current model of sea level rise is incomplete, or even wrong. That the ocean basins are not “containers” for the oceans. Simply low lying spots where the water within the earth is exposed.
As happens everywhere else on earth,when the water table is higher than the land, a body of water forms. The oceans may simply reflect the global height of the global water table. The ocean basins themselves do not “contain” the water, they are simply low spots in the crust below the global water table, where the water within the crust is exposed.
What is interesting is the production of methane deep within the earth. While mainstream science believes methane is a fossil fuel, and thereby limited in supply, there is a considerable body of evidence that methane is much more abundant than provided for by this theory.
This will not influence the greenites any more than proving the earth is more than a few thousand years old and man is a slightly evolved monkey shut up the religious.
izen says:
July 1, 2011 at 12:06 am
Which of the many factors you mention causes the big changes in climate between summer and winter in the higher latitudes?
So, you believe “it’s the Sun”? Or are you stating CO2 changes over 6 months accounts for the changes? Oh wait, you are trying to equate “weather” with “climate”. Isn’t that interesting.
What this post demonstrates is the term “climate scientist” is truly an oxymoron.
Has anyone estimated the volume of CO2 intake of the biosphere? If the “turnover” of CO2 is high, then it would cast doubt on AGW caused CO2 increase.
Espen has eyeballed a complex graph (a more detailed reference would help; there’s no information as to what time series that is or whether it constitutes published data) and applied an informal interpretation to it. My strong expectation is you can’t get anything remotely resembling statistical significance for your interpretation. An alternative view is that there is some slight overshoot in recovery from a volcanic event for some reason, and that is all superimposed on a trend. It would be very hard on a record of that duration to make the distinction: you only have two events after all. Indeed, you’d have to make some very rigorous physical (non-statistical) characterizations of the signal to have any hope of getting anything beyond the trend out.
Regarding the other question, it is important to understand that atmospheric column moisture and the hydrological cycle are different things. Both are expected to increase, but there is no elementary guarantee that they are tightly correlated with each other. For moisture I come up with Trenberth, K. E., J. Fasullo, and L. Smith (2005), Trends and variability in column-integrated atmospheric water vapor, Clim. Dyn., 24, 741–758. For precipitation/evaporation there is Zhou et al, Recent trends of the tropical hydrological cycle inferred from Global Precipitation Climatology Project and International Satellite Cloud Climatology Project data, JOURNAL OF GEOPHYSICAL RESEARCH, VOL. 116, D09101, 16 PP., 2011 doi:10.1029/2010JD015197.
As proof that scientists are not PR professionals, I also offer you Kevin Trenberth’s visually hideous PDF on these subjects. http://www.agci.org/dB/PPTs/04S2_KTrenberth_0713.pdf It otherwise looks very solid. One might wish to have the audio for some parts. Please note especially the slide called “a conundrum” (the 15th I think). This is a succinct statement of mainstream science about anticipated precipitation changes, and it stands alone without the audio well enough.
Pamela, thank you for that excellent explanation of strong radiative cooling events. That is precisely what I had in mind but knew not the correct name.
“…[O]ur understanding of Earth’s climate system is currently rudimentary at best, our measurement capabilities are limited and our historical record is laughably brief.”
Oh my goodness – a climate denier just made a patently offensive statement. Whatever do I do?!? Wait, wait, I know! I’ll consult my nifty “Skeptical Scientist” iPhone, Android or Nokia app for a witty yet damning rebuttal – http://www.skepticalscience.com/software.shtml .
I’ll use the terms “climate, natural, cycle, and complex.” Well, for good measure let me throw in “Watts.” And the result is:
CHALLENGE THE DENIER WITH: “Then you admit confirming not denying you ever said that?” – “Bloom County”
Phew! Now, that’s a rebuttal with logic a denier cannot refute! With the sanctity of AGW affirmed anew, I’m off to check my carbon footprint – http://www.takepart.com/actions/act-now-calculate-your-carbon-footprint/33587 .
Just for giggles… the rebuttal best poised to answer the odious statement above:
“No known natural forcing fits the fingerprints of observed warming except anthropogenic greenhouse gases,” – Argument 59.
Well, I’m sold! So, put the above in your pipe and smoke it, deniers! Personally, I weep for the generation raised on such social networking drivel.
Jeff Larson: turnover of CO2. Yes, I have had a go. By studying the gradients of annual downticks in CO2 in the Mauna Loa record (due the Northern Hemisphere growing season) I have derived a rate of exponential decay and consequent half-life. It comes out at 122 +/-2 months. (Peak rate of decline is between July and August.) Lock the Earth in August configuration and Bob’s yer uncle… CO2 will go down. (Note to geoengineering freaks: this is irony. Don’t go there.)
What triggered this effort was an outrageous statement on the UK Royal Society’s website (now withdrawn) that manmade CO2 stays in the atmosphere for over a thousand years. That “great sucking sound” every northern summer belies it.
To calculate that rate of takeup in tonnes per day is pretty straightforward, and it can be compared to the estimated rate of manmade contributions. If the manmade figure is comparatively tiny, it can still be argued (not by me) that the cumulative effect of MMCO2 is key, disrupting a (ficticious) natural balance. There’s evidence of a 900-year time lag between temperature and CO2 (CO2 variations being an effect, not a driver of natural temperature changes). The most convincing proxy for global temperature I know of is the 3500 year record of the Aletsch Glacier. It shows a warming from c1120AD to c1240. If today’s rise in CO2 is a delayed degassing, then in a few decades the Mauna Loa graph will peak and then decline. Now THAT would deprive the greenshirts of their favourite guilt trip… if Maunder II hasn’t already trashed their cherished global warming myth!
@- Espen says:
July 1, 2011 at 7:17 am
“Regarding the hydrological cycle: Do you know if there are any publicly available plotted time series of tropospheric water vapor? I can’t find any.”
You can find the data available listed and discussed in detail here –
http://scienceofdoom.com/2011/06/05/water-vapor-trends-part-two/
Also in the preceding and succeeding parts…
@- Richard M says:
July 1, 2011 at 8:07 am
“So, you believe “it’s the Sun”? Or are you stating CO2 changes over 6 months accounts for the changes? Oh wait, you are trying to equate “weather” with “climate”. Isn’t that interesting.”
Okay fair point, if you restrict ‘climate’ to changes in the the average of temperature, rainfall, humidity, snowcover, ice extent, glacier mass balance etc over a >30 yr period then seasonal changes are certainly NOT climate.
I am not sure many people attribute the difference between summer and winter as just ‘weather’ though…
The point I was trying to make, perhaps too obscurely, was that this list of factors, although extensive, does not include some very important factors because it seems to be unconnected with any sense of the relative magnitude, timescale and importance of the factors.
The distribution of sunlight over the surface is not only responsible for the seasons, but is also the trigger factor for the last ~3million years for the end of glacial periods as spring snow cover gets more readily melted in the N hemisphere when the Milankovitch cycle alters that distribution of sunlight.
Just as the seasons change when the distribution of sunlight alters.
A list like this is scientifically useless unless it is grounded in actual climate changes and what DOES cause them.
Other posters have compared this to the complexity of human biology and the problems in medicine.
If a patient presents with a number of signs and symptoms consulting a VERY long list of all the things that might affect the health of the individual is pointless. And human biology is FAR more complex than the climate.
What is done is to look at what has been found to cause those symptoms before and use them as a fingerprint to prepare a much shorter list with various levels of probability of the known causes of similar cases. Past research into the epidemiology of a disease. and what IS known about the biology of illness has discovered what causes a particular set of symptoms.
The methodology of research into complex and often chaotic systems – of which human health is one of the most difficult – is to approach it from the end of the effects and then look for the causes.
Not to make a long and exhaustive list of possible causes with no distinction as to magnitude or timescale and then claim that in the
face of such complexity any conclusions are impossible.
If the patient presents with raised a raised temperature and further investigation reveals an abnormally raised level of CO2 with predicted changes in the surface emissions and downwelling long wave radiation over less than a century you have a ‘fingerprint’ of a condition that eliminates most of the long all-inclusive list of possible causes.
For people trying to equate the human body’s complexity to climate, stop it. You don’t know anything that you’re talking about.
Unlike climate, we’ve learned a great deal about the human body through centuries of direct experimentation. Something we cannot do with the earth system.
The human body is also not nearly as complex. We also know the human body intimately through many layers of detail (through direct experimentation) from the humeral scale down to the molecular scale. And yet, even so, we are constantly discovering errors and problems. Why do medicines all have long lists of side effects? Why are some people allergic to penicillin and not others? Or some foods? Or some creams? Or sunlight? Or to themselves? Why have theories, we know what’s acting during the disease states, but we have no idea how they begin, what triggers them, or how to cure them. And here we are talking about a system which we can manipulate every known variable, through DNA and chemicals and surgery, directly however we wish, and have been for centuries!
No, climate is vastly more complex than this, and yet one would claim we could understand that well enough to base governmental and world policies on that’ll tax, radically change, and effect the lives of billions for generations to come? All while we still know so little about the human body that we can never make a medicine with no side effects? Can’t stop aging? Can’t cure cancer? Can’t stop the generation of super bugs? Can’t prevent death?
Right. You people amuse me in your self imposed naiveties.
The reason this topic is so heated, isn’t because of the science, it’s because of the politics that threaten to destroy our economies and our futures based on nothing we even begin to understand. Just computer models, all already failing as time moves on and temperatures don’t rise nearly as fast as they predicted.
Michael Tobis says:
July 1, 2011 at 6:37 am
I must have missed a step. Could you explain how this list reflects on IPCC?
In a very simple and obvious way, Michael. IPCC does NOT take into account most of the influence factors and feedback mechanisms listed above.
“Mark Wilson says:
July 1, 2011 at 7:07 am
UV creates ozone, which is a GHG”
The feedback from that due to the solar cycle change in spectoral content modulating the atmospheric content would have the opposite sign to a modulation of Methane in the greenhouse effect. They would be antiphase with each other. Heat produced directly (not via the greenhouse feedback) would be in phase.
Does anyone know if the UV spectoral change is in time with the 11 year cycle or is it the 22,33,wolf/gleissberg etc?
Do the Ozone holes give the clue or are they electricaly related to the cycles more than UV related? .
proving the earth is more than a few thousand years old and man is a slightly evolved monkey shut up the religious.
—
Why do you believe that this should or could shut up the religious?
Has any one ever seen Bystander and Moderate Republican in the same room at the same time?
😉
“Jeff Larson says:
July 1, 2011 at 8:10 am
Has anyone estimated the volume of CO2 intake of the biosphere? If the “turnover” of CO2 is high, then it would cast doubt on AGW caused CO2 increase.”
Hope you get a better answer but I got curious about the change in the CO2 growth rate some years compared to others and had an amateurish play with correlations in various data sets to see what might influence this.
Khwarizmi above linked to something with “phytoplankton account for 50 percent of photosynthesis” i found something else that said 90 percent of all photosynthesis was in the oceans. So compared various SST data sets with CO2 growth rate changes. I got the strongest correlation between Both the annual change in CO2 and the non annual change in CO2 between this: http://www.cpc.ncep.noaa.gov/data/indices/oni.ascii.txt
and this: ftp://ftp.cmdl.noaa.gov/ccg/co2/trends/co2_mm_mlo.txt
Table of three month SST compared to 7 month season corr CO2 change over the entire data sets.
seemed to show a correlation of SST to atmospheric CO2 with a 2 month delay( r0.5). That is temp first is followed by CO2 change.
Note the season corr CO2 value has not risen since Jan 2011.
Feht: “IPCC does NOT take into account most of the influence factors and feedback mechanisms listed above.”
You can provide examples, then? “Most” would require a lot of work. Let’s start with a more manageable three. Identify how they operate on policy time scales and in what context IPCC ought to have included them but didn’t.
I congratulate you for apparently knowing the IPCC reports so thoroughly that you can come to the conclusion that “most” of these items are omitted so immediately. So if your claim is not completely fabricated, you should have little problem coming up with details in a few cases.
“Ridiculous?” No – it is totally normal for climate (the “earth system”) to be characterised by profoundly complex nonlinear-nonequilibrium dynamics.
It would be ridiculous for it to be anything else.
But a great and valuable post none-the-less.
Congratulations on a brilliant and through list, and a second congrats to all the posters here with more feedback and references.
Much appreciated, and I can tell you this page is already bookmarked for further late-night reading, ( along with the murder mysteries currently on my nightstand as well ).
This list would make a great reference page. Well done!
Ged says:
July 1, 2011 at 9:59 am
“The human body is also not nearly as complex. We also know the human body intimately … Why have theories, we know what’s acting during the disease states, but we have no idea how they begin, what triggers them, or how to cure them.”
So no point in accessing any treatment in the event of injury or disease ?
sarc/off
But you seem to suggest that if human biology is less complex than the climate, and known in much greater detail BUT we still have no idea about important aspects of it then the climate would be even less knowable?
This would be an appeal to permanent ignorance of the subject unless you have a suggestion for a means of dispelling it with research. Can you suggest a better approach than to look at the effects and track back to causes?
Perhaps this is the point of an exhaustive list of causal factors at all levels of the total climate system. If you observe an effect, then you can look through a list of possible causes and determine which could, and could not, be contributing to the observations.
Michael Tobis,
I wasn’t born yesterday, and don’t have time for childish games.
You accused me of making an unsubstantiated statement (though the same statement was made and thoroughly substantiated on this site on numerous occasions). The burden of proof is on you.
“You accused me of making an unsubstantiated statement … The burden of proof is on you.”
I find that position peculiar, to say the least.
Michael Tobis says:
July 1, 2011 at 8:32 am
Espen has eyeballed a complex graph (a more detailed reference would help; there’s no information as to what time series that is or whether it constitutes published data) and applied an informal interpretation to it.
I’m surprised you need an explanation for that, the URL should tell you right away that I linked directly to Remote Sensing Systems.
An alternative view is that there is some slight overshoot in recovery from a volcanic event for some reason, and that is all superimposed on a trend. It would be very hard on a record of that duration to make the distinction: you only have two events after all.
There was also Agung in 1963, but the stratospheric temperature records start just a couple of years before that, so I guess it’s hard to tell if there was a step cooling after the warming from Agung.
You write as if the step cooling is something I just “eyeballed”, but of course it’s not, it has been observed by climate scientists and discussed in several papers, e.g. Thompson and Solomon (2008): “Understanding Recent Stratospheric Climate Change”.
While I continue to object to the “stair-step” characterization, I acknowledge that others have used it. I thank Espen for raising an interesting issue. I withdraw and apologize for my offhand dismissal of it.
I am reading the recent review article of Seidel et al: Stratospheric Temperature Trends: Our Evolving Understanding (Wiley Interdisciplinary Reviews: Climate ChangeEarly View, Article first published online: 17 JUN 2011)
They say: “In contrast to the relatively unchanging expectations of surface and tropospheric warming primarily induced by greenhouse gas increases, stratospheric temperature change
expectations have arisen from experiments with a wider variety of model types, showing more complex trend patterns associated with a greater diversity of forcing agents.” That said, at first glance their figure 5 seems to indicate that long-lived greenhouse gas forcing dominates the observed trends.
Well done, JustTheFacts.
There are quite a few overlaps between your list and mine:
(taken from a post trying to demonstrate the constructive and destructive interferences patterns on each other: http://cultofthecarboncow.com/?p=2001)
What are some of the climate variables a simple man from Kansas is aware of:
* Slight changes in the distance of the Earth from the Sun as the Sun’s gravity well drags the Earth about the cosmos
* Slight changes in Earth’s position within the plane of the ecliptic as the Sun’s gravity well drags the Earth about the cosmos
* Slight changes in the Solar System’s location within the galactic plane as the galaxy’s gravity well drags the Solar System about the cosmos
* Slight changes in the Sun’s intensity
* Slight changes in the relationship between the tilt of the Earth/Moon system’s gravitational axis and the Sun’s equator where the Sun’s magnetic disturbance and thus solar flares are greatest
* Slight changes in cloud cover caused by infrequent cosmic ray activity
* Slight changes in cloud cover caused by precipitation changes
* Slight changes in cloud cover due to changes in the jet stream and other wind patterns
* Slight changes in wind patterns due to slight changes in the height of mountain ranges due to plate tectonics
* Slight changes in wind patterns due to slight changes in the depths of valleys as running rivers erode the Earth
* Slight changes in precipitation on land due to changing wind patterns alternating whether rain is deposit on land or sea
* Slight changes in atmospheric gas concentrations
* The occasional eruption of volcanoes on land
* The occasional eruption of volcanoes under the sea
* The continuous belching forth of our planet’s innards upon itself along the ocean ridges
* Slight changes in the width of the ocean’s ridges, reducing or increasing the resistance to the release of gasses
* Slight changes to the amount of continental plates as they subduct or grow, or perhaps slightly expand the volume of the planet
* Slight changes in magmatic patterns within the mantle
* Slight changes in the drift of the core
* Slight changes in land use patterns (the changes in the amount of land dedicated to farming, forestry, cities, etc.)
* Slight changes in the amount of methane welling up from the ocean’s floors
* Slight changes to the reflectivity of the Earth (albedo) as plants grow and cast shadows and then die, and as buildings are built or destroyed, and as natural occurrences darken or lighten waters
* Slight changes in albedo due to changing ice patterns
* Slight changes in the Earth’s magnetic field that allow or disallow a varying amount of cosmic rays and solar radiation into the atmosphere
* Slight changes to the Sun’s magnetic field
* The occasional earthquake
* The occasional meteor strike
* The continuous depositing on the Earth of the Solar System’s dust that becomes trapped in the gravity well of the Earth
* Slight changes to the ratio between the volume of plant matter (respirators of oxygen) to animal matter (respirators of carbon dioxide)
* Slight changes to the production of energy by mankind
Each of the above, and I am sure there are many more, would have their own curve representing their contribution to Earth’s climate. None of the curves are likely the simple sine waves this post has presented, and to make the point again: each of the above would have to be evaluated against each of the other to properly account for the constructive and destructive influence each would have on the climate.
Further, and more to the point of this post: each of the above have different times between the repetition of their patterns, for those that are not one-offs. The varying durations (periods) of the curves, the varying shapes of the curves, the varying intensity (amplitudes) of the curves, and the varying amount of interference due to the current presence or non-presence of each of the above plus all the actual climatic influences makes for a natural yet chaotic climate system.
Far out and solid Just the Facts. (good job) Keep pushing, keep pushing on..
Lest we forget..
Interstellar clouds..
Cloud Tripping Through the Milky Way
..Linsky says we’ll enter the G cloud in less than 5,000 years — perhaps even tomorrow.
Once that happens, there’s a chance the G cloud will affect the Sun’s solar wind and Earth’s climate.
For instance, a dense enough cloud could push in on the solar wind and pollute the interplanetary medium, decreasing the Sun’s intensity and cooling the Earth. A very dense cloud could even produce an ice age on the Earth. Luckily, the G cloud isn’t dense enough to cause an ice age. It would only cool the earth a little relative to the environment we’re in now. Still, Linsky says, it’s only a matter of time until we encounter a cloud that is dense enough to radically alter our climate.
Until then, however, there is a lot to learn about the clouds currently flowing through the heavens around us.
http://jila.colorado.edu/content/cloud-tripping-through-milky-way
Accretion of,
Helium
Hydrogen
Carbon
Oxygen
Dust
etc..etc..
Good to see also you had mention of Interstellar Magnetic Fields, like the one they think is denting the heliosphere bubble in the nose.
sshh don’t tell Dr. S.. eeee
Did I miss this,
ionospheric waves and precipitation?
One more thing, originally signed on to this site as earthunderfire, Neve posted using that name that I recall. How do I get rid of it?
Well, sure, there are lots of influences. The point is that a few of them are very very very very large compared to the others, those are all anthropogenic, and the CO2 eventually dominates because it has such a long residence time that it is essentially cumulative and (without a huge expensive and energy-intensive intervention that more than obviates its advantages in the first place) essentially irreversible.
There are many influences on my health, and the biological system is far from being perfectly characterized, but getting swatted on the skull daily by a growing child wielding a baseball bat is still a very bad idea that gets worse with each passing day.
Michael Tobis says:
“CO2 eventually dominates because it has such a long residence time…”
False assumption, therefore the incorrect conclusion is not surprising.
The UN/IPCC’s unsupportable guesstimate of CO2 residence time is contradicted by numerous peer reviewed studies. Further, the effect of adding more CO2 diminishes rapidly, thus debunking the Malthusian arm-waving over a minor trace gas which, even if it doubled, is still a minor trace gas.
Smokey’s clever graphs are incorrect and seem to have fake attributions.
If CO2 perturbation decay time were short, CO2 concentrations would go down during a recession.
Tobis:
They are not my graphs, and they are graphs based on numerous peer reviewed studies, as anyone looking at them would see. And:
“If CO2 perturbation decay time were short, CO2 concentrations would go down during a recession.”
If Tobis took the time to notice, he would see that the rise in [harmless, beneficial] CO2 has been stagnant since the beginning of the year.
I don’t make these comments to educate Michael Tobis, whose mind is closed as tight as Harold Camping’s, and who cannot be educated with facts. I note these facts only to avoid allowing others to be swayed by bogus alarmist propaganda. Malthusian Luddites like Tobis have been arm-waving for centuries, and they have been wrong for centuries. They are just as mistaken today.
I’ve updated the intro of this post to include:
UPDATED: This list has undergone significant revisions and improvements based upon crowdsourcing the input of an array of very intelligent and knowledgeable contributors below. Additionally, this list was posted in comments in WUWT a few times previously, receiving input from a number of other very intelligent and knowledgeable contributors. This thread, along with links to the precursor threads below, will thus serve as the bibliography for the WUWT Potential Climatic Variables reference page (unless someone can up with a better name for it…)
Please let me know if you have any suggested improvements to this intro paragraph… 🙂
“Please let me know if you have any suggested improvements”
A couple of major factors such as solar and oceanic variability would pretty much swamp everything else with all the lesser factors simply offsetting each other on average over time.
Would it be possible to rank the various items and processes on the list in order of significance or perhaps group them in batches of compareable magnitudes?
In practice I think the climate system is more simple than such a list suggests because of the primacy of a small number of major factors.
No section on the greenhouse effect, and infra-red active gases which helps explain why the surface temperature is as warm as it is? This seems to be major omissions when discussing climate.
Michael Tobis finds a presumption of innocence to be a “peculiar” notion.
No wonder he trusts the conclusions of an irresponsible and corrupt UN organization.
Michael Tobis says: July 1, 2011 at 6:11 pm
Well, sure, there are lots of influences. The point is that a few of them are very very very very large compared to the others, those are all anthropogenic,
This statement is erroneous. According to EPA;
“The radiative forcing contribution (since 1750) from increasing concentrations of well-mixed greenhouse gases (including CO2, CH4, N2O, CFCs, HCFCs, and fluorinated gases) is estimated to be +2.64 Watts per square meter – over half due to increases in CO2 (+1.66 Watts per square meter), strongly contributing to warming relative to other climate components described below.”
http://www.epa.gov/climatechange/science/recentac.html
whereas the Wiki for “Insolation” says:
“Over the course of a year the average solar radiation arriving at the top of the Earth’s atmosphere is roughly 1,366 watts per square meter[2][3] (see solar constant). The radiant power is distributed across the entire electromagnetic spectrum, although most of the power is in the visible light portion of the spectrum. The Sun’s rays are attenuated as they pass though the atmosphere, thus reducing the insolation at the Earth’s surface to approximately 1,000 watts per square meter for a surface perpendicular to the Sun’s rays at sea level on a clear day.
The actual figure varies with the Sun angle at different times of year, according to the distance the sunlight travels through the air, and depending on the extent of atmospheric haze and cloud cover. Ignoring clouds, the average insolation for the Earth is approximately 250 watts per square meter (6 (kW·h/m2)/day), taking into account the lower radiation intensity in early morning and evening, and its near-absence at night.”
http://en.wikipedia.org/wiki/Insolation
What Anthropogenic forces can you point to that are “very very very very large compared to the” “average insolation for the Earth” i.e., “approximately 250 watts per square meter (6 (kW·h/m2)/day)”?
Just the facts,
People like Michael Tobis do not want to see facts. They only throw unsubstantiated accusations and inane party line cliche’s. And rationality is the last thing in the world you can expect from them. Look at all his posts in this thread. Entirely devoid of any rationale or facts.
It’s good that you put up these counter arguments with facts which will show every time to every one as to how shallow and devoid of facts arguments of such people are.
Nobody contests that the sun is the source of energy in the system!
The question is variability on the time scale of the anthropogenic CO2 perturbation, which could drive climate *change*. As far as I know, nothing in the published literature indicates anything larger than 0.3 W/m^2 peak-to-peak solar variability on decadal-to-century time scales. Compare 4 w/m^2 imbalance for an instantaneous CO2 doubling or equivalent, and you have the generally accepted conclusion that human inputs already overcome the solar variability.
Stephen Wilde says: July 1, 2011 at 7:58 pm (Edit)
A couple of major factors such as solar and oceanic variability would pretty much swamp everything else with all the lesser factors simply offsetting each other on average over time.
Would it be possible to rank the various items and processes on the list in order of significance or perhaps group them in batches of compareable magnitudes?
I am open to a Significant Climatic Influences page, and/or a Significant Temperature Influences page, I like the variable batches of comparable magnitudes. Does anyone want try to build one?
In practice I think the climate system is more simple than such a list suggests because of the primacy of a small number of major factors.
I disagree. You seem to be focused on a singular subject, i.e. the “small number of major” influences on Earth’s temperature, whereas, the ridiculous complexity is especially apparent when you try to imagine the entire beast in motion.
I just added
“Wind;
http://en.wikipedia.org/wiki/Wind
that influence Surface Currents;
http://www.windows2universe.org/earth/Water/ocean_currents.html
http://en.wikipedia.org/wiki/Ocean_current
through Ekman Transport;
http://en.wikipedia.org/wiki/Ekman_transport
http://oceanmotion.org/html/background/ocean-in-motion.htm
and wind also causes Langmuir circulations
http://en.wikipedia.org/wiki/Langmuir_circulation“
As noted in my update to the intro this post/list, previously I posted this list in comments of several WUWT threads, linked below) and got some valuable input from a number of individuals. This comment serves as a continuation of the bibliography.
The list began its life as a comment on January, 15th 2011:
http://wattsupwiththat.com/2011/01/15/nasa-la-nina-has-remained-strong/#comment-574922
and then was revised on January, 22nd 2011;
http://wattsupwiththat.com/2011/01/22/new-wuwt-solar-images-and-data-page/#comment-584215
February 10th, 2011;
http://wattsupwiththat.com/2011/02/10/wsj-no-weather-weirding-worries/#comment-596174
and February 28th:
http://wattsupwiththat.com/2011/02/28/new-geomagnetism-reference-page/#comment-610064
Michael Tobis says: July 1, 2011 at 9:02 pm
Nobody contests that the sun is the source of energy in the system!
Can we take this statement as an admission that your prior statement that “a few of them are very very very very large compared to the others, those are all anthropogenic,” is in fact erroneous?
As far as I know, nothing in the published literature indicates anything larger than 0.3 W/m^2 peak-to-peak solar variability on decadal-to-century time scales.
Wiki states that it varies “by approximately 0.1% or about 1.3 Watts per square meter (W/m2) peak-to-trough during the 11-year sunspot cycle”:
http://en.wikipedia.org/wiki/Solar_variation
Do you just make this stuff up? You don’t seem to do the most basic fact checking. Search engines are your friend.
Compare 4 w/m^2 imbalance for an instantaneous CO2 doubling or equivalent
Correct. It is interesting that you only get the CO2 science accurate.
and you have the generally accepted conclusion that human inputs already overcome the solar variability.
No, there is no “generally accepted conclusion” about this. It has been hypothesized that Galactic Cosmic Rays;
http://en.wikipedia.org/wiki/Galactic_cosmic_ray
http://en.wikipedia.org/wiki/Cosmic_ray
modulated by Solar Wind, may influence cloud formation on Earth;
http://wattsupwiththat.com/2009/08/04/a-link-between-the-sun-cosmic-rays-aerosols-and-liquid-water-clouds-appears-to-exist-on-a-global-scale/
but this is still hotly contested.
Solar influences aside, Oceanic Oscillations
http://wattsupwiththat.com/reference-pages/oceanic-oscillation/
including El Niño/La Niña;
http://en.wikipedia.org/wiki/El_Ni%C3%B1o-Southern_Oscillation
http://www.appinsys.com/GlobalWarming/ENSO.htm
http://www.ossfoundation.us/projects/environment/global-warming/el-nino-southern-oscillation-enso
http://wattsupwiththat.com/2010/04/26/enso-update/
http://wattsupwiththat.com/reference-pages/enso/
the Pacific Decadal Oscillation (PDO);
http://en.wikipedia.org/wiki/Pacific_Decadal_Oscillation
http://www.appinsys.com/GlobalWarming/PDO.htm
http://www.atmos.washington.edu/~mantua/REPORTS/PDO/PDO_egec.htm
http://www.atmos.washington.edu/~mantua/REPORTS/PDO/PDO_cs.htm
http://jisao.washington.edu/pdo/PDO.latest
the Atlantic Multi-Decadal Oscillation (AMO);
http://en.wikipedia.org/wiki/Atlantic_Multidecadal_Oscillation
http://www.appinsys.com/GlobalWarming/AMO.htm
http://www.esrl.noaa.gov/psd/data/timeseries/AMO/
http://www.aoml.noaa.gov/phod/amo_faq.php
http://en.wikipedia.org/wiki/Atlantic_multidecadal_oscillation
and the Indian Ocean Oscillation (IOO), which is closely associated with the Atmospheric Oscillation the Equatorial Indian Ocean Oscillation (EQUINOO) and is the Oceanic component of the Indian Ocean Dipole (IOD). The Indian Ocean Oscillation (IOO) is also closely connected to the El Nino Southern Oscillation (ENSO). (Note, the “Indian Ocean Oscillation (IOO”) does not appear to have a well established name within the literature. It might be better as the Indian Ocean Interannual/Decadal Oscillation (IOIDO), but time will sort that out.):
http://en.wikipedia.org/wiki/Indian_Ocean_Dipole/
http://ams.confex.com/ams/pdfpapers/28816.pdf
http://www.springerlink.com/content/51n8664436045952/
http://news.xinhuanet.com/english2010/sci/2010-10/04/c_13542305.htm
seem like a good place to look. The recent change from El Niño to La Niña that occurred in 2010;
http://wattsupwiththat.com/reference-pages/enso/
resulted in a half degree celcius drop in global temperatures in 1 year, per the RSS Lower Troposphere Temperature Anomaly;
ftp://ftp.ssmi.com/msu/graphics/tlt/plots/rss_ts_channel_tlt_global_land_and_sea_v03_3.png
UAH Mid-Troposphere Temperature Anomaly;
http://www.ncdc.noaa.gov/sotc/service/global/uah-midtrop-global-land-ocean/201105.gif
and UAH Global Lower Atmosphere Temperature Anomaly:
http://www.drroyspencer.com/wp-content/uploads/UAH_LT_1979_thru_May_20111.gif
Do you agree that Oceanic Oscillations can have a significant influence on Earth’s Temperature?
To continue the human body analogy:
While we know a lot about the human body, we still don’t know a great deal. With our current understanding of genetics, brain functions, physiology, psychology, education, and group dynamics, can we predict what college your infant will go to with any level of certainty? Or for that matter, what you will want to eat for breakfast next Tuesday?
You may counter that we don’t know if you will want bacon and eggs or cereal, but we know that if you eat a lot you will get fat. However, we don’t really understand why you get fat and I don’t when we eat the same amount and do the same activity. We may recognize it happens, but not understand the dynamics of why. And on it goes.
REALLY complex systems are even harder to predict than they are to understand. Inability to grasp how all the small scale influences affect the larger scale is problematic, regardless of the time scale, but a show stopper in any long-term time scale.
Just The Facts,
Thank you for a useful and interesting post. Implicit in the discussion of ‘AGW’, ‘Climate Change’ et seq, and in the various actions proposed, is the belief that human actions can exacerbate or mitigate climate and it’s various effects on a global scale. And by extension, weather.
Many people, myself included, find this assumption that we are able to control or influence global climate, dubious at best.
@- Smokey says:
July 1, 2011 at 7:43 pm
“If Tobis took the time to notice, he would see that the rise in [harmless, beneficial] CO2 has been stagnant since the beginning of the year. ”
No, it hasn’t –
http://www.esrl.noaa.gov/gmd/ccgg/trends/weekly.html
Up-to-date weekly average CO2 at Mauna Loa
Week of June 19, 2011: 393.46 ppm
Weekly value from 1 year ago: 391.53 ppm
Weekly value from 10 years ago: 373.12 ppm
And as you can see from the graph it is following the usual seasonal pattern of a spring peak.
CO2 varies by around 5ppm a year from the seasonal biological cycle.
Superimposed on this regular annual cycle has been a net gain of about 1.8ppm per year.
Are you suggesting this year will be any different?
Wow. Tobis has deigned to post on WUWT, many times on this thread, in a manner resembling an arguing of the facts.
What’s happening? Is traffic so low on his blog that he’s trawling for some visits with all the links to his site? Or is he trying to improve a Wikio-type link-based rating by liberally spreading them on this much more well read blog? According to this web site stat page, WUWT has the highest Alexa ranking of any site linking to his blog, a very high 17,562 (lower is better) compared to his 811,560. And his traffic has been dropping like a stone…
Will he finally go away after leaving enough link-droppings?
@- justthefactswuwt says:
July 1, 2011 at 11:36 pm
“Do you agree that Oceanic Oscillations can have a significant influence on Earth’s Temperature?”
On the immediate temperature, but not on the climate.
There is little historical evidence that the pattern of Oscillations drives unidirectional climate change.
It is considered more likely they respond to, not initiate significant trends that extend beyond the average cycle length.
@-justthefactswuwt says:
July 1, 2011 at 11:36 pm
Michael Tobis says: July 1, 2011 at 9:02 pm
As far as I know, nothing in the published literature indicates anything larger than 0.3 W/m^2 peak-to-peak solar variability on decadal-to-century time scales.
Wiki states that it varies “by approximately 0.1% or about 1.3 Watts per square meter (W/m2) peak-to-trough during the 11-year sunspot cycle”:
http://en.wikipedia.org/wiki/Solar_variation
Do you just make this stuff up? You don’t seem to do the most basic fact checking. Search engines are your friend.
—————-
There may be a simple explanation why you are BOTH right.
The top of atmosphere variation is ~1.2 W/m2 or 0.1%.
The average surface change – because the Earth is a sphere and rotates is about a quarter of the top-of-atmosphere value, – around 0.3W/m2 or 0.1% of the surface average total.
Search engines can be our friend, but thinking about WHY two people come up with different results can also help.
Michael Tobis says:
June 30, 2011 at 4:51 pm
……
You take the needle, bury it in the haystack, and then question whether there is a needle at all. If this defense works nobody will ever be able to make a case for anything.
/end quote
exactly the point. The needle makes NO observable difference to the haystack – which is why it is so hard to find. Nice analogy, demonstrating the probable impact of anthropological CO2 / other impacts on the global climate – although it is possible that it may underestimate the impact – maybe 10 needles (an order of magnitude) would be better
Izen, you are very mistaken about oceanic oscillations not being capable of driving unilateral “climate change”, which I wish you would use the more accurate “weather pattern variation” term. Google “Elk population and Oceanic Oscillations”, or any other marine/flora/fauna species. My ancestors down to the current crop have been farmers since before the Amercian Revolution. We know both short and long term weather pattern variation. Intimately.
Weather pattern variation change can be natural or anthropogenic, or both. But climate is defined by seasons and extremes. If seasons or extremes begin to show a consistent pattern of change to the point that a new zone designation is in order, then I will be more willing to accept climate change as a more accurate descriptor.
http://mgg.coas.oregonstate.edu/~andreas/pdf/S/schmittner07agu_intro.pdf
Let’s do the really long one first. The meridional overturning circulation. A super El Nino event warms a vast area of the Pacific as it sits idly in the lazy trade wind, soaking up the Sun, and leaving the cold waters underneath to sullenly sit there. Now set this warmed ocean into the overturning circulation. How many days, months, years, decades, or centuries does it take for this heated pool to make it round the circulation?
izen says: July 2, 2011 at 2:03 am
On the immediate temperature, but not on the climate.
What? The Pacific Decadal Oscillation (PDO) “is a climate index based upon patterns of variation in sea surface temperature of the North Pacific from 1900 to the present (Mantua et al. 1997). While derived from sea surface temperature data, the PDO index is well correlated with many records of North Pacific and Pacific Northwest climate and ecology, including sea level pressure, winter land–surface temperature and precipitation, and stream flow. The index is also correlated with salmon landings from Alaska, Washington, Oregon, and California.
The PDO is highly correlated with sea surface temperature in the northern California Current (CC) area; thus we often speak of the PDO as being in one of two phases, a “warm phase” and a “cool phase,” according to the sign of sea–surface temperature anomalies along the Pacific Coast of North America. ”
http://www.nwfsc.noaa.gov/research/divisions/fed/oeip/ca-pdo.cfm
The PDO’s approximately 30 year Warm and Cold Regimes;
http://www.nwfsc.noaa.gov/research/divisions/fed/oeip/EcInFigs/ecinfigtwo.jpg
correlate well with periods of warming and cooling in our laughably brief 131 year-old surface temperature record;
http://www.ncdc.noaa.gov/sotc/service/global/global-land-ocean-mntp-anom/201001-201012.gif
i.e. there was a warming period from 1910 to 1945, a cooling period from 1945 – 1975, a warming period from 1975 to 2005 and we may now be in the early days of a cooling period due to a 30 year Cold Regime in the PDO.
Here’s Easterbrook’s chart and projection;
http://wattsupwiththat.files.wordpress.com/2008/04/easterbrook_projection.png
from this WUWT article:
http://wattsupwiththat.com/2008/04/29/more-on-the-pdo-shift-cited-by-nasa/
Are you arguing that the Pacific Decadal Oscillation has an influence “on the immediate temperature, but not on the climate.”?
There is little historical evidence that the pattern of Oscillations drives unidirectional climate change.
What is unidirectional climate change? Do you think that some portion of the increase in temperature between 1975 and 2005 might have been related to the PDO Warm Regime?
izen says: July 2, 2011 at 2:52 am
There may be a simple explanation why you are BOTH right.
The top of atmosphere variation is ~1.2 W/m2 or 0.1%.
The average surface change – because the Earth is a sphere and rotates is about a quarter of the top-of-atmosphere value, – around 0.3W/m2 or 0.1% of the surface average total.
No. Michael Tobis wrote that, “nothing in the published literature indicates anything larger than 0.3 W/m^2 peak-to-peak solar variability on decadal-to-century time scales.” and he is wrong. The variation in Total Solar Irradiance is measured at the “outer surface of Earth’s atmosphere”;
http://en.wikipedia.org/wiki/Solar_variation
i.e. look at the measurement data:
http://lasp.colorado.edu/sorce/total_solar_irradiance_plots/images/tim_level3_tsi_24hour_640x480.png
http://www.leif.org/research/TSI-SORCE-Latest.png
http://science.nasa.gov/media/medialibrary/2009/03/31/01apr_deepsolarminimum_resources/irradiance_strip.jpg
Thus all of the “literature” references these measurements, e.g. the paper “A new, lower value of total solar irradiance: Evidence and climate significance” by Kopp and Lean, 2011, GEOPHYSICAL RESEARCH LETTERS:
“The most accurate value of total solar irradiance during the 2008 solar minimum period is 1360.8 ± 0.5 W m−2 according to measurements from the Total Irradiance Monitor (TIM) on NASA’s Solar Radiation and Climate Experiment (SORCE) and a series of new radiometric laboratory tests. This value is significantly lower than the canonical value of 1365.4 ± 1.3 W m−2 established in the 1990s, which energy balance calculations and climate models currently use. Scattered light is a primary cause of the higher irradiance values measured by the earlier generation of solar radiometers in which the precision aperture defining the measured solar beam is located behind a larger, view-limiting aperture. In the TIM, the opposite order of these apertures precludes this spurious signal by limiting the light entering the instrument. We assess the accuracy and stability of irradiance measurements made since 1978 and the implications of instrument uncertainties and instabilities for climate research in comparison with the new TIM data. TIM’s lower solar irradiance value is not a change in the Sun’s output, whose variations it detects with stability comparable or superior to prior measurements; instead, its significance is in advancing the capability of monitoring solar irradiance variations on climate-relevant time scales and in improving estimates of Earth energy balance, which the Sun initiates.”
http://www.agu.org/pubs/crossref/2011/2010GL045777.shtml
How did you arrive at an “average surface change” of “around 0.3W/m2 or 0.1% of the surface average total”? Can you cite a source to support this assertion? Does this “average surface change” take into account clouds?
Actually compared to molecular biology the climate system looks ridiculously simple. It’s relatively easy to figure out energy flows in the climate system as it all boils down to thermodynamic laws of physics (entropy flows). There are just a number of subtle influences that are poorly understood (like GCR flux), a smaller number of major influences that are poorly understood (such as clouds), and an unknown number of things that might effect outcomes that we are unaware of. The resulting interplay of knowns, partially knowns, and unknowns on a global scale yields an intractible problem to solve. The best predictions remain in the realm of climatology i.e. past patterns used as predictors of future patterns.
Molecular biology is like climate science on steroids (pun intended) because in that realm it isn’t all just simple entropy flow but rather a hideously complex information system driving chemistry which keeps normal entropy flow in check long enough for the system to reproduce itself. Evidently it’s quite successful at defeating entropy if one accepts the notion that every living cell today has an unbroken lineage dating back to cells that were alive a few billion years ago. Perhaps the largest problem confronting molecular biology is why any of us are alive to think about it. Genetic entropy eventually kills all individuals if something else doesn’t kill them first. It eventually kills all species as well. Most cell lines eventually die off after an average of about 10 million years. The mystery is in how some rare cell lines manage to periodically reset the damage done by genetic entropy and thus persist for billions of years. Every cell in your body is one of those rare lineages that managed to reset the timer on the genetic entropy bomb. Every living cell on the planet is one of those rare few.
justthefactswuwt
PDO and ENSO indices are the ‘highly correlated’ ones.
Above quoted Dr Mantua also states:
At the time of this writing, causes for (and predictability limits of) the PDO are not known. What is known is that the nature of the mechanisms giving rise to the PDO will determine whether or not it is possible to make decade-long PDO climate predictions.
http://www.atmos.washington.edu/~mantua/REPORTS/PDO/PDO_cs.htm
In my investigations I found a natural process (not climate dependent) operating in the general area of the North Pacific, with a reasonable correlation to the PDO
http://www.vukcevic.talktalk.net/PDO.htm
with power and ability to affect ocean currents and atmospheric pressure. In its nature it is an exact equivalent of the process driving NAO (N.Atlantic Oscillation)
http://www.vukcevic.talktalk.net/NAO-.htm
gnomish says: June 30, 2011 at 4:23 pm
the white cliffs of dover
“The White Cliffs of Dover are cliffs which form part of the British coastline facing the Strait of Dover and France. The cliffs are part of the North Downs formation. The cliff face, which reaches up to 107 metres (351 ft),[1] owes its striking façade to its composition of chalk (pure white calcium carbonate) accentuated by streaks of black flint.”
http://en.wikipedia.org/wiki/White_Cliffs_of_Dover
Given the small geographic coverage and orientation to the sun, White Cliffs of Dover would seem to have an extremely small, if any, influence on Earth’s Climate System.
Carrera Marble;
“Marble is a rock resulting from metamorphism of sedimentary carbonate rocks, most commonly limestone or dolomite rock. Metamorphism causes variable recrystallization of the original carbonate mineral grains.
The resulting marble rock is typically composed of an interlocking mosaic of carbonate crystals. Primary sedimentary textures and structures of the original carbonate rock (protolith) have typically been modified or destroyed.
Pure white marble is the result of metamorphism of a very pure (silicate-poor) limestone or dolomite protolith. The characteristic swirls and veins of many colored marble varieties are usually due to various mineral impurities such as clay, silt, sand, iron oxides, or chert which were originally present as grains or layers in the limestone.”
Carrara Marble is “white or blue-gray”
http://en.wikipedia.org/wiki/Marble
Can you please elaborate on what you mean here?
Coal … methane
“Coal is a combustible black or brownish-black sedimentary rock normally occurring in rock strata in layers or veins called coal beds or coal seams. The harder forms, such as anthracite coal, can be regarded as metamorphic rock because of later exposure to elevated temperature and pressure. Coal is composed primarily of carbon along with variable quantities of other elements, chiefly hydrogen, with smaller quantities of sulfur, oxygen and nitrogen.”
http://en.wikipedia.org/wiki/Coal
“Methane is a chemical compound with the chemical formula CH4. It is the simplest alkane, and the principal component of natural gas. Methane’s bond angles are 109.5 degrees (cos−1(−1/3)). Burning methane in the presence of oxygen produces carbon dioxide and water. The relative abundance of methane makes it an attractive fuel. However, because it is a gas at normal temperature and pressure, methane is difficult to transport from its source. It is generally transported in bulk by pipeline in its natural gas form, or LNG carriers in its liquefied form; few countries transport it by truck.”
http://en.wikipedia.org/wiki/Methane
Fossil Fuels, good one! And this suggestion, along with your next one have precipitated the creation of a new category i.e. “11. Chemical” including Fossil Fuels:
Coal
Oil shale
Petrochemicals
– Petroleum
– Mineral Oil
Asphalt
Tar Pits/Sands
Methane
forest fires (it’s live stuff that burns)
This is another good one, i.e. Combustion. Added under new category 11. Chemical – Reactions.
ocean surface albedo from algae
Added under 9. Albedo
Thank you for your very valuable input.
I am surprised justthefactswuwt doesn’t know how to convert TSI to global-average solar input. First you take a quarter of 1350 which is about 340 W/m2 which is the average value at the top of the atmosphere (see Kiehl and Trenberth energy diagram). Then you multiply by 0.7 which takes into account albedo to get the amount absorbed by the earth system, which leaves 240 W/m2. So the 0.1% variation of that is about 0.24 W/m2 as Tobis and izen say. This is the number to compare with 4 W/m2 forcing from doubling CO2.
Sorry about the misteak re CO2. Got my charts mixed up.☹ Izen and I have had our disagreements, but he can’t be wrong all the time. ☺
@-justthefactswuwt says:
July 2, 2011 at 7:11 am
“What is unidirectional climate change? Do you think that some portion of the increase in temperature between 1975 and 2005 might have been related to the PDO Warm Regime?”
Unidirectional climate change is driven by an energy imbalance. If the surface is consistently receiving less radiation than it is loosing to space then it cools until there is a close but dynamic balance between energy in and out.
The PDO phase may have been correlated with an increase in temperature between 1975 and 2005. But the 1LoT means it is restricted to energy storage, it can only affect the timing of any re-balancing of the energy budget.
Are you certain about the direction of causal relationship between a reified concept like the PDO and observational data?
“How did you arrive at an “average surface change” of “around 0.3W/m2 or 0.1% of the surface average total”? ”
Geometry.
The ‘top of atmosphere’ values are 1366 W/m2. with a 0.1% varience -~ 1.3W/m2
But the Earth surface is not a square metre, its a revolving sphere.
surface area of a disc = PIr2
Surface area of a sphere = 4PIr2
You are right that there is much in the literature that refers to the top of atmosphere figure, but it is most often qualified with the need to put it in context of the ACTUAL surface over which it falls.
It is fashionable to say the Earth’s climate system is “chaotic”, meaning that chaos theory applies. This is fashionable but untrue: chaos theory says that small perturbations in a complex system MAY have unforseen consequences. It does not say that there WILL be unforseen consequences.
As I detailed in a previous comment, geological history shows continuity with episodic shifts. Geologically this is called “punctuated equilibrium”. In a system that is truly ruled by chaos, the outcome, i.e. weather and climate, bounce around. Stability is only attained after a period of back-and-forths, until the controlling factor becomes well established. The Earth shows long periods in which the climate is cold or hot, CO2 rising after the warmth starts and going down after the cold starts. Regulatory systems are progressive, incremental and stable.
Schroninger’s cat may be confused about what might happen, and electrons may spin around the nucleus in a probabalistic way, but a herd of cats will surely swallow the inattentive bird and the baseball will land in the stands if hit in the right way. At a large scale the climate – like the cloud with its fractal topology – tends to observe the Laws of Momentum.
There are thresholds or tipping points in systems, obviously. Keystone species, once gone, like the buffalo or the Native Americans, show up as having has a huge impact on the biological systems around them. But biological systems feed by their nature on each other, and are therefore a bad analogy (though loved by the bio-philic, non-hard science warmist). The components of the atmosphere interact but don’t feed on each other. If, for example, CO2 were a keystone atmospheric element, a sudden kick into the atmosphere of huge amounts of it during the explosions Krakatoa or Tambora would have a long, solid and sustained effect on the planet. They do not have that impact. There is a sudden effect (cooling, actually) and then the previous style and detail of stability returns.
The world is indeed complex, as described. But most of them are like the passengers running around inside a train heading across the country. Regardless of the eating, drinking and fooling around in nefarious ways, the train is going to end up where it was originally headed for.
@- Doug Proctor says:
July 2, 2011 at 1:43 pm
“If, for example, CO2 were a keystone atmospheric element, a sudden kick into the atmosphere of huge amounts of it during the explosions Krakatoa or Tambora would have a long, solid and sustained effect on the planet. They do not have that impact. There is a sudden effect (cooling, actually) and then the previous style and detail of stability returns.”
The explosions Krakatoa or Tambora would have a long, solid and sustained effect on the planet IF they released significant amounts of CO2. The transient cooling effect is from the sulfur content of the erupted material. It alters albedo but has a short residence time.
Around 30 Gigatons of CO2 were released by buring fossil fuel in 2010.
The eruption of Tambora ejected an estimated 2 Gigatons of material in total. Krakatoa and Tambora were much smaller additions to the atmospheric CO2 than human activity.
You need something more like a Yellowstone super-volcano to erupt to exceed the annual contribution from anthropogenic sources.
“Michael Tobis finds a presumption of innocence to be a “peculiar” notion. No wonder he trusts the conclusions of an irresponsible and corrupt UN organization.”
The more I think about that one the more peculiar it gets. To make it explicit for those who don’t see the irony, why not presume IPCC innocent, along with the Royal Academy, the NAS, the AAAS, the AGU, the EGU, etc. etc.?
Someone mentioned that the ‘greenhouse effect’ should be covered.
“Solar” in the energy budget as the means of converting to heat the land and oceans of Earth refer to Visible and the two shortwaves either side, UV and Nr Ir. None of these is thermal, they are Light, not Heat. Heat is the thermal infrared we feel from the Sun, which is what warms us and the land and the oceans. We cannot feel Light as heat, because it’s not hot…
“Light”, “Solar”, “irradiance” cannot physically heat organic matter to create the AGWScience energy budget scenario. For example, light, the visible spectrum, is transmitted through water, it is not absorbed, it has no effect in water, it cannot heat it, water is transparent to visible light. The energy budget you all seem to be working to is a creation of AGWScience, not real world traditional science. Therefore, all your ‘calculations’ if you are using these figures are absolute nonsense. The AGWScience energy budget EXCLUDES thermal infrared.
Light energies should be properly described. That these are reflected, scattered, by the oxygen and nitrogen molecules of our atmosphere, which gives us our blue sky, transmitted through water, i.e. pass through, used in photosynthesis etc., are not thermal.
The Water Cycle – the link to the wiki page mentions, but a garbled sentence, that without the water cycle the Earth would be 67°C. This is the main greenhouse gas of the real greenhouse – our gaseous atmosphere of oxygen and nitrogen. This is cooling the Earth, AGWScience has reversed that in its promotion of its meme that greenhouse gases ‘warm the earth’. Water vapour is lighter than air, it always therefore rises, water has a very high capacity to store heat, in the water cycle heat is taken up and away from the surface.
Carbon dioxide – the Carbon Cycle needs to be included properly. It is heavier than air, therefore will always sink displacing air unless some work done to move it upwards, such as wind (which is a volume of air on the move). When water and carbon dioxide meet, they merge, always. Carbon dioxide and water in the atmosphere meeting become carbonic acid. Rain is carbonic acid. Every time it rains the carbon dioxide in the atmosphere is removed.
Carbon dioxide cannot accumulate in the atmosphere firstly because it is heavier than air so will always displace air and come to the ground unless something is moving it up, and all rain is carbonic acid, the natural wash cycle of the atmosphere which takes out dust and brings both water and carbon dixodide back to the ground where it is food for plant life and therefore for us; we are carbon life forms, 20% carbon, the rest mainly water. Plants take in carbon dioxide from the underside of their leaves , through stromata, except for such as water lilies which have their stromata on the top of the leaf. Carbon dioxide ‘accumulating’ in the atmosphere out of reach of ground level is physical nonsense, promoted by AGWScience against real traditional science.
http://www.aces.edu/pubs/docs/A/ANR-1229/
“Acid rain, or acid precipitation, refers to any precipitation that is more acidic (i.e., has a lower pH value) than that of normal rainwater. Carbon dioxide (CO2) in the atmosphere makes all rain slightly acidic because carbon dioxide and water combine to form carbonic acid., commonly known as carbonated water.”
All rain.
Re measuring carbon dioxide in the atmosphere – total rainfall could be used to this end.
Michael Tobis says:
“…why not presume IPCC innocent, along with the Royal Academy, the NAS, the AAAS, the AGU, the EGU, etc. etc.?”
For one of two reasons: they’re either opaque like the UN/IPCC, or they do not allow their rank-and-file membership to challenge their official positions. There is a bunker mentality shared by all of them. There can be no presumption of innocence when these organizations have so much to hide. The correct presumption is that they have been hijacked by groups with a CAGW agenda.
Since there is zero evidence of CAGW, they appear to be corrupted by activists, who fear and detest scientific transparency. Particularly the IPCC, which is completely beyond redemption because they dance to the tune played by Greenpeace, the WWF, etc. Only the most hopelessly naive would give them any credence this late in the game.
Ah, water on the brain, thinking of rain. The always in water and carbon dioxide merging is temp related, so at temp where rain forms, etc.
Well, for those not intent on being altogether silly, let me point out that Nobel chemist Mario Molina quoted on Shell scientist David Hone’s blog, thinks the whole business is pretty much cut and dry.
see http://blogs.shell.com/climatechange/2011/07/molina/
There’s also the briefest possible summary of the physics at that link. Those who don’t follow that are encouraged to keep digging at it until they do. Then maybe they can sensibly look for the more realistic approximation using calculus and multiple wavelengths, and then look into what it implies for our present circumstances.
But if you want to look into something else, maybe inertia-gravity waves or plate tectonics, first, have fun, but it won’t actually bear on the controversy very directly. Why not start where it starts and work from there?
http://www.ngdc.noaa.gov/stp/solar/solarirrad.html <- One rather large problem there. The site is missing a number, the cross sectional area of Earth in square meters.
Can't have that, it would make things too easy for ordinary people with calculators to multiply the solar "constant" (which ain't) by the number of square meters in Earth's cross section, thereby coming up with the extremely large number of Watts with which to swat anyone who pooh-pooh's the solar variation's influence on the climate by saying "It only varies by 1.3 watts per square meter so that's nothing!". 1.3 watts of "nothing" times how many billion?
@- Galane says:
July 2, 2011 at 7:21 pm
http://www.ngdc.noaa.gov/stp/solar/solarirrad.html <- One rather large problem there. The site is missing a number, the cross sectional area of Earth in square meters.
Can't have that, it would make things too easy for ordinary people with calculators to multiply the solar "constant" (which ain't) by the number of square meters in Earth's cross section, thereby coming up with the extremely large number of Watts with which to swat anyone who pooh-pooh's the solar variation's influence on the climate by saying "It only varies by 1.3 watts per square meter so that's nothing!". 1.3 watts of "nothing" times how many billion?
——————-
Ordinary people might know, or with present day education internet search, that the radius of the Earth is ~6,370km and the area of a circle is PIr2.
So the cross sectional area of Earth in square meters. is about –
127.5 thousand Billion square meters which at 1.3W/m2 gives ~
a little under 167 Thousand Billion Watts.
Of course the increased downwelling energy from the rising CO2 is also around 1.3W/m2
But that operates over the total surface area of the sphere of the Earth, or Four times the cross sectional area.
663 Thousand Billion Watts.
( I have a nagging suspicion that I may have dropped/gained a factor of ten somewhere I'd be happy to see someone check these figures!)
Jim D says: July 2, 2011 at 8:47 am
I am surprised justthefactswuwt doesn’t know how to convert TSI to global-average solar input. First you take a quarter of 1350 which is about 340 W/m2 which is the average value at the top of the atmosphere (see Kiehl and Trenberth energy diagram). Then you multiply by 0.7 which takes into account albedo to get the amount absorbed by the earth system, which leaves 240 W/m2. So the 0.1% variation of that is about 0.24 W/m2 as Tobis and izen say. This is the number to compare with 4 W/m2 forcing from doubling CO2.
According to PhysicalGeography.net, “as energy from the Sun passes through the atmosphere a number of things take place (see Figure 7h-1). A portion of the energy (26% globally) is reflected or scattered back to space by clouds and other atmospheric particles. About 19% of the energy available is absorbed by clouds, gases (like ozone), and particles in the atmosphere. Of the remaining 55% of the solar energy passing through the Earth’s atmosphere, 4% is reflected from the surface back to space. On average, about 51% of the Sun’s radiation reaches the surface. This energy is then used in a number of processes, including the heating of the ground surface; the melting of ice and snow and the evaporation of water; and plant photosynthesis.”
http://www.physicalgeography.net/fundamentals/7h.html
Based on these estimates, on average about 51% of the 1.3 Watts per square meter (W/m2) would reach the surface, thus on average .663 Watts per square meter (W/m2) of the energy would reach the surface.
I thought we had a consensus here, why is Trenberth’s estimate so much lower than the PhysicalGeography.net estimate?
izen says: July 2, 2011 at 9:51 am
Unidirectional climate change is driven by an energy imbalance. If the surface is consistently receiving less radiation than it is loosing to space then it cools until there is a close but dynamic balance between energy in and out.
This seems like a fuzzy construct, i.e. the direction varies based upon the structure of the imbalance.
The PDO phase may have been correlated with an increase in temperature between 1975 and 2005. But the 1LoT means it is restricted to energy storage, it can only affect the timing of any re-balancing of the energy budget.
Agreed, but there is a tremendous amount of energy stored in the oceans, e.g. “El Niño’s energy reserve is vast, almost inconceivable. It contains more energy than has been procured from all the fossil fuels burned in the United States since the beginning of the century – that’s all the gasoline in all the cars, the coal in all the power plants, the natural gas in all the furnaces. It would take more than a million large power plants, at 1,000 megawatts each, running full tilt for a year, to heat the ocean that much. Or if you want to think in more violent terms, that’s all the energy produced by about half a million 20 megaton hydrogen bombs, gone into heating water.”
http://www.pbs.org/wgbh/nova/elnino/anatomy/origins.html
and said re-balancings have a major impact on Earth’s Climate and Temperature when they occur.
Are you certain about the direction of causal relationship between a reified concept like the PDO and observational data?
There seems to be reasonable support for it within the literature, e.g.;
“The signature of the PDO is clearly evident in the wintertime surface climate record for much of North America, but not for that of the other continents. The strongest coefficients of wintertime air temperature regressed upon the PDO index are located in northwestern North America ( Fig. 3a, cf. Latif and Barnett 1994 Fig. 5b), with local maxima of opposing centers over south central Alaska/western Canada and the southeastern United States. The PDO is positively correlated with wintertime precipitation along the coast of the central Gulf of Alaska and over northern Mexico and south Florida, and negatively correlated with that over much of the interior of North America and over the Hawaiian Islands.”
http://www.atmos.washington.edu/~mantua/REPORTS/PDO/pdo_paper.html
“As is the case with ENSO, characteristic pressure, wind, temperature, and precipitation patterns have been connected with the PDO (Latif and Barnett 1995, Zhang et al 1997, Mantua et al. 1997). ”
“The North American climate anomalies associated with PDO warm and cool extremes are broadly similar to those connected with El Niño and La Niña (Latif and Barnett 1995, Latif and Barnett 1996, Zhang et al. 1997, Mantua et al. 1997). Warm phases of the PDO are correlated with North American temperature and precipitation anomalies similar to those correlated with El Niño (Figure 4): above average winter and spring time temperatures in northwestern North America, below average temperatures in the southeastern US, above average winter and spring rainfall in the southern US and northern Mexico, and below average precipitation in the interior Pacific Northwest and Great Lakes regions. Cool phases of the PDO are simply correlated with the reverse climate anomaly patterns over North America (not shown), broadly similar to typical La Niña climate patterns. The PDO-related temperature and precipitation patterns are also strongly expressed in regional snow pack and stream flow anomalies, especially in western North America (see Cayan 1995, Mantua et al. 1997, Bitz and Battisti 1999, Nigam et al. 1999). A summary of major PDO climate anomalies are listed in Table 1. ”
http://www.atmos.washington.edu/~mantua/REPORTS/PDO/PDO_cs.htm
“Interdecadal changes in Pacific climate have widespread impacts on natural systems, including water resources in the Americas and many marine fisheries in the North Pacific.”
http://www.springerlink.com/content/5xm9ngv5fn5dc2r7/
I wouldn’t say that I’m “certain”, but I am fairly confident the PDO influences Earth’s temperature in a similar manner as El Niño/La Niña does.
Geometry.
The ‘top of atmosphere’ values are 1366 W/m2. with a 0.1% varience -~ 1.3W/m2
But the Earth surface is not a square metre, its a revolving sphere.
surface area of a disc = PIr2
Surface area of a sphere = 4PIr2
What? Why? What role does Earth’s rotation, spherical shape and “Earth surface is not a square metre” play in the amount of solar radiation reaches the surface?
You are right that there is much in the literature that refers to the top of atmosphere figure
So you are agreeing that Michael Tobis’ statement that “nothing in the published literature indicates anything larger than 0.3 W/m^2 peak-to-peak solar variability on decadal-to-century time scales.” is in fact erroneous?
Michael Tobis – CFCs became a problem when the patent ran out. It can be difficult to grasp just how much misinformation is produced about our physical world by AGWScience, and for every statement made about any part of it a lot of aspects have to be looked at to realise, and to explain, just how corrupt, and deliberately so, the whole exercise is.
Carbon Dioxide ‘well-mixed’ and ‘accumulating in the atmosphere’ a case in point. I’ve given two real physical pieces of information which debunks this, (CO2 is heavier than the fluid gaseous atmosphere and so does not readily rise into the air, but will always spontaneously gravitate down to earth because it displaces the lighter nitrogen and oxygen molecules, whether one CO2 molecule or a whole bunch of them say from an erupting or venting volcano, and, that all rain is carbonic acid, that is, at cooler temperatures, carbon dioxide spontaneously combines with water so is being continually removed from the atmosphere in the Water Cycle). Another reason it is not well-mixed is that it is subject to the limitations of the movement of volumes of air, wind. Wind does not move from one hemisphere to the other, although there is some mixing at the equator the circulation patterns of wind, volumes of air moving, are limited to the hemisphere the volume is in. Basically, wind happens when volumes of air get hot, hot air rises because it is less dense than cold air and as it rises colder volumes of air above it move down below replacing the hotter air rising. Wind is not an invisible paddle stirring the atmosphere. The atmosphere is not in constant motion of ‘turbulence’ as AGWScience claims. Glacing outside, there is a little light breeze barely moving the tops of the tall trees around me, much of the time it is calm outdoors.
The other side to this is the reasons given by AGWScience by calling molecules of nitrogen, oxygen and carbon dioxide ideal gas. No real gas obeys ideal gas law, because, real gases have actual real volume, actual real weight relative to each other, actually interact with each other, etc. as above in forming carbonic acid, rain. Real molecules do not bounce off each other so thoroughly mixing as AGWScience claims. Carbon dioxide is a real molecule of gas which has real volume, it is not an imaginary ideal gas in an imaginary test tube. Neither do carbon dioxide molecules get dispersed by Brownian motion to mix throroughly in air as AGWScience also claims. Examples given such as ink mixing with water, or scent mixing through the air in a room, are examples of mixing by convection, not Brownian motion.
So you see, for every claim about the properties and processes in our physical world by AGWScience the debunking is not a simple task. It doesn’t matter to AGWScience that its claims are impossible in the real world, its only interest is to confuse and dumbdown the population into believing ‘whatever it says’ is ‘true’. Even when its own reasons contradict each other it is not bothered, as long as the memes get into mass consciousness it doesn’t care that the claims don’t make sense. But they don’t want this to be discussed by the masses being actively duped, so much of their ‘defence’ is geared to preventing discussion.
Re Mario Molina – bearing the above in mind, there are two very good posts on this page which will give you a clearer understanding of ozone and cfcs in the real world, and which hopefully will guide you back from the other side of the looking glass where one can believe any number of impossible things before breakfast and where AGWScience has set up shop. You can make your own judgement as to whether Molina is ignorant of real physics and real properties of molecules or is a deliberate peddler of misinformation for the entity AGWScience fiction.
See kmgur 03-15-02, 04:41 PM and Edufer 03-19002, 07:33 PM on http://www.sciforums.com/CFC-s-And-HCFC-s-t-6108.html
@- justthefactswuwt says:
July 3, 2011 at 2:04 am
“I wouldn’t say that I’m “certain”, but I am fairly confident the PDO influences Earth’s temperature in a similar manner as El Niño/La Niña does.”
The PDO and El Niño/La Niña variations are defined as certain patterns of physical observation, mostly of sea surface temperature, air pressure and ocean current directions.
It is circular to have the pattern of temperature/pressure/current direction values defined as the cause of … the pattern of temp/pressure/vector values.
The PDO is a value derived from measurement, it isn’t an active causal agent in its own right.
“What? Why? What role does Earth’s rotation, spherical shape and “Earth surface is not a square metre” play in the amount of solar radiation reaches the surface?”
I suspect other posts have clarified it better by now but I’ll try once more…
The 0.1% change in solar energy is measured in two contexts which give different values, but are the SAME solar variation.
For a square meter in space perpendicular to the Sun the solar variation is ~1.3W/m2 the 0.1% of 1366W/m2
But as you have pointed out a percentage of that is reflected and plays no further part in the energy balance.
But the inclination of the surface to the Sun also matters. For instance during a polar summer the sun never sets and the pole gets the full 1366W/m2 24hr a day.
But that 1366W is shining on FAR more than a square meter because the inclination of the Sun is so low.
Because the Earth is a rotating sphere each 1366W/m2 from the Sun is effectively spread over 4m2 of the Earths surface. Therefore the lower figure is 0.1% of the total solar energy per square meter of the Earths SURFACE.
Not a square meter perpendicular to the Sun above the atmosphere.
Bystander should appreciate that you might feel sick and see your doctor, but the state of medical science is still in many ways primeval. If you are ‘lucky’ you might have something the doc. understands but still might not be able to do anything about, like the common cold.. If you are unlucky it could well be an area that is poorly or not understood at all viz. some forms of cancer, MS, mental problems etc etc etc.
I’d say a bit like climate science.
This site might be useful if someone competent were to flag consensus-challenging items on a scale of a) genuine challenge to mainstream science – b) nitpicking or cherry-picking – c) misinformed – d) confused – e) crackpot.
I haven’t seen any examples in the first category but I’m not a regular reader. I suppose they are not impossible in principle. I see plenty of examples in the other categories. Usually nobody bothers to challenge them, since the name of the game is to challenge mainstream science. But the consequence is that most of the challenges are worthless. You need some mechanism to challenge the lousy ones and promote the good ones if you expect the scientific community to bother to engage in some manner other than didactic.
That said I support izen’s didactic effort to explain the factor of 4 in the astronomical vs earth science measures of the solar constant.. I have seen places you’d really expect to know better get confused about this. The solar constant referred to a square meter of space at the earth’s orbit is exactly one quarter of the solar constant referred to a square meter at the top of the atmosphere. This is because the cross section of a sphere has exactly a quarter of the area of the surface of the same sphere.
Greenhouse forcing only makes sense in the latter context, so to compare them you have to use the smaller value of solar constant. When somebody has put some effort into explaining it, you should do comparable work trying to understand it. Ignoring it or dismissing it contemptuously doesn’t bode well for actually making progress on understanding what is going on.
@- Myrrh says:
July 3, 2011 at 2:49 am
“Carbon Dioxide ‘well-mixed’ and ‘accumulating in the atmosphere’ a case in point. I’ve given two real physical pieces of information which debunks this, (CO2 is heavier than the fluid gaseous atmosphere and so does not readily rise into the air, but will always spontaneously gravitate down to earth because it displaces the lighter nitrogen and oxygen molecules, ”
The story that Galileo dropped a small and large cannonball from the Pisa belfry is probably fiction. But he did use a neat logical argument that all objects of different weights fall at the same speed.
CO2 doesn’t fall any faster than N2.
The molecules of gas are moving at around 500m/s or about a THOUSAND miles an hour. There is no way with those velocities you will get gases stratifying out by weight within the first few miles of the atmosphere. If they did… O2 heaver than N2, we would be walking in a few inches of CO2 and with our heads in pure oxygen!
A parallel would be to half fill a large box with a mix of tennis balls and baseballs, Shake vigorously to maintain an average velocity of the balls of ~1000 miles an hour.
Do you think that there will be more baseballs than tennis balls in the bottom half of the box?
Do you think that eventually they will separate if they are kept moving at those velocities?
The extent and timescale at which CO2 mixes into the global atmosphere was closely studied, not by ‘AGWscience’ but by the military tracking the excess C14 isotopes produced from above-ground nuclear tests. They had an interest in how radioactive fallout might spread. The nuclear test C14 went global within 4 years and is still being rained out
Pat Frank says:
June 30, 2011 at 4:26 pm
Unless, perhaps, the ultraviolet radiation is ionizing and produces a significant flux of electrons and cation radicals in the upper atmosphere. Cation radicals, as we all know from cloud chamber effects, can produce condensation nuclei and induce clouds. Slides 2 and 3 in the link show that both cation radicals and the freed electron can produce independent cascades of droplet nucleation. Nature is full of cascades produced by small initial perturbations.
—
The usual loose verbiage: “upper atmosphere” meaning what? UV is absorbed in the stratosphere where there is very little water vapor
======
Siliggy says:
June 30, 2011 at 8:24 pm
Also The heat from radioactive decay does not seem to be counted in any of the radiative balance charts. is it about 0.8 W/M^2?
The radioactive decay does not change on time scales of interest, so is not relevant to the climate change debate. Apart from the fact that you overstate the amount; it is only 0.08 W/m2 [ten times less].
======
Alexander Feht says:
June 30, 2011 at 8:21 pm
Very useful list, clearly demonstrating the unbelievable arrogance and ignorance of IPCC.
And of many posters at WUWT.
2) Special references to Dr. Svalgaard’s opinions are unnecessary; they don’t deserve any special consideration or exposure.
And what do you bring to the table? But, you are right, my opinion is just my opinion, like anyone else’s. Ignore it if you like, but don’t tell others what to do.
======
justthefactswuwt says:
July 3, 2011 at 1:03 am
Based on these estimates, on average about 51% of the 1.3 Watts per square meter (W/m2) would reach the surface, thus on average .663 Watts per square meter (W/m2) of the energy would reach the surface.
I thought we had a consensus here, why is Trenberth’s estimate so much lower than the PhysicalGeography.net estimate?
Of the 342 W/m2 available, 168 W/m2 = 49% is absorbed by the surface. You are off by some factor of 1000 or 1000/4, so it is not clear what you mean.
======
izen says:
July 3, 2011 at 4:16 am
But that 1366W is shining on FAR more than a square meter because the inclination of the Sun is so low.
Because the Earth is a rotating sphere each 1366W/m2 from the Sun is effectively spread over 4m2 of the Earths surface. Therefore the lower figure is 0.1% of the total solar energy per square meter of the Earths SURFACE.
Why is this even being discussed?
“Surface area of a sphere = 4PIr2”
That is all good except the distance from pole to pole is shorter than the diameter at the equator.
So to divide TSI by four is wrong.
“But the inclination of the surface to the Sun also matters. For instance during a polar summer the sun never sets and the pole gets the full 1366W/m2 24hr a day.
But that 1366W is shining on FAR more than a square meter because the inclination of the Sun is so low.”
To complicate this even further Albedo would be increased by the angle of incidence change. Stand up close to the end of a window and look at the reflection from an angle.
Now this gets interesting with the TSI spectoral change because the critical point and refractive index shift with wavelength. So the solarcycle spectoral shift would change the effective albedo more at the poles than at the equator. Note this is not an effect due to the Change in TSI but due soley to the spectoral shift. If the TSI were to not change at all but there was only a spectoral shift there would still be a change in effective albedo due to the change in the amount of reflection at angle.
http://en.wikipedia.org/wiki/Fresnel_equations
http://en.wikipedia.org/wiki/Refractive_index
moptop says: June 30, 2011 at 5:27 pm
I would have pointed out that the Milankovitch cycles never exactly repeat, as the moon is slowly moving away from the earth.
Yep, I added the following note under the reference to Milankovitch cycles;
“Also of note over very long time frames, “the Moon is spiraling away from Earth at an average rate of 3.8 cm per year”;
http://en.wikipedia.org/wiki/Lunar_distance_%28astronomy%29
http://curious.astro.cornell.edu/question.php?number=124”
and I also added a note at the bottom of the Earth’s Rotation section:
“Also of note, “Over millions of years, [Earth’s] rotation is significantly slowed by gravitational interactions with the Moon: see tidal acceleration.
http://en.wikipedia.org/wiki/Tidal_acceleration
“The presence of the moon (which has about 1/81 the mass of the Earth), is slowing Earth’s rotation and lengthening the day by about 2 ms every one hundred years.”
“However some large scale events, such as the 2004 Indian Ocean earthquake, have caused the rotation to speed up by around 3 microseconds.[21] Post-glacial rebound, ongoing since the last Ice age, is changing the distribution of the Earth’s mass thus affecting the Moment of Inertia of the Earth and, by the Conservation of Angular Momentum, the Earth’s rotation period.”
http://en.wikipedia.org/wiki/Earth%27s_rotation”
Thank you.
Steve C says: June 30, 2011 at 4:39 pm
I’d like to add mention that many, if not most or all, of the oscillations mentioned in “Gravitation” are probably also synchronised by resonance effects of the whole terrestrial system (honourable mention here of the ‘Stadium wave’ which suggests how the energy may transfer between the different oscillations). I also suspect related resonsnce influences in both solar system and solar data – after all, the whole system has had plenty of time to fall into ‘sync’, and we know that weather is broadly cyclical.
Willie Soon;
http://en.wikipedia.org/wiki/Willie_Soon
presented an interesting hypothesis at ICCC on Friday that many of the cycles we see in Earth’s climate correlate well with cycles in orbital configurations, which makes sense intuitively, because, over the long term, tidal forces;
http://en.wikipedia.org/wiki/Tidal_force
do seem to play an important role in Earth’s climate system, e.g.
“With the culmination of the 18.6-year cycle of the Moon in 2006 and again in 2024-25, also called the Major Lunar Standstill, we are afforded the unique opportunity to observe the monthly, annual, and 18.6-year wanderings of the Moon. The 18.6-year cycle is caused by the precession of the plane of the lunar orbit, while this orbit maintains a 5° tilt relative to the ecliptic. At the peak of this cycle, the Moon’s declination swings from -28.8° to +28.8° each month. What this means is that each month for the years 2005-2007 and also 2023-2026, the Moon can be seen rising and setting more northerly and also more southerly than the solar extremes, and will transit monthly with altitudes which are higher in the sky than the summer Sun and lower in the sky than the winter Sun.”
http://www.umass.edu/sunwheel/pages/moonteaching.html
“Lunar cycles are varied and extremely complex and yet the moon has more effect on the earth than any other body except the Sun. Not only are ocean tides important in shaping the earth, and are affected more by the moon than the Sun, but tides in the air are important for determining the weather which in turn affects so many other variables from plants and crops, to animals and the economy.”
“As was mentioned the 18.6 year cycle is important in determining the weather as is half of this, or 9.3 years. These cycles can be found in crop yields and in geological formations. However the moon is gradually receding from the earth which changes all of these periods very slowly. Professor Afanasiev of Moscow University has designed a method that he calls “Nanocycles method” of very accurately dating geological formations by finding the period which is presently 9.3 years and its interaction with the seasons. The 9.3 year cycle comes at the same time of year on average every 31 years because 9.3/.3 = 31. The nearest repeat of the seasons will actually happen after 28 years 2/3 of the time and 37 years 1/3 of the time. However this 31 years cyle of seasonal interaction of the is very sensitive to small changes because when the cycle was 9.2 years the interaction was in 9.2/.2 = 46 years. Professor Afanasiev has used this to accurately date deposits and so determine other geological cycles very accurately.”
http://www.cyclesresearchinstitute.org/cycles-astronomy/lunar.shtml
Science, “18.6-Year Earth Tide Regulates Geyser Activity” by John S. Rinehart, 1972
http://adsabs.harvard.edu/abs/1972Sci…177..346R
Journal of Geophysical Research, “The 18.6-Year Cycle of Sea Surface Temperature in Shallow Seas Due to Variations in Tidal Mixing” by John W. Loder and Christopher Garrett, 1978:
http://www.agu.org/pubs/crossref/1978/JC083iC04p01967.shtml
Journal of Geophysical Research, “PERIODIC (18.6-YEAR) AND CYCIJC (11-YEAR) INDUCED DROUGHT AND FLOOD IN WESTERN NORTH AMERICA” by Robert Guinn Currie, 1984:
http://www.agu.org/journals/ABS/1984/JD089iD05p07215.shtml
Climatic Change “Reconstruction of seasonal temperatures in Central Canada since A.D. 1700 and detection of the 18.6- and 22-year signals” by Joel Guiot 1987:
http://www.springerlink.com/content/q76vw37g22557105/
International Journal of Climatology “18.6-year luni-solar nodal and 10–11-year solar signals in rainfall in India”, by Kumares Mitra and S. N. Dutta, 1992:
http://onlinelibrary.wiley.com/doi/10.1002/joc.3370120807/abstract
Journal of Geophysical Research, “High-Latitude Oceanic Variability Associated With the 18.6-Year Nodal Tide” by Thomas C. Royer, 1993:
http://www.agu.org/journals/ABS/1993/92JC02750.shtml
International Journal of Climatology, “Luni-solar 18.6- and solar cycle 10–11-year signals in USA air temperature records” by Robert G. Currie, 1993:
http://onlinelibrary.wiley.com/doi/10.1002/joc.3370130103/abstract
IBM Research Center “Moon-Earth-Sun: The oldest three-body problem” by Martin C. Gutzwiller, 1998:
http://rmp.aps.org/abstract/RMP/v70/i2/p589_1
Earth, Moon, and Planets “Lunar Influences On Climate” by Dario Camuffo, 2001:
http://www.springerlink.com/content/nq3376562761675r/
American Meteorological Society “Millennial Climate Variability: Is There a Tidal Connection? by Walter Munk, Matthew Dzieciuch and Steven Jayne, 2002:
http://journals.ametsoc.org/doi/abs/10.1175/1520-0442%282002%29015%3C0370%3AMCVITA%3E2.0.CO%3B2
Geophysical Research Letters “The impacts of the Luni-Solar oscillation on the Arctic oscillation” by Renato Ramos da Silva and Roni Avissar, 2005:
http://www.duke.edu/~renato/RamosdaSilvaandAvissarGRL2005.pdf
Geophysical Research Letters “Possible explanation linking 18.6-year period nodal tidal cycle with bi-decadal variations of ocean and climate in the North Pacific” by
Ichiro Yasuda, Satoshi Osafune and Hiroaki Tatebe, 2006:
http://www.agu.org/pubs/crossref/2006/2005GL025237.shtml
Journal of Geophysical Research “The 18.6-year lunar nodal cycle and surface temperature variability in the northeast Pacific” by Stewart M. McKinnell and William R. Crawford, 2007:
http://www.agu.org/pubs/crossref/2007/2006JC003671.shtml
Deep Sea Research Part I: Oceanographic Research Papers “Lunar nodal tide effects on variability of sea level, temperature, and salinity in the Faroe-Shetland Channel and the Barents Sea” by Harald Yndestad, William R. Turrell and Vladimir Ozhigin, 2008:
http://adsabs.harvard.edu/abs/2008DSRI…55.1201Y
Nature Geoscience “Significant contribution of the 18.6 year tidal cycle to regional coastal changes” by N. Gratiot, E. J. Anthony, A. Gardel, C. Gaucherel, C. Proisy & J. T. Wells, 2008:
http://www.nature.com/ngeo/journal/v1/n3/abs/ngeo127.html
Deep Sea Research Part II: Topical Studies in Oceanography “The influence of long tides on ecosystem dynamics in the Barents Sea” by Harald Yndestad, 2009:
http://adsabs.harvard.edu/abs/2009DSR….56.2108Y
With this said, I don’t have a good source for this one yet. Once Willie’s presentation and eventually paper become available I’ll add them under 3. Gravitation: System Resonance, unless someone’s got a better name for it
Thank you for your thoughts.
Leif Svalgaard says:
“Apart from the fact that you overstate the amount; it is only 0.08 W/m2 [ten times less].”
Yes 0.08 sorry!
“The radioactive decay does not change on time scales of interest,…”
Are we sure about that?
http://news.stanford.edu/news/2010/august/sun-082310.html
Leif Svalgaard says: July 3, 2011 at 12:06 pm
“justthefactswuwt says: July 3, 2011 at 1:03 am
Based on these estimates, on average about 51% of the 1.3 Watts per square meter (W/m2) would reach the surface, thus on average .663 Watts per square meter (W/m2) of the energy would reach the surface.”
Of the 342 W/m2 available, 168 W/m2 = 49% is absorbed by the surface. You are off by some factor of 1000 or 1000/4, so it is not clear what you mean.
Somehow I’ve allowed myself to be dragged into a stupid discussion on how much of the “approximately 0.1% or about 1.3 Watts per square meter (W/m2)” 11 year cycle variation in solar radiation that’s “received at the outer surface of Earth’s atmosphere”, makes it through to Earth’s surface. It seems like a pointless exercise as the atmosphere introduces so many additional variables as to make the resultant estimate unnecessarily imprecise. Given that the 11 year cycle variation of about 1.3 Watts per square meter (W/m2) at the outer surface of Earth’s atmosphere isn’t sufficient to have a large influence on Earth’s temperature, it seem pointless to try to estimate and use the smaller and less precise number at surface level. What do you think?
justthefactswuwt says:
July 3, 2011 at 3:33 pm
Given that the 11 year cycle variation of about 1.3 Watts per square meter (W/m2) at the outer surface of Earth’s atmosphere isn’t sufficient to have a large influence on Earth’s temperature, it seem pointless to try to estimate and use the smaller and less precise number at surface level. What do you think?
We don’t even know the albedo well enough for this to matter. To first order, what reaches the surface will scale with what comes from the sun. Just do the calculation in percent and the problem goes away: dTSI/TSI =0.1% and dT/T = 0.1/4%. The 4 is from S-B law, not spherical Earth. So with dT/T = 0.025% of 288K we get dT = 0.072 K
izen says: July 3, 2011 at 4:16 am
The PDO and El Niño/La Niña variations are defined as certain patterns of physical observation, mostly of sea surface temperature, air pressure and ocean current directions.
“The PDO index is calculated from sea surface temperatures and sea level pressures.”
http://www.appinsys.com/GlobalWarming/PDO.htm
“The El Nino / Southern Oscillation (ENSO) is an oceanic / atmospheric oscillation of the equatorial Pacific / southern Pacific. Various indexes have been derived from measurements in the area.”
http://www.appinsys.com/GlobalWarming/ENSO.htm
It is circular to have the pattern of temperature/pressure/current direction values defined as the cause of … the pattern of temp/pressure/vector values.
The PDO is a value derived from measurement, it isn’t an active causal agent in its own right.
The causes of ocean circulation and oceanic oscillations are reasonably well known, if you look at the bottom of the WUWT Ocean Oscillation Page;
http://wattsupwiththat.com/reference-pages/oceanic-oscillation/
you’ll see that a summary of the key variables involved in Ocean Circulation. Regardless of the exact cause of the PDO cycle, this chart;
http://www.climate4you.com/images/PDO%20AnnualIndexSince1900%20With7yearRunningAverage.gif
seems to indicate that we are entering a PDO Cold Regime, and are in for an extended stay. This graphic;
http://www.appinsys.com/GlobalWarming/PDO_files/image002.jpg
provides a good comparative visual of the difference in Pacific Sea Surface Temperatures during Cold and Warm PDO Regimes.
Do you think that some portion of the increase in temperature between 1975 and 2005 might have been caused by oceanic circulations and cycles, as indicated by the increase the Sea Surface Temperature that occurred during the PDO Warm Regime?
I suspect other posts have clarified it better by now but I’ll try once more…
The 0.1% change in solar energy is measured in two contexts which give different values, but are the SAME solar variation.
For a square meter in space perpendicular to the Sun the solar variation is ~1.3W/m2 the 0.1% of 1366W/m2
But as you have pointed out a percentage of that is reflected and plays no further part in the energy balance.
But the inclination of the surface to the Sun also matters. For instance during a polar summer the sun never sets and the pole gets the full 1366W/m2 24hr a day.
But that 1366W is shining on FAR more than a square meter because the inclination of the Sun is so low.
Because the Earth is a rotating sphere each 1366W/m2 from the Sun is effectively spread over 4m2 of the Earths surface. Therefore the lower figure is 0.1% of the total solar energy per square meter of the Earths SURFACE.
Not a square meter perpendicular to the Sun above the atmosphere.
I don’t understand the point of this exercise. I agree that the .1% variation in TSI during the solar cycle is not a significant factor in the warming between 1975 – 2005, from wherever you want to measure it. I want your opinion of whether the Ocean Circulation/Cycles might be a significant factor in the global warming that occurred between 1975 – 2005 and what it might portend for the next 25 – 30 years…
Michael Tobis says:
July 1, 2011 at 7:25 pm
> If CO2 perturbation decay time were short, CO2 concentrations would go down during a recession.
China is now the largest CO2 emitter by country. They didn’t have a recession, I don’t know if their growth rate slowed down.
One thing that was interesting at ICCC #6 is the disagreement about CO2 dwell time in the atmosphere. Alan Carlin didn’t talk about it, but I read his recent paper on the way down. His review of the literature left him convinced the dwell time is short. Some people at the ICCC said the dwell time is long.
Either way, I’m not too concerned. The key thing, CO2 feedback (plus H2O) appears greatly overstated. I talked to one scientist who expects to have a paper out soon adding to that theme.
izen says:
July 3, 2011 at 11:53 am
The story that Galileo dropped a small and large cannonball from the Pisa belfry is probably fiction. But he did use a neat logical argument that all objects of different weights fall at the same speed. CO2 doesn’t fall any faster than N2.
The molecules of gas are moving at around 500m/s or about a THOUSAND miles an hour. There is no way with those velocities you will get gases stratifying out by weight within the first few miles of the atmosphere. If they did.. O2 heavier than N2, we would be walking in a few inches of CO2 and with our heads in pure oxygen!
Sigh. You’re imagining our real atmosphere to be an ‘ideal gas atmosphere’ – as if it’s empty space with molecules zipping around at great speeds through it, bouncing off each other and so ‘mixing thoroughly’, etc. . “Real” and ideal” are technical terms in physics when referring to gases. The ideal gas is an imaginary construct, no real gas is like an ideal gas nor does any real gas obey ideal gas law. You need to look up the difference, but you need to be vigilant, AGWScience takes bits of descriptions from physics and mixes and mismatches, takes out of context. You are giving an AGWScience description of our atmosphere because it says that nitrogen, oxygen and carbon dioxide are ideal gases, but they’re not, they are real. Real gases have volume, etc. Our atmosphere is not empty space with tiny hard dots with no volume travelling at these vast speeds through it bouncing off other molecules also travelling through empty space at these vast speeds..
How does sound travel in your world?
You’ll need to get to grips with volume and the rest. Now, I don’t know if the first of these links is written by someone who knows the difference and is being disingenuous or just repeating an AGWScience meme, much as you’ve given an AGWScience standard meme response about speed and stratification into layers, it doesn’t matter here, the important thing is to note where it has been done.
That is a fib. It’s taken direct from ideal gas description, and doesn’t relate at all to real gases which have attractive force.
This is where, how, AGWScience has taken its description of gas molecules and pretends that this is a description of real gas molecules in our real world. That heading should include the word “Ideal”. As here:
[The last sentence is where AGWScience refers back to in its emphasis on radiation as the means of heat transfer and avoids mention of convection which requires an understanding of real volume and why AGW supporters think that the only effect of electromagnetic waves is to create heat, so have great difficulty understanding that the “Solar” energies such as Visible can’t actually heat water, but think that because blue light penetrates further in the ocean it is heating the ocean.]
Anyway, although it appears the first piece is making a distinction between ideal and real gases, it isn’t, it is saying that this is a description of Gases, but this is a description of Ideal Gas. Which is purely imaginary and comes from the beginning of first exploration into such things. The article gives the appearance of being about real gases, but these AGW memes are slipped in so the difference is not obvious, but hidden, he is mixing and taking out of context.. Especially because he gives the history of the named originators he gives the appearance of covering the subject, but, he has missed one out.
Now, you have to bear in mind as I said earlier, that AGWScience does not have any internal consistency in its ‘science’, it cherry picks and is perfectly happy to use conflicting ideas as it is to use ideal gas properties for real gases by taking descriptions out of context as here in the first link and from which you get your picture of our atmosphere as empty space with all these molecules speeding through it at great speeds. Not all energy creates heat in interactions, the ideal gas laws are wrongly applied to the real world..
Our atmosphere is a real gaseous volume of Air, gases and liquids are fluids so what we have pressing down on us at around a ton per sq ft is a heavy fluid, not empty space. It is volumes of this fluid moving around which is the way heat is transferred through convection in our real atmosphere and which in turn gives us ‘wind’; when a volume of this fluid is heated and becoming less dense rises into colder volumes above it, the heavier denser volumes displace the lighter volumes, what we feel as wind. Wind is volumes of the gas Air on the move. These do not cross over from one hemisphere to the other, although there is some mixing at the equator, but follow basic circulation patterns within their own hemispheres.
One description I read to get the ‘feel’ of this our real atmosphere. Imagine standing at the bottom of a swimming pool with 10′ of water above you, now go out into the middle of a field – the atmosphere of the fluid gas Air above us is like that. A ton of it on our shoulders. “Half of the Earth’s atmosphere is squashed down into the first 3 miles above, 90% is squashed into the first 10 miles. Above 10 miles the air is so thin that the pressure is less than the best vacuums on the surface of the earth.” Sorry, missing source for that. It is not empty space.
That there is ’empty’ space between molecules means that gases can be compressed, the high and low pressures we feel in our atmosphere. If it were really empty space with volumeless molecules zipping through it we would have no sound. We have sound because the weight of that volume under gravity stops molecules from zipping through it. They may well be moving at great speeds, but they’re going nowhere fast.
Sound is passed through the fluid Air as waves are passed through the ocean, the Air doesn’t move as wind, but the energy from the sound causes the molecules of the volume Air to vibrate and knock into the molecules around it causing them to vibrate and that vibration is passed along through the air. When they stop vibrating they’re still where they started.
Now, within all that. Molecules of nitrogen and oxygen are practically the same weight, together the combination gas Air. Making up practically 100% of our atmosphere, dry weight, apart from water vapour the rest are trace gases. Water vapour is a gas, it is lighter than the gas air, it always rises in air, evaporation. So too, heavier gases sink in air. Carbon dioxide is one and a half times heavier than air, it sinks, displacing air.
Whether one molecule or a bunch of them together, heavier than air gases will sink and lighter than air gases will rise.
In mines methane is a hazard, it used to be tested for in a new mine by sending someone in covered in wet towels and carrying a lit candle on a long pole – because lighter than air methane pools at the ceilings. Careful if you’re invited to a pss-up in a brewery, that you don’t fall asleep on the floor next to open vats of beer brewing… Large amounts of carbon dioxide will displace the lighter oxygen and suffocate you. A hazard around active volcanoes venting, because it will gather in a layer in hollows, until dispersed by something acting on it to move it such as wind. It cannot diffuse into air of its own volition as if it were an ideal gas.
Gary D. says:
June 30, 2011 at 5:39 pm (Edit)
Please pardon a probably really dumb question, but this is something that has been bugging me for a while. The ENSO Sea Surface Temperature graphic here .
http://www.osdpd.noaa.gov/data/sst/anomaly/anomnight.current.gif
So then is it Vorticity that makes the SST leave the wake pattern that it does in the oceans? The speed of rotation at the poles versus the speed of rotation at the equator and the speed of rotation at deeper depths versus the speed of rotation at the surface, along with the ocean currents, that causes changes in various water temperatures.
It’s a good question. If you watch the Equatorial Pacific in this 1 year Sea Surface Temperature animation as the La Nina takes hold last year;
http://www7320.nrlssc.navy.mil/global_ncom/anims/eqp/sst12m.gif
you’ll see curling. This curling is also apparent in the same location in this 1 year Sea Surface Salinity animation:
http://www7320.nrlssc.navy.mil/global_ncom/anims/glb/sss12m.gif
This curling motion would seem consistent with the configuration of these vorticity diagrams, but not of their location:
http://oceanworld.tamu.edu/resources/ocng_textbook/chapter12/Images/Fig12-5.htm
Whether or not these features are caused by Planetary Vorticity or Relative Vorticity;
http://oceanworld.tamu.edu/resources/ocng_textbook/chapter12/chapter12_01.htm
I am not sure. We know that planetary vorticity is a major player in ocean circulation;
“12.4 Important Concepts
1. Vorticity strongly constrains ocean dynamics.
2. Vorticity due to Earth’s rotation is much greater than other sources of vorticity.
3. Taylor and Proudman showed that vertical velocity is impossible in a uniformly rotating flow. The ocean is rigid in the direction parallel to the rotation axis. Hence Ekman pumping requires that planetary vorticity vary with latitude. This explains why Sverdrup and Stommel found that realistic oceanic circulation, which is driven by Ekman pumping, requires that f vary with latitude.
4. The curl of the wind stress adds relative vorticity to central gyres of each ocean basin. For steady state circulation in the gyre, the ocean must lose vorticity in western boundary currents.
5. Positive wind stress curl leads to divergent flow in the Ekman layer. The ocean’s interior geostrophic circulation adjusts through a northward mass transport.
6. Conservation of absolute vorticity in an ocean with constant density leads to the conservation of potential vorticity. Thus changes in depth in an ocean of constant density requires changes of latitude of the current.”
however, per numbers 4 and 5, relative vorticity might also be the cause of the equatorial features.
There is an Equatorial Bulge; (Added under 1. Rotational Energy)
http://en.wikipedia.org/wiki/Equatorial_bulge
that is a result of Earth’s rotation, however Planetary Vorticity “is greatest at the poles where it is twice the rotation rate of Earth. Note that the vorticity vanishes at the equator and that the vorticity in the southern hemisphere is negative because φ is negative.”
http://oceanworld.tamu.edu/resources/ocng_textbook/chapter12/chapter12_01.htm
The University of Miami’s Cooperative Institute for Marine and Atmospheric Studies CIMAS has great site that is cataloging all of the surface currents;
http://oceancurrents.rsmas.miami.edu/
with a great level of detail for various geographic regions;
http://oceancurrents.rsmas.miami.edu/atlantic/north-equatorial.html
unfortunately they haven’t had the time and resources to study the Pacific yet:
http://oceancurrents.rsmas.miami.edu/pacific/pacific.html
I hope this helps to answer your question.
Myrrh says:
July 3, 2011 at 8:57 pm
Sigh. You’re imagining our real atmosphere to be an ‘ideal gas atmosphere’ – as if it’s empty space with molecules zipping around at great speeds through it, bouncing off each other and so ‘mixing thoroughly’,
double sigh. The air is to a very high approximation an ideal gas. Even near the center of the sun where the density is ten times that of lead, the material is very nearly an ideal gas. Your ideas about this are as wrong as they can be. Amazing that there are people out there who can be so wrong while pretending to know anything at all.
zen says:
July 2, 2011 at 5:03 pm
You are right on this: Tambora, at 2 Pg doesn’t equate to current rates of about 31 Pg/yr. My argument is weak here.
The climate does not appear to be unstable, however that lack of evidence is not evidence of a lack of instability, I grant you. Tornadoes are probably a good example of chaos theory in action: a buildup with little happening, a sudden burst of terrific change and activity and a very sudden end. A hurricane seems less of an example, as the process is incremental and progressive, and once started drifts away rather than stops abruptly. Weather systems and the climate are even longer term. progressive and incremental things.
CO2 as CAGW is positioned as a keystone gas with sudden, large and unexpected temperature effects. Temperature events are certainly sudden and unexpected, but going up and down don’t seem to be well correlated with CO2 changes. I understand the if A then B, if B not necessarily A problem with CO2 and temperature changes. But so far the temperature changes are slow, incremental and progressive, and less than the worrisome levels by the IPCC. If CO2 is not a keystone gas with a Mandelbrot chaotic nature, then the CAGW worry is untenable.
The evidence so far is not observational, but modelling. If we could agree to that, then what would be left is the argument about how much the Precautionary Principle should be applied. But since the science is “settled” and the outcome “certain” we cannot do that. Yet that is the crux: does CO2 additions to the atmosphere at 2 ppmv/yr from 392 to 560 or more trigger some detrimental and radical temperature change? So far the evidence says “no”. When does this threshold event occur? The IPCC model says there is a multiplier effect, but so far we are not seeing anything out of the historical mode if a 60-year cyclicity is allowed.
I see that by 2015 the difference between the IPCC warmist theories and the skeptics will be large enough and the trends going in the opposite directions long enough to determine if one is broken or at least sufficiently weakened for the CAGW threat to go away or – perish the thought – be about to bite our butts.