By WUWT regular “Just The Facts”
I am often amused by claims that we understand Earth’s climate system, are able to accurately measure its behavior, eliminate all potential variables except CO2 as the primary driver of Earth’s temperature and make predictions of Earth’s temperature decades into the future, all with a high degree of confidence. I have been studying Earth’s climate system for several years and have found it to be a ridiculously complex, continually evolving and sometimes chaotic beast. Furthermore, our understanding of Earth’s climate system is currently rudimentary at best, our measurement capabilities are limited and our historical record is laughably brief. To help demonstrate the complexity of Earth’s climate system I have been compiling a list of all of the variables potentially involved in Earth’s climate system. This is a work in progress so additions, recommendations, corrections, questions etc. are most welcome. Once I develop this further and polish it up a bit I plan to convert it into a new WUWT Reference Page.
UPDATED: This list has undergone significant revisions and improvements based upon crowdsourcing the input of an array of very intelligent and knowledgeable contributors below. Additionally, this list was posted in comments in WUWT a few times previously, receiving input from a number of other very intelligent and knowledgeable contributors. This thread, along with links to the precursor threads below, will thus serve as the bibliography for the forthcoming WUWT Potential Climatic Variables reference page (unless someone can up with a better name for it…:)
1. Earth’s Rotational Energy;
http://en.wikipedia.org/wiki/Rotational_energy
http://en.wikipedia.org/wiki/Earth%27s_rotation
http://www.physicalgeography.net/fundamentals/6h.html
results in day and night;
http://wiki.answers.com/Q/Why_does_rotation_cause_day_and_night
causes the Coriolis Effect;
http://en.wikipedia.org/wiki/Coriolis_effect
imparts Planetary Vorticity on the oceans;
http://oceanworld.tamu.edu/resources/ocng_textbook/chapter12/chapter12_01.htm
and manifests as Ocean Gyres;
http://en.wikipedia.org/wiki/Ocean_gyre
the Antarctic Circumpolar Current;
http://en.wikipedia.org/wiki/Antarctic_Circumpolar_Current
http://en.wikipedia.org/wiki/File:Conveyor_belt.svg
Arctic Ocean Circulation;
http://www.whoi.edu/page.do?pid=12455&tid=441&cid=47170&ct=61&article=20727
http://www.john-daly.com/polar/flows.jpg
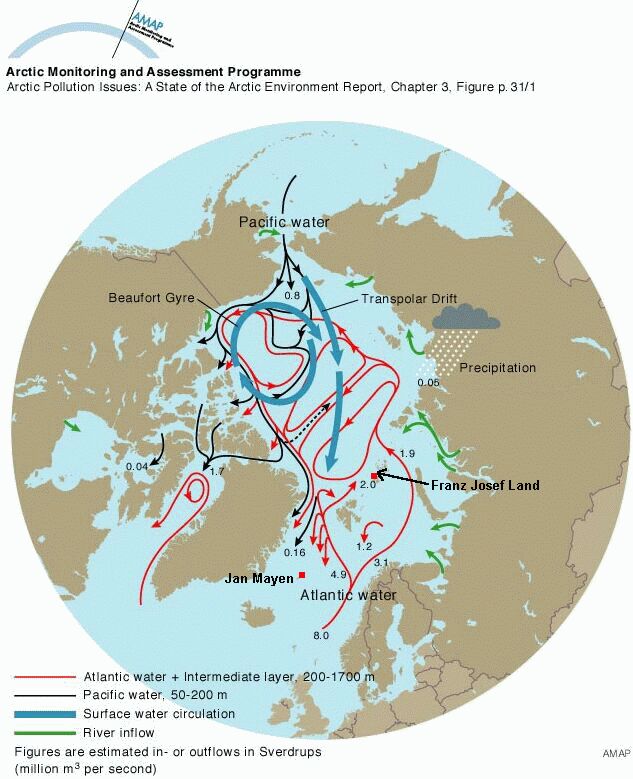
can result in the formation of Polynya;
http://en.wikipedia.org/wiki/Polynya
and causes the Equatorial Bulge:
http://en.wikipedia.org/wiki/Equatorial_bulge
Earth’s Rotational Energy influences Atmospheric Circulation;
http://en.wikipedia.org/wiki/Atmospheric_circulation
including the Jet Stream;
http://en.wikipedia.org/wiki/Jet_stream
Westerlies;
http://en.wikipedia.org/wiki/Westerlies
Tradewinds;
http://en.wikipedia.org/wiki/Trade_wind
Geostrophic Wind;
http://en.wikipedia.org/wiki/Geostrophic_wind
Surface Currents;
http://www.windows2universe.org/earth/Water/ocean_currents.html h
http://en.wikipedia.org/wiki/Ocean_current
through Ekman Transport;
http://en.wikipedia.org/wiki/Ekman_transport
http://oceanmotion.org/html/background/ocean-in-motion.htm
Tropical Cyclones;
http://en.wikipedia.org/wiki/Tropical_cyclone
Tornadoes:
http://en.wikipedia.org/wiki/Tornado
and Polar Vortices;
http://en.wikipedia.org/wiki/Polar_vortex
which “are caused when an area of low pressure sits at the rotation pole of a planet. This causes air to spiral down from higher in the atmosphere, like water going down a drain.”
http://www.universetoday.com/973/what-venus-and-saturn-have-in-common/
Here’s an animation of the Arctic Polar Vortex in Winter 2008 – 09:
When a Polar Vortex breaks down it causes a Sudden Stratospheric Warming:
http://en.wikipedia.org/wiki/Sudden_stratospheric_warming
Earth’s Rotational Energy influences Plate Tectonics;
http://en.wikipedia.org/wiki/Plate_tectonics
“By analyzing the minute changes in travel times and wave shapes for each doublet, the researchers concluded that the Earth’s inner core is rotating faster than its surface by about 0.3-0.5 degrees per year.
That may not seem like much, but it’s very fast compared to the movement of the Earth’s crust, which generally slips around only a few centimeters per year compared to the mantle below, said Xiaodong Song, a geologist at the University of Illinois at Urbana-Champaign and an author on the study.
http://www.livescience.com/9313-earth-core-rotates-faster-surface-study-confirms.html
The surface movement is called plate tectonics. It involves the shifting of about a dozen major plates and is what causes most earthquakes”:
http://en.wikipedia.org/wiki/Earthquake
Volcanoes;
http://en.wikipedia.org/wiki/Volcano
and Mountain Formation;
http://en.wikipedia.org/wiki/Mountain_formation
which can influence the creation of Atmospheric Waves:
http://en.wikipedia.org/wiki/Atmospheric_wave
Lastly, Rotational Energy is the primary driver of Earth’s Dynamo;
http://en.wikipedia.org/wiki/Dynamo_theory
which generates Earth’s Magnetic Field;
http://en.wikipedia.org/wiki/Earth%27s_magnetic_field
and is primarily responsible for the Earthy behaviors of the Magnetosphere;
http://en.wikipedia.org/wiki/Magnetosphere
with certain secular variations in Earth’s magnetic field originating from ocean flow/circulation;
http://news.nationalgeographic.com/news/2009/06/090622-earths-core-dynamo.html
http://iopscience.iop.org/1367-2630/11/6/063015/fulltext
though Leif Svalgaard notes that these are minor variations, as the magnetic field originating from ocean flow/circulation “is 1000 times smaller than the main field generated in the core.”
Also of note, “Over millions of years, [Earth’s] rotation is significantly slowed by gravitational interactions with the Moon: see tidal acceleration.
http://en.wikipedia.org/wiki/Tidal_acceleration
“The presence of the moon (which has about 1/81 the mass of the Earth), is slowing Earth’s rotation and lengthening the day by about 2 ms every one hundred years.”
“However some large scale events, such as the 2004 Indian Ocean earthquake, have caused the rotation to speed up by around 3 microseconds.[21] Post-glacial rebound, ongoing since the last Ice age, is changing the distribution of the Earth’s mass thus affecting the Moment of Inertia of the Earth and, by the Conservation of Angular Momentum, the Earth’s rotation period.”
http://en.wikipedia.org/wiki/Earth%27s_rotation
2. Orbital Energy, Orbital Period, Elliptical Orbits (Eccentricity), Tilt (Obliquity) and Wobble (Axial precession):
http://en.wikipedia.org/wiki/Specific_orbital_energy
http://en.wikipedia.org/wiki/Synodic
http://www.physicalgeography.net/fundamentals/6h.html
creates Earth’s seasons;
http://en.wikipedia.org/wiki/Season
which drives annual changes in Arctic Sea Ice;
and Antarctic Sea Ice;
the freezing and melting of which helps to drive the Thermohaline Circulation;
http://en.wikipedia.org/wiki/Thermohaline_circulation
and can result in the formation of Polynyas:
http://en.wikipedia.org/wiki/Polynya
Earth’s orbit around the Sun, Earth’s tilt, Earth’s wobble and the Moon’s orbit around Earth, Earth’s Rotation, and the gravity of the Moon, Sun and Earth, act in concert to determine the constantly evolving Tidal Force on Earth:
http://en.wikipedia.org/wiki/Tidal_force
This Tidal Force is influenced by variations in Lunar Orbit;
http://en.wikipedia.org/wiki/Orbit_of_the_Moon
as seen in the Lunar Phases;
http://en.wikipedia.org/wiki/Lunar_phase
Lunar Precession;
http://en.wikipedia.org/wiki/Lunar_precession
Lunar Node;
http://en.wikipedia.org/wiki/Lunar_node
Saros cycles;
http://en.wikipedia.org/wiki/Saros_cycle
and Inex cycles:
http://en.wikipedia.org/wiki/Inex
The combined cycles of the Saros and Inex Cycles can be visualized here:
http://eclipse.gsfc.nasa.gov/SEsaros/image/SEpanoramaGvdB-big.JPG
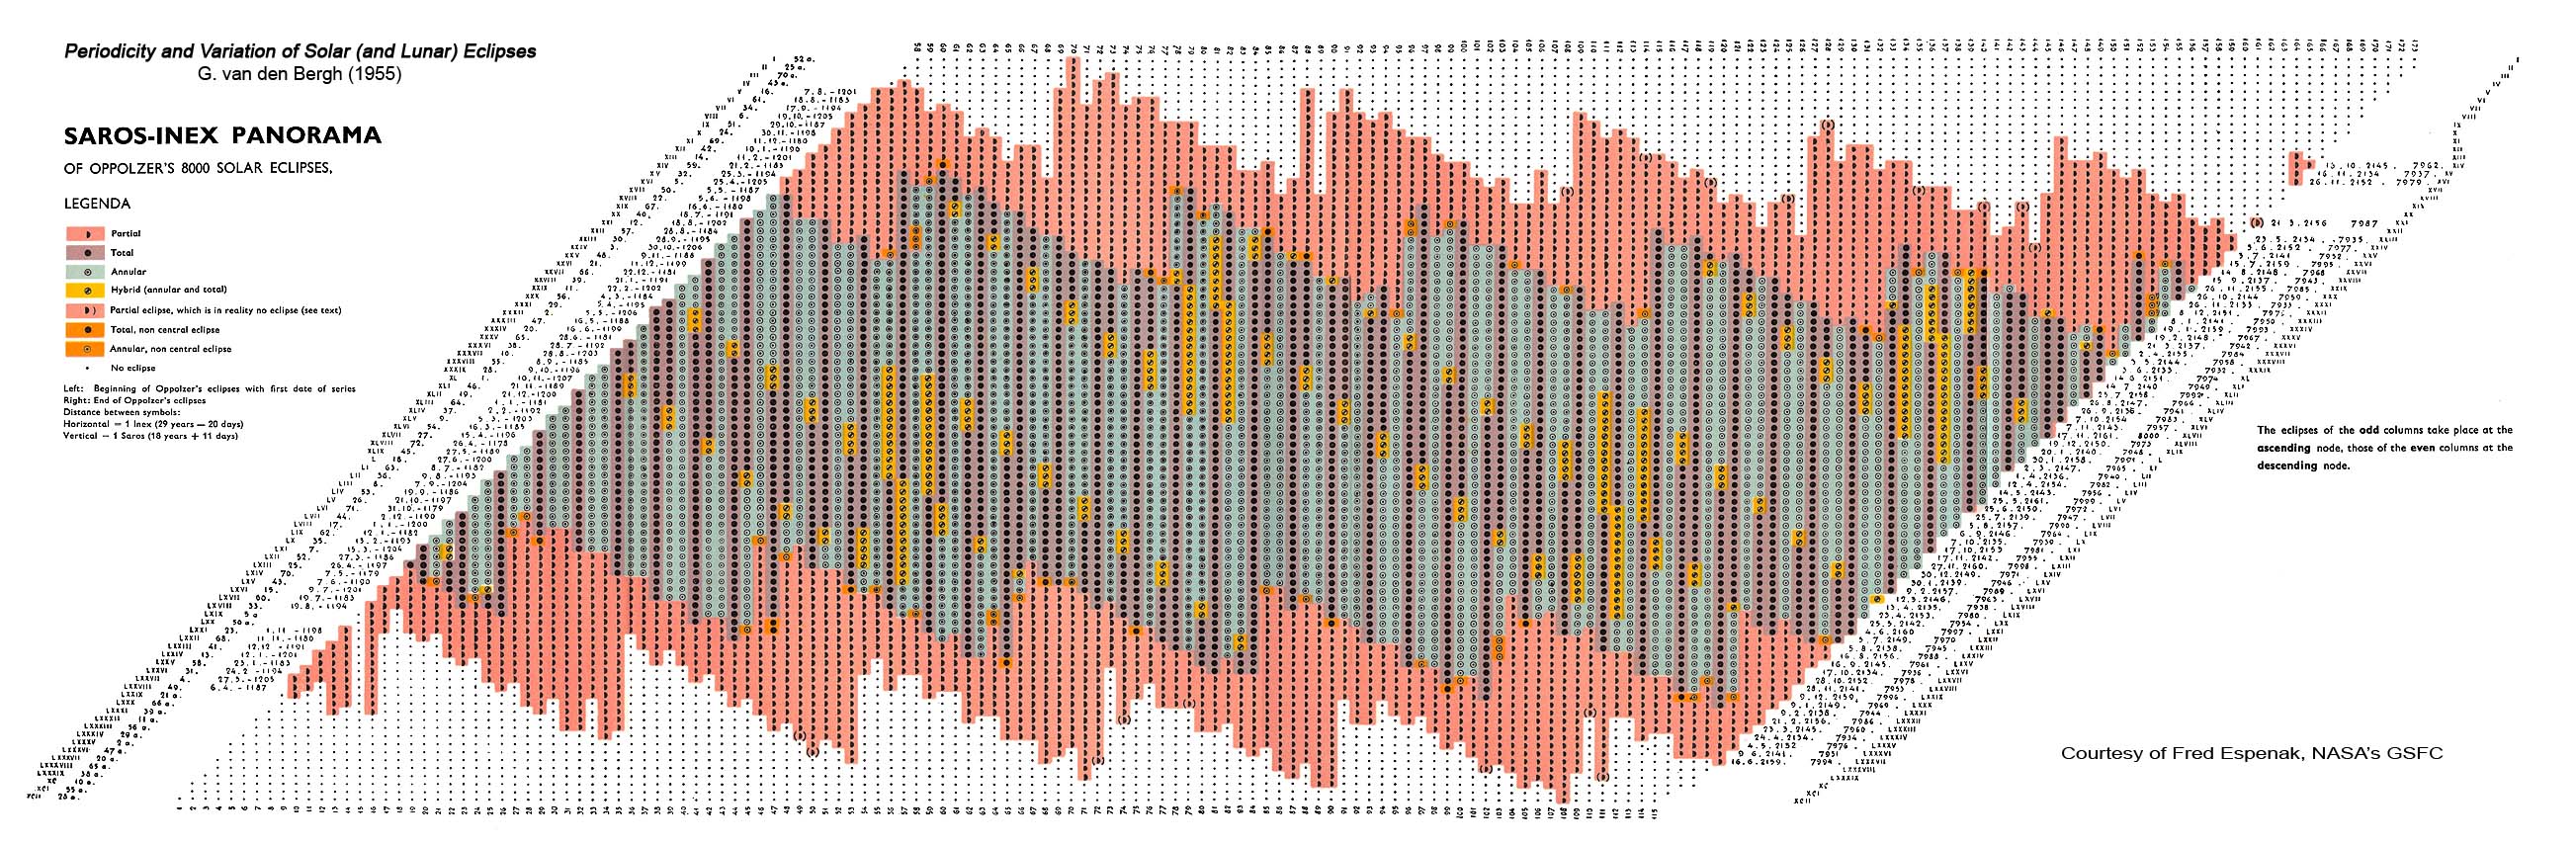
Over longer time frames changes to Earth’s orbit, tilt and wobble called Milankovitch cycles;
http://en.wikipedia.org/wiki/Milankovitch_cycles
may be responsible for the periods of Glaciation (Ice Ages);
http://www.homepage.montana.edu/~geol445/hyperglac/time1/milankov.htm
that Earth has experienced for the last several million years of its climatic record:
http://en.wikipedia.org/wiki/Ice_age
Also of note, over very long time frames, “the Moon is spiraling away from Earth at an average rate of 3.8 cm per year”;
http://en.wikipedia.org/wiki/Lunar_distance_%28astronomy%29
http://curious.astro.cornell.edu/question.php?number=124
3. Gravitation:
http://en.wikipedia.org/wiki/Gravitation
The gravity of the Moon, Sun and Earth, Earth’s rotation, Earth’s orbit around the Sun, Earth’s tilt, Earth’s wobble and the Moon’s orbit around Earth act in concert to determine the constantly evolving Tidal Force on Earth:
http://en.wikipedia.org/wiki/Tidal_force
This tidal force results in that result in Earth’s Ocean Tide;
http://en.wikipedia.org/wiki/Tide
http://www.themcdonalds.net/richard/astro/papers/602-tides-web.pdf
Atmospheric Tide;
http://en.wikipedia.org/wiki/Atmospheric_tide
and Magma Tide:
http://www.springerlink.com/content/h7005r0273703250/
Earth’s Gravity;
http://en.wikipedia.org/wiki/Convection#Gravitational_or_buoyant_convection
http://visibleearth.nasa.gov/view_rec.php?id=205
in concert with Tidal Forces, influence Earth’s Ocean Circulation;
http://www.eoearth.org/article/Ocean_circulation
which influences Oceanic Oscillations including El Niño/La Niña;
http://en.wikipedia.org/wiki/El_Ni%C3%B1o-Southern_Oscillation
the Pacific Decadal Oscillation (PDO);
http://en.wikipedia.org/wiki/Pacific_Decadal_Oscillation
the Atlantic Multi-Decadal Oscillation (AMO);
http://en.wikipedia.org/wiki/Atlantic_Multidecadal_Oscillation
the Indian_Ocean_Dipole (IOD)/Indian Ocean Oscillation (IOO) and;
http://en.wikipedia.org/wiki/Indian_Ocean_Dipole
can result in the formation of Polynyas:
http://en.wikipedia.org/wiki/Polynya
Gravity Waves;
http://en.wikipedia.org/wiki/Gravity_wave
which may be partially responsible for the Quasi-Biennial Oscillation (QBO);
http://en.wikipedia.org/wiki/Quasi-biennial_oscillation
“on an air–sea interface are called surface gravity waves or Surface Waves”;
http://en.wikipedia.org/wiki/Surface_wave
“while internal gravity waves are called Inertial Waves”:
http://en.wikipedia.org/wiki/Inertial_waves
“Rosby Waves;
http://en.wikipedia.org/wiki/Rossby_waves
Geostrophic Currents
http://en.wikipedia.org/wiki/Geostrophic
and Geostrophic Wind
http://en.wikipedia.org/wiki/Geostrophic_wind
are examples of inertial waves. Inertial waves are also likely to exist in the core of the Earth”
Earth’s gravity is the primary driver of Plate Tectonics;
http://en.wikipedia.org/wiki/Plate_tectonics
“The Slab Pull;
http://en.wikipedia.org/wiki/Slab_pull
force is a tectonic plate force due to subduction. Plate motion is partly driven by the weight of cold, dense plates sinking into the mantle at trenches. This force and the slab suction force account for most of the overall force acting on plate tectonics, and the Ridge Push;
force accounts for 5 to 10% of the overall force.”
Plate Tectonics drive “cycles of ocean basin growth and destruction, known as Wilson cycles;
http://csmres.jmu.edu/geollab/fichter/Wilson/Wilson.html
involving continental rifting;
http://en.wikipedia.org/wiki/Rift
seafloor-spreading;
http://en.wikipedia.org/wiki/Seafloor_spreading
subduction;
http://en.wikipedia.org/wiki/Subduction
and collision.”:
http://en.wikipedia.org/wiki/Continental_collision
“Climate change on ultra-long time scales (tens of millions of years) are more than likely connected to plate tectonics.”
“Through the course of a Wilson cycle continents collide and split apart, mountains are uplifted and eroded, and ocean basins open and close. The re-distribution and changing size and elevation of continental land masses may have caused climate change on long time scales”;
http://www.pbs.org/wgbh/nova/ice/chill.html
a process called the Supercontinent Cycle:
http://en.wikipedia.org/wiki/Supercontinent_cycle
Earth’s gravity is responsible for Katabatic Wind:
http://en.wikipedia.org/wiki/Katabatic_wind
4. Solar Energy;
http://en.wikipedia.org/wiki/Solar_energy
results is Solar Radiation/Sunlight;
http://en.wikipedia.org/wiki/Solar_radiation
which varies based upon 11 and 22 year cycles:
http://en.wikipedia.org/wiki/Solar_cycle
Total Solar Irradiance (TSI);
http://www.ngdc.noaa.gov/stp/solar/solarirrad.html
appears to fluctuate “by approximately 0.1% or about 1.3 Watts per square meter (W/m2) peak-to-trough during the 11-year sunspot cycle”:
http://en.wikipedia.org/wiki/Solar_variation
Solar Energy also drives the Hydrological/Water Cycle;
http://en.wikipedia.org/wiki/Hydrological_cycle
within the Hydrosphere;
http://en.wikipedia.org/wiki/Hydrosphere
as Total Solar Irradiance (TSI) causes evaporation;
http://en.wikipedia.org/wiki/Evaporation
that drives cloud formation;
http://en.wikipedia.org/wiki/Cloud
results in precipitation;
http://en.wikipedia.org/wiki/Precipitation_%28meteorology%29
that results in the Water Distribution on Earth;
http://en.wikipedia.org/wiki/Water_distribution_on_Earth
creates surface runoff;
http://en.wikipedia.org/wiki/Runoff_%28water%29
which result in rivers;
http://en.wikipedia.org/wiki/River
and drives erosion:
http://en.wikipedia.org/wiki/Erosion
Solar energy is also “The driving force behind atmospheric circulation is solar energy, which heats the atmosphere with different intensities at the equator, the middle latitudes, and the poles.”
http://www.scienceclarified.com/As-Bi/Atmospheric-Circulation.html
Atmospheric Circulation;
http://en.wikipedia.org/wiki/Atmospheric_circulation
includes Hadley Cells;
http://en.wikipedia.org/wiki/Hadley_cell
Ferrel Cells;
http://en.wikipedia.org/wiki/Atmospheric_circulation#Ferrel_cell
Polar Cells;
http://en.wikipedia.org/wiki/Polar_cells
and Polar Vortexes:
http://en.wikipedia.org/wiki/Polar_cells
all of which help to create Wind;
http://en.wikipedia.org/wiki/Wind
that influence Surface Currents;
http://www.windows2universe.org/earth/Water/ocean_currents.html
http://en.wikipedia.org/wiki/Ocean_current
through Ekman Transport;
http://en.wikipedia.org/wiki/Ekman_transport
http://oceanmotion.org/html/background/ocean-in-motion.htm
and also cause Langmuir circulations
http://en.wikipedia.org/wiki/Langmuir_circulation
Solar energy is also a driver of the Brewer-Dobson Circulation
http://en.wikipedia.org/wiki/Brewer-Dobson_circulation
Atmospheric Waves;
http://en.wikipedia.org/wiki/Atmospheric_wave
including Atmospheric Tides
http://en.wikipedia.org/wiki/Atmospheric_tide
as well as evaporation and condensation may help to drive changes in Atmospheric Pressure:
http://en.wikipedia.org/wiki/Atmospheric_pressure
http://www.atmos-chem-phys-discuss.net/10/24015/2010/acpd-10-24015-2010.pdf
Solar Ultraviolet (UV) radiation;
http://en.wikipedia.org/wiki/Ultraviolet
appears to vary by approximately 10% during the solar cycle;
http://www.nasa.gov/topics/solarsystem/features/solarcycle-sorce.html
has been hypothesized to influence Earth’s climate;
http://wattsupwiththat.com/2011/04/05/courtillot-on-the-solar-uv-climate-connection/
however Leif Svalgaard argues that,
This is well-trodden ground. Nothing new to add, just the same old, tired arguments. Perhaps a note on EUV: as you can see here (slide 13)
http://lasp.colorado.edu/sorce/news/2008ScienceMeeting/doc/Session1/S1_03_Kopp.pdf the energy in the EUV band [and other UV bands] is very tiny; many orders of magnitude less than what shines down on our heads each day. So a larger solar cycle variation of EUV does not make any significant difference in the energy budget.
http://wattsupwiththat.com/2011/04/05/courtillot-on-the-solar-uv-climate-connection/#comment-636477
Additionally variations in Ultraviolet (UV) radiation may influence the break down of Methane;
(Source TBD)
Infrared Radiation;
http://en.wikipedia.org/wiki/Infrared
Solar – Wind;
http://science.nasa.gov/science-news/science-at-nasa/1999/ast13dec99_1/
Solar – Coronal Holes;
http://helios.gsfc.nasa.gov/chole.html
Solar – Solar Energetic Particles (SEP);
http://helios.gsfc.nasa.gov/sep.html
Solar – Coronal Mass Ejection;
http://www.esa.int/esaSC/SEMF75BNJTF_index_0.html
http://www.ratedesi.com/video/v/8AuCE_NNEaM/Sun-Erupts-to-Life-Unleashes-a-Huge-CME-on-13-April-2010
Solar Magnetosphere Breach;
Solar Polar Field Reversal;
http://science.nasa.gov/science-news/science-at-nasa/2001/ast15feb_1/
Solar Sector Boundary;
http://science.nasa.gov/heliophysics/focus-areas/magnetosphere-ionosphere/
Grand Minimum;
Leif Svalgaard says: February 6, 2011 at 8:26 pm
If L&P are correct and sunspots become effectively] invisible [not gone] it might mean another Grand Minimum lasting perhaps 50 years. During this time the solar cycle is still operating, cosmic rays are still modulated, and the solar wind is still buffeting the Earth.”
“It will lead to a cooling of a couple of tenths of a degree.”
Solar Influences on Climate:
http://www.leif.org/EOS/2009RG000282.pdf
Statistical issues about solar–climate relations
http://www.leif.org/EOS/Yiou-565-2010.pdf
5. Geothermal Energy;
http://en.wikipedia.org/wiki/Geothermal_energy
influences Earth’s climate especially when released by Volcanoes;
http://en.wikipedia.org/wiki/Volcano
“which are generally found where tectonic plates are diverging;
http://en.wikipedia.org/wiki/Divergent_boundary
or converging”;
http://en.wikipedia.org/wiki/Convergent_boundary
however, “intraplate volcanism has also been postulated to be caused by mantle plumes”:
http://en.wikipedia.org/wiki/Mantle_plume
“These so-called “hotspots”;
http://en.wikipedia.org/wiki/Hotspot_%28geology%29
for example Hawaii, are postulated to arise from upwelling diapirs;
http://en.wikipedia.org/wiki/Diapir
from the core-mantle boundary, 3,000 km deep in the Earth.”
Volcanoes have been shown to influence Earth’s climate;
http://www.geology.sdsu.edu/how_volcanoes_work/climate_effects.html
http://www.longrangeweather.com/global_temperatures.htm
including in the infamous Year Without a Summer;
http://en.wikipedia.org/wiki/Year_Without_a_Summer
which was partially caused by the 1815 eruption of Mount Tambora;
http://en.wikipedia.org/wiki/1815_eruption_of_Mount_Tambora
and is called a Volcanic Winter:
http://en.wikipedia.org/wiki/Volcanic_winter
“Volcanic Ash;
http://en.wikipedia.org/wiki/Volcanic_ash
particles have a maximum residence time in the troposphere of a few weeks.
The finest Tephera;
http://en.wikipedia.org/wiki/Tephra
remain in the stratosphere for only a few months, they have only minor climatic effects, and they can be spread around the world by high-altitude winds. This suspended material contributes to spectacular sunsets.
“The greatest volcanic impact upon the earth’s short term weather patterns is caused by sulfur dioxide gas;”
http://en.wikipedia.org/wiki/Sulfur_dioxide
“In the cold lower atmosphere, it is converted to Sulfuric Acid;
http://en.wikipedia.org/wiki/Sulfuric_acid
sulfuric acid by the sun’s rays reacting with stratospheric water vapor to form sulfuric acid aerosol layers. The aerosol remains in suspension long after solid ash particles have fallen to earth and forms a layer of sulfuric acid droplets between 15 to 25 kilometers up. Fine ash particles from an eruption column fall out too quickly to significantly cool the atmosphere over an extended period of time, no matter how large the eruption.
Sulfur aerosols last many years, and several historic eruptions show a good correlation of sulfur dioxide layers in the atmosphere with a decrease in average temperature decrease of subsequent years. The close correlation was first established after the 1963 eruption of Agung volcano in Indonesia when it was found that sulfur dioxide reached the stratosphere and stayed as a sulfuric acid aerosol.
Without replenishment, the sulfuric acid aerosol layer around the earth is gradually depleted, but it is renewed by each eruption rich in sulfur dioxide. This was confirmed by data collected after the eruptions of El Chichon, Mexico (1982) and Pinatubo, Philippines (1991), both of which were high-sulfur compound carriers like Agung, Indonesia.”
http://volcanology.geol.ucsb.edu/gas.htm
There is also some evidence that if “volcanic activity was high enough, then a water vapor anomaly would be introduced into the lower stratosphere before the anomaly due to the previous eruption had disappeared. The result would be threefold in the long term: stratospheric cooling, stratospheric humidification, and surface warming due to the positive radiative forcing associated with the water vapor.”
See: http://journals.ametsoc.org/doi/pdf/10.1175/1520-0442(2003)016%3C3525%3AAGSOVE%3E2.0.CO%3B2#h1
Geothermic Energy can also warm the atmosphere through Hot Springs;
http://en.wikipedia.org/wiki/Hot_springs
Or warm the ocean through Hydrothermal Vents:
http://en.wikipedia.org/wiki/Hydrothermal_vent
Which can be a factor in Hydrothermal Circulations:
http://en.wikipedia.org/wiki/Hydrothermal_circulation
6. Outer Space/Cosmic/Galactic Influences;
http://en.wikipedia.org/wiki/Outer_space
http://en.wikipedia.org/wiki/Cosmos
http://en.wikipedia.org/wiki/Galaxy
including Asteroids;
http://en.wikipedia.org/wiki/Asteroid
Meteorites;
http://en.wikipedia.org/wiki/Meteorite
and Comets;
http://en.wikipedia.org/wiki/Comet
can all significantly impact Earth’s climate upon impact.
It has been hypothesized that Galactic Cosmic Rays;
http://en.wikipedia.org/wiki/Galactic_cosmic_ray
http://en.wikipedia.org/wiki/Cosmic_ray
modulated by Solar Wind, may influence cloud formation on Earth:
Galactic Magnetic Fields also result in the;
http://www.scholarpedia.org/article/Galactic_magnetic_fields
Galactic Tide;
http://en.wikipedia.org/wiki/Galactic_tide
which may influence the hypothesized Oort cloud;
http://en.wikipedia.org/wiki/Oort_Cloud
“Besides the galactic tide, the main trigger for sending comets into the inner Solar System is believed to be interaction between the Sun’s Oort cloud and the gravitational fields of near-by stars or giant molecular clouds.”
7. Magnetic Forces;
http://en.wikipedia.org/wiki/Earth%27s_magnetic_field
Earth Core Changes:
http://physicsworld.com/cws/article/news/42580
“appears to be generated in the Earth’s core by a dynamo process, associated with the circulation of liquid metal in the core, driven by internal heat sources”
impact the Magnetosphere;
http://en.wikipedia.org/wiki/Magnetosphere
including movement of the Geomagnetic Poles:
http://www.ngdc.noaa.gov/geomag/GeomagneticPoles.shtml
http://news.nationalgeographic.com/news/2009/12/091224-north-pole-magnetic-russia-earth-core.html
8. Atmospheric Composition
http://en.wikipedia.org/wiki/Atmosphere_of_Earth
Nitrogen (N2) represents approximately 780,840 ppmv or 78.084% of Earth’s Atmosphere;
http://en.wikipedia.org/wiki/Nitrogen
Oxygen (O2) represents approximately 209,460 ppmv or 20.946%;
http://en.wikipedia.org/wiki/Oxygen
Argon (Ar) represents approximately 9,340 ppmv or 0.9340%;
http://en.wikipedia.org/wiki/Argon
Carbon Dioxide (CO2) represents approximately 390 ppmv or 0.039%;
http://en.wikipedia.org/wiki/Carbon_dioxide
contributes to the Greenhouse Effect;
?
and
influences the rate of Plant Growth;
http://www.sjsu.edu/faculty/watkins/CO2plants.htm
Neon (Ne) represents approximately18.18 ppmv or 0.001818%;
http://en.wikipedia.org/wiki/Neon
Helium (He) represents approximately 5.24 ppmv (0.000524%);
http://en.wikipedia.org/wiki/Helium
Krypton (Kr) represents approximately 1.14 ppmv (0.000114%);
http://en.wikipedia.org/wiki/Krypton
Methane (CH4) represents approximately 1.79 ppmv (0.000179%);
http://en.wikipedia.org/wiki/Methane
contributes to the Greenhouse Effect;
?
Hydrogen (H2) represents approximately 0.55 ppmv (0.000055%);
http://en.wikipedia.org/wiki/Hydrogen
Nitrous Oxide (N2O) represents approximately 0.3 ppmv (0.00003%);
http://en.wikipedia.org/wiki/Nitrous_oxide
contributes to the Greenhouse Effect;
?
Ozone (O3) represents approximately 0.0 to 0.07 ppmv (0 to 7×10⁻⁶%);
http://en.wikipedia.org/wiki/Ozone
Nitrogen Dioxide (NO2) represents approximately 0.02 ppmv (2×10⁻⁶%) (0.000002%);
http://en.wikipedia.org/wiki/Nitrogen_dioxide
Iodine (I2) represents approximately 0.01 ppmv (1×10⁻⁶%) (0.000001%) and;
http://en.wikipedia.org/wiki/Iodine
Ammonia (NH3) represents a trace amount of Earth’s Atmosphere:
http://en.wikipedia.org/wiki/Ammonia
Additional atmosphere components includes Water vapor (H2O) that represents approximately 0.40% over full atmosphere, typically 1%-4% at surface.
http://en.wikipedia.org/wiki/Water_vapor;
Aerosols;
http://en.wikipedia.org/wiki/Aerosol
that “act as cloud condensation nuclei, they alter albedo (both directly and indirectly via clouds) and hence Earth’s radiation budget, and they serve as catalysts of or sites for atmospheric chemistry reactions.”
“Aerosols play a critical role in the formation of clouds;
http://en.wikipedia.org/wiki/Clouds
Clouds form as parcels of air cool and the water vapor in them condenses, forming small liquid droplets of water. However, under normal circumstances, these droplets form only where there is some “disturbance” in the otherwise “pure” air. In general, aerosol particles provide this “disturbance”. The particles around which cloud droplets coalesce are called cloud condensation nuclei (CCN) or sometimes “cloud seeds”. Amazingly, in the absence of CCN, air containing water vapor needs to be “supersaturated” to a humidity of about 400% before droplets spontaneously form! So, in almost all circumstances, aerosols play a vital role in the formation of clouds.”
http://www.windows2universe.org/earth/Atmosphere/aerosol_cloud_nucleation_dimming.html
Particulates;
http://en.wikipedia.org/wiki/Particulates
including Soot/Black Carbon;
http://en.wikipedia.org/wiki/Soot
http://en.wikipedia.org/wiki/Black_carbon
Sand;
http://en.wikipedia.org/wiki/Sand
Dust
http://en.wikipedia.org/wiki/Dust
“Volcanic Ash;
http://en.wikipedia.org/wiki/Volcanic_ash
particles have a maximum residence time in the troposphere of a few weeks.
The finest Tephera;
http://en.wikipedia.org/wiki/Tephra
remain in the stratosphere for only a few months, they have only minor climatic effects, and they can be spread around the world by high-altitude winds. This suspended material contributes to spectacular sunsets.
The major climate influence from volcanic eruptions is caused by gaseous sulfur compounds, chiefly Sulfur Dioxide;
http://en.wikipedia.org/wiki/Sulfur_dioxide
which reacts with OH and water in the stratosphere to create sulfate aerosols with a residence time of about 2–3 years.”
“Emission rates of [Sulfur Dioxide] SO2 from an active volcano range from 10 million tonnes/day according to the style of volcanic activity and type and volume of magma involved. For example, the large explosive eruption of Mount Pinatubo on 15 June 1991 expelled 3-5 km3 of dacite magma and injected about 20 million metric tons of SO2 into the stratosphere. The sulfur aerosols resulted in a 0.5-0.6°C cooling of the Earth’s surface in the Northern Hemisphere.”
http://volcanoes.usgs.gov/hazards/gas/index.php
“The 1815 eruption [of Mount Tambora] is rated 7 on the Volcanic Explosivity Index, the only such eruption since the Lake Taupo eruption in about 180 AD. With an estimated ejecta volume of 160 cubic kilometers, Tambora’s 1815 outburst was the largest volcanic eruption in recorded history.”
“The eruption created global climate anomalies that included the phenomenon known as “volcanic winter”;
http://en.wikipedia.org/wiki/Volcanic_winter
1816 became known as the “Year Without a Summer”;
http://en.wikipedia.org/wiki/Year_Without_a_Summer
because of the effect on North American and European weather. Agricultural crops failed and livestock died in much of the Northern Hemisphere, resulting in the worst famine of the 19th century.”
http://en.wikipedia.org/wiki/Mount_Tambora
“In the spring and summer of 1816, a persistent “dry fog” was observed in the northeastern US. The fog reddened and dimmed the sunlight, such that sunspots were visible to the naked eye. Neither wind nor rainfall dispersed the “fog”. It has been characterized as a stratospheric sulfate aerosol veil.”
“The greatest volcanic impact upon the earth’s short term weather patterns is caused by sulfur dioxide gas;”
http://en.wikipedia.org/wiki/Sulfur_dioxide
“In the cold lower atmosphere, it is converted to Sulfuric Acid;
http://en.wikipedia.org/wiki/Sulfuric_acid
sulfuric acid by the sun’s rays reacting with stratospheric water vapor to form sulfuric acid aerosol layers. The aerosol remains in suspension long after solid ash particles have fallen to earth and forms a layer of sulfuric acid droplets between 15 to 25 kilometers up. Fine ash particles from an eruption column fall out too quickly to significantly cool the atmosphere over an extended period of time, no matter how large the eruption.
Sulfur aerosols last many years, and several historic eruptions show a good correlation of sulfur dioxide layers in the atmosphere with a decrease in average temperature decrease of subsequent years. The close correlation was first established after the 1963 eruption of Agung volcano in Indonesia when it was found that sulfur dioxide reached the stratosphere and stayed as a sulfuric acid aerosol.
Without replenishment, the sulfuric acid aerosol layer around the earth is gradually depleted, but it is renewed by each eruption rich in sulfur dioxide. This was confirmed by data collected after the eruptions of El Chichon, Mexico (1982) and Pinatubo, Philippines (1991), both of which were high-sulfur compound carriers like Agung, Indonesia.”
http://volcanology.geol.ucsb.edu/gas.htm
There is also some evidence that if “volcanic activity was high enough, then a water vapor anomaly would be introduced into the lower stratosphere before the anomaly due to the previous eruption had disappeared. The result would be threefold in the long term: stratospheric cooling, stratospheric humidification, and surface warming due to the positive radiative forcing associated with the water vapor.”
See: http://journals.ametsoc.org/doi/pdf/10.1175/1520-0442(2003)016%3C3525%3AAGSOVE%3E2.0.CO%3B2#h1
9. Albedo
http://en.wikipedia.org/wiki/Albedo
“or reflection coefficient, is the diffuse reflectivity or reflecting power of a surface. It is defined as the ratio of reflected radiation from the surface to incident radiation upon it. Being a dimensionless fraction, it may also be expressed as a percentage, and is measured on a scale from zero for no reflecting power of a perfectly black surface, to 1 for perfect reflection of a white surface.”
Clouds
http://en.wikipedia.org/wiki/Clouds
Aerosols
http://en.wikipedia.org/wiki/Aerosol
“act as cloud condensation nuclei, they alter albedo (both directly and indirectly via clouds) and hence Earth’s radiation budget, and they serve as catalysts of or sites for atmospheric chemistry reactions.”
“Aerosols play a critical role in the formation of clouds. Clouds form as parcels of air cool and the water vapor in them condenses, forming small liquid droplets of water. However, under normal circumstances, these droplets form only where there is some “disturbance” in the otherwise “pure” air. In general, aerosol particles provide this “disturbance”. The particles around which cloud droplets coalesce are called cloud condensation nuclei (CCN) or sometimes “cloud seeds”. Amazingly, in the absence of CCN, air containing water vapor needs to be “supersaturated” to a humidity of about 400% before droplets spontaneously form! So, in almost all circumstances, aerosols play a vital role in the formation of clouds.”
http://www.windows2universe.org/earth/Atmosphere/aerosol_cloud_nucleation_dimming.html
Snow
Ice
Water
Particulates
http://en.wikipedia.org/wiki/Particulates
Soot/Black Carbon
http://en.wikipedia.org/wiki/Soot
http://en.wikipedia.org/wiki/Black_carbon
Algae (Ocean Surface)
10. Biology
http://en.wikipedia.org/wiki/Biology
“Phototrophs
http://en.wikipedia.org/wiki/Photoautotroph
are the organisms (usually plants) that carry out photosynthesis;
http://en.wikipedia.org/wiki/Photosynthesis
to acquire energy. They use the energy from sunlight to convert carbon dioxide and water into organic materials to be utilized in cellular functions such as biosynthesis and respiration.” “In plants, algae, and cyanobacteria, photosynthesis uses carbon dioxide and water, releasing oxygen as a waste product.”
Chemoautotrophs;
http://en.wikipedia.org/wiki/Chemotroph
are “organisms that obtain carbon through Chemosynthesis;
http://en.wikipedia.org/wiki/Chemosynthesis
are phylogenetically diverse, but groups that include conspicuous or biogeochemically-important taxa include the sulfur-oxidizing gamma and epsilon proteobacteria, the Aquificaeles, the Methanogenic archaea and the neutrophilic iron-oxidizing bacteria.”
Bacteria – TBD
Fungi – TBD
Protozoa – TBD
Chromista – TBD
Animal – Anthropogenic including:
Carbon Dioxide;
http://en.wikipedia.org/wiki/Carbon_dioxide
contributes to the Greenhouse Effect;
?
and
influences the rate of plant growth ;
http://www.sjsu.edu/faculty/watkins/CO2plants.htm
Methane
http://en.wikipedia.org/wiki/Methane
Nitrous Oxide
Ozone
Particulates, especially Black Carbon/Soot
Aerosols
Icebreakers/Arctic Shipping/Fishing/Cruise-Line Transits
Contrails
Nuclear Power Generation – Including Ships
Land Use Changes – Including De and Re-Forestation
Urban Heat Islands
Run Off From Asphalt/Urban Heat Islands
Fossil Fuel Energy Generation Waste Heat –
Renewables – Wind Farms, Solar Arrays, Dams and Ethanol
Sewage/Wastewater Treatment Discharge
etc.
Animal – Non-Anthropogenic including
Plankton
Beaver (Genus Castor)
http://en.wikipedia.org/wiki/Beaver
etc.
11. Chemical
Fossil Fuels:
Coal
Oil shale
Petrochemicals
– Petroleum
– Mineral Oil
Asphalt
Tar Pits/Sands
Methane
http://en.wikipedia.org/wiki/Methane
etc.
“Photosynthesis;
http://en.wikipedia.org/wiki/Photosynthesis
is a chemical process that converts carbon dioxide into organic compounds, especially sugars, using the energy from sunlight.”
“Chemosynthesis;
http://en.wikipedia.org/wiki/Chemosynthesis
is the biological conversion of one or more carbon molecules (usually carbon dioxide or methane) and nutrients into organic matter using the oxidation of inorganic molecules (e.g. hydrogen gas, hydrogen sulfide) or methane as a source of energy, rather than sunlight, as in photosynthesis.”
Reactions:
Combustion
– Forest Fires
– Fossil Fuels
– – Methane
http://en.wikipedia.org/wiki/Methane
etc.
Conversion of Methane, CO2, etc.
12. Physics – Other
Temperature
http://en.wikipedia.org/wiki/Temperature
Pressure
http://en.wikipedia.org/wiki/Pressure
States of Matter
http://en.wikipedia.org/wiki/State_of_matter
Heat Conduction
http://en.wikipedia.org/wiki/Heat_conduction
Convection
http://en.wikipedia.org/wiki/Convection
Thermal Radiation
http://en.wikipedia.org/wiki/Thermal_radiation
Thermodynamics
http://en.wikipedia.org/wiki/Laws_of_thermodynamics
-Entropy
http://en.wikipedia.org/wiki/Entropy
General summaries of the potential variables involved in Earth’s climate system;
http://www.physicalgeography.net/fundamentals/7y.html
http://oceanservice.noaa.gov/education/pd/climate/factsheets/whatfactors.pdf
Tobis:
They are not my graphs, and they are graphs based on numerous peer reviewed studies, as anyone looking at them would see. And:
“If CO2 perturbation decay time were short, CO2 concentrations would go down during a recession.”
If Tobis took the time to notice, he would see that the rise in [harmless, beneficial] CO2 has been stagnant since the beginning of the year.
I don’t make these comments to educate Michael Tobis, whose mind is closed as tight as Harold Camping’s, and who cannot be educated with facts. I note these facts only to avoid allowing others to be swayed by bogus alarmist propaganda. Malthusian Luddites like Tobis have been arm-waving for centuries, and they have been wrong for centuries. They are just as mistaken today.
I’ve updated the intro of this post to include:
UPDATED: This list has undergone significant revisions and improvements based upon crowdsourcing the input of an array of very intelligent and knowledgeable contributors below. Additionally, this list was posted in comments in WUWT a few times previously, receiving input from a number of other very intelligent and knowledgeable contributors. This thread, along with links to the precursor threads below, will thus serve as the bibliography for the WUWT Potential Climatic Variables reference page (unless someone can up with a better name for it…)
Please let me know if you have any suggested improvements to this intro paragraph… 🙂
“Please let me know if you have any suggested improvements”
A couple of major factors such as solar and oceanic variability would pretty much swamp everything else with all the lesser factors simply offsetting each other on average over time.
Would it be possible to rank the various items and processes on the list in order of significance or perhaps group them in batches of compareable magnitudes?
In practice I think the climate system is more simple than such a list suggests because of the primacy of a small number of major factors.
No section on the greenhouse effect, and infra-red active gases which helps explain why the surface temperature is as warm as it is? This seems to be major omissions when discussing climate.
Michael Tobis finds a presumption of innocence to be a “peculiar” notion.
No wonder he trusts the conclusions of an irresponsible and corrupt UN organization.
Michael Tobis says: July 1, 2011 at 6:11 pm
Well, sure, there are lots of influences. The point is that a few of them are very very very very large compared to the others, those are all anthropogenic,
This statement is erroneous. According to EPA;
“The radiative forcing contribution (since 1750) from increasing concentrations of well-mixed greenhouse gases (including CO2, CH4, N2O, CFCs, HCFCs, and fluorinated gases) is estimated to be +2.64 Watts per square meter – over half due to increases in CO2 (+1.66 Watts per square meter), strongly contributing to warming relative to other climate components described below.”
http://www.epa.gov/climatechange/science/recentac.html
whereas the Wiki for “Insolation” says:
“Over the course of a year the average solar radiation arriving at the top of the Earth’s atmosphere is roughly 1,366 watts per square meter[2][3] (see solar constant). The radiant power is distributed across the entire electromagnetic spectrum, although most of the power is in the visible light portion of the spectrum. The Sun’s rays are attenuated as they pass though the atmosphere, thus reducing the insolation at the Earth’s surface to approximately 1,000 watts per square meter for a surface perpendicular to the Sun’s rays at sea level on a clear day.
The actual figure varies with the Sun angle at different times of year, according to the distance the sunlight travels through the air, and depending on the extent of atmospheric haze and cloud cover. Ignoring clouds, the average insolation for the Earth is approximately 250 watts per square meter (6 (kW·h/m2)/day), taking into account the lower radiation intensity in early morning and evening, and its near-absence at night.”
http://en.wikipedia.org/wiki/Insolation
What Anthropogenic forces can you point to that are “very very very very large compared to the” “average insolation for the Earth” i.e., “approximately 250 watts per square meter (6 (kW·h/m2)/day)”?
Just the facts,
People like Michael Tobis do not want to see facts. They only throw unsubstantiated accusations and inane party line cliche’s. And rationality is the last thing in the world you can expect from them. Look at all his posts in this thread. Entirely devoid of any rationale or facts.
It’s good that you put up these counter arguments with facts which will show every time to every one as to how shallow and devoid of facts arguments of such people are.
Nobody contests that the sun is the source of energy in the system!
The question is variability on the time scale of the anthropogenic CO2 perturbation, which could drive climate *change*. As far as I know, nothing in the published literature indicates anything larger than 0.3 W/m^2 peak-to-peak solar variability on decadal-to-century time scales. Compare 4 w/m^2 imbalance for an instantaneous CO2 doubling or equivalent, and you have the generally accepted conclusion that human inputs already overcome the solar variability.
Stephen Wilde says: July 1, 2011 at 7:58 pm (Edit)
A couple of major factors such as solar and oceanic variability would pretty much swamp everything else with all the lesser factors simply offsetting each other on average over time.
Would it be possible to rank the various items and processes on the list in order of significance or perhaps group them in batches of compareable magnitudes?
I am open to a Significant Climatic Influences page, and/or a Significant Temperature Influences page, I like the variable batches of comparable magnitudes. Does anyone want try to build one?
In practice I think the climate system is more simple than such a list suggests because of the primacy of a small number of major factors.
I disagree. You seem to be focused on a singular subject, i.e. the “small number of major” influences on Earth’s temperature, whereas, the ridiculous complexity is especially apparent when you try to imagine the entire beast in motion.
I just added
“Wind;
http://en.wikipedia.org/wiki/Wind
that influence Surface Currents;
http://www.windows2universe.org/earth/Water/ocean_currents.html
http://en.wikipedia.org/wiki/Ocean_current
through Ekman Transport;
http://en.wikipedia.org/wiki/Ekman_transport
http://oceanmotion.org/html/background/ocean-in-motion.htm
and wind also causes Langmuir circulations
http://en.wikipedia.org/wiki/Langmuir_circulation“
As noted in my update to the intro this post/list, previously I posted this list in comments of several WUWT threads, linked below) and got some valuable input from a number of individuals. This comment serves as a continuation of the bibliography.
The list began its life as a comment on January, 15th 2011:
http://wattsupwiththat.com/2011/01/15/nasa-la-nina-has-remained-strong/#comment-574922
and then was revised on January, 22nd 2011;
http://wattsupwiththat.com/2011/01/22/new-wuwt-solar-images-and-data-page/#comment-584215
February 10th, 2011;
http://wattsupwiththat.com/2011/02/10/wsj-no-weather-weirding-worries/#comment-596174
and February 28th:
http://wattsupwiththat.com/2011/02/28/new-geomagnetism-reference-page/#comment-610064
Michael Tobis says: July 1, 2011 at 9:02 pm
Nobody contests that the sun is the source of energy in the system!
Can we take this statement as an admission that your prior statement that “a few of them are very very very very large compared to the others, those are all anthropogenic,” is in fact erroneous?
As far as I know, nothing in the published literature indicates anything larger than 0.3 W/m^2 peak-to-peak solar variability on decadal-to-century time scales.
Wiki states that it varies “by approximately 0.1% or about 1.3 Watts per square meter (W/m2) peak-to-trough during the 11-year sunspot cycle”:
http://en.wikipedia.org/wiki/Solar_variation
Do you just make this stuff up? You don’t seem to do the most basic fact checking. Search engines are your friend.
Compare 4 w/m^2 imbalance for an instantaneous CO2 doubling or equivalent
Correct. It is interesting that you only get the CO2 science accurate.
and you have the generally accepted conclusion that human inputs already overcome the solar variability.
No, there is no “generally accepted conclusion” about this. It has been hypothesized that Galactic Cosmic Rays;
http://en.wikipedia.org/wiki/Galactic_cosmic_ray
http://en.wikipedia.org/wiki/Cosmic_ray
modulated by Solar Wind, may influence cloud formation on Earth;
http://wattsupwiththat.com/2009/08/04/a-link-between-the-sun-cosmic-rays-aerosols-and-liquid-water-clouds-appears-to-exist-on-a-global-scale/
but this is still hotly contested.
Solar influences aside, Oceanic Oscillations
http://wattsupwiththat.com/reference-pages/oceanic-oscillation/
including El Niño/La Niña;
http://en.wikipedia.org/wiki/El_Ni%C3%B1o-Southern_Oscillation
http://www.appinsys.com/GlobalWarming/ENSO.htm
http://www.ossfoundation.us/projects/environment/global-warming/el-nino-southern-oscillation-enso
http://wattsupwiththat.com/2010/04/26/enso-update/
http://wattsupwiththat.com/reference-pages/enso/
the Pacific Decadal Oscillation (PDO);
http://en.wikipedia.org/wiki/Pacific_Decadal_Oscillation
http://www.appinsys.com/GlobalWarming/PDO.htm
http://www.atmos.washington.edu/~mantua/REPORTS/PDO/PDO_egec.htm
http://www.atmos.washington.edu/~mantua/REPORTS/PDO/PDO_cs.htm
http://jisao.washington.edu/pdo/PDO.latest
the Atlantic Multi-Decadal Oscillation (AMO);
http://en.wikipedia.org/wiki/Atlantic_Multidecadal_Oscillation
http://www.appinsys.com/GlobalWarming/AMO.htm
http://www.esrl.noaa.gov/psd/data/timeseries/AMO/
http://www.aoml.noaa.gov/phod/amo_faq.php
http://en.wikipedia.org/wiki/Atlantic_multidecadal_oscillation
and the Indian Ocean Oscillation (IOO), which is closely associated with the Atmospheric Oscillation the Equatorial Indian Ocean Oscillation (EQUINOO) and is the Oceanic component of the Indian Ocean Dipole (IOD). The Indian Ocean Oscillation (IOO) is also closely connected to the El Nino Southern Oscillation (ENSO). (Note, the “Indian Ocean Oscillation (IOO”) does not appear to have a well established name within the literature. It might be better as the Indian Ocean Interannual/Decadal Oscillation (IOIDO), but time will sort that out.):
http://en.wikipedia.org/wiki/Indian_Ocean_Dipole/
http://ams.confex.com/ams/pdfpapers/28816.pdf
http://www.springerlink.com/content/51n8664436045952/
http://news.xinhuanet.com/english2010/sci/2010-10/04/c_13542305.htm
seem like a good place to look. The recent change from El Niño to La Niña that occurred in 2010;
http://wattsupwiththat.com/reference-pages/enso/
resulted in a half degree celcius drop in global temperatures in 1 year, per the RSS Lower Troposphere Temperature Anomaly;
ftp://ftp.ssmi.com/msu/graphics/tlt/plots/rss_ts_channel_tlt_global_land_and_sea_v03_3.png
UAH Mid-Troposphere Temperature Anomaly;
http://www.ncdc.noaa.gov/sotc/service/global/uah-midtrop-global-land-ocean/201105.gif
and UAH Global Lower Atmosphere Temperature Anomaly:
http://www.drroyspencer.com/wp-content/uploads/UAH_LT_1979_thru_May_20111.gif
Do you agree that Oceanic Oscillations can have a significant influence on Earth’s Temperature?
To continue the human body analogy:
While we know a lot about the human body, we still don’t know a great deal. With our current understanding of genetics, brain functions, physiology, psychology, education, and group dynamics, can we predict what college your infant will go to with any level of certainty? Or for that matter, what you will want to eat for breakfast next Tuesday?
You may counter that we don’t know if you will want bacon and eggs or cereal, but we know that if you eat a lot you will get fat. However, we don’t really understand why you get fat and I don’t when we eat the same amount and do the same activity. We may recognize it happens, but not understand the dynamics of why. And on it goes.
REALLY complex systems are even harder to predict than they are to understand. Inability to grasp how all the small scale influences affect the larger scale is problematic, regardless of the time scale, but a show stopper in any long-term time scale.
Just The Facts,
Thank you for a useful and interesting post. Implicit in the discussion of ‘AGW’, ‘Climate Change’ et seq, and in the various actions proposed, is the belief that human actions can exacerbate or mitigate climate and it’s various effects on a global scale. And by extension, weather.
Many people, myself included, find this assumption that we are able to control or influence global climate, dubious at best.
@- Smokey says:
July 1, 2011 at 7:43 pm
“If Tobis took the time to notice, he would see that the rise in [harmless, beneficial] CO2 has been stagnant since the beginning of the year. ”
No, it hasn’t –
http://www.esrl.noaa.gov/gmd/ccgg/trends/weekly.html
Up-to-date weekly average CO2 at Mauna Loa
Week of June 19, 2011: 393.46 ppm
Weekly value from 1 year ago: 391.53 ppm
Weekly value from 10 years ago: 373.12 ppm
And as you can see from the graph it is following the usual seasonal pattern of a spring peak.
CO2 varies by around 5ppm a year from the seasonal biological cycle.
Superimposed on this regular annual cycle has been a net gain of about 1.8ppm per year.
Are you suggesting this year will be any different?
Wow. Tobis has deigned to post on WUWT, many times on this thread, in a manner resembling an arguing of the facts.
What’s happening? Is traffic so low on his blog that he’s trawling for some visits with all the links to his site? Or is he trying to improve a Wikio-type link-based rating by liberally spreading them on this much more well read blog? According to this web site stat page, WUWT has the highest Alexa ranking of any site linking to his blog, a very high 17,562 (lower is better) compared to his 811,560. And his traffic has been dropping like a stone…
Will he finally go away after leaving enough link-droppings?
@- justthefactswuwt says:
July 1, 2011 at 11:36 pm
“Do you agree that Oceanic Oscillations can have a significant influence on Earth’s Temperature?”
On the immediate temperature, but not on the climate.
There is little historical evidence that the pattern of Oscillations drives unidirectional climate change.
It is considered more likely they respond to, not initiate significant trends that extend beyond the average cycle length.
@-justthefactswuwt says:
July 1, 2011 at 11:36 pm
Michael Tobis says: July 1, 2011 at 9:02 pm
As far as I know, nothing in the published literature indicates anything larger than 0.3 W/m^2 peak-to-peak solar variability on decadal-to-century time scales.
Wiki states that it varies “by approximately 0.1% or about 1.3 Watts per square meter (W/m2) peak-to-trough during the 11-year sunspot cycle”:
http://en.wikipedia.org/wiki/Solar_variation
Do you just make this stuff up? You don’t seem to do the most basic fact checking. Search engines are your friend.
—————-
There may be a simple explanation why you are BOTH right.
The top of atmosphere variation is ~1.2 W/m2 or 0.1%.
The average surface change – because the Earth is a sphere and rotates is about a quarter of the top-of-atmosphere value, – around 0.3W/m2 or 0.1% of the surface average total.
Search engines can be our friend, but thinking about WHY two people come up with different results can also help.
Michael Tobis says:
June 30, 2011 at 4:51 pm
……
You take the needle, bury it in the haystack, and then question whether there is a needle at all. If this defense works nobody will ever be able to make a case for anything.
/end quote
exactly the point. The needle makes NO observable difference to the haystack – which is why it is so hard to find. Nice analogy, demonstrating the probable impact of anthropological CO2 / other impacts on the global climate – although it is possible that it may underestimate the impact – maybe 10 needles (an order of magnitude) would be better
Izen, you are very mistaken about oceanic oscillations not being capable of driving unilateral “climate change”, which I wish you would use the more accurate “weather pattern variation” term. Google “Elk population and Oceanic Oscillations”, or any other marine/flora/fauna species. My ancestors down to the current crop have been farmers since before the Amercian Revolution. We know both short and long term weather pattern variation. Intimately.
Weather pattern variation change can be natural or anthropogenic, or both. But climate is defined by seasons and extremes. If seasons or extremes begin to show a consistent pattern of change to the point that a new zone designation is in order, then I will be more willing to accept climate change as a more accurate descriptor.
http://mgg.coas.oregonstate.edu/~andreas/pdf/S/schmittner07agu_intro.pdf
Let’s do the really long one first. The meridional overturning circulation. A super El Nino event warms a vast area of the Pacific as it sits idly in the lazy trade wind, soaking up the Sun, and leaving the cold waters underneath to sullenly sit there. Now set this warmed ocean into the overturning circulation. How many days, months, years, decades, or centuries does it take for this heated pool to make it round the circulation?
izen says: July 2, 2011 at 2:03 am
On the immediate temperature, but not on the climate.
What? The Pacific Decadal Oscillation (PDO) “is a climate index based upon patterns of variation in sea surface temperature of the North Pacific from 1900 to the present (Mantua et al. 1997). While derived from sea surface temperature data, the PDO index is well correlated with many records of North Pacific and Pacific Northwest climate and ecology, including sea level pressure, winter land–surface temperature and precipitation, and stream flow. The index is also correlated with salmon landings from Alaska, Washington, Oregon, and California.
The PDO is highly correlated with sea surface temperature in the northern California Current (CC) area; thus we often speak of the PDO as being in one of two phases, a “warm phase” and a “cool phase,” according to the sign of sea–surface temperature anomalies along the Pacific Coast of North America. ”
http://www.nwfsc.noaa.gov/research/divisions/fed/oeip/ca-pdo.cfm
The PDO’s approximately 30 year Warm and Cold Regimes;
http://www.nwfsc.noaa.gov/research/divisions/fed/oeip/EcInFigs/ecinfigtwo.jpg
correlate well with periods of warming and cooling in our laughably brief 131 year-old surface temperature record;
http://www.ncdc.noaa.gov/sotc/service/global/global-land-ocean-mntp-anom/201001-201012.gif
i.e. there was a warming period from 1910 to 1945, a cooling period from 1945 – 1975, a warming period from 1975 to 2005 and we may now be in the early days of a cooling period due to a 30 year Cold Regime in the PDO.
Here’s Easterbrook’s chart and projection;
http://wattsupwiththat.files.wordpress.com/2008/04/easterbrook_projection.png
from this WUWT article:
http://wattsupwiththat.com/2008/04/29/more-on-the-pdo-shift-cited-by-nasa/
Are you arguing that the Pacific Decadal Oscillation has an influence “on the immediate temperature, but not on the climate.”?
There is little historical evidence that the pattern of Oscillations drives unidirectional climate change.
What is unidirectional climate change? Do you think that some portion of the increase in temperature between 1975 and 2005 might have been related to the PDO Warm Regime?
izen says: July 2, 2011 at 2:52 am
There may be a simple explanation why you are BOTH right.
The top of atmosphere variation is ~1.2 W/m2 or 0.1%.
The average surface change – because the Earth is a sphere and rotates is about a quarter of the top-of-atmosphere value, – around 0.3W/m2 or 0.1% of the surface average total.
No. Michael Tobis wrote that, “nothing in the published literature indicates anything larger than 0.3 W/m^2 peak-to-peak solar variability on decadal-to-century time scales.” and he is wrong. The variation in Total Solar Irradiance is measured at the “outer surface of Earth’s atmosphere”;
http://en.wikipedia.org/wiki/Solar_variation
i.e. look at the measurement data:
http://lasp.colorado.edu/sorce/total_solar_irradiance_plots/images/tim_level3_tsi_24hour_640x480.png
http://www.leif.org/research/TSI-SORCE-Latest.png
http://science.nasa.gov/media/medialibrary/2009/03/31/01apr_deepsolarminimum_resources/irradiance_strip.jpg
Thus all of the “literature” references these measurements, e.g. the paper “A new, lower value of total solar irradiance: Evidence and climate significance” by Kopp and Lean, 2011, GEOPHYSICAL RESEARCH LETTERS:
“The most accurate value of total solar irradiance during the 2008 solar minimum period is 1360.8 ± 0.5 W m−2 according to measurements from the Total Irradiance Monitor (TIM) on NASA’s Solar Radiation and Climate Experiment (SORCE) and a series of new radiometric laboratory tests. This value is significantly lower than the canonical value of 1365.4 ± 1.3 W m−2 established in the 1990s, which energy balance calculations and climate models currently use. Scattered light is a primary cause of the higher irradiance values measured by the earlier generation of solar radiometers in which the precision aperture defining the measured solar beam is located behind a larger, view-limiting aperture. In the TIM, the opposite order of these apertures precludes this spurious signal by limiting the light entering the instrument. We assess the accuracy and stability of irradiance measurements made since 1978 and the implications of instrument uncertainties and instabilities for climate research in comparison with the new TIM data. TIM’s lower solar irradiance value is not a change in the Sun’s output, whose variations it detects with stability comparable or superior to prior measurements; instead, its significance is in advancing the capability of monitoring solar irradiance variations on climate-relevant time scales and in improving estimates of Earth energy balance, which the Sun initiates.”
http://www.agu.org/pubs/crossref/2011/2010GL045777.shtml
How did you arrive at an “average surface change” of “around 0.3W/m2 or 0.1% of the surface average total”? Can you cite a source to support this assertion? Does this “average surface change” take into account clouds?
Actually compared to molecular biology the climate system looks ridiculously simple. It’s relatively easy to figure out energy flows in the climate system as it all boils down to thermodynamic laws of physics (entropy flows). There are just a number of subtle influences that are poorly understood (like GCR flux), a smaller number of major influences that are poorly understood (such as clouds), and an unknown number of things that might effect outcomes that we are unaware of. The resulting interplay of knowns, partially knowns, and unknowns on a global scale yields an intractible problem to solve. The best predictions remain in the realm of climatology i.e. past patterns used as predictors of future patterns.
Molecular biology is like climate science on steroids (pun intended) because in that realm it isn’t all just simple entropy flow but rather a hideously complex information system driving chemistry which keeps normal entropy flow in check long enough for the system to reproduce itself. Evidently it’s quite successful at defeating entropy if one accepts the notion that every living cell today has an unbroken lineage dating back to cells that were alive a few billion years ago. Perhaps the largest problem confronting molecular biology is why any of us are alive to think about it. Genetic entropy eventually kills all individuals if something else doesn’t kill them first. It eventually kills all species as well. Most cell lines eventually die off after an average of about 10 million years. The mystery is in how some rare cell lines manage to periodically reset the damage done by genetic entropy and thus persist for billions of years. Every cell in your body is one of those rare lineages that managed to reset the timer on the genetic entropy bomb. Every living cell on the planet is one of those rare few.
justthefactswuwt
PDO and ENSO indices are the ‘highly correlated’ ones.
Above quoted Dr Mantua also states:
At the time of this writing, causes for (and predictability limits of) the PDO are not known. What is known is that the nature of the mechanisms giving rise to the PDO will determine whether or not it is possible to make decade-long PDO climate predictions.
http://www.atmos.washington.edu/~mantua/REPORTS/PDO/PDO_cs.htm
In my investigations I found a natural process (not climate dependent) operating in the general area of the North Pacific, with a reasonable correlation to the PDO
http://www.vukcevic.talktalk.net/PDO.htm
with power and ability to affect ocean currents and atmospheric pressure. In its nature it is an exact equivalent of the process driving NAO (N.Atlantic Oscillation)
http://www.vukcevic.talktalk.net/NAO-.htm